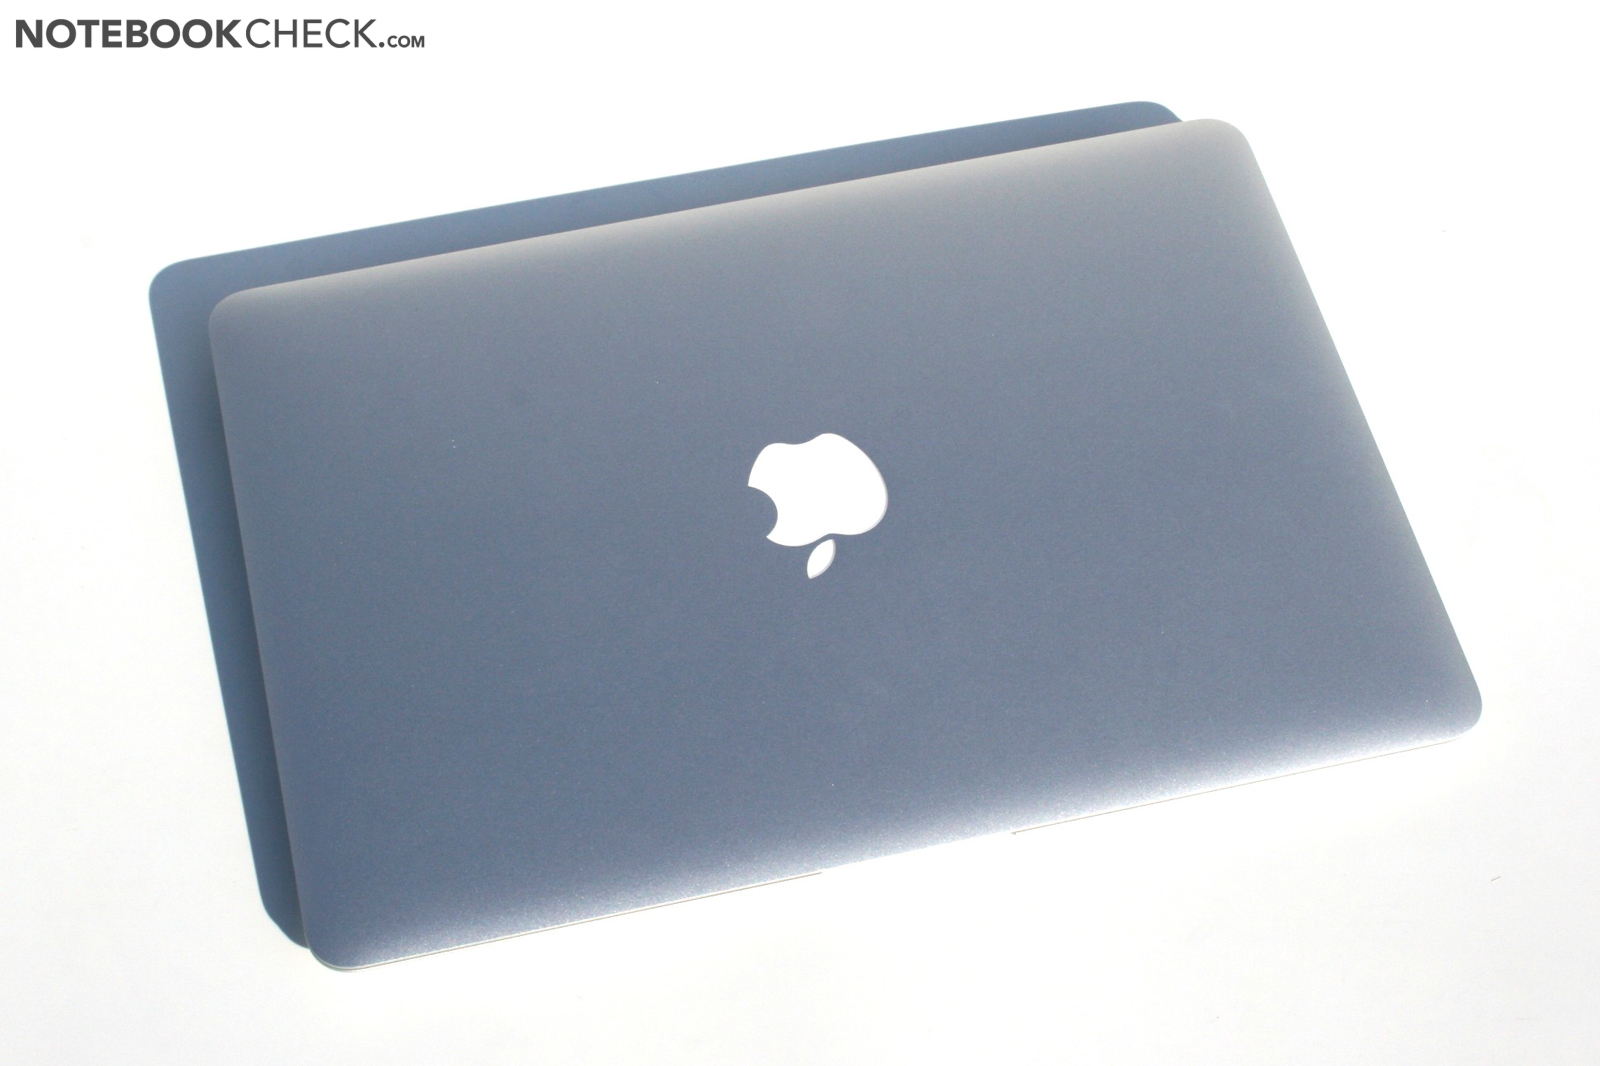
Review Apple MacBook Air 13 Mid 2011 (1.7 GHz, 256 GB SSD) Subnotebook
When the 2010 MacBook Air models were introduced, Apple was bombarded with criticism for sticking with out-of-date Intel Core 2 Duo technology (ULV) while Intel’s brand-new Core processors were already available. Instead, Apple relied on the Geforce 320M GPU, at the time a relatively powerful graphics card.
It’s still a dual-core ULV CPU that is being used, but the MacBook Air is now available with two processors from the latest Intel Core i portfolio, which should provide a sizable increase in processor performance. It’s a different story, however, when it comes to the graphics solution. Nvidia’s Geforce 320M has been taken out of service and replaced with the Intel HD Graphics 3000, integrated into the CPU.
We are interested in how much the new platform will improve performance, and whether it could actually be a step backwards in terms of graphics. Can the Intel CPU still use its Turbo powers to full effect in this slimline case, particularly as Apple is always at great pains to keep the system noise to an absolute minimum?
As Apple has not changed anything about the case itself or the input devices (other than minimal adjustments to the labelling for Lion, and restoring the sorely missed keyboard backlighting), we refer you to our existing review of the Apple MacBook Air from autumn 2010.
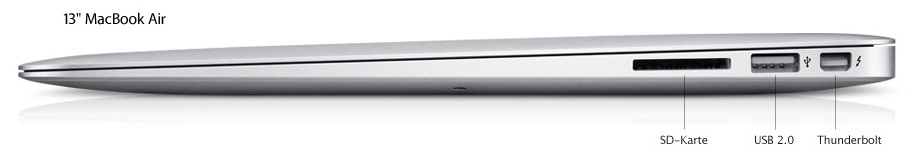
Connectivity
Goodbye DisplayPort, hello Thunderbolt. Although not quite, because to be accurate the Thunderbolt functionality has been added to the identical Mini DisplayPort. And this is really the only important change in the area of connectivity.
What is Thunderbolt? It is a universal port which was originally developed by Intel and Apple under the codename ‘Light Peak’. As the codename suggests, it originally relied on an optical transfer of data. For cost reasons, however, they have fallen back on conventional copper wiring for the time being. Despite this, Thunderbolt is supposed to surpass the possible transfer rates of the current USB 2.0 connections by quite some way (10 GBit/s), allowing it to be used as a connection for high-resolution image reproduction devices.
But looking at the details, the performance-orientated user will have to put up with certain limitations with this system in the MacBook Air. The Air has a smaller Thunderbolt controller, which cannot even match the current MacBook Pros in terms of the transfer rates it can achieve (two bi-directional 10 GBit channels and a DisplayPort vs. four 10 Gbit and two DisplayPorts).
One minor snag with the whole exciting story: there is a distinct shortage of compatible equipment for the new Thunderbolt port. Apple does offer its own Thunderbolt-compatible 27-inch monitor, but this is not exactly what you’d call cheap, at around 900 Euros on average, even if it does simultaneously act as a kind of docking station, giving the Air access to numerous additional ports. You can expect more accessories to become available (e.g. external storage, FireWire or LAN from Sonnet), but very little is available at the present time.
Aside from that the integrated Intel HD Graphics 3000 is only able to control one additional external display. So this imposes certain limits on you, as far as a multi-monitor workplace is concerned.
Display
Even though the basic specifications which are given for this display do not seem to show any changes (LED 13.3”, 1440 x 900, 16:10, glossy), it’s worth taking a look behind the scenes. The chosen panel type LP133WP1-TJA3 (LG Philips) seems to differ only slightly from the one used in its predecessor that we reviewed (*A01).
But Apple would not be Apple, if the current Air had not been accompanied by several intense discussions, amongst other things about the type of display used. According to user reports, Apple has used two different panels in the current models. One of those is the LP133WP1, which is what we have in our review model, but the other which appears in numerous models is an LTH133BT01A03 made by Samsung. The MacBook Air 2010 previously tested by us also used a Samsung panel, though an earlier version (A01) which distinguishes itself from the new LG Philips panel through its somewhat better measurement results.
We measured a maximum brightness of 322 cd/m² in the central display area of our review model (LP133WP1-TJA3), while the average brightness is a good 277 cd/m². Overall these are respectable results, but compared to the screen in the previous model with its otherwise identical specs, the display lags behind somewhat (max. 333 cd/m², average 306.8 cd/m²).
| |||||||||||||||||||||||||
Brightness Distribution: 72 %
Center on Battery: 322 cd/m²
Contrast: 575:1 (Black: 0.56 cd/m²)
39.99% AdobeRGB 1998 (Argyll 3D)
58.3% sRGB (Argyll 3D)
38.71% Display P3 (Argyll 3D)
The display also lost some face when it came to the maximum contrast. Not to worry - at 575:1 the screen in our review model is still one of the best in its class, but it is a little behind its predecessor (640:1) in this respect.
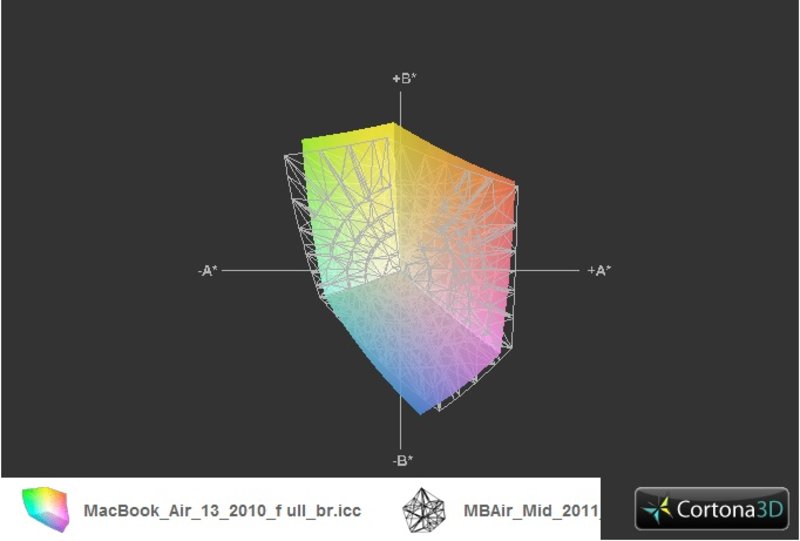
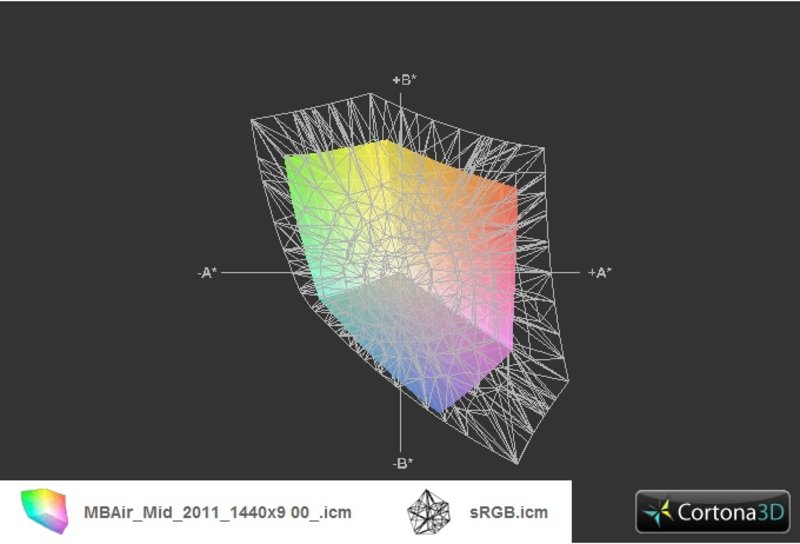
Time to take a look at the colour space that the screen can reproduce; this was not a particularly strong point for the previous model, which was only average in this regard. Our comparison of the colour spaces shows that the current LG panel is almost exactly on a par with the Samsung predecessor. As before, sRGB is largely unattained; the displays on the Pro series of MacBooks are still significantly ahead.
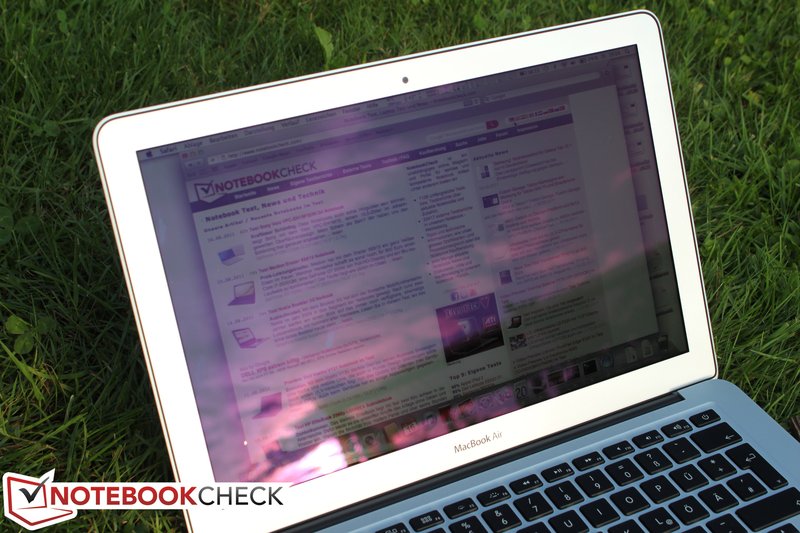
When it comes to use in the open air, not much has changed. The MacBook Air still offers good brightness and excellent picture contrast, but once again the glossy screen surface produces irritating reflections when the light falls on it unfavourably, or at certain viewing angles (despite the slight anti-glare coating which produces lilac-tinted reflections).
The range of viewing angles in our review model is a little better than the average for modern notebooks. Horizontally, you can certainly cope even with larger deviations from the ideal, front-on viewing angle, and it is reflections turning up on the screen, rather than inversion in the picture, that will get in the way first. For the vertical range of angles, the display shows slight changes to the picture, and you also have to reckon with a darkening or whitening of the screen.
To what extent the two display types which have been used for this model are different in terms of viewing angles could only be determined by a direct comparison side-by-side. But as the display type can only be read out by the system itself, and as no systematic approach has as yet been identified as to the distribution of the different panels, the display you get will in any case be a matter of chance.
* ... smaller is better
Performance
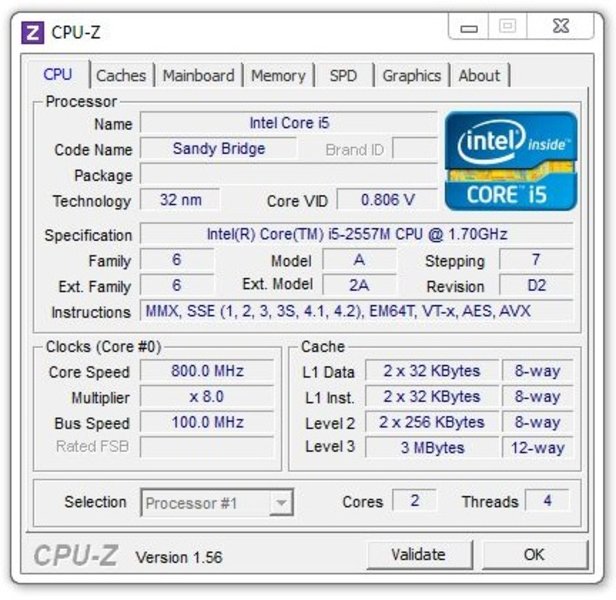
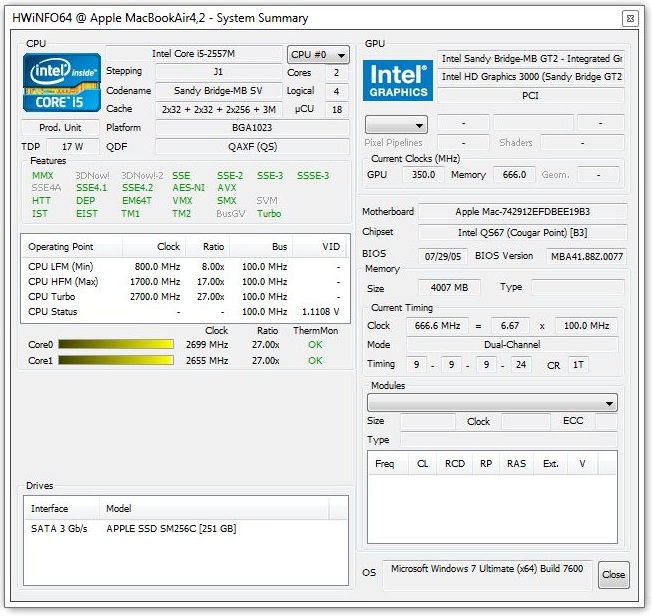
As we mentioned at the start, the biggest change to the MacBook Air compared to its predecessor has happened inside of the machine. As of now, Apple is using the latest Intel processors from the Core i range. To give the details, there is an Intel i5-2557M CPU with 1.7 GHz in the 13-inch Air (as used in our review model), with an alternative of the Core i7-2677M CPU with a 1.8 GHz base speed.
These are ultra low voltage processors with a comparatively low base clock rate and a thermal design power (TDP) of 17 W. To compare: the weakest CPU in Intel’s latest dual-core standard range, the i3-2310M, has a clock speed of 2100 MHz, though with a TDP of 35 W. However, because of the Turbo Boost function, the i5-2557M can reach speeds of up to 2.7 GHz as long as only one core is being used. If both cores are needed then the maximum speed is 2.4 GHz. So technologically speaking the ULV CPU can approach the performance of the entry-level processors in the standard range, and with considerably lower energy consumption.
The Sandy Bridge architecture contains a graphics solution called Intel HD Graphics 3000, which is integrated directly into the processor unit. But here the ULV system loses out, because the graphics unit is somewhat limited compared to its 35 W colleagues, with a base speed of only 350 MHz (650 MHz in 35 W CPUs) and a maximum of 1200 MHz with Turbo Boost (1100-1300).
CPU Performance
To definitively rank the power of the new Intel i5-2557M CPU, we turned to a series of benchmarks, the majority of which are admittedly based on Windows. Thanks to Boot Camp, however, running Windows on an Intel Mac is no longer a problem, and Apple’s drivers for Windows, by now very well adapted, make for an easy sideways leap.
In the tried and tested SuperPi benchmark (32 M) the 2557M CPU needed 763 seconds to calculate Pi to 32 million decimal places. A glance at our database shows dozens of notebooks with Intel’s 2410M i5 latest-generation mid-range CPUs in the immediate vicinity of this result. (For comparison: C2D SL9400: 1480 seconds, +50%).
In the multi-thread benchmark test wPrime (2.x) the 2557M CPU achieves 764.6 seconds, placing it by way of comparison on the same level as the i3-2310M CPU. Intel’s i5-2410M is on average almost 25% faster in this test. The SL9400 CPU in the Air predecessor needs 1379.9 seconds for this test, i.e. it takes about twice as long as the current 2557M CPU.
In the Cinebench R10 benchmark test made by Maxxon (1 x CPU, 64 Bit) the i5-2557M CPU scores 4201 points. With this result the processor remains just behind the main pack of i5-2410M CPUs (4450-4560 points). To compare: Intel’s SL9600 CPU (SL9400 in the MacBook Air predecessor) scores 2726 points in the same test (Thinkpad X200t), which is a lead of around 54% for the new 2557M CPU.
With 8266 points in the Cine R10 Multi-thread test, the 3557M CPU ranks on the same level as the older i5-460M Arrandale CPU. It is able to overtake the 2310M CPU by quite some way (7200 - 7600), but the i5-2410M CPU still remains a long way ahead with its 9300 - 9800 points.
Our final reference point is the Cinebench R11.5 CPU benchmark, with a result of 2.3 points. This is equivalent to the level of the i5-520M and 460M Arrandale processors. The 2410M CPU manages 2.5-2.6 points, with Intel’s i3-2310M scoring about 2.0 points. The Intel Core 2 Duo SL9400 CPU in the MacBook Air 2010 scored 1.1 points, so in this test too you can say that the processor performance is twice as good.
| Cinebench R10 | |
| Rendering Multiple CPUs 32Bit (sort by value) | |
| Apple Macbook Air 13 inch 2011-07 | |
| Samsung 900X3A | |
| Apple Macbook Air 13 inch 2010-10 | |
| Lenovo X121e-204562U | |
| Alienware M11x R3 | |
| Rendering Single 32Bit (sort by value) | |
| Apple Macbook Air 13 inch 2011-07 | |
| Samsung 900X3A | |
| Apple Macbook Air 13 inch 2010-10 | |
| Lenovo X121e-204562U | |
| Alienware M11x R3 | |
| Cinebench R11.5 - CPU Multi 64Bit (sort by value) | |
| Apple Macbook Air 13 inch 2011-07 | |
| Samsung 900X3A | |
| Apple Macbook Air 13 inch 2010-10 | |
| Lenovo X121e-204562U | |
| Alienware M11x R3 | |
Throttling
With the Turbo Boost feature, the Intel Sandy Bridge CPU is able to cope perfectly with short spikes in demand, and therefore make the best possible use of the system’s cooling power. But how well does this work in a wafer-thin machine which places low system noise near the top of its list of priorities? The first Apple MacBooks with the Sandy Bridge CPUs came in for some criticism as far as throttling was concerned.
In order to examine this issue in the latest Air, we turned once again to a combination of BootCamp Windows and MacOS. Of course most Air users will understandably not use Windows, but it does allow us to use a whole range of tools for testing purposes; they give us more detailed information about temperatures, CPU speed and the behaviour of the fans, but are unfortunately not available for MacOS.
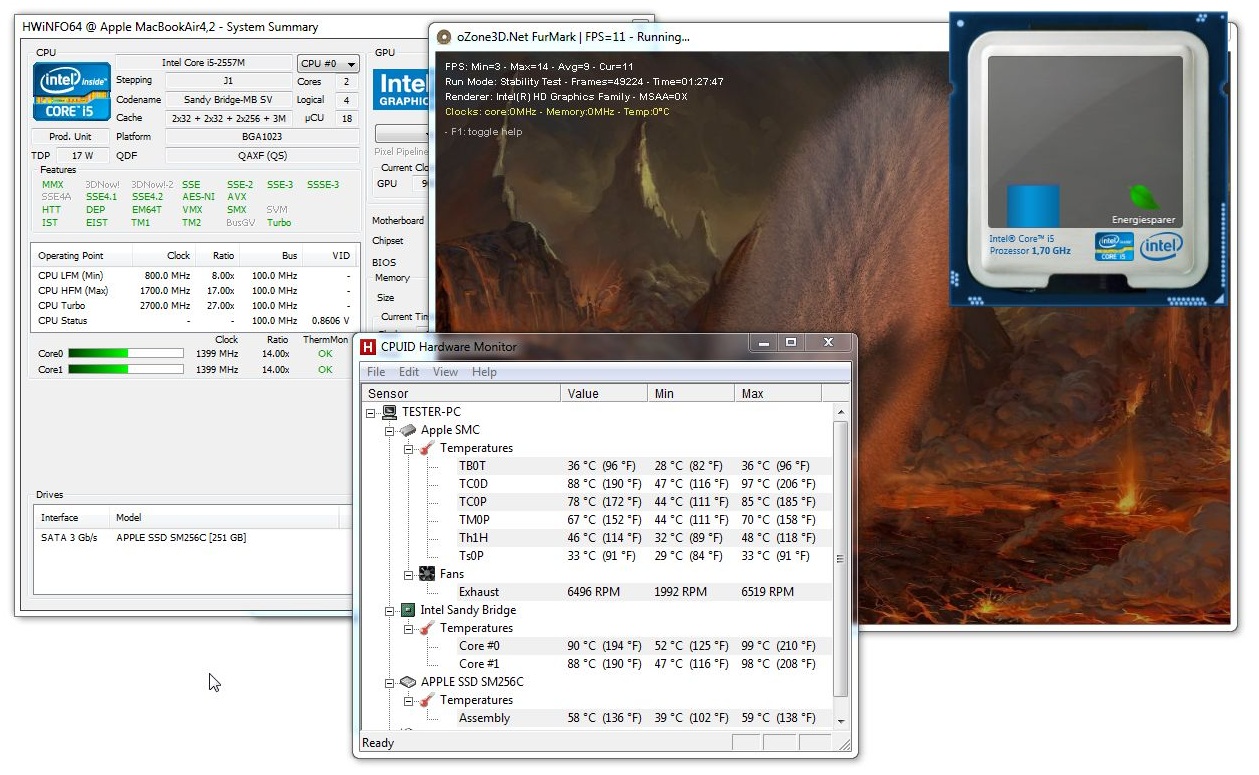
If you remember, the Intel i5-2557M used here is specified as having a 1.7 GHz base speed and a Turbo range of up to 2.7 GHz. Using HWInfo64 and the Intel Turbo Boost Monitor during normal use with Windows, we mostly observed 2.4 GHz with short bursts of up to 2.7 GHz; in other words it fell exactly within the bounds of the specification. We were not able to read out the clock speed in MacOS because of a lack of appropriate tools (the MSR tool did not work).
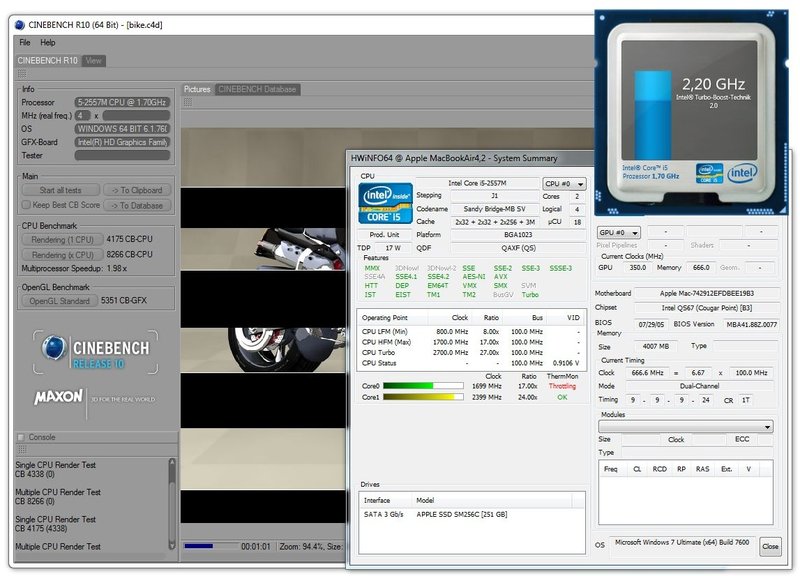
In the Cinebench R10 1x CPU rendering test (64 Bit) we observed 4338 points, with the clock speed staying between 2399 and 2655 MHz (according to HWInfo).
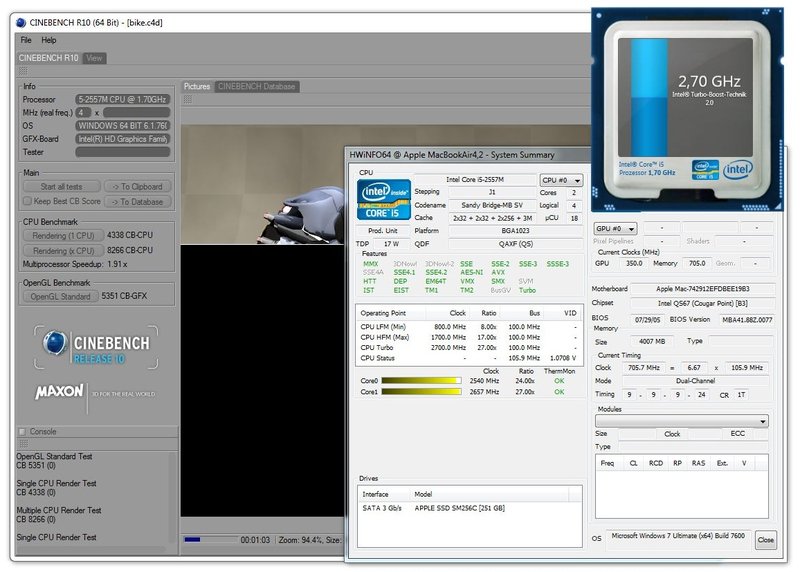
Our series of benchmarks from the multi-core rendering test were interesting: in the first run-through we reached a score of 7844 points, and the CPU speed was 2399 MHz for the majority of the time, but at the end of the test we read out a reduction in speed to 1699 and then a throttling down to 799 MHz. The core temperature was around 99°C according to HWMonitor, i.e. at the CPU’s high-temperature limit (TJ max). The fan speeded up relatively late at around the 95°C mark, until then running at the minimum level of 2000 rpm. Immediately following this we started further run-throughs of the same benchmark tests: 8076, 8624 and 8617 points were the results. The fan got successively faster and in the last two run-throughs stayed at the maximum 6500 rpm from start to finish. The result: throttling was no longer happening in the last two run-throughs, and the CPU speed remained constant at 2399 MHz, with the CPU temperature at 94-97°C according to HWInfo.
In the OpenGL benchmark of Cinebench R10, we observed a very similar pattern. We started at 4770 points and then successively scored 5023, 5056, and 5001 points. So is this a Windows issue, or a more general phenomenon, also occurring under MacOS? We next carried out Cinebench R10 for MacOS, and watched the core temperatures and the fan speed (iStatMenus). We started the 1x CPU rendering test at a temperature of 50/52°C. At around 96°C the fan came on with MacOS X. The test score: 3621 points. We immediately followed this with the second run-through; the fan was already running, allowing the temperature to be kept below 93°C. The result: 3645 points. We forced to fan up to its maximum speed (SMCFancontrol) and ran the test again: this time 3634 points.
Then we also performed the multi-core test while running MacOS. Starting from cold, the first result was 7679 points, with the temperatures climbing as high as 98°C. The next run-through gave us result number 2: 7477 points, with the temperatures staying more or less at 98°C (according to iStatMenus), and the fan speed continually increasing. Result 3: 7666 points; result 4: 7703 points; and result 5: 7715.
We manually set the fan to the maximum speed and started benchmarking again: 7741, 7747, and 7709 points. These results are around 3.6% higher than during the ‘critical’ second run-through. The CPU temperature during this did not exceed 86-88°C.
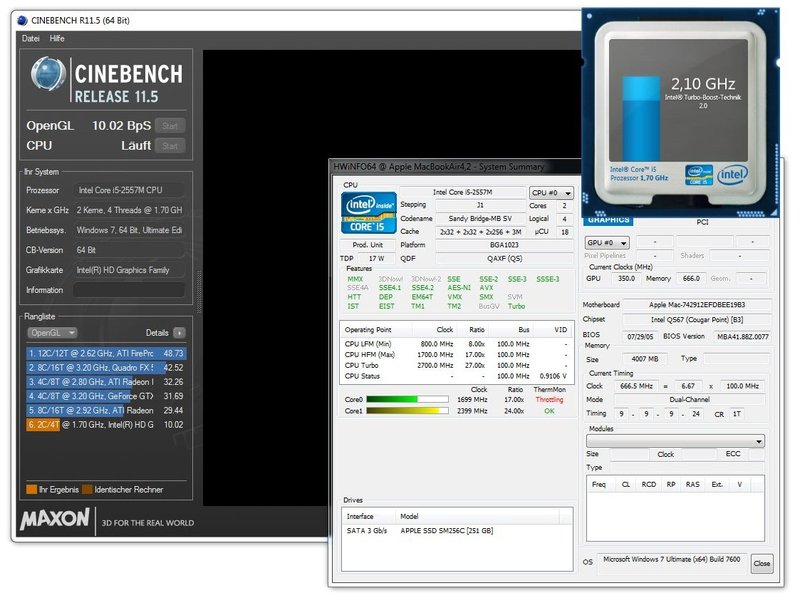
In the Cinebench R11.5 test, which also puts a load on all threads of the CPU, we measured 2.1 points in the first run-through under Windows. During this we could observe a short period of throttling down to 799 MHz according to HWInfo64 (temperature at 99°C). The test directly following this clearly showed less throttling phases, and gave a result of 2.2 points. We tested again with the fan on maximum: 2.25 points, and a core temperature not exceeding 85°C.
Running MacOS the temperature during the first run-through quickly hit the 99°C mark, and only then did the fan start up. Result number 1: 2.13 points. We tested again with the maximum fan speed: 2.26 points, and a CPU temperature under 91°C. In the OpenGL test, a similar pattern of behaviour was observed under both Windows and MacOS.
Conclusion:
The CPU seems to reach critical temperatures faster than the fan can lower them, whether using Windows or MacOS, and particularly during the multi-thread benchmark test. More than anything else this is caused by the sluggish fan control system, which only intervenes once extremely high temperatures have been reached, in order to keep the machine almost silent for as long as possible. For the best results you have to have ‘warmed up’ the MacBook Air, as it were; that is to say, once the fan is already active, the throttling threshold can be avoided. So the MacBook Air’s cooling capacity is mostly sufficient for you to fully exploit the power of the i5-2557M CPU, apart from this threshold situation, which actually only causes a low, single-digit percentage reduction in performance, and only for a short while. This was true for MacOS as well as Windows via Boot Camp, according to our observations.
Application Performance Under Windows
For the classic PCMark benchmarks we again have to switch over to Windows. Despite this the MacBook Air 2011 scores impressively here: 10,342 points in the PCMark Vantage test. The laptop’s solid state drive (SSD) is largely responsible for this, with its advantage over a conventional hard drive bringing the HDD subscore up to a high 26,992 points. According to our database, the only machines to perform better than this are a few multimedia/ business and gaming hot-shots with powerful Sandy Bridge processors and dedicated graphics cards, in each case also equipped with an SSD.
Samsungs classy 13-inch 900X3A is around 15% behind here, with the MacBook Air 13 from 2010 lagging by around 50%.
And the new MacBook Air doesn’t do any worse in the latest PCMark 7 test, quite the opposite in fact: 3561 points puts it at number 5 in our ‘never-ending league table’ of all database entries to date. From the top we have the Alienwares M18x, followed by the Schenker P501 PRO, the Fujitsu Celsius H710, the Alienware M14x, and as of now, the MacBook Air 13. Respect!
| PCMark Vantage Result | 10342 points | |
| PCMark 7 Score | 3561 points | |
Help | ||
3D Performance
How does the integrated Intel HD Graphics 3000 system measure up, especially in relation to the faster solution in the normal Sandy Bridge processors (not ULV) and also in relation to the Geforce 320M graphics unit in the previous Air? We first take a look at the synthetic benchmarks from Futuremark.
In the 3DMark 2006 test our review model scored 3808 points in the standard resolution of 1280 x 1024 pixels. Intel’s HD Graphics 3000 units with the normal speed reach scores of between 3000 and 5000 points in this test, depending on the laptop model. Because of the Turbo feature which is also present in the graphics unit, the result is dependent on the cooling power of each review machine, amongst other things. The CPU performance also plays an important role in the 3DMark 2006 test. Systems with Intel's 2310M CPU are spread from about 3000 to 3500 points, while i5-2410M systems with the Intel HD Graphics 3000 solution generally fall more into the region between 3500 and 4500 points. In this respect the i5-2557M ULV CPU with its somewhat restricted integrated graphics certainly does a good job of keeping up, taking a mid-ranking position here.
Fears of a certain drop in performance compared to the Geforce 320M turn out to be justified: Apple's MacBook Air 13 from 2010 scored 4222 points in the same benchmark, which is 11% better, despite the SL9400 ULV CPU being only about half as powerful as the new i5 CPU according to the tests we carried out. The 11-inch MacBook Air from 2010 with a SU9400 CPU scores 3824 points in the same test, which puts it on practically the same level as the new 13-inch machine.
In the more up-to-date 3DMark Vantage test, the CPU performance is pushed into the background while pure graphics performance is brought to the fore. With 1712 points, our new 13-inch Air just beats the 11-inch Air from 2010 (1694), but Apple's MacBook Air 13 from 2010 remains just ahead with 1836 points; however, the advantage has shrunk to only 7%. We have reviewed numerous other systems which perform at a similar level, equipped with Intel 2410M, 2520M and even with 2620M processors. In practice it is not really possible to discern a significant difference in performance between the ULV processors and the conventional ones.
| 3DMark Vantage | |
| 1280x1024 P CPU no PhysX (sort by value) | |
| Apple Macbook Air 13 inch 2011-07 | |
| Apple Macbook Air 13 inch 2010-10 | |
| 1280x1024 P GPU no PhysX (sort by value) | |
| Apple Macbook Air 13 inch 2011-07 | |
| Apple Macbook Air 13 inch 2010-10 | |
| 1280x1024 P Result (sort by value) | |
| Apple Macbook Air 13 inch 2011-07 | |
| Apple Macbook Air 13 inch 2010-10 | |
| 3DMark 06 Standard Score | 3808 points | |
| 3DMark Vantage P Result | 1712 points | |
Help | ||
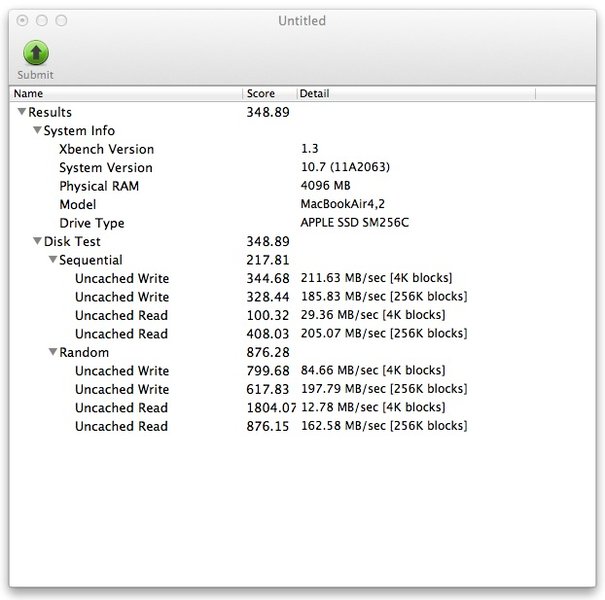
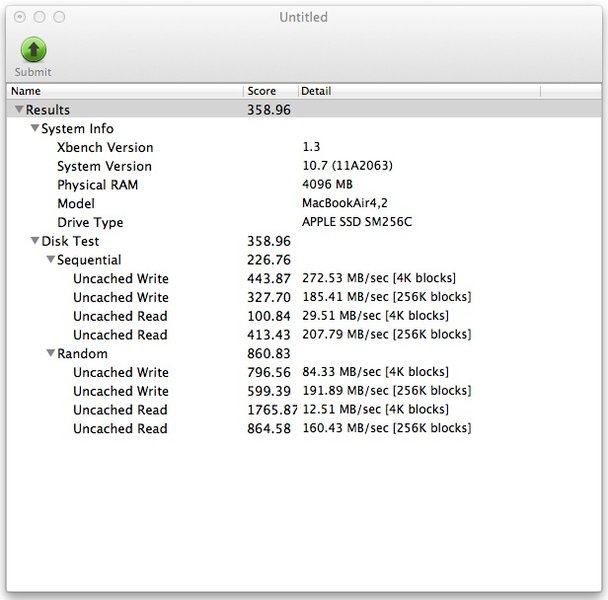
XBench 1.3 with Mac OS X
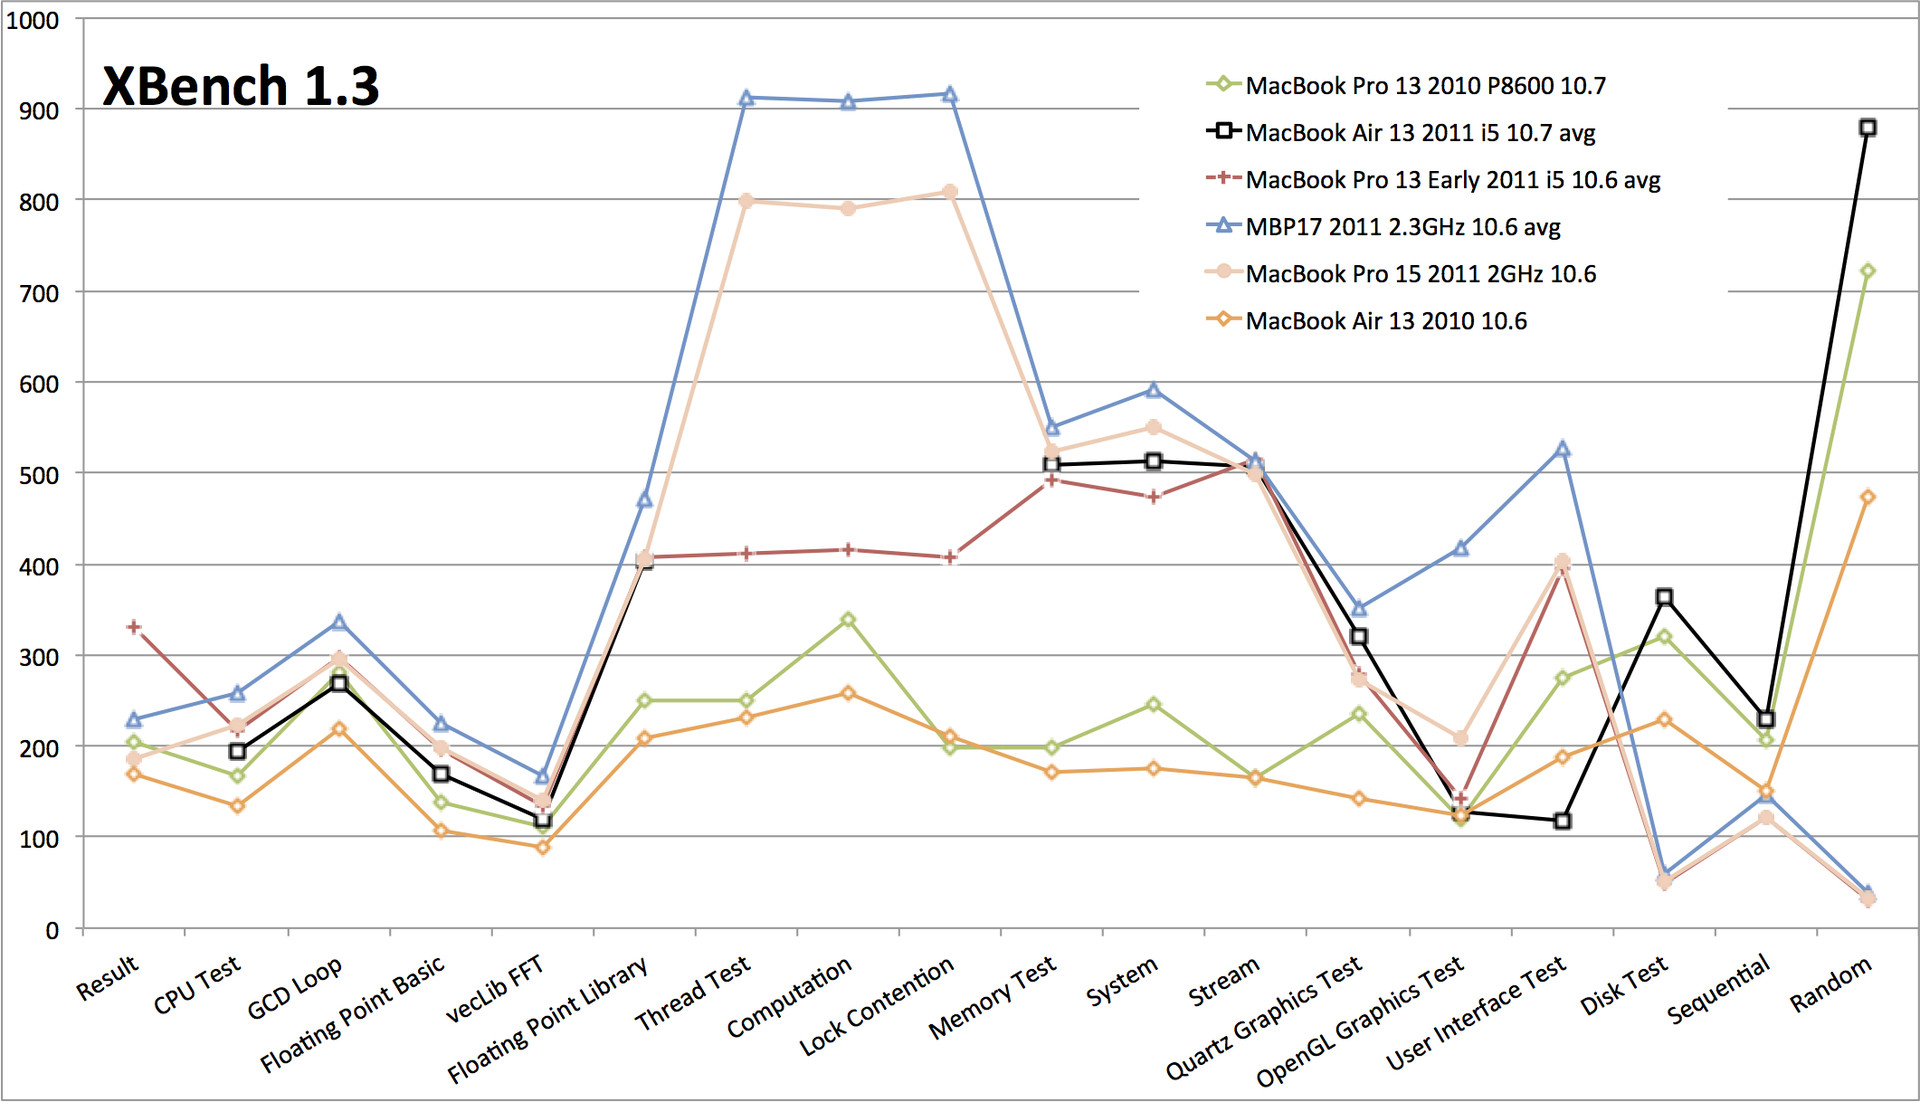
Since Mac OS X 10.7 the ancient XBench test is sadly only partially useable. For example, our review model always got stuck whilst running the thread test; we had to abandon this one and several others. The 13-inch MBA had to line up against the current MBP 13, 15 and 17 (although still with Mac OS X 10.6), an older MBP 13 with Core 2 Duo, Lion and the latest Intel 320 SSD, and of course the old MacBook Air from 2010 as well (also with Mac OS X 10.6). The result in comparison to the 2010 model is overwhelming; it hoists itself up the level of the entry-level MacBook Pro 13. Only in the user interface test is it markedly slower (on the level of the machine with Geforce 320). The quad-core models in the 15- and 17-inch MacBook Pros, however, are still much faster.
The 13-inch Air also scores highly in the disk test, finishing just ahead of the Intel 320 SSD and leaving the old 13-inch Air a long way behind it.
Geekbench
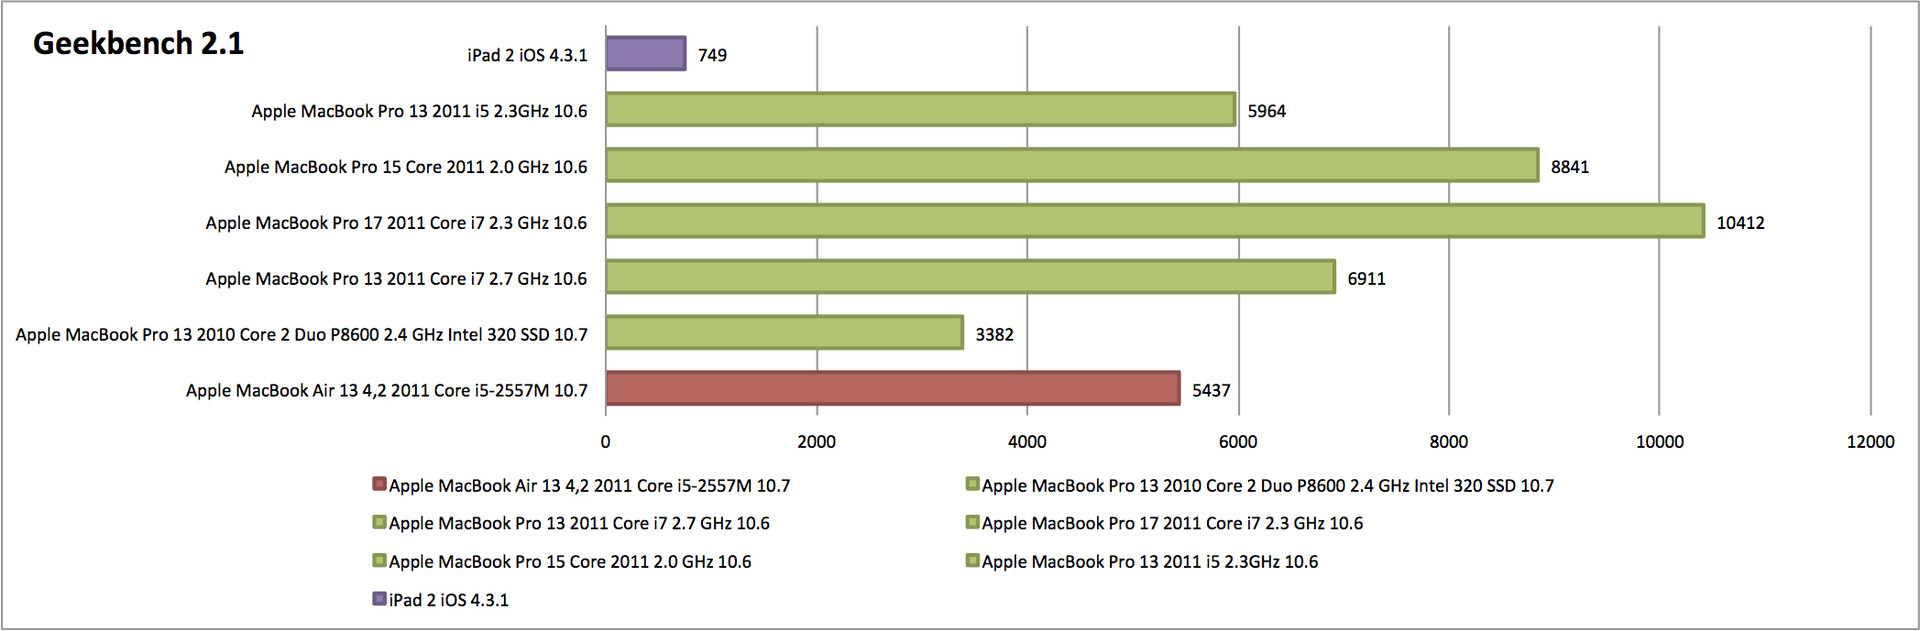
In the Geekbench benchmarking test, our Air remained just behind the MacBook Pro 13 from 2011 (2.3 GHz), positioning itself on about the same level as the 2010 MBP 15 and 17 with Intel Core i7-620M 2.7 GHz. The old 2010 Air with its 1.9 GHz Core 2 Duo scored only 2678 points, only 49% of the CPU performance.
SSD Performance
Whilst most other manufacturers are still very reserved on the subject of solid state drives, Apple has long recognised their advantages; the silent and absolutely shock-resistant drives have been used in the Air series for generations.
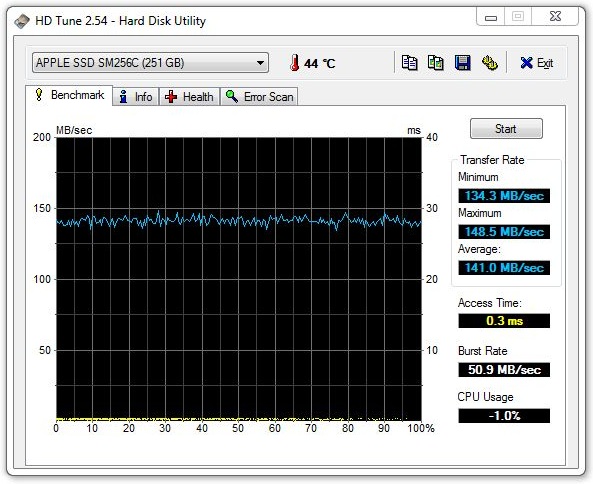
The MacBook Air 13-inch 2011 is available with either a 128 GB or a 256 GB SSD. For the larger capacity you have to cough up around 200 Euros extra. As with the display, it seems that the hard drives integrated into these current machines can be of differing makes and unfortunately also different standards of performance. Our review model comes with the 256 GB version (SM256C) which is apparently manufactured by Samsung.
The counterparts by Toshiba which are also used in these models (TS128C/TS256C -128 GB/ 256 GB) are a little slower according to some reports.
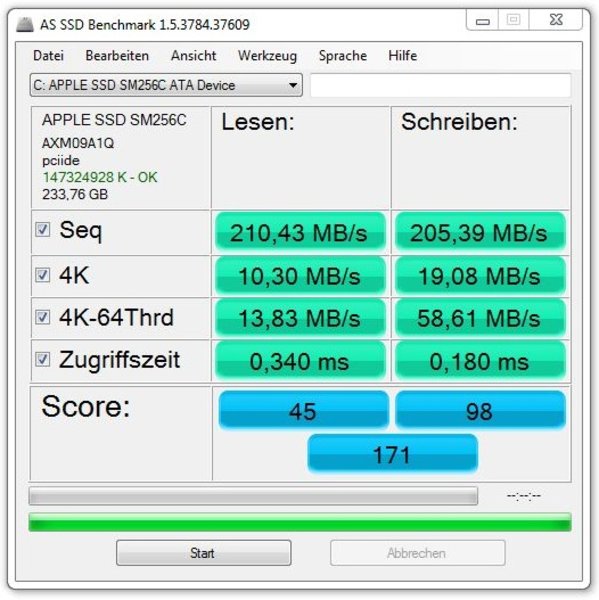
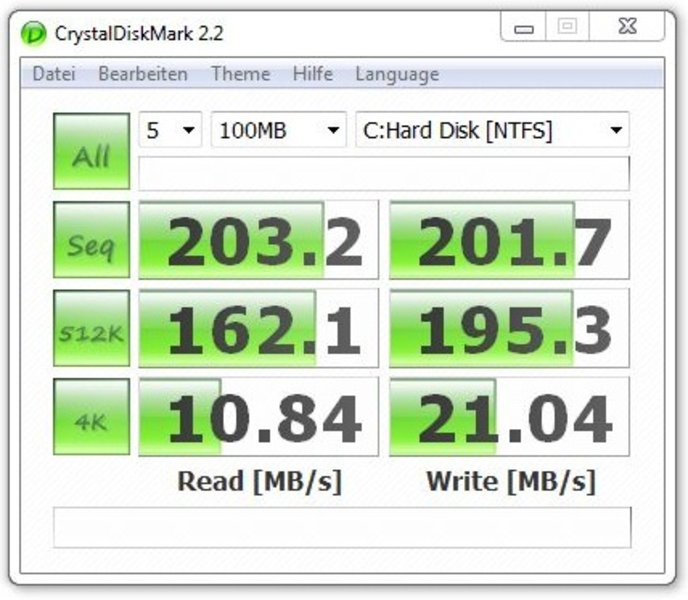
In the ASSSD benchmark test, the SM256C drive in our review model managed 210 and 205 MB/s in the sequential read/ write test respectively. Xbench gives a result of around 205 and 185 MB/s in the sequential read/ write test (256 K), with the usual outliers duly noted. The Toshiba equivalent reached speeds of up to 195/ 160 MB/s (read/ write, sequential 256 K) according to posts from users in some forums. This would be an advantage of 5-15% for the Samsung drive, though one should bear in mind the usual spread of data from XBench.
But compared to the Intel Series 310 or the OCZ Vertex 2, the SSD used here lags noticeably behind, particularly in the 4K blocks test. Brand-new products like the Intel Elmcrest SSDs or the OCZ Vertex 3 for example, are a long way ahead.


Emissions
System noise
Anything other than virtually silent running for most of the time would probably be unacceptable for the Air’s target audience. Apple manages to pull off this feat again for the new MacBook Air with i5-2557M, despite it having double the processing power. The fan never switches off entirely (MacOS and Windows), but it runs at 2000 rpm and can only be heard if you press your ear to the machine. Only through intensive benchmarking could we force the fan into more audible realms. In practice this will probably only happen during longer conversion tasks or video editing. During less demanding office use, you should have a practically silent machine the whole time.
When the fan reached its maximum speed of 6500 rpm during the stress test, we measured a high volume level of 46.3 dB(A). But other than in our extreme load scenario which is not a realistic test, we did not reach this level during our practical testing.
* ... smaller is better
Noise level
| Idle |
| 28.4 / 28.4 / 28.4 dB(A) |
| Load |
| 40.1 / 46.3 dB(A) |
 | ||
30 dB silent 40 dB(A) audible 50 dB(A) loud |
||
min: | ||
Temperature
In idle whilst running MacOS, we measured a maximum of 32.4°C on the top side of the base unit and 30.8°C on the underside. The palm rests remained below 30°C. Measuring the same things whilst running Windows did not produce any notable changes: the top side maximum was 32.7°C, the underside 31.2°C.
In the stress test under Windows (Furmark + Prime95) we drove the case temperatures up to as high as 44.4°C in the area of the air vent above the keyboard, and 43.3°C on the underside of the notebook. We noticed a concentration of heat towards the back of the laptop, where all the components related to cooling are housed. The palm rests stayed at an acceptable temperature of around 33°C.
In an improvised stress test for MacOS (terminal - yes, Cine. R11.5 OpenGL test in loop) we produced results that were practically identical to the ones from idle use. Here too, the temperature gain of the palm rests remained unproblematic at just under 30°C.
(±) The maximum temperature on the upper side is 44.8 °C / 113 F, compared to the average of 35.9 °C / 97 F, ranging from 21.4 to 59 °C for the class Subnotebook.
(±) The bottom heats up to a maximum of 43.3 °C / 110 F, compared to the average of 39.2 °C / 103 F
(+) In idle usage, the average temperature for the upper side is 29.3 °C / 85 F, compared to the device average of 30.8 °C / 87 F.
(+) The palmrests and touchpad are reaching skin temperature as a maximum (33.5 °C / 92.3 F) and are therefore not hot.
(-) The average temperature of the palmrest area of similar devices was 28.2 °C / 82.8 F (-5.3 °C / -9.5 F).
Battery life
Performance alone would definitely not be enough for an ultra-mobile device like the MacBook Air. To achieve the required battery life, the energy consumption must be right above all else. With a minimum of 6.0 W in idle use running Windows, the new Air is a touch more frugal than its predecessor (6.9 W). Under heavy use the Air allows itself up to 48 W (stress test), a little more than the Air 2010 with Core 2 Duo CPU.
As usual the results look a little better under MacOS. In idle the MacBook Air only needs between 5.5 and 10.6 Watts. With heavy use in the simulated Apple stress test (terminal - yes, Cine. R11.5 OpenGL) we measured a maximum of 33.2 Watts.
Also, in the battery benchmark test of Cinebench R11.5 we measured no notable deviations in the results, i.e. all of the Air’s processing power is available in battery mode too.
| Off / Standby | |
| Idle | |
| Load |
|
Key:
min: | |
In the standardised battery life test by Battery Eater (Windows) the new MacBook Air reached 417 minutes, or almost 7 hours, in the Reader’s test (min. display brightness - level 2, WLAN & BT off, energy-saving profile, keyboard backlighting off). The Air’s predecessor from 2010 managed almost 30 minutes more in this test. In the heavy-use scenario of the ‘Classic’ test (max. display brightness, wireless module on, high-performance profile selected) we recorded 89 minutes, so around an hour and a half. In this test too, the 2010 Air was a little more mobile, lasting just over 2 hours.
The readings we observed when running MacOS stood in contrast to these results. In our improvised reading test (altering a long page of text in a browser window via WLAN, brightness level 2, no time-out) the new Air lasted for a whopping 660 minutes, which is 11 hours (maximum battery life you can expect). This is just under an hour less than the previous model. In the extreme stress scenario (terminal - yes, Cine. R11.5 OpenGL), i.e. with heavy use of the CPU and graphics unit, the Air holds out for around 2 hours.
For a realistic everyday run time, we can turn to the WLAN surfing scenario. Running MacOS you can expect a battery life of around 310 minutes, so a little over 5 hours, when you have maximum screen brightness and a moderate amount of Flash content on the web pages you’re looking at. In this respect the new Air is at roughly the same level as its predecessor.
Verdict
Overall there is not much new to report about the latest MacBook Air, and that is a good thing. The chassis, input devices and display remain more or less unchanged, or have been subject to small upgrades like the introduction of keyboard backlighting and the Thunderbolt port.
The hardware refresh inside the MacBook Air is definitely something to be pleased about. The Intel Core i ULV CPU which has been used is now finally up-to-date, and is a perfect match for this slim, mobile notebook. The available processing power is roughly double what it was, while the graphics remains at about the same level as the previous machine with its Nvidia GPU.
The increase in performance that Apple has implemented is all the more impressive because the laptop’s emissions remain in the green zone as before. This is true of the surface temperatures as well as the almost silent running during everyday office use. The battery life also remains more or less at the good level of the previous model.
One of the few possible criticisms remaining is the reflective display, but it can definitely be used outdoors thanks to its good brightness and contrast, as well as a special surface coating. The usefulness or uselessness of the Thunderbolt port is also a subject for debate; it is certainly a very powerful port, but there are currently very few options to use with it. There’s only one thing you can do here - wait and see.
As an overall package the MacBook Air remains an outstanding subnotebook with first-class input devices and an aluminium unibody case which is still unrivalled in its design and build quality. However, as Apple uses powerful components throughout like the ULV processor and solid state drive, the price for the Apple MacBook Air 13 starts at a hefty 1200 Euros.