

Microsoft Surface Pro 9 review: Convertible now with significantly more CPU power
Microsoft has made several changes to its Surface products, as the previous Surface Pro X ARM tablet is no longer a stand-alone product and will henceforth be continued under the name Surface Pro 9. This means there are now two variants of the Surface Pro 9, namely one with a regular Intel processor (from US$989,00) and the other with an ARM chip (US$1357,12), which also supports 5G connectivity. We will also review the new ARM variant with the Microsoft SQ3 Adreno 8CX Gen3 soon, but the Surface Pro 9 with its Alder Lake-U processor is our first test subject for today.
Our review sample is the top CPU variant with a Core i7 1255U, 16GB of RAM and 512 GB PCIe-SSD. In this configuration, the convertible costs US$1.879,99, although you have to factor in another ~US$300 for the Signature Keyboard and the Surface Slim Pen 2. A number of online retailers (depending on your location) may offer such bundles at cheaper prices - our bundle, for example, is available from EUR 2130 (~US$2320). Another change concerns the business version of the Surface Pro 9, which is also no longer available with a WWAN module in the Intel variant.
Aside from the new Alder Lake processor, the updated WLAN module and the removal of the audio jack, there are no major technical changes, neither to the Surface Pro itself nor the input devices. For further information, we refer to our reviews of previous Surface Pro models:
Possible Competitors in Comparison
Rating | Date | Model | Weight | Height | Size | Resolution | Price |
|---|---|---|---|---|---|---|---|
| 88.4 % v7 (old) | 01 / 2023 | Microsoft Surface Pro 9, i7-1255U i7-1255U, Iris Xe G7 96EUs | 877 g | 9.3 mm | 13.00" | 2880x1920 | |
| 90.1 % v7 (old) | 11 / 2022 | Dell XPS 13 9315 2-in-1 Core i5-1230U i5-1230U, Iris Xe G7 80EUs | 764 g | 7.4 mm | 13.00" | 2880x1920 | |
| 88.5 % v7 (old) | 04 / 2021 | Lenovo ThinkPad X12 20UVS03G00 i7-1160G7, Iris Xe G7 96EUs | 1.1 kg | 14.5 mm | 12.30" | 1920x1280 | |
| 90.3 % v7 (old) | 12 / 2022 | HP Elite Dragonfly Folio 13.5 G3 i7-1265U, Iris Xe G7 96EUs | 1.4 kg | 17.8 mm | 13.50" | 1920x1280 | |
| 91.8 % v7 (old) | 11 / 2022 | Apple iPad Pro 12.9 2022 M2, M2 10-Core GPU | 682 g | 6.4 mm | 12.90" | 2732x2048 | |
| 86.8 % v7 (old) | 03 / 2022 | Asus ROG Flow Z13 GZ301ZE i9-12900H, GeForce RTX 3050 Ti Laptop GPU | 1.2 kg | 12 mm | 13.40" | 1920x1200 |
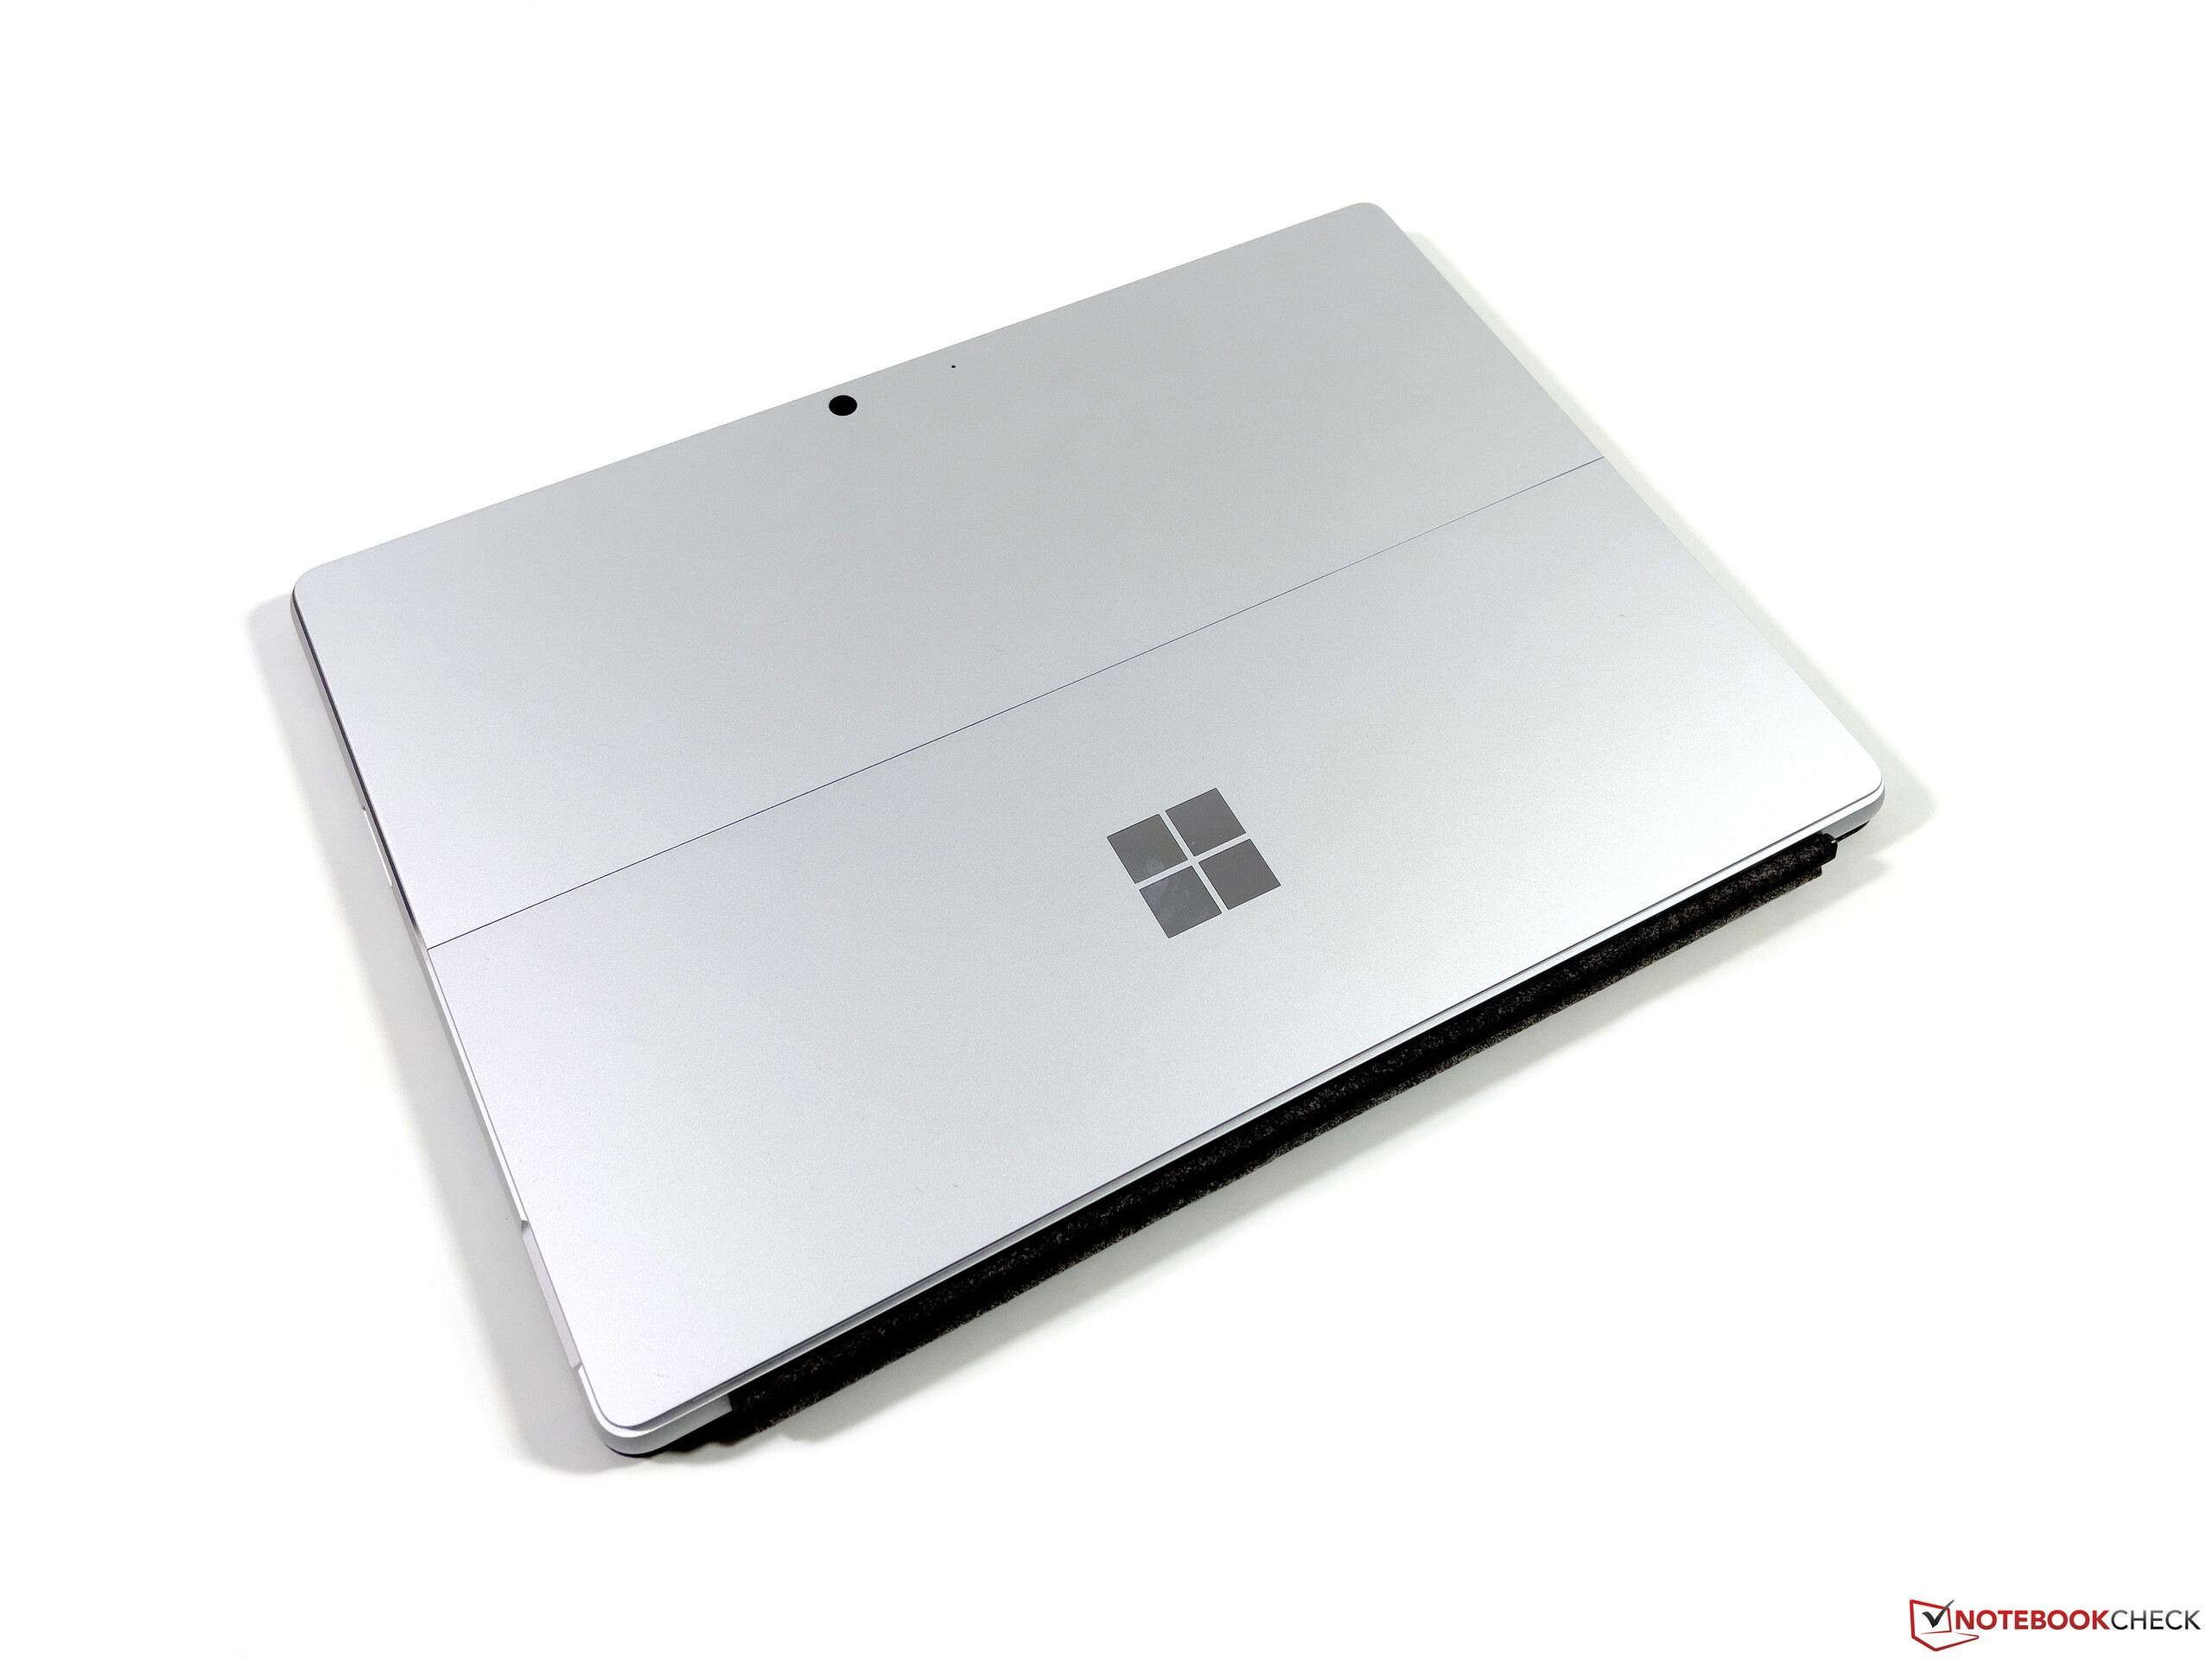
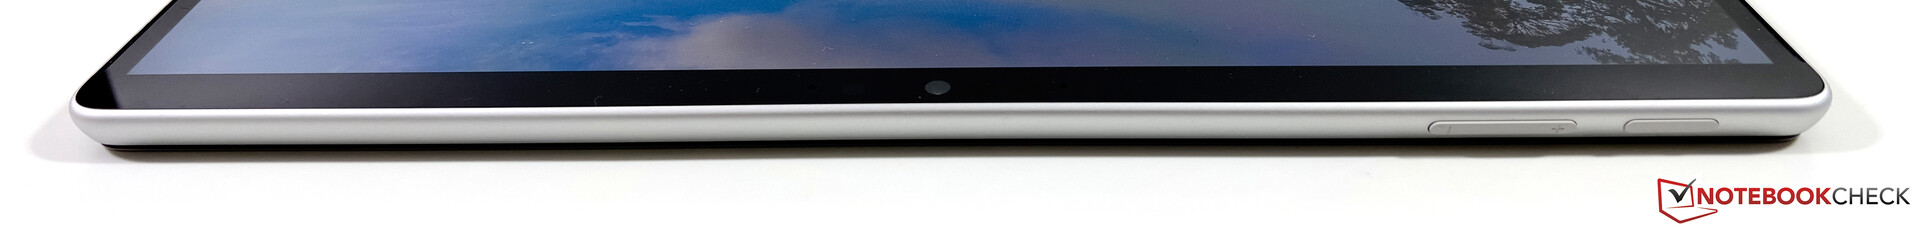
Case - Minor changes to the convertible
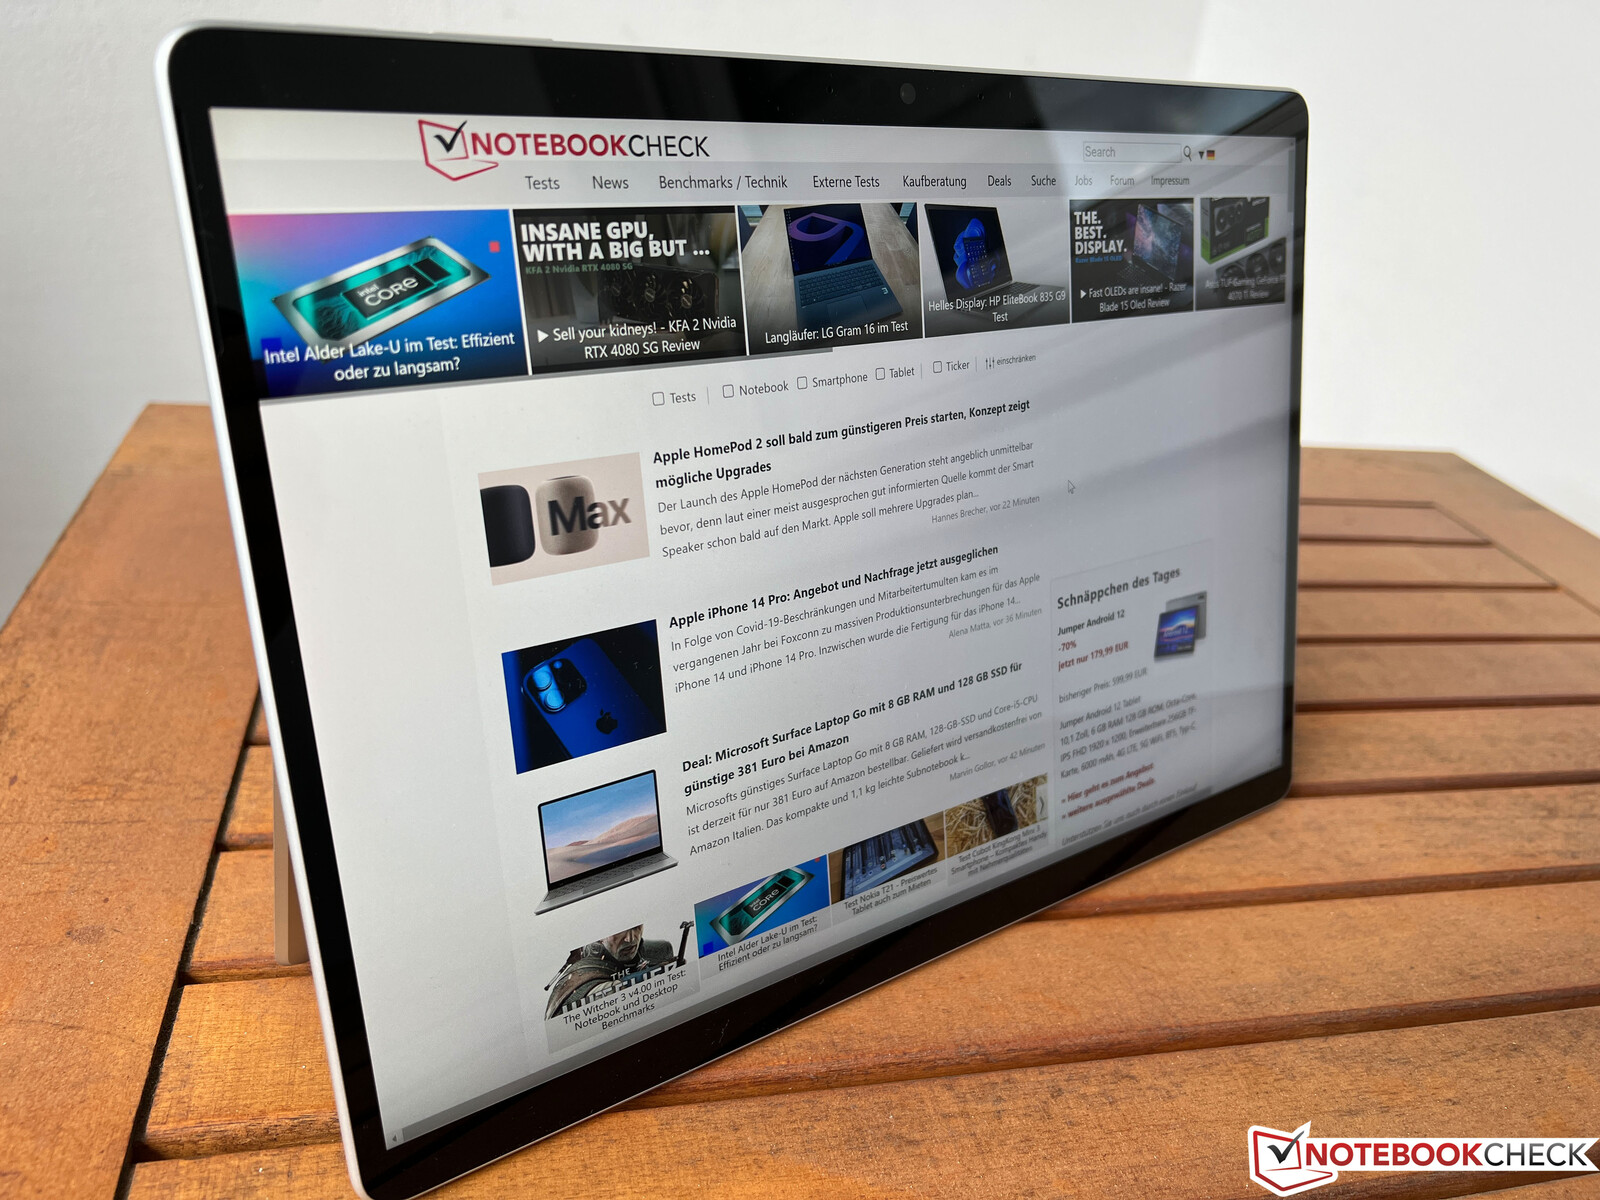
Upon first glance, nothing has changed about the case of the Surface Pro 9, aside from the new arrangement of the ports. The weight differs slightly, so there likely have also been minor changes to the internal layout. Microsoft offers the convertible in four different colors, ranging from the silver (platin) of our review device, sapphire blue, forest green to graphite (dark grey). Contrariwise, the ARM model is only available in platin.
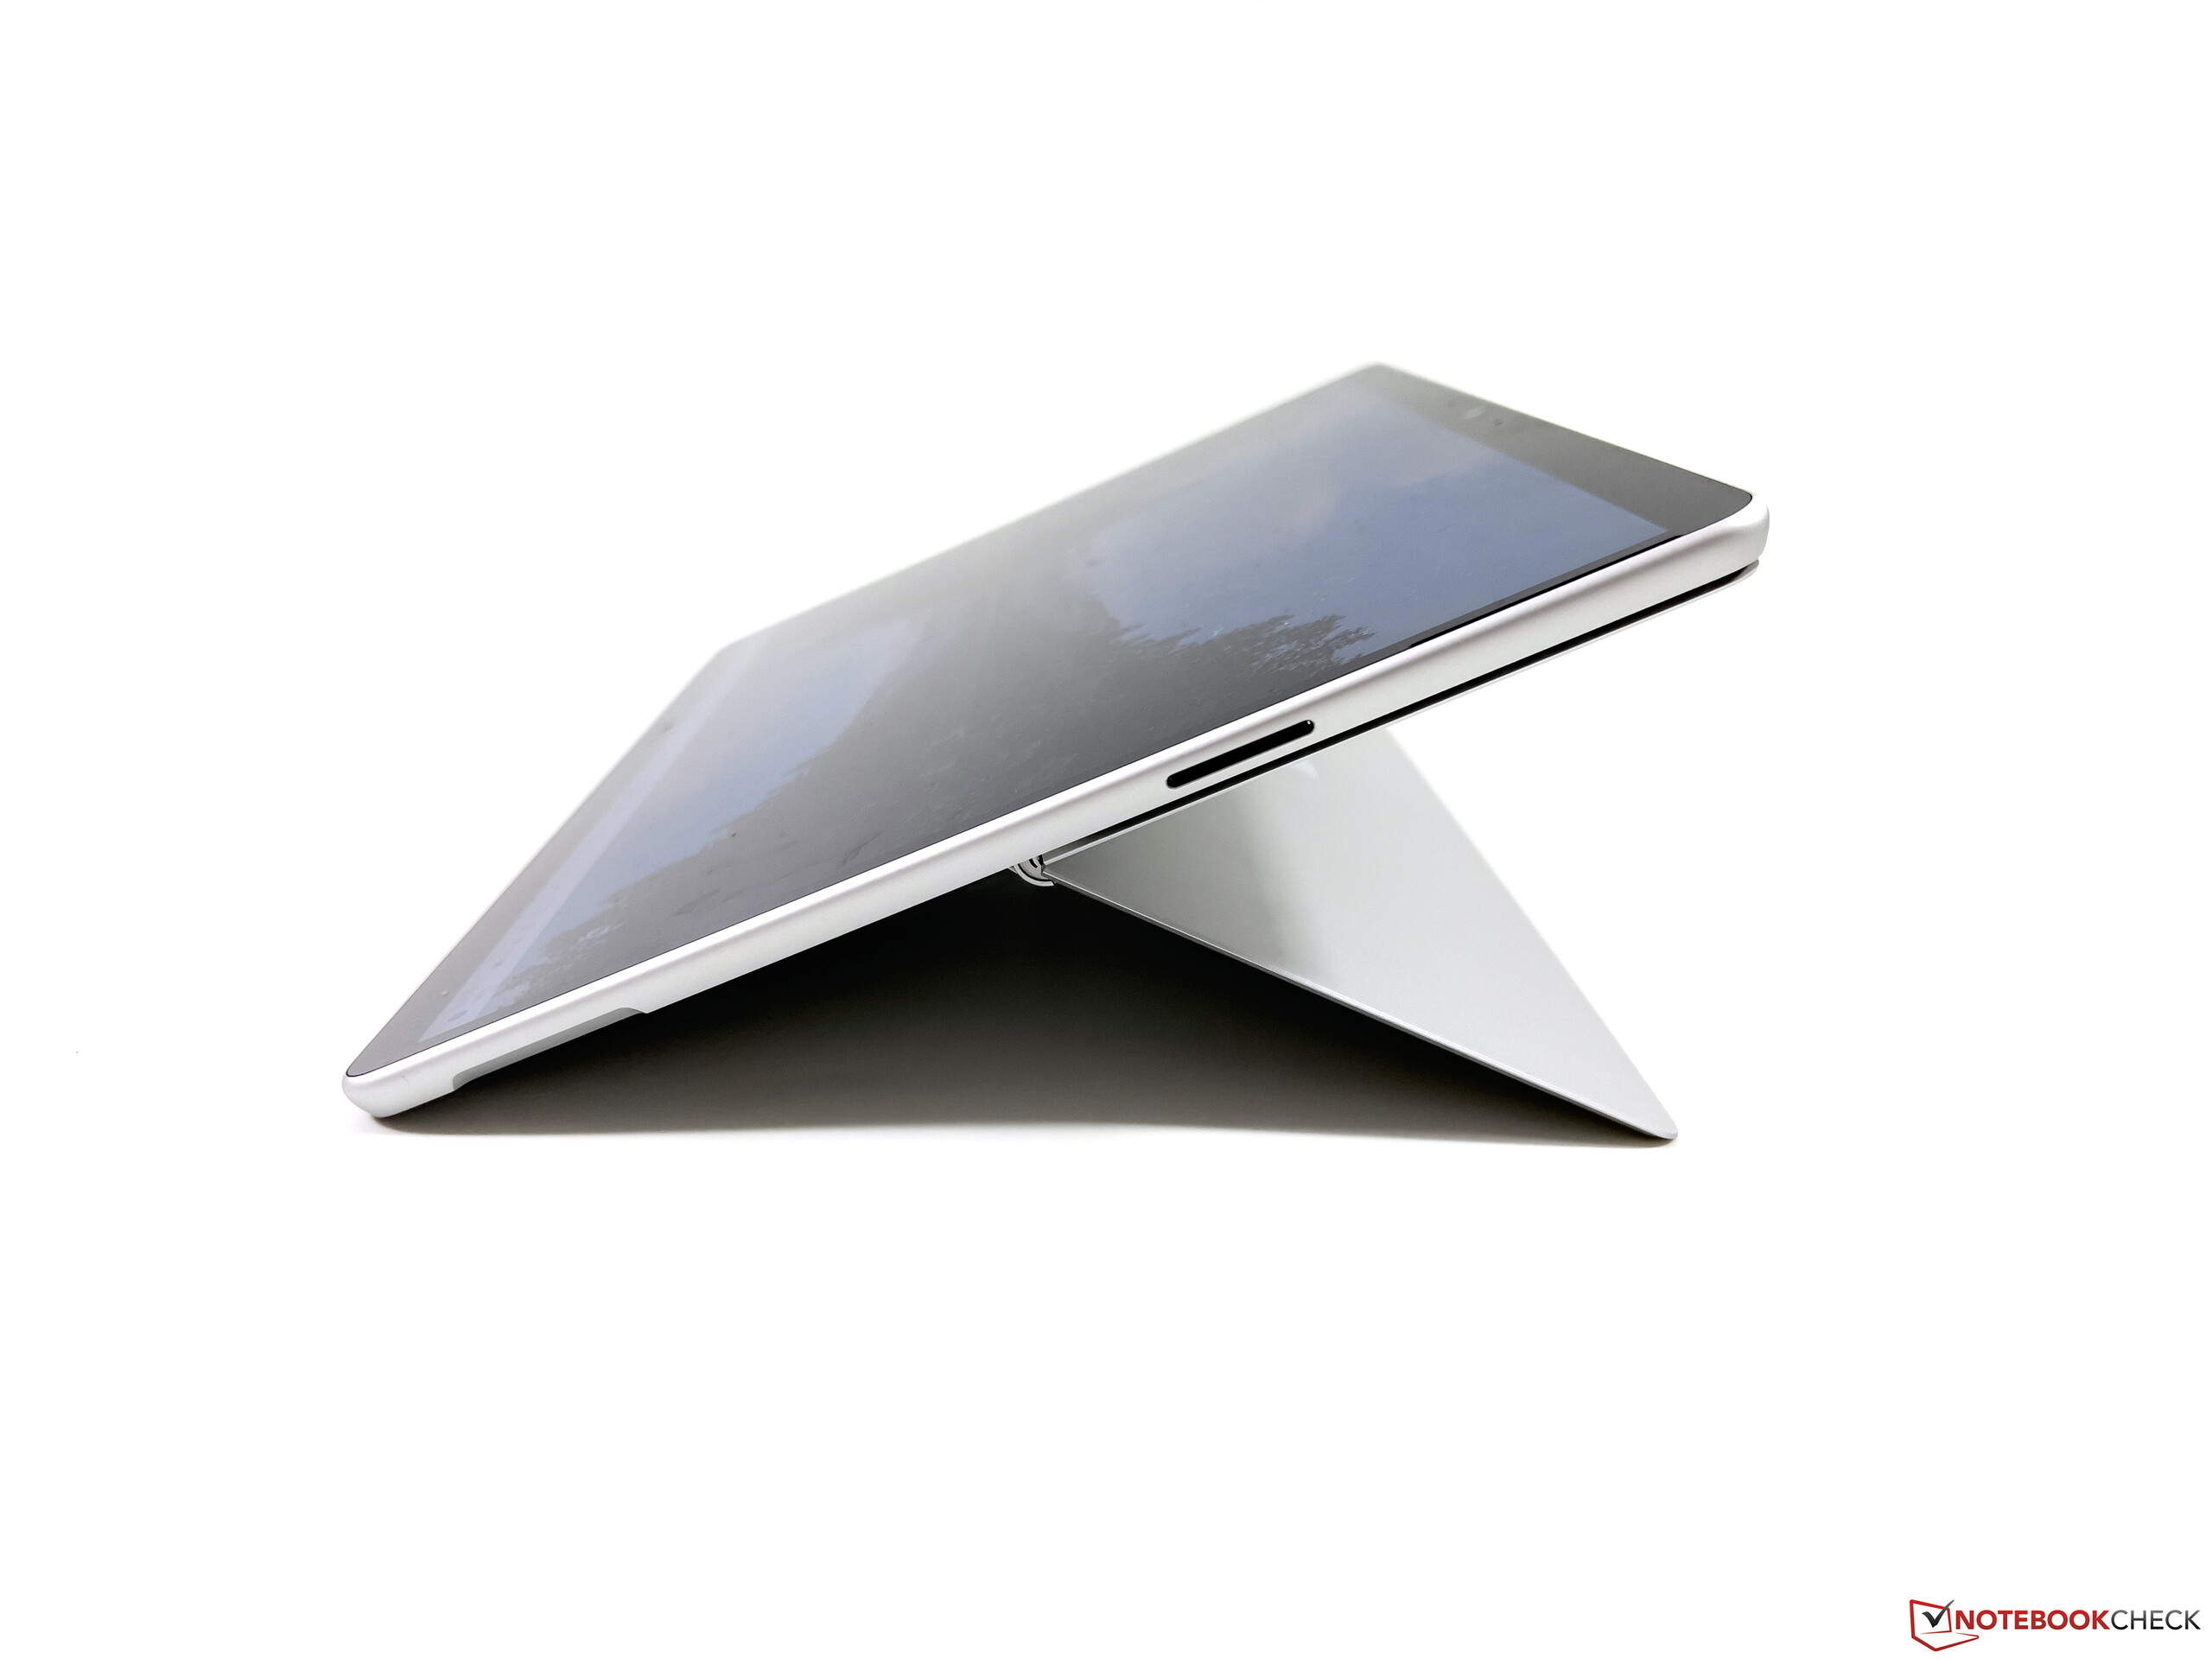
As before, the build quality is superb and the aluminum case is extremely sturdy. There are no creaking noises or image distortions, although the integrated kickstand continues to be a weak point. The case is very thin, so the edges quickly press into the skin when you place the Surface Pro 9 on your thighs, for example. The stand is also very flexible and the hinges always do their job well.


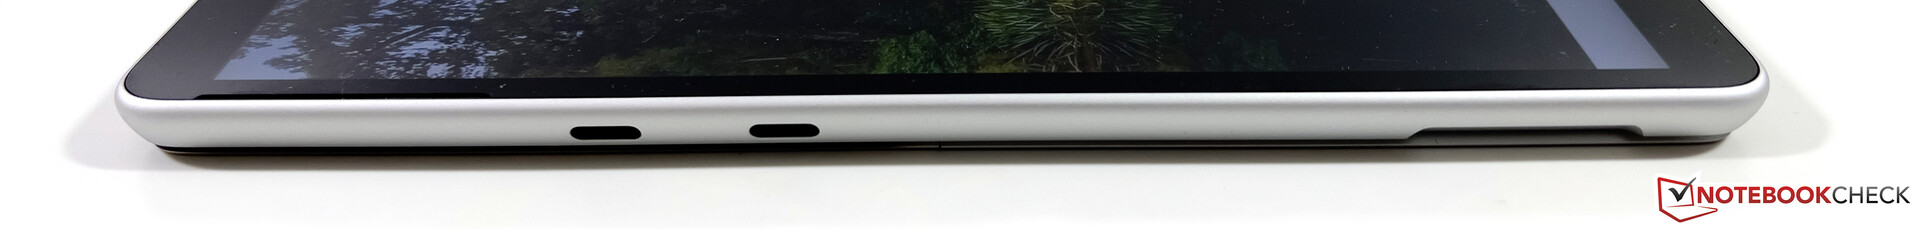
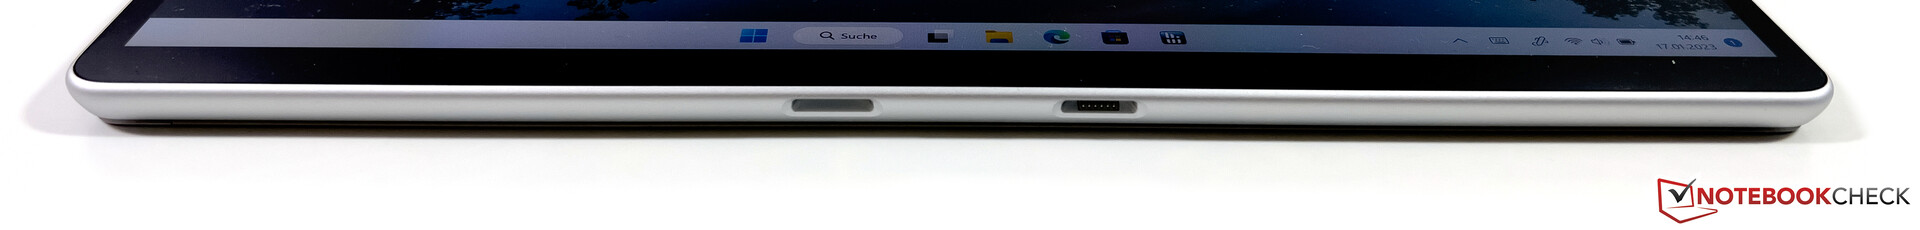
Equipment - Surface Pro with Thunderbolt 4
The ports have been repositioned and the 2x USB-C ports (including Thunderbolt 4) as well as the proprietary Surface Connect port still remain, but Microsoft has removed the 3.5 mm jack. The accompanying power adapter uses the Surface Connect port, but the convertible can also be recharged via USB-C. Somewhat disappointing is the continued lack of a card reader, which had been replaced by the optional Nano SIM slot in the last model. Since the Intel model now no longer comes with a WWAN module, Microsoft could have easily once again installed a micro SD card reader.

Communication
As previously mentioned, only the ARM variant of the Surface Pro 9 offers mobile internet, while the Intel version does not. At least the WLAN module has been updated and the modern WiFi 6E standard is now supported thanks to the AX211 module from Intel. We were able to connect to the 6 GHz network of our Asus reference router without issue, with transfer rates proving to be very high and stable.
| Networking | |
| Microsoft Surface Pro 9, i7-1255U | |
| iperf3 receive AXE11000 6GHz | |
| iperf3 transmit AXE11000 6GHz | |
| Dell XPS 13 9315 2-in-1 Core i5-1230U | |
| iperf3 receive AXE11000 6GHz | |
| iperf3 transmit AXE11000 6GHz | |
| Lenovo ThinkPad X12 20UVS03G00 | |
| iperf3 transmit AX12 | |
| iperf3 receive AX12 | |
| HP Elite Dragonfly Folio 13.5 G3 | |
| iperf3 receive AXE11000 6GHz | |
| iperf3 receive AXE11000 | |
| iperf3 transmit AXE11000 6GHz | |
| iperf3 transmit AXE11000 | |
| Apple iPad Pro 12.9 2022 | |
| iperf3 receive AXE11000 6GHz | |
| iperf3 receive AXE11000 | |
| iperf3 transmit AXE11000 6GHz | |
| iperf3 transmit AXE11000 | |
| Asus ROG Flow Z13 GZ301ZE | |
| iperf3 transmit AX12 | |
| iperf3 receive AX12 | |
| Microsoft Surface Pro 8, i7-1185G7 | |
| iperf3 transmit AX12 | |
| iperf3 receive AX12 | |
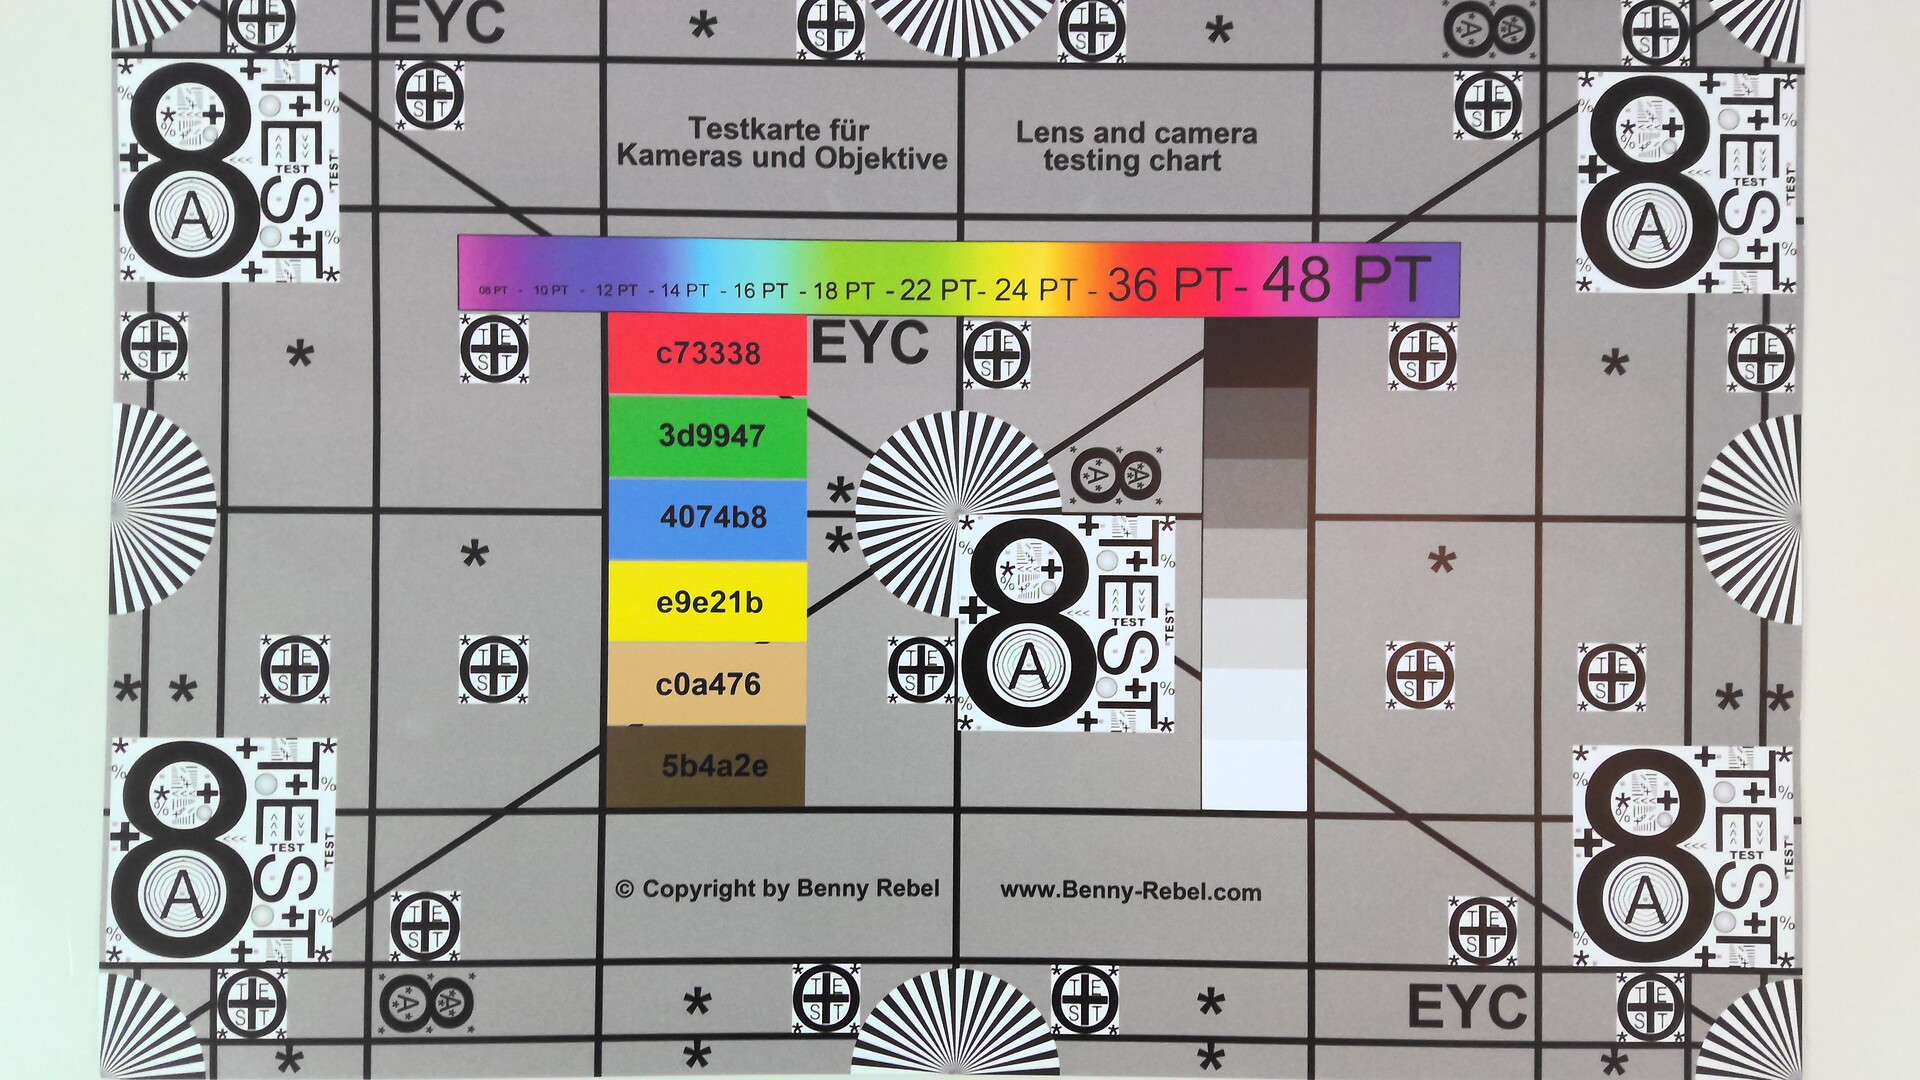
Webcam
No changes have been made to the webcam configuration, with a 5 MP camera on the front and a 10 MP camera on the back. The Surface Pro 9 thus remains among the best Windows devices in terms of camera performance. Even more camera functions are offered in the ARM variant of the Surface Pro 9, such as soft focus (or bokeh effect) for the background, automatic eye contact or automatic image cropping.


Maintenance
As before, the Surface Pro 9 still provides users with the possibility of replacing the compact M.2-2230 SSD and Microsoft has made this process even easier, as SIM tools are no longer required in order to open the cover. Instead, there is a small recess in which you push your finger, which opens the opposite side (held in place magnetically) and allows for the cover to be easily removed. However, the remaining internal components are not accessible.
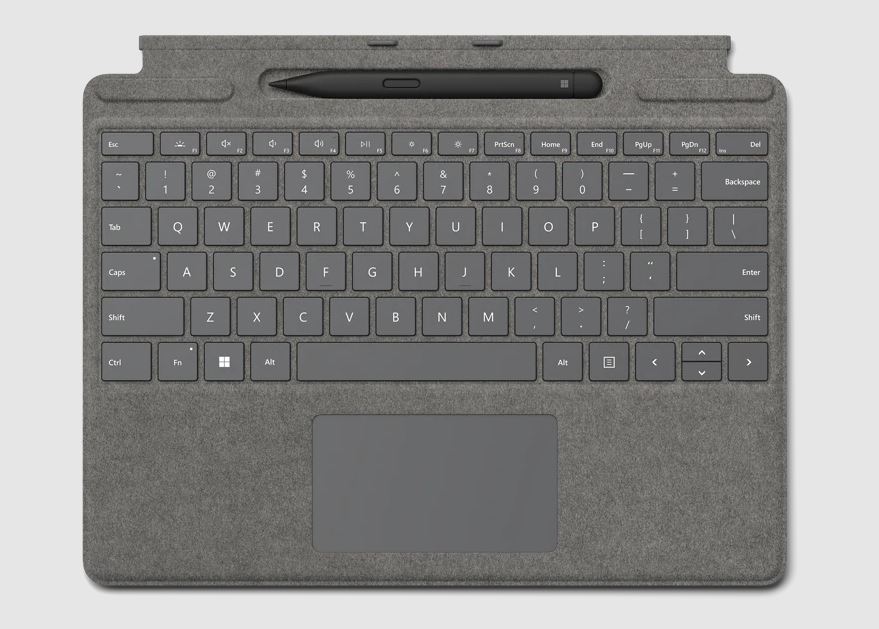
Input Devices - Signature Keyboard remains unchanged
Since the dimensions of the Surface Pro have not changed, Microsoft continues to offer two different keyboard covers. Like the last model, we again have the Signature Keyboard and the Slim Pen 2, which can be stowed away and recharged inside the keyboard cover. The stylus continues to function very well and there is also support for haptic feedback. However, the handling of the pen is no longer so ergonomic due to its flattened shape.
The keyboard itself offers a decent typing feel and is also backlit. In addition, the keyboard can be placed at a slight angle (thanks to magnets), but stability then becomes limited. When on the go in particular, the typing comfort is nowhere near as good as on a normal laptop, and the Surface requires a large set-up area overall due to the built-in hinges (but this also applies to most convertibles with a keyboard cover).

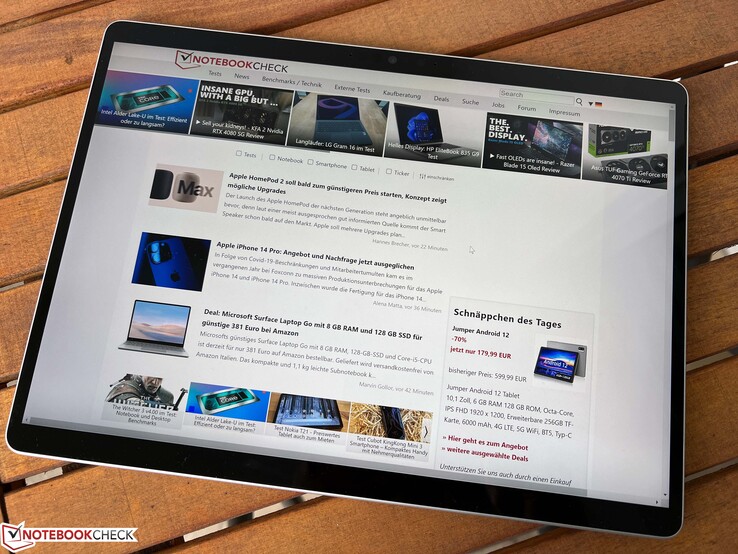
Display - 3:2 IPS at 120 Hz
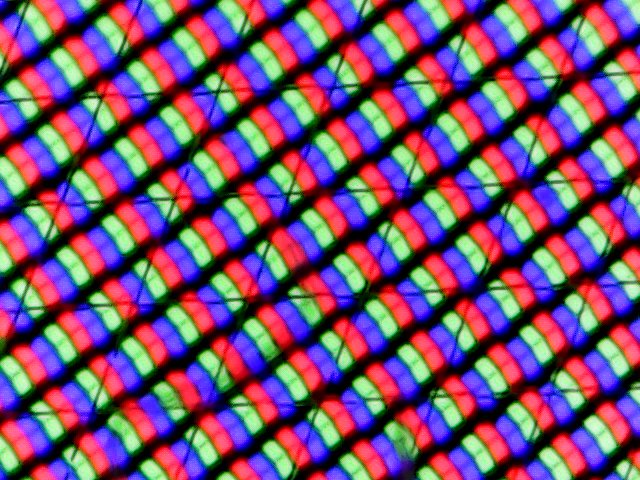

Nothing has changed in the fundamental characteristics of the display, which remains an IPS touchscreen in 3:2 format, offers a resolution of 2880 x 1920 (267 PPI) and a refresh rate of up to 120 Hz. 60 Hz is preset as the default rate, so 120 Hz has to be manually selected in the settings. Our subjective impression of the glossy screen is still very good. Thanks to sensors, the brightness and color temperature are automatically adjusted and this also functions well.
The panel again comes from LG Philips, but the panel ID has changed. Fundamentally, the values are comparable, as the maximum brightness again hovers around 450 cd/m². The black level is slightly better, which is also why the contrast ratio, at almost 1.200:1, appears slightly better. But competing devices fare better here, particularly in terms of contrast, such as the Mini-LED-Display of the iPad Pro.
No classic PWM flickering is present, but we once again registered flickering at ~30 KHz at a brightness of 55% or lower. But this should not be an issue owing to the high frequency. This also applies to halos, for only at full brightness do we notice a slightly brighter spot at the bottom left of a dark screen.
| |||||||||||||||||||||||||
Brightness Distribution: 94 %
Center on Battery: 454 cd/m²
Contrast: 1197:1 (Black: 0.38 cd/m²)
ΔE ColorChecker Calman: 1.7 | ∀{0.5-29.43 Ø4.77}
calibrated: 1.5
ΔE Greyscale Calman: 1.5 | ∀{0.09-98 Ø5}
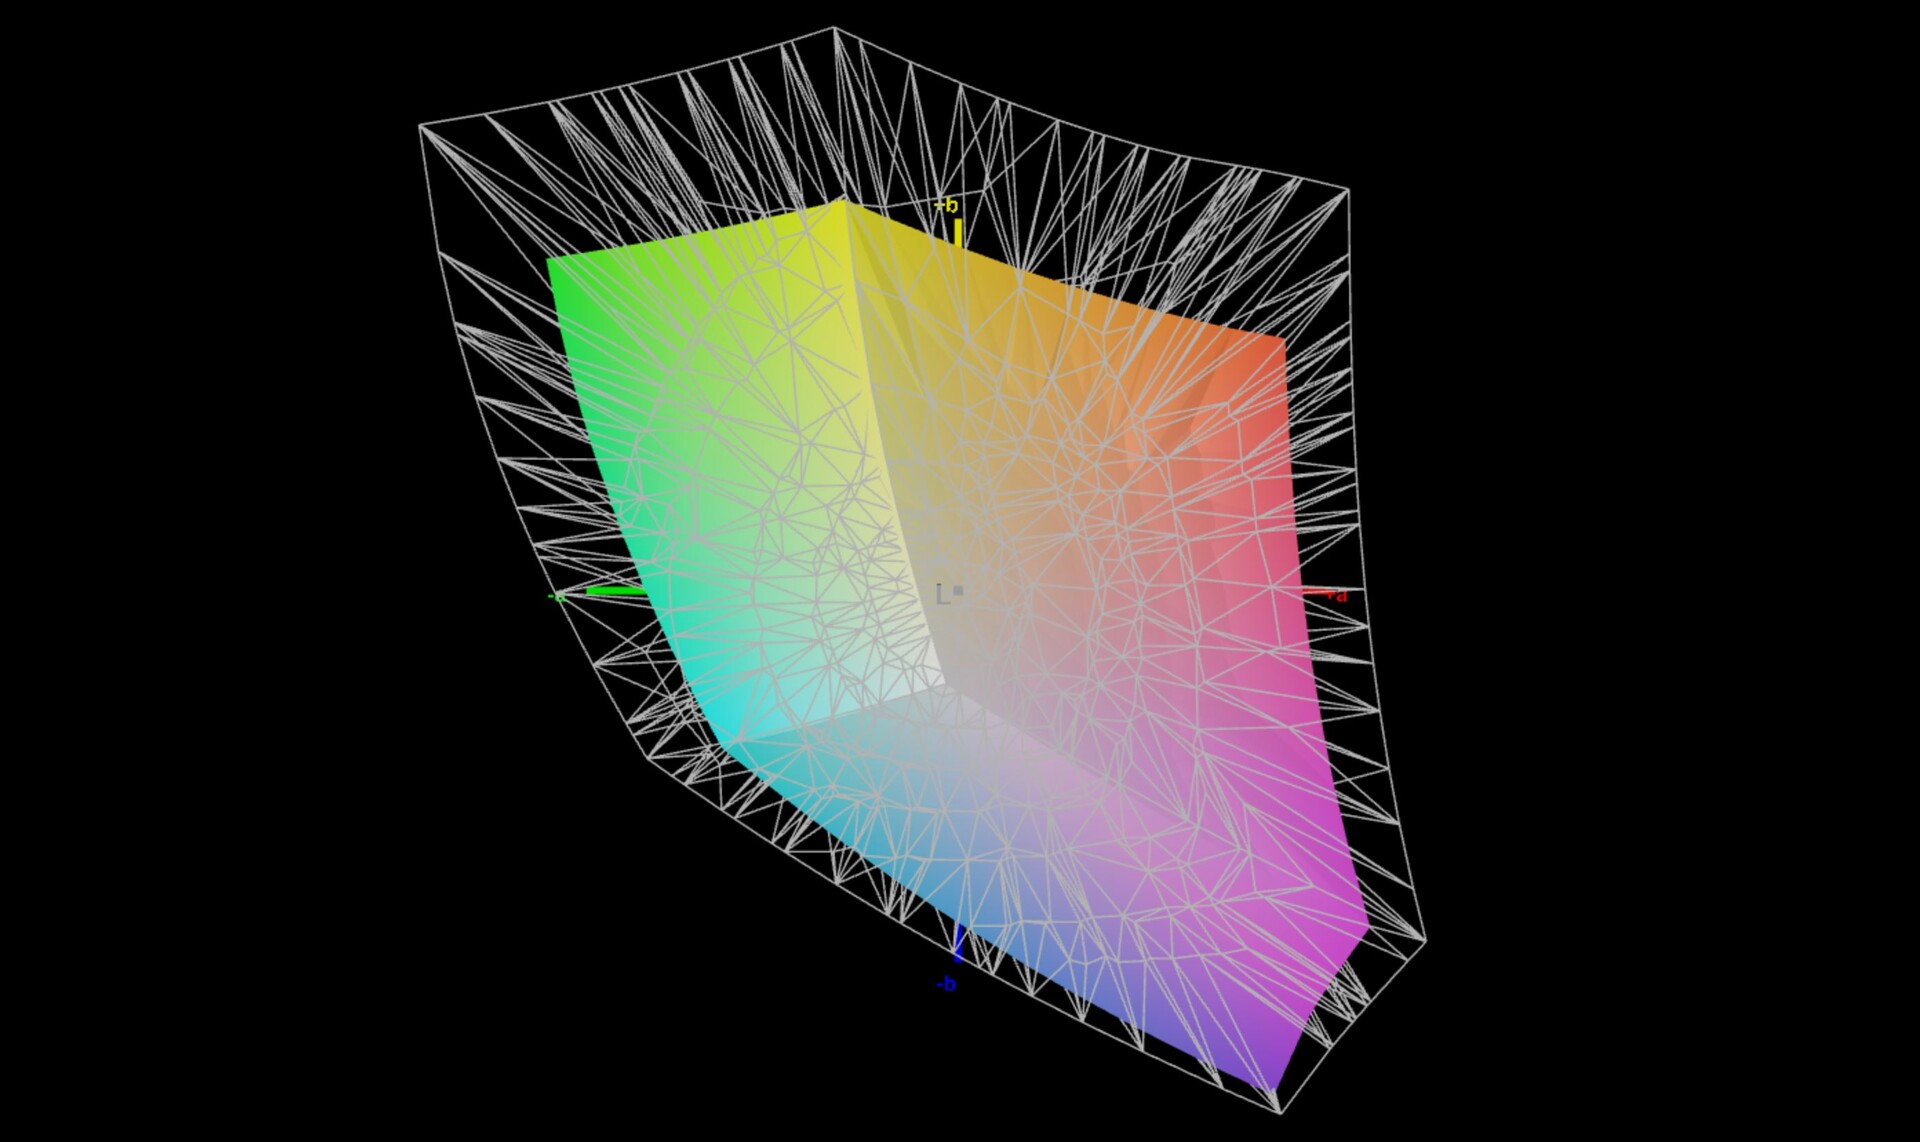
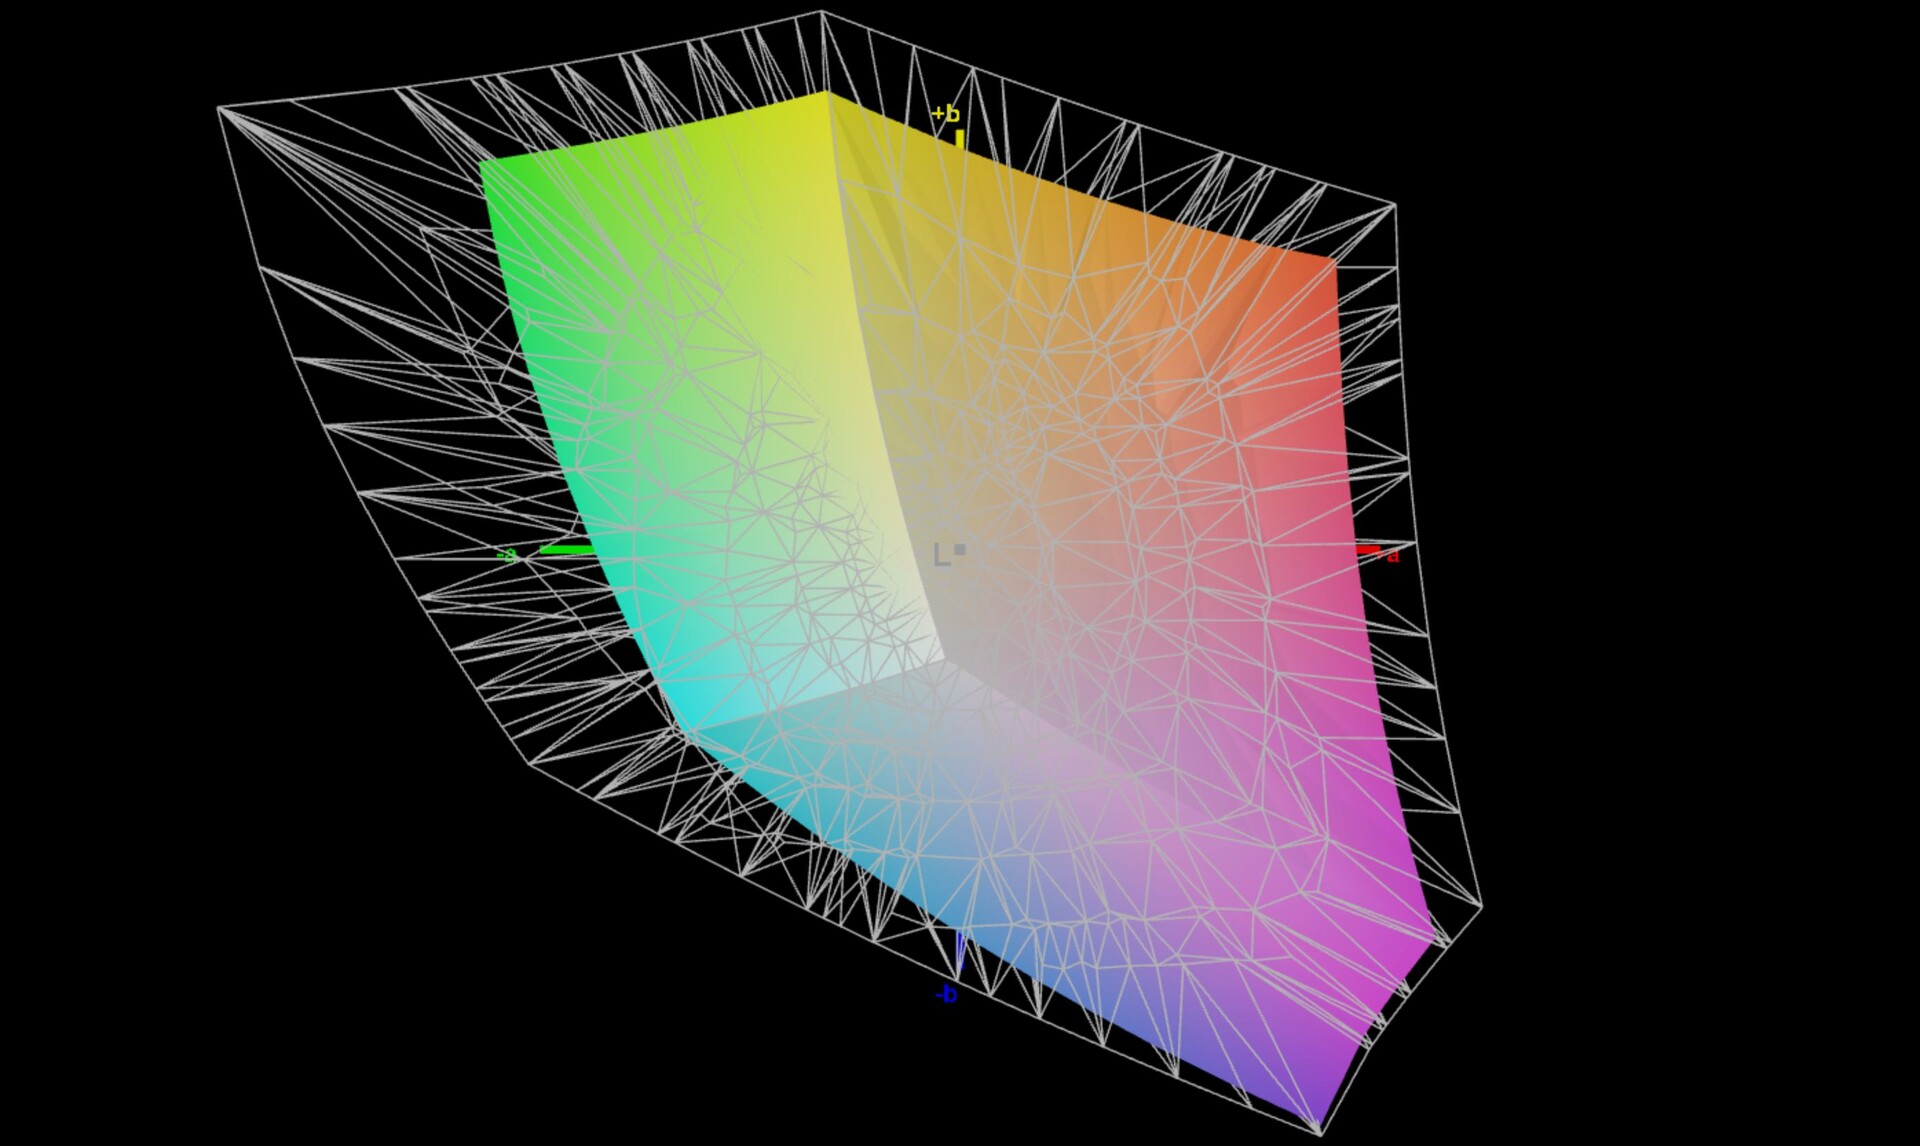
67.7% AdobeRGB 1998 (Argyll 3D)
97.7% sRGB (Argyll 3D)
65.6% Display P3 (Argyll 3D)
Gamma: 2.17
CCT: 6761 K
| Microsoft Surface Pro 9, i7-1255U LP129WT2-SPA6, IPS, 2880x1920, 13" | Dell XPS 13 9315 2-in-1 Core i5-1230U BOE NE13A1M, IPS, 2880x1920, 13" | Lenovo ThinkPad X12 20UVS03G00 N123NCA-GS1, a-Si IPS LED, 1920x1280, 12.3" | HP Elite Dragonfly Folio 13.5 G3 Chi Mei CMN13C0, IPS, 1920x1280, 13.5" | Apple iPad Pro 12.9 2022 Liquid Retina XDR Display, Mini-LED, 2732x2048, 12.9" | Asus ROG Flow Z13 GZ301ZE LQ134N1JW54, IPS, 1920x1200, 13.4" | Microsoft Surface Pro 8, i7-1185G7 LP129WT212166, IPS, 2880x1920, 13" | |
|---|---|---|---|---|---|---|---|
| Display | 6% | 2% | 3% | 1% | 12% | ||
| Display P3 Coverage (%) | 65.6 | 70.7 8% | 67 2% | 68.3 4% | 67.5 3% | 78.2 19% | |
| sRGB Coverage (%) | 97.7 | 99.8 2% | 99.2 2% | 98.6 1% | 97.1 -1% | 100 2% | |
| AdobeRGB 1998 Coverage (%) | 67.7 | 72.6 7% | 68.8 2% | 70.2 4% | 69.3 2% | 77.6 15% | |
| Response Times | -133% | -236% | -272% | -133% | -115% | -139% | |
| Response Time Grey 50% / Grey 80% * (ms) | 13 ? | 44 ? -238% | 63.2 ? -386% | 66.8 ? -414% | 35.3 ? -172% | 44 ? -238% | 46.4 ? -257% |
| Response Time Black / White * (ms) | 19.4 ? | 24.8 ? -28% | 36 ? -86% | 44.4 ? -129% | 37.53 ? -93% | 17.6 ? 9% | 23.2 ? -20% |
| PWM Frequency (Hz) | 29896 ? | 6401 ? | 29760 ? | ||||
| Screen | 8% | 24% | -9% | 7% | -0% | -7% | |
| Brightness middle (cd/m²) | 455 | 507 11% | 419 -8% | 369.5 -19% | 611 34% | 515 13% | 444 -2% |
| Brightness (cd/m²) | 453 | 486 7% | 406 -10% | 350 -23% | 605 34% | 476 5% | 451 0% |
| Brightness Distribution (%) | 94 | 87 -7% | 94 0% | 87 -7% | 92 -2% | 87 -7% | 91 -3% |
| Black Level * (cd/m²) | 0.38 | 0.34 11% | 0.23 39% | 0.24 37% | 0.35 8% | 0.43 -13% | |
| Contrast (:1) | 1197 | 1491 25% | 1822 52% | 1540 29% | 1471 23% | 1033 -14% | |
| Colorchecker dE 2000 * | 1.7 | 2.04 -20% | 1.1 35% | 2.3 -35% | 1.4 18% | 1.6 6% | 2 -18% |
| Colorchecker dE 2000 max. * | 3.8 | 3.1 18% | 2.2 42% | 4.34 -14% | 3.3 13% | 4 -5% | 3.2 16% |
| Colorchecker dE 2000 calibrated * | 1.5 | 0.86 43% | 0.5 67% | 0.6 60% | 1.2 20% | 1.7 -13% | |
| Greyscale dE 2000 * | 1.5 | 1.8 -20% | 1.5 -0% | 3.1 -107% | 2.3 -53% | 2.5 -67% | 1.8 -20% |
| Gamma | 2.17 101% | 2.12 104% | 2.06 107% | 2.1 105% | 2.22 99% | 2.2 100% | 2.11 104% |
| CCT | 6761 96% | 6561 99% | 6524 100% | 6248 104% | 6930 94% | 6939 94% | 6417 101% |
| Color Space (Percent of AdobeRGB 1998) (%) | 62.8 | ||||||
| Color Space (Percent of sRGB) (%) | 99.2 | ||||||
| Total Average (Program / Settings) | -40% /
-13% | -70% /
-18% | -93% /
-44% | -63% /
-28% | -38% /
-16% | -45% /
-22% |
* ... smaller is better
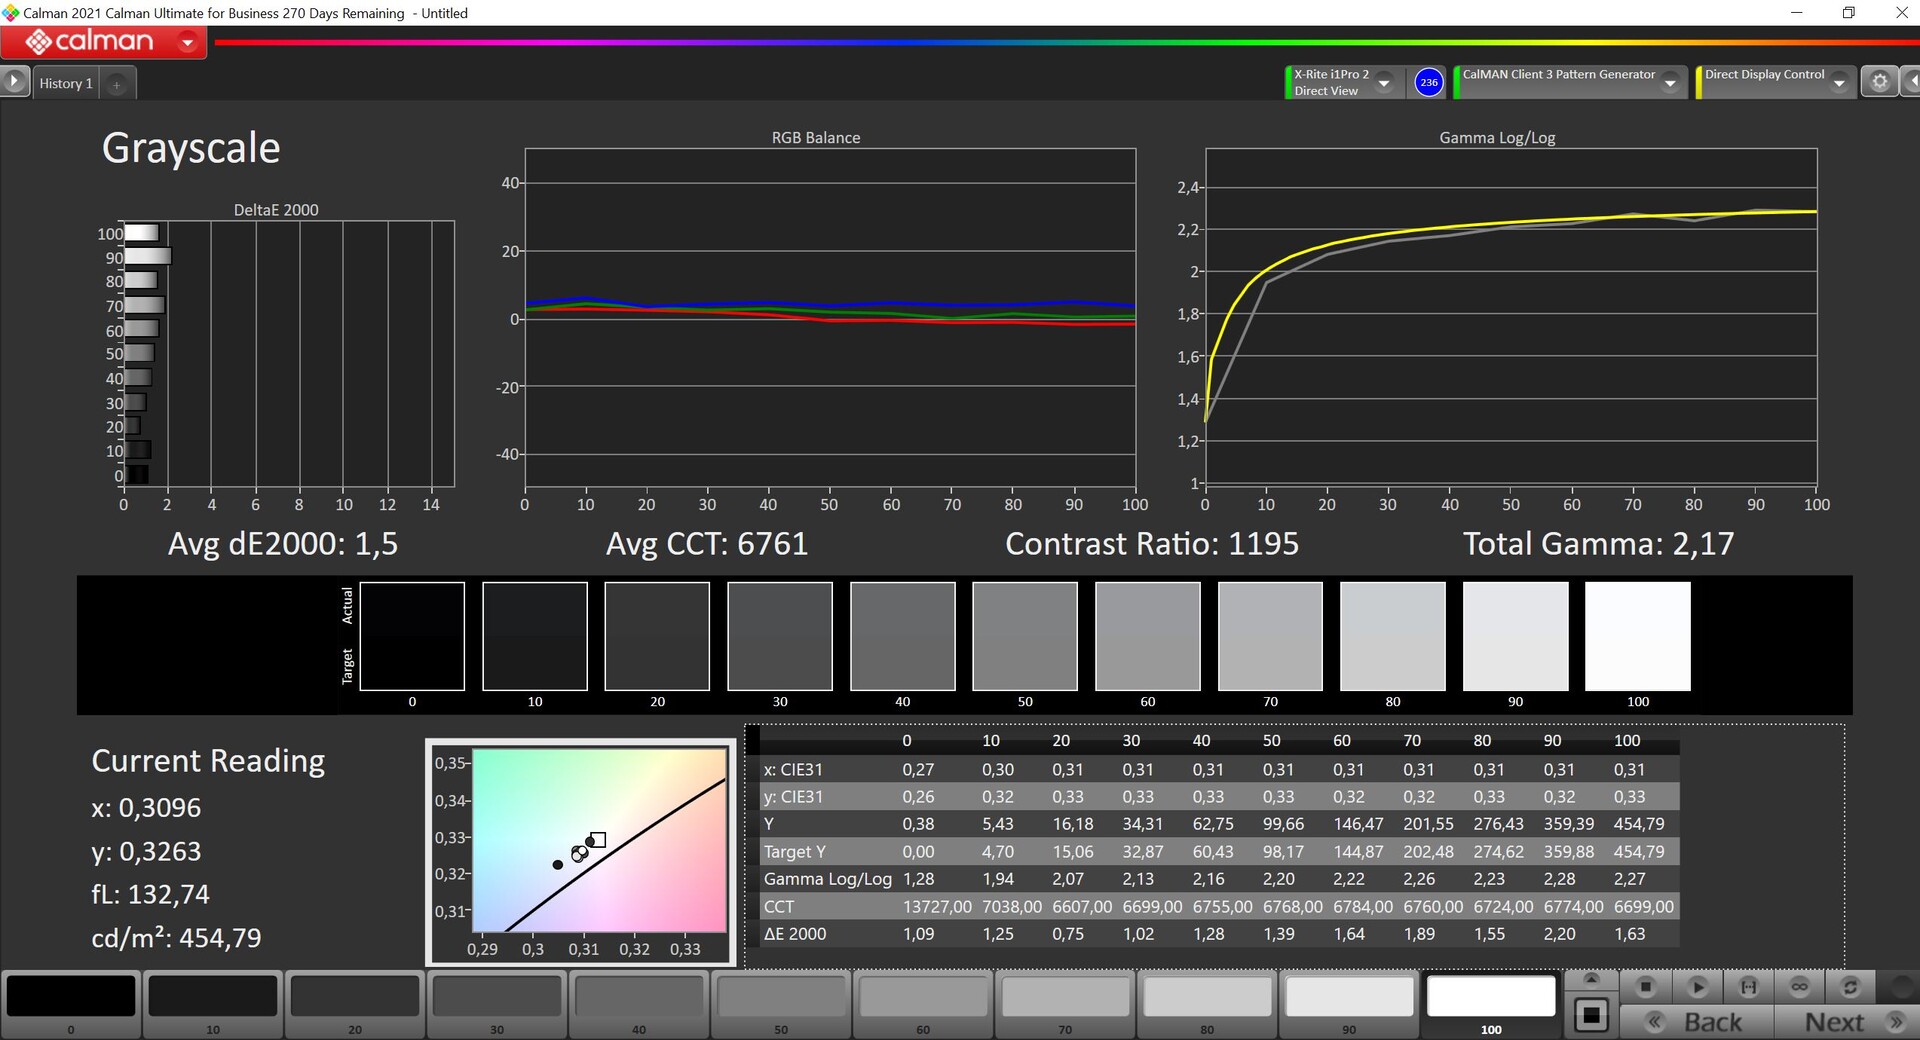


We tested the panel using professional CalMAN software (X-Rite i1 Pro 2): its performance in delivery state is already very good, although we could not detect any differences between the sRGB and Vivid profiles. Grayscale shows a slight color cast, but this is not noticeable in practice. Color deviations are on target; only the 100% colors show slightly larger deviations (whereby only green is above the target value of 3). We were able to improve these values even more via our own calibration (profile available above for free download), but this not really necessary. In terms of color space coverage, however, the new panel is somewhat worse, for sRGB only achieves 97.7% coverage (previously 100%) and both P3 and AdobeRGB are also somewhat lower than before.

Display Response Times
| ↔ Response Time Black to White | ||
|---|---|---|
| 19.4 ms ... rise ↗ and fall ↘ combined | ↗ 6.8 ms rise |  |
| ↘ 12.6 ms fall | ||
| The screen shows good response rates in our tests, but may be too slow for competitive gamers. In comparison, all tested devices range from 0.1 (minimum) to 240 (maximum) ms. » 42 % of all devices are better. This means that the measured response time is similar to the average of all tested devices (20.2 ms). | ||
| ↔ Response Time 50% Grey to 80% Grey | ||
| 13 ms ... rise ↗ and fall ↘ combined | ↗ 6 ms rise |  |
| ↘ 7 ms fall | ||
| The screen shows good response rates in our tests, but may be too slow for competitive gamers. In comparison, all tested devices range from 0.165 (minimum) to 636 (maximum) ms. » 25 % of all devices are better. This means that the measured response time is better than the average of all tested devices (31.6 ms). | ||
Screen Flickering / PWM (Pulse-Width Modulation)
| Screen flickering / PWM detected | 29896 Hz | ≤ 55 % brightness setting | 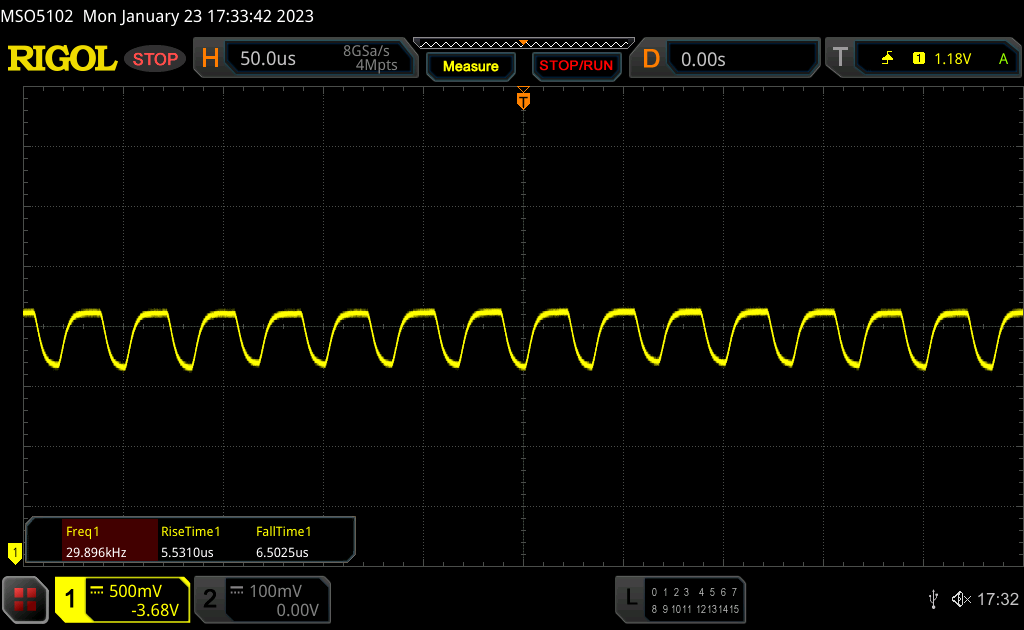 |
The display backlight flickers at 29896 Hz (worst case, e.g., utilizing PWM) Flickering detected at a brightness setting of 55 % and below. There should be no flickering or PWM above this brightness setting. The frequency of 29896 Hz is quite high, so most users sensitive to PWM should not notice any flickering. In comparison: 53 % of all tested devices do not use PWM to dim the display. If PWM was detected, an average of 8091 (minimum: 5 - maximum: 343500) Hz was measured. | |||
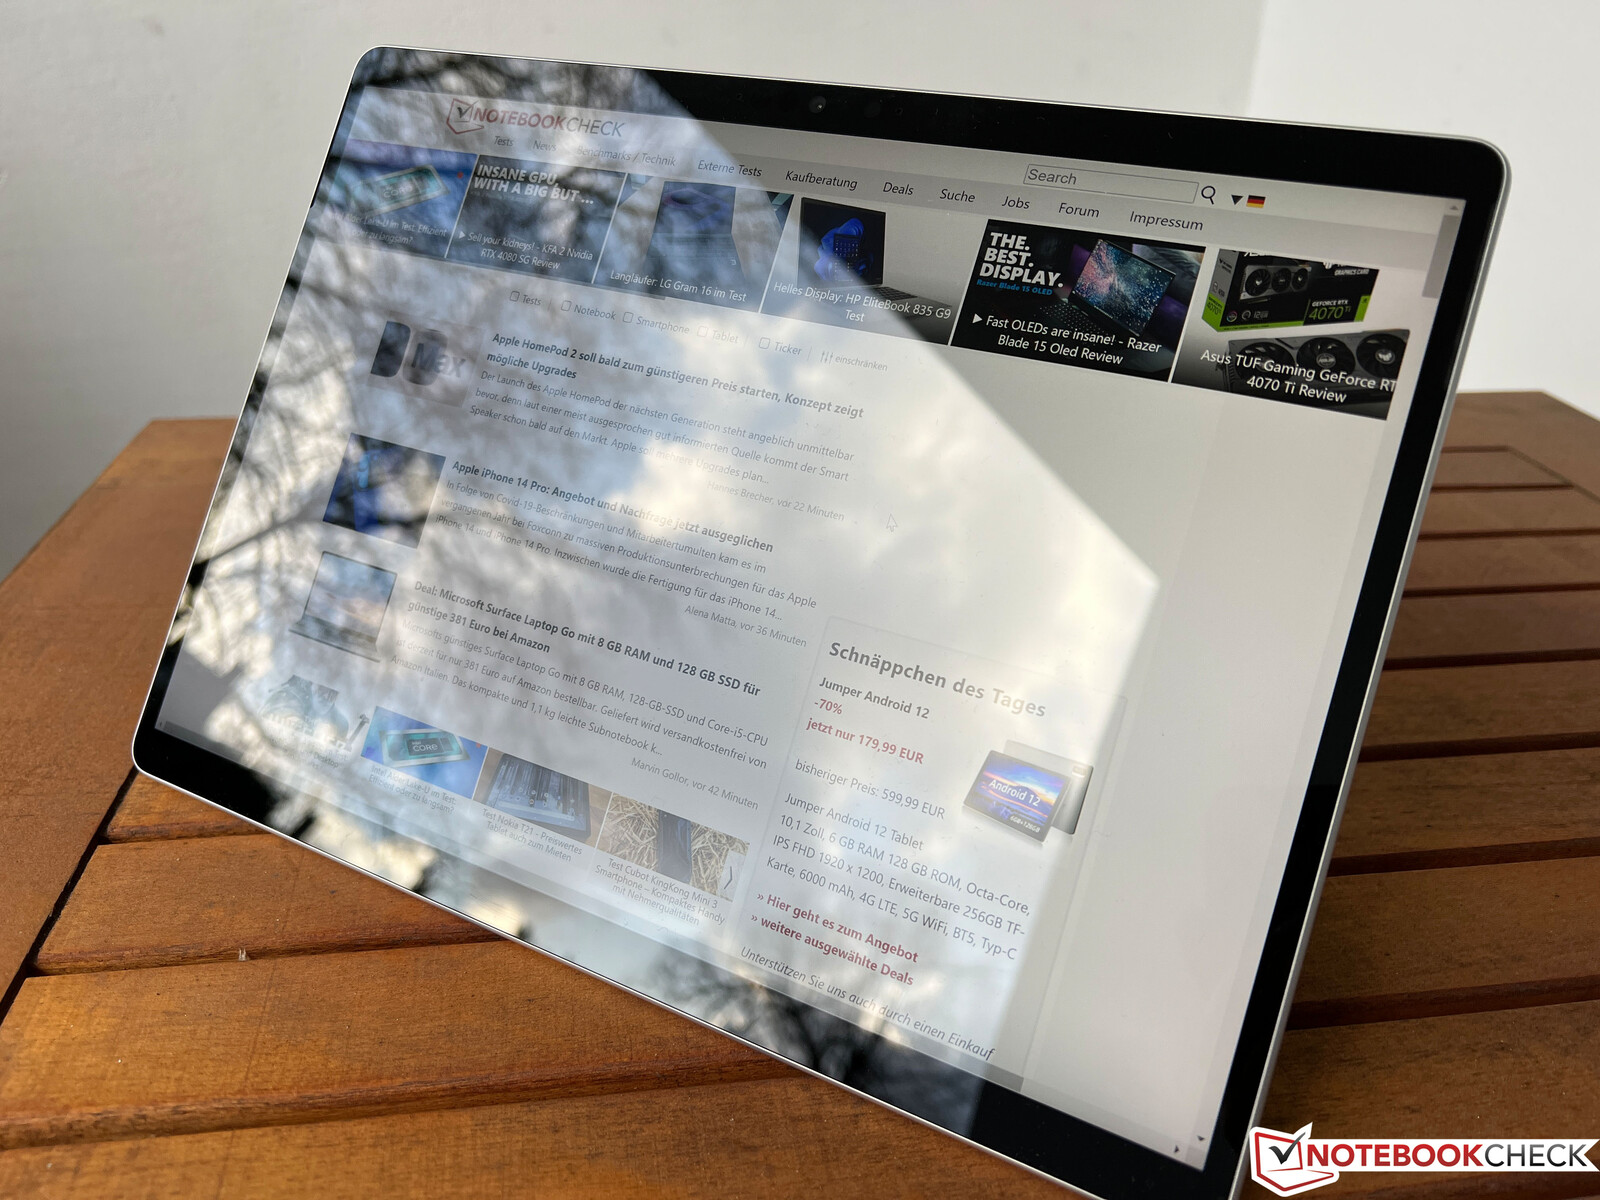

A glossy screen surface is not ideal for outdoor use, so you basically have to avoid reflections from light sources where possible. Only then is the maximum brightness level sufficient for the comfortable viewing of display content. The viewing angle stability leaves no room for criticism.

Performance - Alder Lake-U provides significantly more power
The Intel variants of the new Surface Pro 9 are only available with Alder Lake processors in the 15-watt class, either the Core i5 1235U or the Core i7 1255U. Those requiring 16 GB of RAM or 256 GB of storage will have to opt for the i7 variant. A maximum of 32 GB RAM and a 1 TB SDD is possible (US$2499.99).


Testing Conditions
Microsoft only uses the Windows power settings, which are slightly different in name from other Windows devices (Recommended, Better Performance and Best Performance). We used Best Performance for the benchmarks and the default 60 Hz mode was used for the energy measurements.
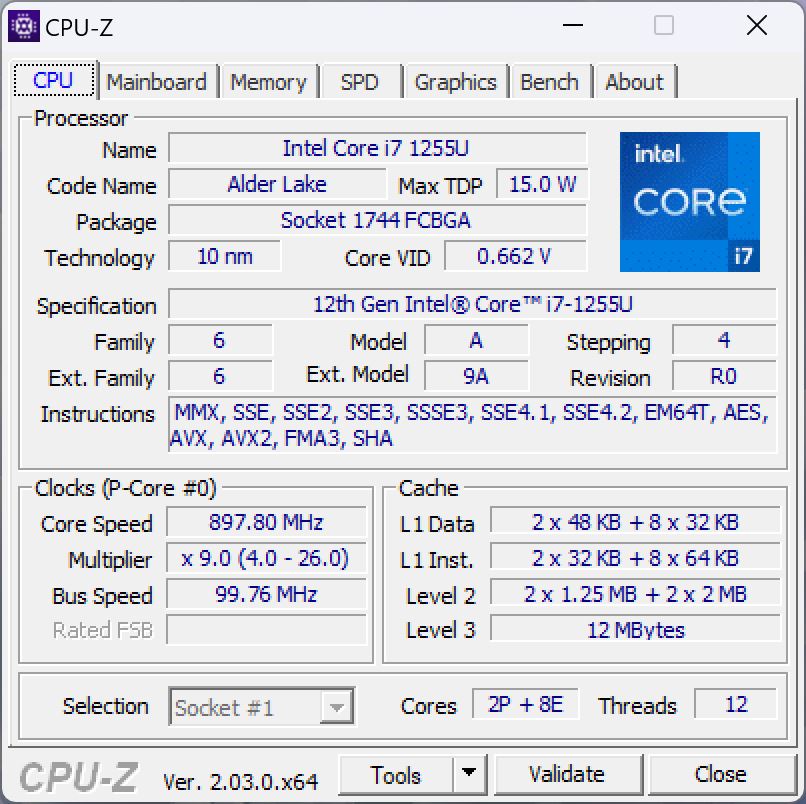
Processor - Core i7-1255U
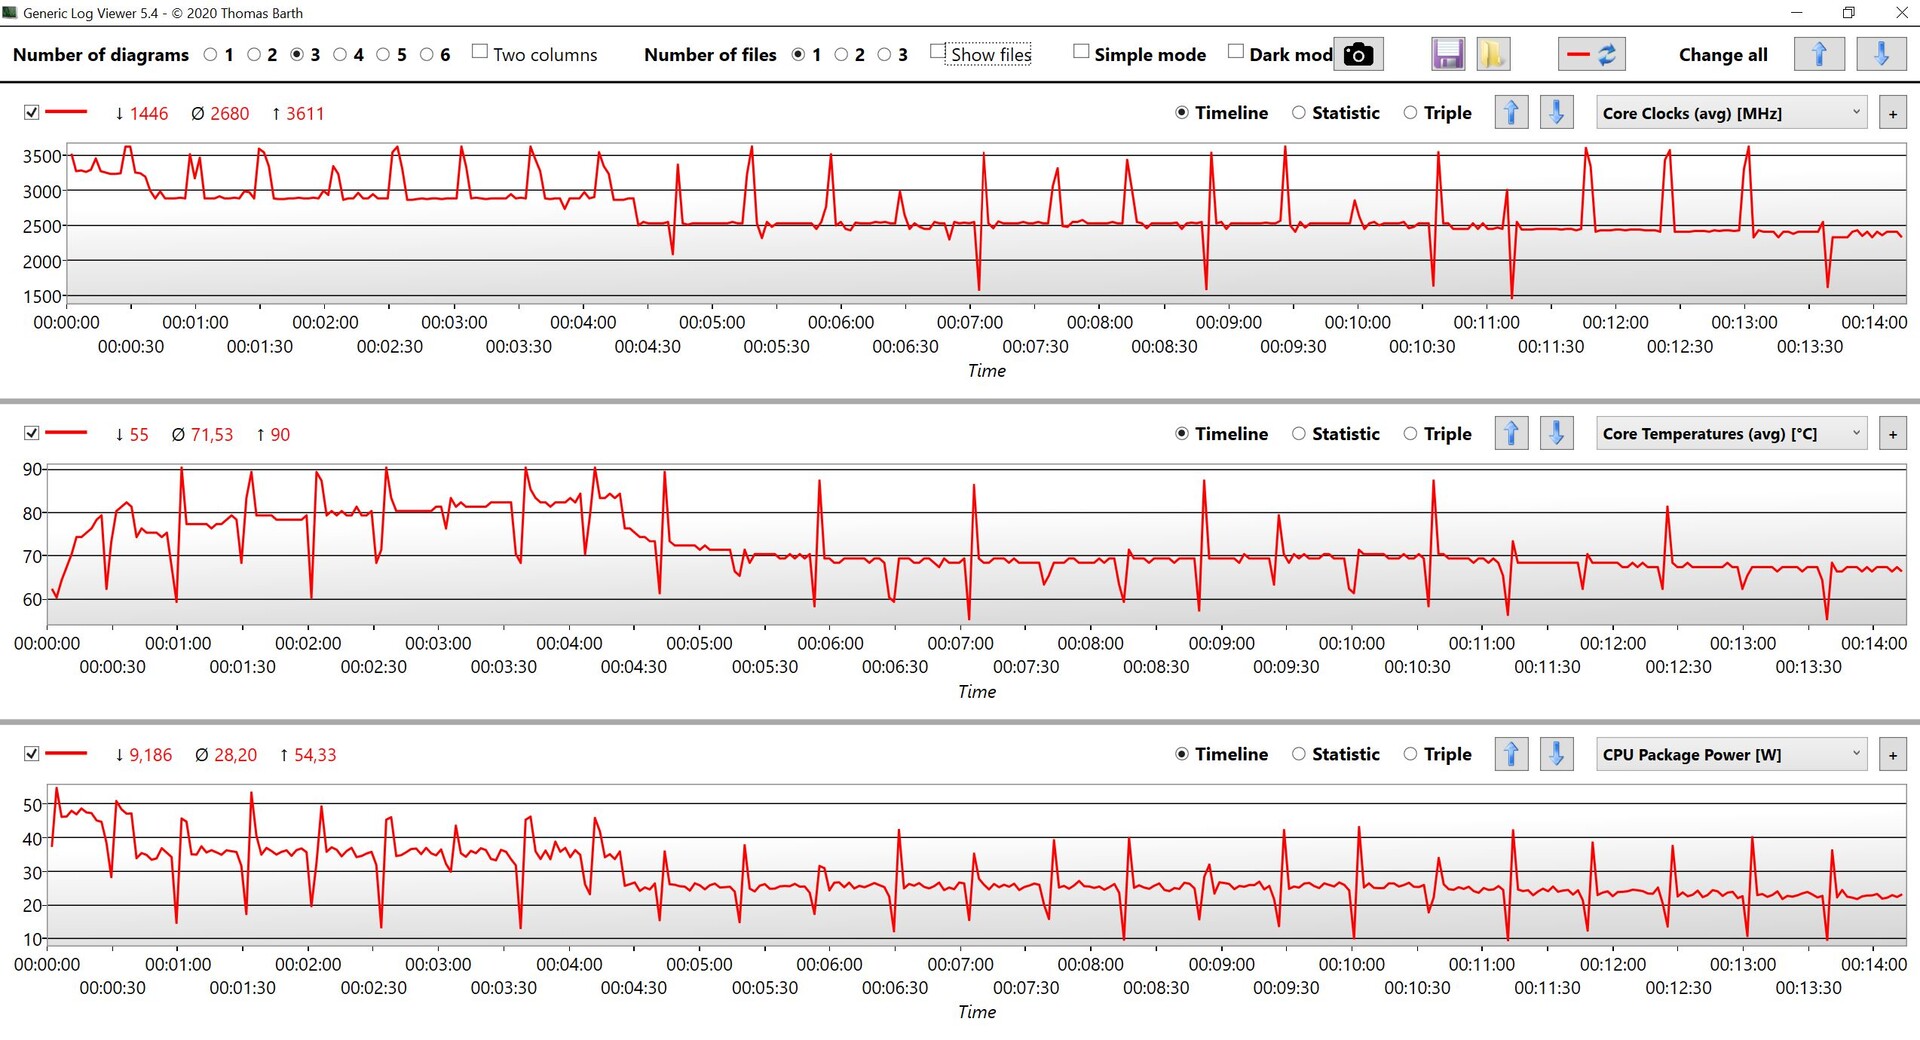
The Core i7 1255U belongs to Intel's current Alder Lake generation and combines two fast performance cores with 8 efficiency cores. It is basically a 15-watt CPU, but Microsoft gives the processor free rein here and we observed a maximum consumption of around 20 watts under single-core load and up to 54 watts under multi-core load, which is also near the maximum limit of the Alder Lake-U processors as specified by Intel. Of course, these values are only maintained for a very short time, but the Surface Pro 9 can maintain 35 watts under constant load for around 4.5 minutes before dropping to around 25 watts and even further to 22 watts. Whether these high values make sense is of course another question, for our recent analysis of the Alder Lake-U CPUs revealed that an Alder Lake-P chip (for example, the Core i7 1260P) with two additional cores offers more performance at such values.
Cinebench R15 Multi Sustained Load
In the CPU tests, the Surface Pro 9 is beaten only by the Asus ROG Flow Z13 gaming convertible, which is also equipped with the Core i9 12900H. Both single-core and multi-core performance are significantly better than in the old Surface Pro 8 with its Core i7 1185G7. For comparison with the M2 processor in the iPad Pro, we have included the results of the MacBook Air, since not all benchmarks are supported on the iPad. The Apple M2 is not quite as fast, but is much more efficient (~5 watts single-core and ~20 watts multi-core).
In battery mode, CPU performance is slightly worse because the power limits are lowered to 45/30 watts. In the Cinebench R23 multi-core test, this leads to a performance reduction of just under 5%, but the single-core performance is not worse. More CPU benchmarks are available here.
Cinebench R23: Multi Core | Single Core
Cinebench R20: CPU (Multi Core) | CPU (Single Core)
Cinebench R15: CPU Multi 64Bit | CPU Single 64Bit
Blender: v2.79 BMW27 CPU
7-Zip 18.03: 7z b 4 | 7z b 4 -mmt1
Geekbench 5.5: Multi-Core | Single-Core
HWBOT x265 Benchmark v2.2: 4k Preset
LibreOffice : 20 Documents To PDF
R Benchmark 2.5: Overall mean
| CPU Performance rating | |
| Asus ROG Flow Z13 GZ301ZE | |
| Average of class Convertible | |
| Microsoft Surface Pro 9, i7-1255U | |
| Apple MacBook Air M2 10C GPU -5! | |
| HP Elite Dragonfly Folio 13.5 G3 | |
| Average Intel Core i7-1255U | |
| Dell XPS 13 9315 2-in-1 Core i5-1230U | |
| Microsoft Surface Pro 8, i7-1185G7 | |
| Lenovo ThinkPad X12 20UVS03G00 -1! | |
| Cinebench R23 / Multi Core | |
| Asus ROG Flow Z13 GZ301ZE | |
| Average of class Convertible (2949 - 29063, n=56, last 2 years) | |
| Microsoft Surface Pro 9, i7-1255U | |
| Apple MacBook Air M2 10C GPU | |
| Average Intel Core i7-1255U (5269 - 9628, n=11) | |
| HP Elite Dragonfly Folio 13.5 G3 | |
| Dell XPS 13 9315 2-in-1 Core i5-1230U | |
| Microsoft Surface Pro 8, i7-1185G7 | |
| Lenovo ThinkPad X12 20UVS03G00 | |
| Cinebench R23 / Single Core | |
| Asus ROG Flow Z13 GZ301ZE | |
| Average of class Convertible (914 - 2163, n=56, last 2 years) | |
| HP Elite Dragonfly Folio 13.5 G3 | |
| Microsoft Surface Pro 9, i7-1255U | |
| Average Intel Core i7-1255U (1408 - 1775, n=11) | |
| Apple MacBook Air M2 10C GPU | |
| Microsoft Surface Pro 8, i7-1185G7 | |
| Dell XPS 13 9315 2-in-1 Core i5-1230U | |
| Lenovo ThinkPad X12 20UVS03G00 | |
| Cinebench R20 / CPU (Multi Core) | |
| Asus ROG Flow Z13 GZ301ZE | |
| Average of class Convertible (1124 - 11357, n=56, last 2 years) | |
| Microsoft Surface Pro 9, i7-1255U | |
| Average Intel Core i7-1255U (2095 - 3702, n=11) | |
| HP Elite Dragonfly Folio 13.5 G3 | |
| Dell XPS 13 9315 2-in-1 Core i5-1230U | |
| Apple MacBook Air M2 10C GPU | |
| Microsoft Surface Pro 8, i7-1185G7 | |
| Lenovo ThinkPad X12 20UVS03G00 | |
| Cinebench R20 / CPU (Single Core) | |
| Asus ROG Flow Z13 GZ301ZE | |
| Average of class Convertible (348 - 827, n=56, last 2 years) | |
| HP Elite Dragonfly Folio 13.5 G3 | |
| Microsoft Surface Pro 9, i7-1255U | |
| Average Intel Core i7-1255U (550 - 682, n=11) | |
| Dell XPS 13 9315 2-in-1 Core i5-1230U | |
| Microsoft Surface Pro 8, i7-1185G7 | |
| Lenovo ThinkPad X12 20UVS03G00 | |
| Apple MacBook Air M2 10C GPU | |
| Cinebench R15 / CPU Multi 64Bit | |
| Asus ROG Flow Z13 GZ301ZE | |
| Average of class Convertible (478 - 4830, n=59, last 2 years) | |
| Microsoft Surface Pro 9, i7-1255U | |
| HP Elite Dragonfly Folio 13.5 G3 | |
| Average Intel Core i7-1255U (919 - 1577, n=11) | |
| Dell XPS 13 9315 2-in-1 Core i5-1230U | |
| Apple MacBook Air M2 10C GPU | |
| Microsoft Surface Pro 8, i7-1185G7 | |
| Lenovo ThinkPad X12 20UVS03G00 | |
| Cinebench R15 / CPU Single 64Bit | |
| Asus ROG Flow Z13 GZ301ZE | |
| Average of class Convertible (149.8 - 317, n=56, last 2 years) | |
| HP Elite Dragonfly Folio 13.5 G3 | |
| Average Intel Core i7-1255U (161 - 251, n=12) | |
| Microsoft Surface Pro 8, i7-1185G7 | |
| Apple MacBook Air M2 10C GPU | |
| Microsoft Surface Pro 9, i7-1255U | |
| Dell XPS 13 9315 2-in-1 Core i5-1230U | |
| Lenovo ThinkPad X12 20UVS03G00 | |
| Blender / v2.79 BMW27 CPU | |
| Lenovo ThinkPad X12 20UVS03G00 | |
| Apple MacBook Air M2 10C GPU | |
| Microsoft Surface Pro 8, i7-1185G7 | |
| Dell XPS 13 9315 2-in-1 Core i5-1230U | |
| Average Intel Core i7-1255U (372 - 601, n=11) | |
| HP Elite Dragonfly Folio 13.5 G3 | |
| Microsoft Surface Pro 9, i7-1255U | |
| Average of class Convertible (107 - 1051, n=55, last 2 years) | |
| Asus ROG Flow Z13 GZ301ZE | |
| 7-Zip 18.03 / 7z b 4 | |
| Asus ROG Flow Z13 GZ301ZE | |
| Average of class Convertible (12977 - 121368, n=56, last 2 years) | |
| Microsoft Surface Pro 9, i7-1255U | |
| Dell XPS 13 9315 2-in-1 Core i5-1230U | |
| HP Elite Dragonfly Folio 13.5 G3 | |
| Average Intel Core i7-1255U (24126 - 37365, n=11) | |
| Microsoft Surface Pro 8, i7-1185G7 | |
| Lenovo ThinkPad X12 20UVS03G00 | |
| 7-Zip 18.03 / 7z b 4 -mmt1 | |
| Asus ROG Flow Z13 GZ301ZE | |
| Average Intel Core i7-1255U (5059 - 5529, n=11) | |
| Average of class Convertible (3672 - 6540, n=56, last 2 years) | |
| HP Elite Dragonfly Folio 13.5 G3 | |
| Microsoft Surface Pro 8, i7-1185G7 | |
| Microsoft Surface Pro 9, i7-1255U | |
| Dell XPS 13 9315 2-in-1 Core i5-1230U | |
| Geekbench 5.5 / Multi-Core | |
| Asus ROG Flow Z13 GZ301ZE | |
| Average of class Convertible (2188 - 22023, n=55, last 2 years) | |
| Apple MacBook Air M2 10C GPU | |
| Microsoft Surface Pro 9, i7-1255U | |
| HP Elite Dragonfly Folio 13.5 G3 | |
| Average Intel Core i7-1255U (4463 - 8821, n=12) | |
| Dell XPS 13 9315 2-in-1 Core i5-1230U | |
| Microsoft Surface Pro 8, i7-1185G7 | |
| Lenovo ThinkPad X12 20UVS03G00 | |
| Geekbench 5.5 / Single-Core | |
| Apple MacBook Air M2 10C GPU | |
| Asus ROG Flow Z13 GZ301ZE | |
| Average of class Convertible (806 - 2275, n=55, last 2 years) | |
| Microsoft Surface Pro 9, i7-1255U | |
| HP Elite Dragonfly Folio 13.5 G3 | |
| Average Intel Core i7-1255U (1560 - 1712, n=12) | |
| Microsoft Surface Pro 8, i7-1185G7 | |
| Dell XPS 13 9315 2-in-1 Core i5-1230U | |
| Lenovo ThinkPad X12 20UVS03G00 | |
| HWBOT x265 Benchmark v2.2 / 4k Preset | |
| Asus ROG Flow Z13 GZ301ZE | |
| Average of class Convertible (3.43 - 36.2, n=56, last 2 years) | |
| Microsoft Surface Pro 9, i7-1255U | |
| HP Elite Dragonfly Folio 13.5 G3 | |
| Average Intel Core i7-1255U (6.31 - 10.1, n=11) | |
| Dell XPS 13 9315 2-in-1 Core i5-1230U | |
| Microsoft Surface Pro 8, i7-1185G7 | |
| Lenovo ThinkPad X12 20UVS03G00 | |
| LibreOffice / 20 Documents To PDF | |
| Lenovo ThinkPad X12 20UVS03G00 | |
| Average of class Convertible (42.5 - 84.3, n=55, last 2 years) | |
| Microsoft Surface Pro 9, i7-1255U | |
| Dell XPS 13 9315 2-in-1 Core i5-1230U | |
| Microsoft Surface Pro 8, i7-1185G7 | |
| HP Elite Dragonfly Folio 13.5 G3 | |
| Average Intel Core i7-1255U (35.6 - 52.5, n=11) | |
| Asus ROG Flow Z13 GZ301ZE | |
| R Benchmark 2.5 / Overall mean | |
| Lenovo ThinkPad X12 20UVS03G00 | |
| Microsoft Surface Pro 8, i7-1185G7 | |
| Dell XPS 13 9315 2-in-1 Core i5-1230U | |
| Microsoft Surface Pro 9, i7-1255U | |
| Average Intel Core i7-1255U (0.4688 - 0.558, n=11) | |
| Average of class Convertible (0.3985 - 0.84, n=55, last 2 years) | |
| HP Elite Dragonfly Folio 13.5 G3 | |
| Asus ROG Flow Z13 GZ301ZE | |
* ... smaller is better
AIDA64: FP32 Ray-Trace | FPU Julia | CPU SHA3 | CPU Queen | FPU SinJulia | FPU Mandel | CPU AES | CPU ZLib | FP64 Ray-Trace | CPU PhotoWorxx
| Performance rating | |
| Average of class Convertible | |
| Asus ROG Flow Z13 GZ301ZE | |
| Microsoft Surface Pro 9, i7-1255U | |
| HP Elite Dragonfly Folio 13.5 G3 | |
| Average Intel Core i7-1255U | |
| Microsoft Surface Pro 8, i7-1185G7 | |
| Dell XPS 13 9315 2-in-1 Core i5-1230U | |
| Lenovo ThinkPad X12 20UVS03G00 | |
| AIDA64 / FP32 Ray-Trace | |
| Average of class Convertible (1480 - 64158, n=55, last 2 years) | |
| Microsoft Surface Pro 9, i7-1255U | |
| Asus ROG Flow Z13 GZ301ZE | |
| Microsoft Surface Pro 8, i7-1185G7 | |
| Average Intel Core i7-1255U (4313 - 8127, n=11) | |
| HP Elite Dragonfly Folio 13.5 G3 | |
| Dell XPS 13 9315 2-in-1 Core i5-1230U | |
| Lenovo ThinkPad X12 20UVS03G00 | |
| AIDA64 / FPU Julia | |
| Average of class Convertible (11392 - 183760, n=55, last 2 years) | |
| Microsoft Surface Pro 9, i7-1255U | |
| Asus ROG Flow Z13 GZ301ZE | |
| HP Elite Dragonfly Folio 13.5 G3 | |
| Average Intel Core i7-1255U (19813 - 41353, n=11) | |
| Dell XPS 13 9315 2-in-1 Core i5-1230U | |
| Microsoft Surface Pro 8, i7-1185G7 | |
| Lenovo ThinkPad X12 20UVS03G00 | |
| AIDA64 / CPU SHA3 | |
| Average of class Convertible (797 - 8151, n=55, last 2 years) | |
| Asus ROG Flow Z13 GZ301ZE | |
| Microsoft Surface Pro 9, i7-1255U | |
| Microsoft Surface Pro 8, i7-1185G7 | |
| Average Intel Core i7-1255U (1325 - 2135, n=11) | |
| HP Elite Dragonfly Folio 13.5 G3 | |
| Dell XPS 13 9315 2-in-1 Core i5-1230U | |
| Lenovo ThinkPad X12 20UVS03G00 | |
| AIDA64 / CPU Queen | |
| Asus ROG Flow Z13 GZ301ZE | |
| Microsoft Surface Pro 9, i7-1255U | |
| HP Elite Dragonfly Folio 13.5 G3 | |
| Average Intel Core i7-1255U (61375 - 65892, n=11) | |
| Average of class Convertible (14686 - 145339, n=55, last 2 years) | |
| Dell XPS 13 9315 2-in-1 Core i5-1230U | |
| Microsoft Surface Pro 8, i7-1185G7 | |
| Lenovo ThinkPad X12 20UVS03G00 | |
| AIDA64 / FPU SinJulia | |
| Asus ROG Flow Z13 GZ301ZE | |
| Average of class Convertible (1120 - 29155, n=55, last 2 years) | |
| Microsoft Surface Pro 9, i7-1255U | |
| Microsoft Surface Pro 8, i7-1185G7 | |
| Average Intel Core i7-1255U (3577 - 5095, n=11) | |
| HP Elite Dragonfly Folio 13.5 G3 | |
| Dell XPS 13 9315 2-in-1 Core i5-1230U | |
| Lenovo ThinkPad X12 20UVS03G00 | |
| AIDA64 / FPU Mandel | |
| Average of class Convertible (4929 - 97193, n=55, last 2 years) | |
| Asus ROG Flow Z13 GZ301ZE | |
| Microsoft Surface Pro 9, i7-1255U | |
| Microsoft Surface Pro 8, i7-1185G7 | |
| HP Elite Dragonfly Folio 13.5 G3 | |
| Average Intel Core i7-1255U (11759 - 20187, n=11) | |
| Dell XPS 13 9315 2-in-1 Core i5-1230U | |
| Lenovo ThinkPad X12 20UVS03G00 | |
| AIDA64 / CPU AES | |
| Asus ROG Flow Z13 GZ301ZE | |
| Lenovo ThinkPad X12 20UVS03G00 | |
| Average of class Convertible (15752 - 139734, n=55, last 2 years) | |
| Microsoft Surface Pro 9, i7-1255U | |
| Microsoft Surface Pro 8, i7-1185G7 | |
| Average Intel Core i7-1255U (27900 - 67458, n=11) | |
| HP Elite Dragonfly Folio 13.5 G3 | |
| Dell XPS 13 9315 2-in-1 Core i5-1230U | |
| AIDA64 / CPU ZLib | |
| Asus ROG Flow Z13 GZ301ZE | |
| Average of class Convertible (218 - 2001, n=55, last 2 years) | |
| Microsoft Surface Pro 9, i7-1255U | |
| Average Intel Core i7-1255U (393 - 640, n=11) | |
| HP Elite Dragonfly Folio 13.5 G3 | |
| Dell XPS 13 9315 2-in-1 Core i5-1230U | |
| Microsoft Surface Pro 8, i7-1185G7 | |
| Lenovo ThinkPad X12 20UVS03G00 | |
| AIDA64 / FP64 Ray-Trace | |
| Average of class Convertible (1169 - 34297, n=55, last 2 years) | |
| Asus ROG Flow Z13 GZ301ZE | |
| Microsoft Surface Pro 9, i7-1255U | |
| Microsoft Surface Pro 8, i7-1185G7 | |
| HP Elite Dragonfly Folio 13.5 G3 | |
| Average Intel Core i7-1255U (2474 - 4400, n=11) | |
| Dell XPS 13 9315 2-in-1 Core i5-1230U | |
| Lenovo ThinkPad X12 20UVS03G00 | |
| AIDA64 / CPU PhotoWorxx | |
| Microsoft Surface Pro 9, i7-1255U | |
| Asus ROG Flow Z13 GZ301ZE | |
| Average of class Convertible (14193 - 81626, n=55, last 2 years) | |
| HP Elite Dragonfly Folio 13.5 G3 | |
| Microsoft Surface Pro 8, i7-1185G7 | |
| Lenovo ThinkPad X12 20UVS03G00 | |
| Dell XPS 13 9315 2-in-1 Core i5-1230U | |
| Average Intel Core i7-1255U (13899 - 44054, n=11) | |
System Performance
The subjective performance of the Surface Pro 9 is very good and all inputs are implemented without delays or hangs. The PCIe SSD is undoubtedly responsible for this. The performance in the synthetic benchmarks is also very good.
CrossMark: Overall | Productivity | Creativity | Responsiveness
Jetstream 2: 2.0 Total Score
Speedometer 2.0: Result 2.0
WebXPRT 3: Overall
WebXPRT 4: Overall
| PCMark 10 / Score | |
| Average of class Convertible (3229 - 9125, n=53, last 2 years) | |
| Asus ROG Flow Z13 GZ301ZE | |
| HP Elite Dragonfly Folio 13.5 G3 | |
| Average Intel Core i7-1255U, Intel Iris Xe Graphics G7 96EUs (4676 - 5523, n=9) | |
| Microsoft Surface Pro 9, i7-1255U | |
| Microsoft Surface Pro 8, i7-1185G7 | |
| Dell XPS 13 9315 2-in-1 Core i5-1230U | |
| Lenovo ThinkPad X12 20UVS03G00 | |
| PCMark 10 / Essentials | |
| HP Elite Dragonfly Folio 13.5 G3 | |
| Asus ROG Flow Z13 GZ301ZE | |
| Average of class Convertible (7233 - 12222, n=53, last 2 years) | |
| Average Intel Core i7-1255U, Intel Iris Xe Graphics G7 96EUs (9381 - 11654, n=9) | |
| Dell XPS 13 9315 2-in-1 Core i5-1230U | |
| Microsoft Surface Pro 9, i7-1255U | |
| Lenovo ThinkPad X12 20UVS03G00 | |
| Microsoft Surface Pro 8, i7-1185G7 | |
| PCMark 10 / Productivity | |
| Asus ROG Flow Z13 GZ301ZE | |
| Average of class Convertible (5062 - 10643, n=53, last 2 years) | |
| HP Elite Dragonfly Folio 13.5 G3 | |
| Average Intel Core i7-1255U, Intel Iris Xe Graphics G7 96EUs (6530 - 7418, n=9) | |
| Dell XPS 13 9315 2-in-1 Core i5-1230U | |
| Microsoft Surface Pro 9, i7-1255U | |
| Microsoft Surface Pro 8, i7-1185G7 | |
| Lenovo ThinkPad X12 20UVS03G00 | |
| PCMark 10 / Digital Content Creation | |
| Average of class Convertible (2496 - 16551, n=53, last 2 years) | |
| Asus ROG Flow Z13 GZ301ZE | |
| HP Elite Dragonfly Folio 13.5 G3 | |
| Microsoft Surface Pro 9, i7-1255U | |
| Average Intel Core i7-1255U, Intel Iris Xe Graphics G7 96EUs (4498 - 6203, n=9) | |
| Microsoft Surface Pro 8, i7-1185G7 | |
| Dell XPS 13 9315 2-in-1 Core i5-1230U | |
| Lenovo ThinkPad X12 20UVS03G00 | |
| CrossMark / Overall | |
| Asus ROG Flow Z13 GZ301ZE | |
| HP Elite Dragonfly Folio 13.5 G3 | |
| Apple iPad Pro 12.9 2022 | |
| Average of class Convertible (524 - 2274, n=56, last 2 years) | |
| Microsoft Surface Pro 9, i7-1255U | |
| Average Intel Core i7-1255U, Intel Iris Xe Graphics G7 96EUs (1329 - 1573, n=9) | |
| Microsoft Surface Pro 8, i7-1185G7 | |
| Dell XPS 13 9315 2-in-1 Core i5-1230U | |
| CrossMark / Productivity | |
| Asus ROG Flow Z13 GZ301ZE | |
| HP Elite Dragonfly Folio 13.5 G3 | |
| Average of class Convertible (554 - 1925, n=56, last 2 years) | |
| Microsoft Surface Pro 9, i7-1255U | |
| Average Intel Core i7-1255U, Intel Iris Xe Graphics G7 96EUs (1364 - 1554, n=9) | |
| Apple iPad Pro 12.9 2022 | |
| Microsoft Surface Pro 8, i7-1185G7 | |
| Dell XPS 13 9315 2-in-1 Core i5-1230U | |
| CrossMark / Creativity | |
| Asus ROG Flow Z13 GZ301ZE | |
| Apple iPad Pro 12.9 2022 | |
| Average of class Convertible (550 - 2949, n=56, last 2 years) | |
| HP Elite Dragonfly Folio 13.5 G3 | |
| Microsoft Surface Pro 9, i7-1255U | |
| Average Intel Core i7-1255U, Intel Iris Xe Graphics G7 96EUs (1372 - 1660, n=9) | |
| Microsoft Surface Pro 8, i7-1185G7 | |
| Dell XPS 13 9315 2-in-1 Core i5-1230U | |
| CrossMark / Responsiveness | |
| Asus ROG Flow Z13 GZ301ZE | |
| HP Elite Dragonfly Folio 13.5 G3 | |
| Microsoft Surface Pro 9, i7-1255U | |
| Average of class Convertible (381 - 1719, n=56, last 2 years) | |
| Average Intel Core i7-1255U, Intel Iris Xe Graphics G7 96EUs (1117 - 1434, n=9) | |
| Dell XPS 13 9315 2-in-1 Core i5-1230U | |
| Apple iPad Pro 12.9 2022 | |
| Microsoft Surface Pro 8, i7-1185G7 | |
| Jetstream 2 / 2.0 Total Score | |
| Average of class Convertible (127.2 - 430, n=16, last 2 years) | |
| Microsoft Surface Pro 9, i7-1255U | |
| Average Intel Core i7-1255U, Intel Iris Xe Graphics G7 96EUs (206 - 249, n=7) | |
| Dell XPS 13 9315 2-in-1 Core i5-1230U | |
| Apple iPad Pro 12.9 2022 | |
| Asus ROG Flow Z13 GZ301ZE | |
| Microsoft Surface Pro 8, i7-1185G7 | |
| Lenovo ThinkPad X12 20UVS03G00 | |
| Speedometer 2.0 / Result 2.0 | |
| Apple iPad Pro 12.9 2022 | |
| Average of class Convertible (168.2 - 513, n=14, last 2 years) | |
| Average Intel Core i7-1255U, Intel Iris Xe Graphics G7 96EUs (222 - 299, n=5) | |
| Microsoft Surface Pro 9, i7-1255U | |
| Microsoft Surface Pro 8, i7-1185G7 | |
| Asus ROG Flow Z13 GZ301ZE | |
| WebXPRT 3 / Overall | |
| Apple iPad Pro 12.9 2022 | |
| Asus ROG Flow Z13 GZ301ZE | |
| Average of class Convertible (171 - 426, n=57, last 2 years) | |
| HP Elite Dragonfly Folio 13.5 G3 | |
| Average Intel Core i7-1255U, Intel Iris Xe Graphics G7 96EUs (200 - 366, n=9) | |
| Microsoft Surface Pro 9, i7-1255U | |
| Microsoft Surface Pro 8, i7-1185G7 | |
| Dell XPS 13 9315 2-in-1 Core i5-1230U | |
| Lenovo ThinkPad X12 20UVS03G00 | |
| WebXPRT 4 / Overall | |
| Average of class Convertible (91.2 - 317, n=56, last 2 years) | |
| HP Elite Dragonfly Folio 13.5 G3 | |
| Average Intel Core i7-1255U, Intel Iris Xe Graphics G7 96EUs (183.4 - 249, n=9) | |
| Microsoft Surface Pro 9, i7-1255U | |
| Apple iPad Pro 12.9 2022 | |
| Dell XPS 13 9315 2-in-1 Core i5-1230U | |
| PCMark 10 Score | 5257 points | |
Help | ||
| AIDA64 / Memory Copy | |
| Average of class Convertible (23880 - 158525, n=55, last 2 years) | |
| Asus ROG Flow Z13 GZ301ZE | |
| Microsoft Surface Pro 9, i7-1255U | |
| HP Elite Dragonfly Folio 13.5 G3 | |
| Dell XPS 13 9315 2-in-1 Core i5-1230U | |
| Microsoft Surface Pro 8, i7-1185G7 | |
| Lenovo ThinkPad X12 20UVS03G00 | |
| Average Intel Core i7-1255U (22846 - 67017, n=11) | |
| AIDA64 / Memory Read | |
| Average of class Convertible (19931 - 126725, n=55, last 2 years) | |
| Asus ROG Flow Z13 GZ301ZE | |
| HP Elite Dragonfly Folio 13.5 G3 | |
| Microsoft Surface Pro 9, i7-1255U | |
| Microsoft Surface Pro 8, i7-1185G7 | |
| Lenovo ThinkPad X12 20UVS03G00 | |
| Dell XPS 13 9315 2-in-1 Core i5-1230U | |
| Average Intel Core i7-1255U (22877 - 67398, n=11) | |
| AIDA64 / Memory Write | |
| Average of class Convertible (17473 - 216896, n=55, last 2 years) | |
| HP Elite Dragonfly Folio 13.5 G3 | |
| Dell XPS 13 9315 2-in-1 Core i5-1230U | |
| Asus ROG Flow Z13 GZ301ZE | |
| Microsoft Surface Pro 9, i7-1255U | |
| Lenovo ThinkPad X12 20UVS03G00 | |
| Microsoft Surface Pro 8, i7-1185G7 | |
| Average Intel Core i7-1255U (22883 - 65839, n=11) | |
| AIDA64 / Memory Latency | |
| Average of class Convertible (6.9 - 536, n=54, last 2 years) | |
| HP Elite Dragonfly Folio 13.5 G3 | |
| Asus ROG Flow Z13 GZ301ZE | |
| Dell XPS 13 9315 2-in-1 Core i5-1230U | |
| Microsoft Surface Pro 9, i7-1255U | |
| Microsoft Surface Pro 8, i7-1185G7 | |
| Lenovo ThinkPad X12 20UVS03G00 | |
| Average Intel Core i7-1255U (76 - 163.2, n=11) | |
* ... smaller is better
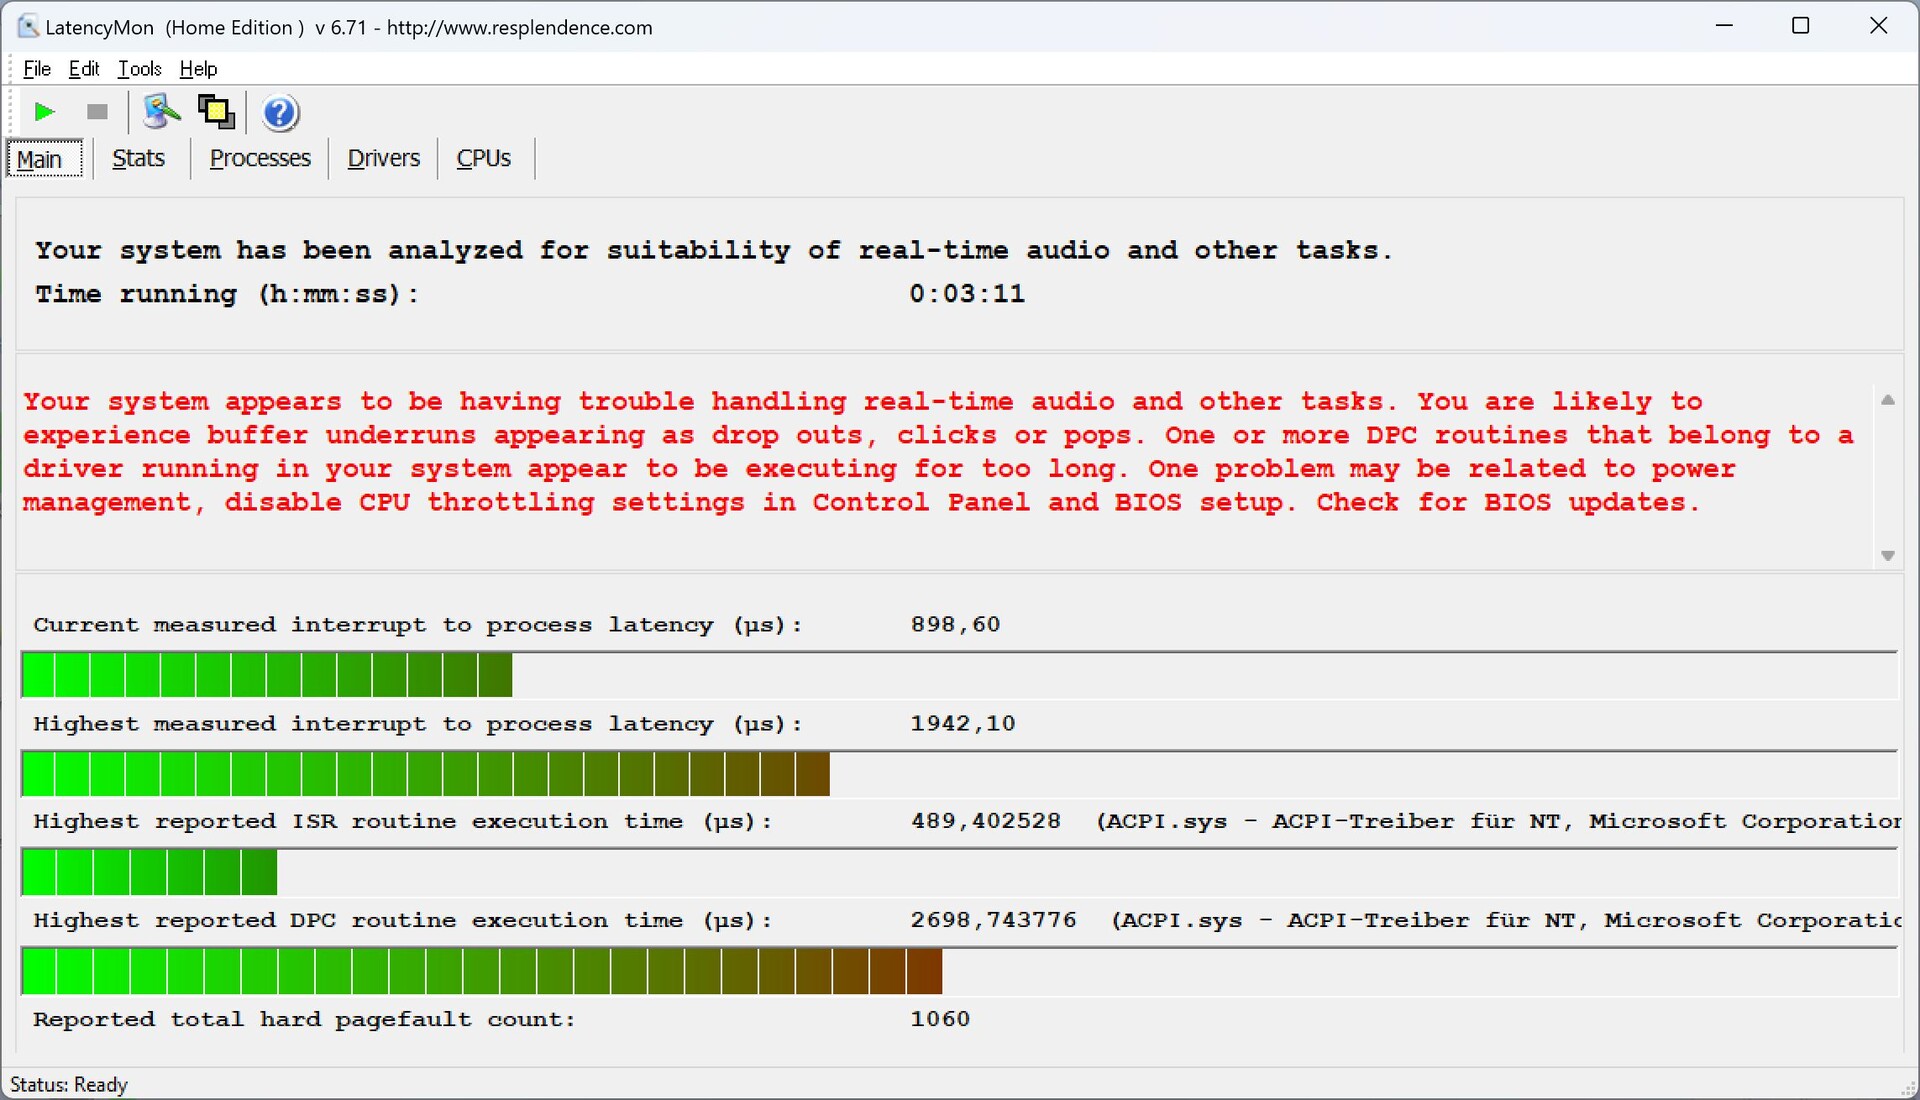
DPC Latency
In our standardized latency test (web browsing, YouTube 4K playback, CPU load), the new Surface Pro 9 with its current BIOS version performs worse than its predecessor and is thus only conditionally suitable for real-time audio applications.

| DPC Latencies / LatencyMon - interrupt to process latency (max), Web, Youtube, Prime95 | |
| HP Elite Dragonfly Folio 13.5 G3 | |
| Dell XPS 13 9315 2-in-1 Core i5-1230U | |
| Microsoft Surface Pro 9, i7-1255U | |
| Asus ROG Flow Z13 GZ301ZE | |
| Microsoft Surface Pro 8, i7-1185G7 | |
| Lenovo ThinkPad X12 20UVS03G00 | |
* ... smaller is better
Storage Devices

Microsoft still uses compact M.2-2230 SSDs and the devices can also be replaced by the user. A 512 GB drive from Samsung is used in our review sample, which, according to Microsoft Tools, appears to be connected via PCIe 4.0. However, the maximum transfer rates are limited to around 3.4 GB/s and we don't know exactly whether the SSD or the Surface Pro is the cause here. Then again, this does not play a major role in everyday use and the speed is perfectly sufficient. Of the 512 GB, 429 GB is still available after installation of the operating system. More SSD benchmarks are listed in our tech section.

* ... smaller is better
Dauerleistung Lesen: DiskSpd Read Loop, Queue Depth 8
Graphics Card

Intel's Alder Lake CPUs are still equipped with the well-known Iris Xe Graphics G7. In conjunction with the Core i5 1235U, the chip with 80 execution units is used; in our review sample with the Core i7, we have the faster chip with 96 EUs. In terms of performance, there are no differences to the old model and the integrated GPUs from AMD and Apple are significantly faster (although there are practically no comparable convertibles/tablets with AMD hardware at present).
The performance is perfectly sufficient for everyday use and high-resolution videos also run without issue, but gaming is usually limited to minimum or medium details and reduced resolutions. Those who are keen gamers can either connect an external GPU or should take a look at the ROG Flow Z13, which offers more gaming performance with its RTX 3050.
At least GPU performance remains stable during long gaming sessions. On battery power, however, performance drops by about 75%. More GPU benchmarks are available here.
| 3DMark 11 Performance | 6903 points | |
| 3DMark Fire Strike Score | 4873 points | |
| 3DMark Time Spy Score | 1821 points | |
Help | ||
* ... smaller is better
| The Witcher 3 - 1920x1080 Ultra Graphics & Postprocessing (HBAO+) | |
| Asus ROG Flow Z13 GZ301ZE | |
| Average of class Convertible (11 - 101, n=21, last 2 years) | |
| Microsoft Surface Pro 8, i7-1185G7 | |
| HP Elite Dragonfly Folio 13.5 G3 | |
| Microsoft Surface Pro 9, i7-1255U | |
| Dell XPS 13 9315 2-in-1 Core i5-1230U | |
| Final Fantasy XV Benchmark - 1920x1080 High Quality | |
| Asus ROG Flow Z13 GZ301ZE | |
| Microsoft Surface Pro 8, i7-1185G7 | |
| Average of class Convertible (4.48 - 86.6, n=56, last 2 years) | |
| Microsoft Surface Pro 9, i7-1255U | |
| HP Elite Dragonfly Folio 13.5 G3 | |
| Strange Brigade - 1920x1080 ultra AA:ultra AF:16 | |
| Asus ROG Flow Z13 GZ301ZE | |
| Average of class Convertible (10.8 - 167.9, n=53, last 2 years) | |
| Microsoft Surface Pro 8, i7-1185G7 | |
| Microsoft Surface Pro 9, i7-1255U | |
| HP Elite Dragonfly Folio 13.5 G3 | |
Witcher 3 FPS Chart
| low | med. | high | ultra | |
|---|---|---|---|---|
| GTA V (2015) | 104.3 | 93.1 | 24.7 | 10.6 |
| The Witcher 3 (2015) | 91 | 59 | 33 | 12.8 |
| Dota 2 Reborn (2015) | 104.2 | 82.2 | 64.8 | 57 |
| Final Fantasy XV Benchmark (2018) | 42.9 | 24.2 | 16.8 | |
| X-Plane 11.11 (2018) | 46.3 | 36.6 | 31.6 | |
| Far Cry 5 (2018) | 28 | 24 | 20 | |
| Strange Brigade (2018) | 88.9 | 41.7 | 32.5 | 26.2 |
| F1 2021 (2021) | 107.8 | 51.6 | 40.6 | 27.8 |
| Farming Simulator 22 (2021) | 81 | 37 | 28 | 26 |
| F1 22 (2022) | 47.4 | 43.5 | 30.7 |
Emissions - Faster CPU leads to more fan activity
Noise
The fan of the Surface Pro 9 is comparable to the old Surface Pro 8 at maximum speed and reaches almost 42 dB(A) at full load. The small fan is clearly audible, but more problematic is the fact that the fan kicks in more often in everyday use due to the high power limits. You should therefore select a weaker energy mode for simple tasks, then the convertible stays quiet for longer in ordinary use. No other electronic noises were detected. Both the XPS 13 9315 and the iPad Pro have a clear advantage here, of course, as they are passively cooled and thus remain silent.
Noise level
| Idle |
| 24.3 / 24.3 / 24.3 dB(A) |
| Load |
| 37.9 / 41.8 dB(A) |
 | ||
30 dB silent 40 dB(A) audible 50 dB(A) loud |
||
min: | ||
| Microsoft Surface Pro 9, i7-1255U Iris Xe G7 96EUs, i7-1255U, Samsung MZ9L4512HBLU-00BMV | Dell XPS 13 9315 2-in-1 Core i5-1230U Iris Xe G7 80EUs, i5-1230U | Lenovo ThinkPad X12 20UVS03G00 Iris Xe G7 96EUs, i7-1160G7, Toshiba BG4 KBG40ZNT512G | HP Elite Dragonfly Folio 13.5 G3 Iris Xe G7 96EUs, i7-1265U, Samsung PM9A1 MZVL2512HCJQ | Apple iPad Pro 12.9 2022 M2 10-Core GPU, M2, 128 GB NVMe | Asus ROG Flow Z13 GZ301ZE GeForce RTX 3050 Ti Laptop GPU, i9-12900H, Micron 2450 1TB MTFDKBK1T0TFK | Microsoft Surface Pro 8, i7-1185G7 Iris Xe G7 96EUs, i7-1185G7, Toshiba KBG40ZNS256G NVMe | |
|---|---|---|---|---|---|---|---|
| Noise | 2% | 8% | -2% | -0% | |||
| off / environment * (dB) | 24.3 | 25.1 -3% | 24.6 -1% | 24.5 -1% | 24.7 -2% | ||
| Idle Minimum * (dB) | 24.3 | 25.1 -3% | 24.6 -1% | 24.5 -1% | 24.7 -2% | ||
| Idle Average * (dB) | 24.3 | 25.1 -3% | 24.6 -1% | 24.5 -1% | 24.7 -2% | ||
| Idle Maximum * (dB) | 24.3 | 26 -7% | 24.6 -1% | 24.5 -1% | 24.7 -2% | ||
| Load Average * (dB) | 37.9 | 34.6 9% | 27.8 27% | 41 -8% | 36.8 3% | ||
| Witcher 3 ultra * (dB) | 39.6 | 34.6 13% | 33.4 16% | 41 -4% | 36.8 7% | ||
| Load Maximum * (dB) | 41.8 | 37 11% | 33.4 20% | 41 2% | 43.8 -5% |
* ... smaller is better
Temperature
The metal case of the Surface Pro 9 hardly heats up in everyday use and during light tasks, but we measured more than 45 °C on the back under high load (e.g. high CPU load or when gaming). Due to the metal surface, this feels unpleasant and you should not hold the device in your hands in such situations, but rather place it on your thighs or a table.
The stress test shows the same behavior as in pure CPU load. After peaking at 60 watts, the processor remains at 35 watts for a few minutes before settling at 22 watts. It is interesting to note here that Microsoft even overshoots the maximum consumption of 55 watts specified (by Intel) for the Alder Lake-U CPU.

(±) The maximum temperature on the upper side is 44.6 °C / 112 F, compared to the average of 35.4 °C / 96 F, ranging from 19.6 to 60 °C for the class Convertible.
(-) The bottom heats up to a maximum of 45.9 °C / 115 F, compared to the average of 36.8 °C / 98 F
(+) In idle usage, the average temperature for the upper side is 24.6 °C / 76 F, compared to the device average of 30.3 °C / 87 F.
(-) Playing The Witcher 3, the average temperature for the upper side is 41.5 °C / 107 F, compared to the device average of 30.3 °C / 87 F.
(-) The palmrests and touchpad can get very hot to the touch with a maximum of 42.6 °C / 108.7 F.
(-) The average temperature of the palmrest area of similar devices was 27.9 °C / 82.2 F (-14.7 °C / -26.5 F).


| Microsoft Surface Pro 9, i7-1255U Intel Core i7-1255U, Intel Iris Xe Graphics G7 96EUs | Dell XPS 13 9315 2-in-1 Core i5-1230U Intel Core i5-1230U, Intel Iris Xe Graphics G7 80EUs | Lenovo ThinkPad X12 20UVS03G00 Intel Core i7-1160G7, Intel Iris Xe Graphics G7 96EUs | HP Elite Dragonfly Folio 13.5 G3 Intel Core i7-1265U, Intel Iris Xe Graphics G7 96EUs | Apple iPad Pro 12.9 2022 Apple M2, Apple M2 10-Core GPU | Asus ROG Flow Z13 GZ301ZE Intel Core i9-12900H, NVIDIA GeForce RTX 3050 Ti Laptop GPU | Microsoft Surface Pro 8, i7-1185G7 Intel Core i7-1185G7, Intel Iris Xe Graphics G7 96EUs | |
|---|---|---|---|---|---|---|---|
| Heat | 1% | 5% | 14% | -3% | -11% | 2% | |
| Maximum Upper Side * (°C) | 44.6 | 41.8 6% | 39 13% | 32.8 26% | 36.9 17% | 45.3 -2% | 45 -1% |
| Maximum Bottom * (°C) | 45.9 | 38.2 17% | 41.7 9% | 33.4 27% | 37.6 18% | 48.3 -5% | 47.2 -3% |
| Idle Upper Side * (°C) | 24.8 | 27.4 -10% | 25.6 -3% | 24.6 1% | 31.9 -29% | 29.2 -18% | 24.1 3% |
| Idle Bottom * (°C) | 25.3 | 27.2 -8% | 25.6 -1% | 24.6 3% | 29.4 -16% | 30 -19% | 23.4 8% |
* ... smaller is better
Speakers
The two stereo speakers (2 watts) are still very good and sound quite voluminous. However, you shouldn't expect too much in terms of bass, which is generally true for this device category (e.g. also for the speakers of the iPad Pro).
Microsoft Surface Pro 9, i7-1255U audio analysis
(±) | speaker loudness is average but good (79.4 dB)
Bass 100 - 315 Hz
(±) | reduced bass - on average 11.7% lower than median
(±) | linearity of bass is average (8.8% delta to prev. frequency)
Mids 400 - 2000 Hz
(±) | higher mids - on average 5.1% higher than median
(+) | mids are linear (3% delta to prev. frequency)
Highs 2 - 16 kHz
(+) | balanced highs - only 4% away from median
(+) | highs are linear (3.4% delta to prev. frequency)
Overall 100 - 16.000 Hz
(+) | overall sound is linear (14.9% difference to median)
Compared to same class
» 23% of all tested devices in this class were better, 4% similar, 73% worse
» The best had a delta of 6%, average was 20%, worst was 57%
Compared to all devices tested
» 19% of all tested devices were better, 4% similar, 77% worse
» The best had a delta of 4%, average was 24%, worst was 134%
Apple iPad Pro 12.9 2022 audio analysis
(+) | speakers can play relatively loud (84.3 dB)
Bass 100 - 315 Hz
(±) | reduced bass - on average 9.6% lower than median
(±) | linearity of bass is average (9% delta to prev. frequency)
Mids 400 - 2000 Hz
(+) | balanced mids - only 2.4% away from median
(+) | mids are linear (3.4% delta to prev. frequency)
Highs 2 - 16 kHz
(+) | balanced highs - only 1.5% away from median
(+) | highs are linear (3.2% delta to prev. frequency)
Overall 100 - 16.000 Hz
(+) | overall sound is linear (8.8% difference to median)
Compared to same class
» 2% of all tested devices in this class were better, 2% similar, 96% worse
» The best had a delta of 7%, average was 20%, worst was 129%
Compared to all devices tested
» 2% of all tested devices were better, 1% similar, 97% worse
» The best had a delta of 4%, average was 24%, worst was 134%
Dell XPS 13 9315 2-in-1 Core i5-1230U audio analysis
(±) | speaker loudness is average but good (80.3 dB)
Bass 100 - 315 Hz
(±) | reduced bass - on average 8.9% lower than median
(+) | bass is linear (5.7% delta to prev. frequency)
Mids 400 - 2000 Hz
(+) | balanced mids - only 2.2% away from median
(+) | mids are linear (5.2% delta to prev. frequency)
Highs 2 - 16 kHz
(±) | higher highs - on average 5.5% higher than median
(+) | highs are linear (6.8% delta to prev. frequency)
Overall 100 - 16.000 Hz
(+) | overall sound is linear (11.9% difference to median)
Compared to same class
» 11% of all tested devices in this class were better, 4% similar, 86% worse
» The best had a delta of 6%, average was 20%, worst was 57%
Compared to all devices tested
» 8% of all tested devices were better, 2% similar, 89% worse
» The best had a delta of 4%, average was 24%, worst was 134%
Power management - 120 Hz costs battery life
Power Consumption
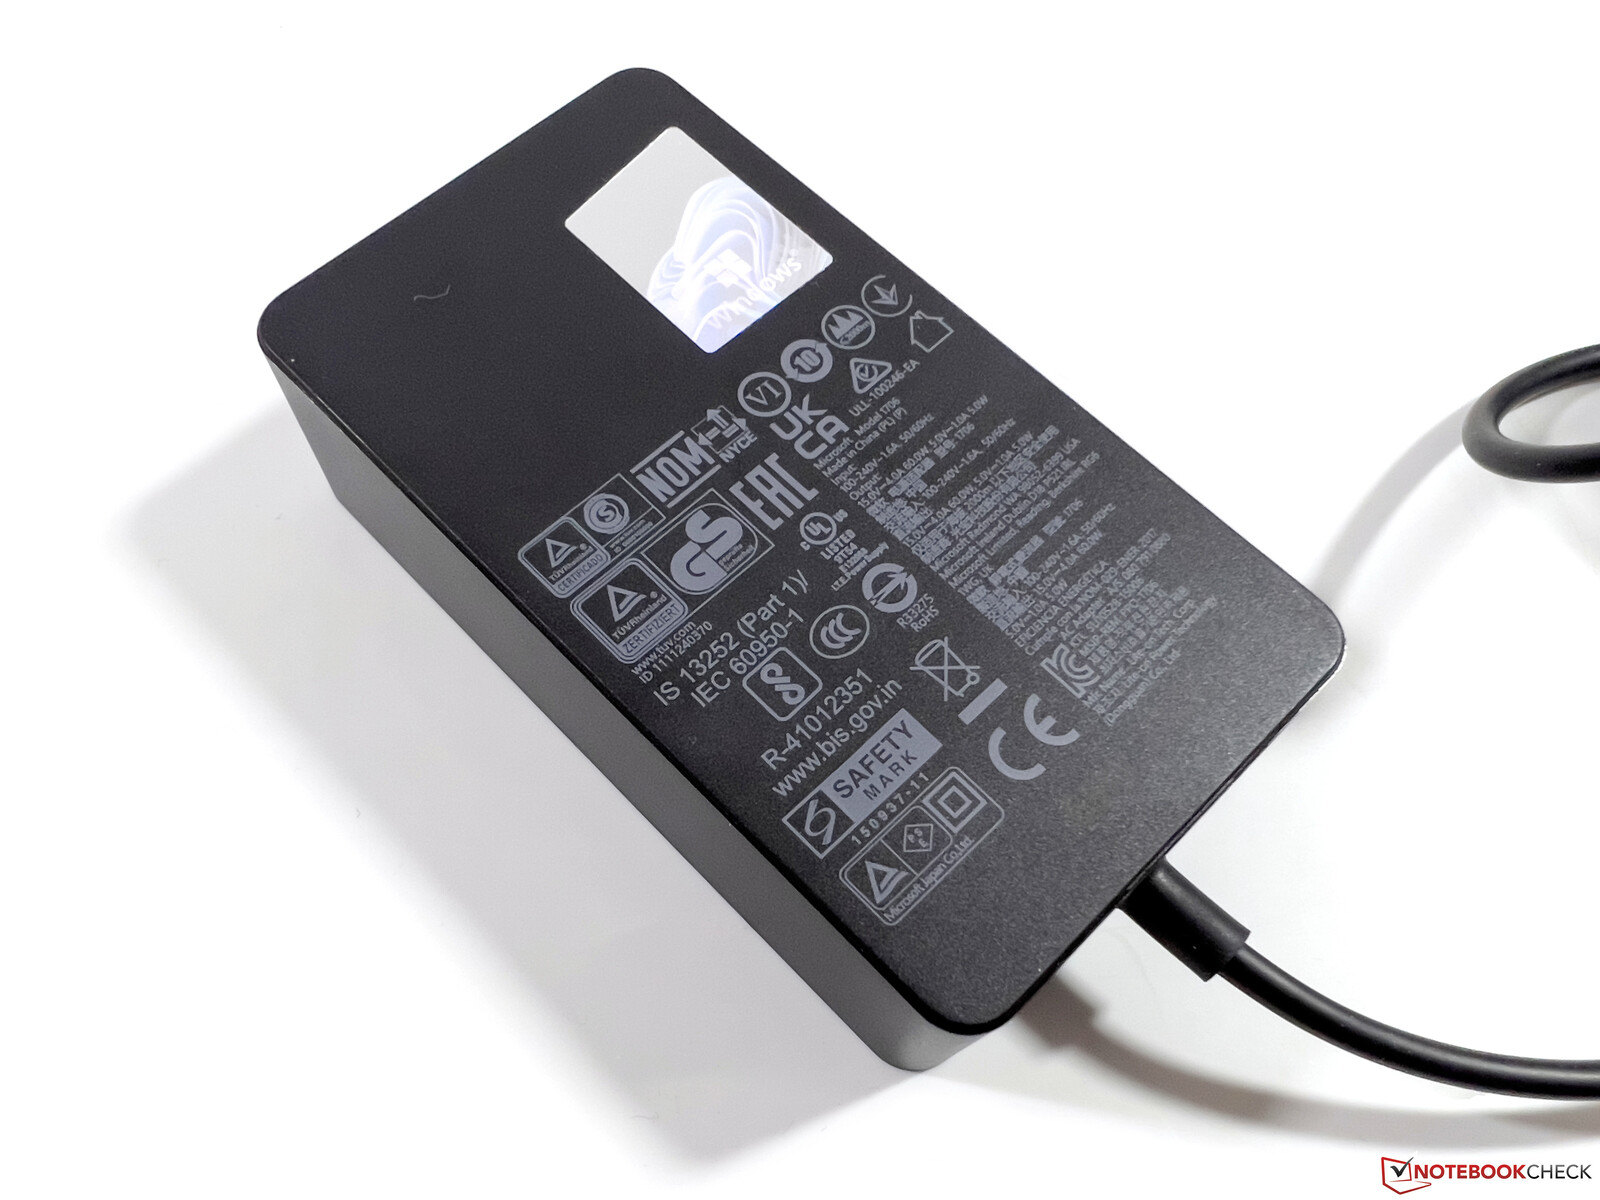
We also carried out the power measurements in 60 Hz mode, but the idle values of 5.1 to 11.3 watts are slightly higher than in the old model. The values are similar under load, but the processor's high power limits become noticeable under full load, because we reached the power supply's limit of 68 watts in the first ~30 seconds. Here, the device has to briefly tap into the battery to provide the required energy. Afterwards, consumption levels off at lower values (first ~58 and then ~46 watts), so the 60-watt power supply is still sufficient in practice.
Microsoft was able to reduce the power consumption when switched off and in standby. The power supply also offers a USB-A port, which can be used to charge a smartphone, for example (max. 5 watts).

| Off / Standby | |
| Idle | |
| Load |
|
Key:
min: | |
| Microsoft Surface Pro 9, i7-1255U i7-1255U, Iris Xe G7 96EUs, Samsung MZ9L4512HBLU-00BMV, IPS, 2880x1920, 13" | Dell XPS 13 9315 2-in-1 Core i5-1230U i5-1230U, Iris Xe G7 80EUs, , IPS, 2880x1920, 13" | Lenovo ThinkPad X12 20UVS03G00 i7-1160G7, Iris Xe G7 96EUs, Toshiba BG4 KBG40ZNT512G, a-Si IPS LED, 1920x1280, 12.3" | HP Elite Dragonfly Folio 13.5 G3 i7-1265U, Iris Xe G7 96EUs, Samsung PM9A1 MZVL2512HCJQ, IPS, 1920x1280, 13.5" | Apple iPad Pro 12.9 2022 M2, M2 10-Core GPU, 128 GB NVMe, Mini-LED, 2732x2048, 12.9" | Asus ROG Flow Z13 GZ301ZE i9-12900H, GeForce RTX 3050 Ti Laptop GPU, Micron 2450 1TB MTFDKBK1T0TFK, IPS, 1920x1200, 13.4" | Microsoft Surface Pro 8, i7-1185G7 i7-1185G7, Iris Xe G7 96EUs, Toshiba KBG40ZNS256G NVMe, IPS, 2880x1920, 13" | Average Intel Iris Xe Graphics G7 96EUs | Average of class Convertible | |
|---|---|---|---|---|---|---|---|---|---|
| Power Consumption | 22% | 26% | 19% | 36% | -54% | 7% | 3% | 12% | |
| Idle Minimum * (Watt) | 5.1 | 5.2 -2% | 4 22% | 3.4 33% | 2.54 50% | 8.8 -73% | 3.9 24% | 5.51 ? -8% | 4.43 ? 13% |
| Idle Average * (Watt) | 9.8 | 7.9 19% | 5.9 40% | 4.9 50% | 11.24 -15% | 12.1 -23% | 8.5 13% | 8.66 ? 12% | 7.38 ? 25% |
| Idle Maximum * (Watt) | 11.3 | 8 29% | 8.3 27% | 9.3 18% | 11.48 -2% | 12.7 -12% | 9.8 13% | 10.9 ? 4% | 9.78 ? 13% |
| Load Average * (Watt) | 47.5 | 31.2 34% | 30.1 37% | 41.9 12% | 12.97 73% | 72.3 -52% | 48 -1% | 45.6 ? 4% | 45 ? 5% |
| Witcher 3 ultra * (Watt) | 36 | 28.2 22% | 30.8 14% | 36.4 -1% | 77.3 -115% | 41.5 -15% | |||
| Load Maximum * (Watt) | 68.5 | 47.6 31% | 59 14% | 67.5 1% | 16.6 76% | 103.1 -51% | 63 8% | 67.8 ? 1% | 67.1 ? 2% |
* ... smaller is better
Power Consumption Witcher 3 / Stress Test
Power Consumption with an External Monitor
Battery Life
Microsoft has reduced the battery capacity from 51.5 to 47.7 Wh, but overall the runtimes are very similar to the old Surface Pro 8. At a brightness of 150 cd/m² (corresponding to 62% of the maximum brightness on the review device). In the video test, almost 9.5 hours was possible, and 7.5 hours for the Wi-Fi test. Our Wi-Fi test runs for just over 5 hours on maximum brightness.
As soon as you switch to 120 Hz mode, the runtime again drops noticeably. We have listed the values for the three scenarios in the table below. You should therefore avoid 120 Hz mode when on the road.
| WLAN test maximum brightness | WLAN test 150 cd/m² | Video test | |
|---|---|---|---|
| 60 Hz | 314 minutes | 451 minutes | 562 minutes |
| 120 Hz | 274 minutes | 369 minutes | 529 minutes |
In comparison to its competitors, the Surface Pro 9 is only ahead of the Asus ROG Flow Z13 gaming convertible, but all other competitors offer more stamina. A full charge takes around 2 hours with the device switched on, whereby 35% is available after 21 minutes and 80% after around 63 minutes.
Note: Microsoft's battery life claims are significantly higher at up to 15.5 hours of typical use, but also include times in standby mode.
| Microsoft Surface Pro 9, i7-1255U i7-1255U, Iris Xe G7 96EUs, 47.7 Wh | Dell XPS 13 9315 2-in-1 Core i5-1230U i5-1230U, Iris Xe G7 80EUs, 49.5 Wh | Lenovo ThinkPad X12 20UVS03G00 i7-1160G7, Iris Xe G7 96EUs, 42 Wh | HP Elite Dragonfly Folio 13.5 G3 i7-1265U, Iris Xe G7 96EUs, 53 Wh | Apple iPad Pro 12.9 2022 M2, M2 10-Core GPU, 40.88 Wh | Asus ROG Flow Z13 GZ301ZE i9-12900H, GeForce RTX 3050 Ti Laptop GPU, 56 Wh | Microsoft Surface Pro 8, i7-1185G7 i7-1185G7, Iris Xe G7 96EUs, 51.5 Wh | Average of class Convertible | |
|---|---|---|---|---|---|---|---|---|
| Battery runtime | 32% | 19% | 56% | 67% | -25% | -2% | 46% | |
| H.264 (h) | 9.4 | 10 6% | 13.6 45% | 6 -36% | 10.1 7% | 15.2 ? 62% | ||
| WiFi v1.3 (h) | 7.5 | 9 20% | 8.2 9% | 9.4 25% | 11.2 49% | 5.6 -25% | 7.6 1% | 11.2 ? 49% |
| Load (h) | 1.4 | 2 43% | 2 43% | 2.6 86% | 2.9 107% | 1.2 -14% | 1.2 -14% | 1.793 ? 28% |
| Witcher 3 ultra (h) | 0.8 |
Pros
Cons
Verdict: Surface Pro 9 has more power, but loses features


From the outside, the new Surface Pro 9 looks more like a small upgrade with a new processor. In detail, however, Microsoft has made some changes and not all of them are positive. First of all, we should mention that the CPU performance has increased significantly thanks to the new Alder Lake-U processor. However, some potential is still wasted here because an Alder Lake P chip with two additional performance cores generates more performance at these TDP values, as shown by our Alder Lake-U analysis.
Microsoft has given the Surface Pro 9 an up-to-date WLAN module with support for 6 GHz networks. At the same time, the LTE version of the Intel model has been dropped, since the former Surface Pro X is now also sold as the Surface Pro 9. Whether the ARM version with Windows can really be a complete replacement remains to be seen. We would have liked an optional Intel model with LTE or 5G. In this regard, we also take a critical view of Microsoft's earlier decision to remove the microSD reader for the optional SIM slot. Since the Intel model no longer has a SIM slot, a card reader could have been installed again. On the other hand, the omitted 3.5 mm jack is much more inconspicuous, but we also find this decision incomprehensible.
The new Microsoft Surface Pro 9 now offers more CPU power, but the optional WWAN model has been dropped and the audio jack removed. Furthermore, the battery life remains a weak point of the convertible.
In the other areas, performance is solid, but the display in particular needs to be updated soon. 120 Hz is very pleasant in practice, but rival devices usually offer more in terms of color space coverage and contrast ratio. Moreover, the convertible with the Core i7 is quite expensive and the basic version with the Core i5, 8 GB RAM and 256 GB SSD storage hardly fulfills the requirements of a "Pro" device in 2023.
We will also review the ARM version of the Surface Pro 9 + 5G soon and we are curious to see whether Windows now works better with the ARM SoC and whether it represents a real alternative to the Apple iPad Pro 12.9. The Dell XPS 13 9315 offers less CPU power, but it is usually sufficient for everyday use and you also benefit from the passive cooling.
Price and Availability
The Microsoft Surface Pro 9 appears to be widely available in all configurations, either directly via Microsoft's official online store or via typical suppliers such as Amazon. Our review configuration (Core i7, 16GB RAM, 512 GB) is listed at US$1.879,99 on Amazon US, and at £1,799.00 on Amazon UK. Interested buyers in Australia or Singapore, for example, can buy directly from Microsoft, where prices start at AU$1,649.00 and SG$1,608.00, respectively.
The aforementioned examples are not exhaustive. Prices are as of 25.01.2023 and subject to change.
Microsoft Surface Pro 9, i7-1255U
- 01/24/2023 v7 (old)
Andreas Osthoff
Transparency
The selection of devices to be reviewed is made by our editorial team. The test sample was provided to the author as a loan by the manufacturer or retailer for the purpose of this review. The lender had no influence on this review, nor did the manufacturer receive a copy of this review before publication. There was no obligation to publish this review. As an independent media company, Notebookcheck is not subjected to the authority of manufacturers, retailers or publishers.
This is how Notebookcheck is testing
Every year, Notebookcheck independently reviews hundreds of laptops and smartphones using standardized procedures to ensure that all results are comparable. We have continuously developed our test methods for around 20 years and set industry standards in the process. In our test labs, high-quality measuring equipment is utilized by experienced technicians and editors. These tests involve a multi-stage validation process. Our complex rating system is based on hundreds of well-founded measurements and benchmarks, which maintains objectivity. Further information on our test methods can be found here.
Price comparison

