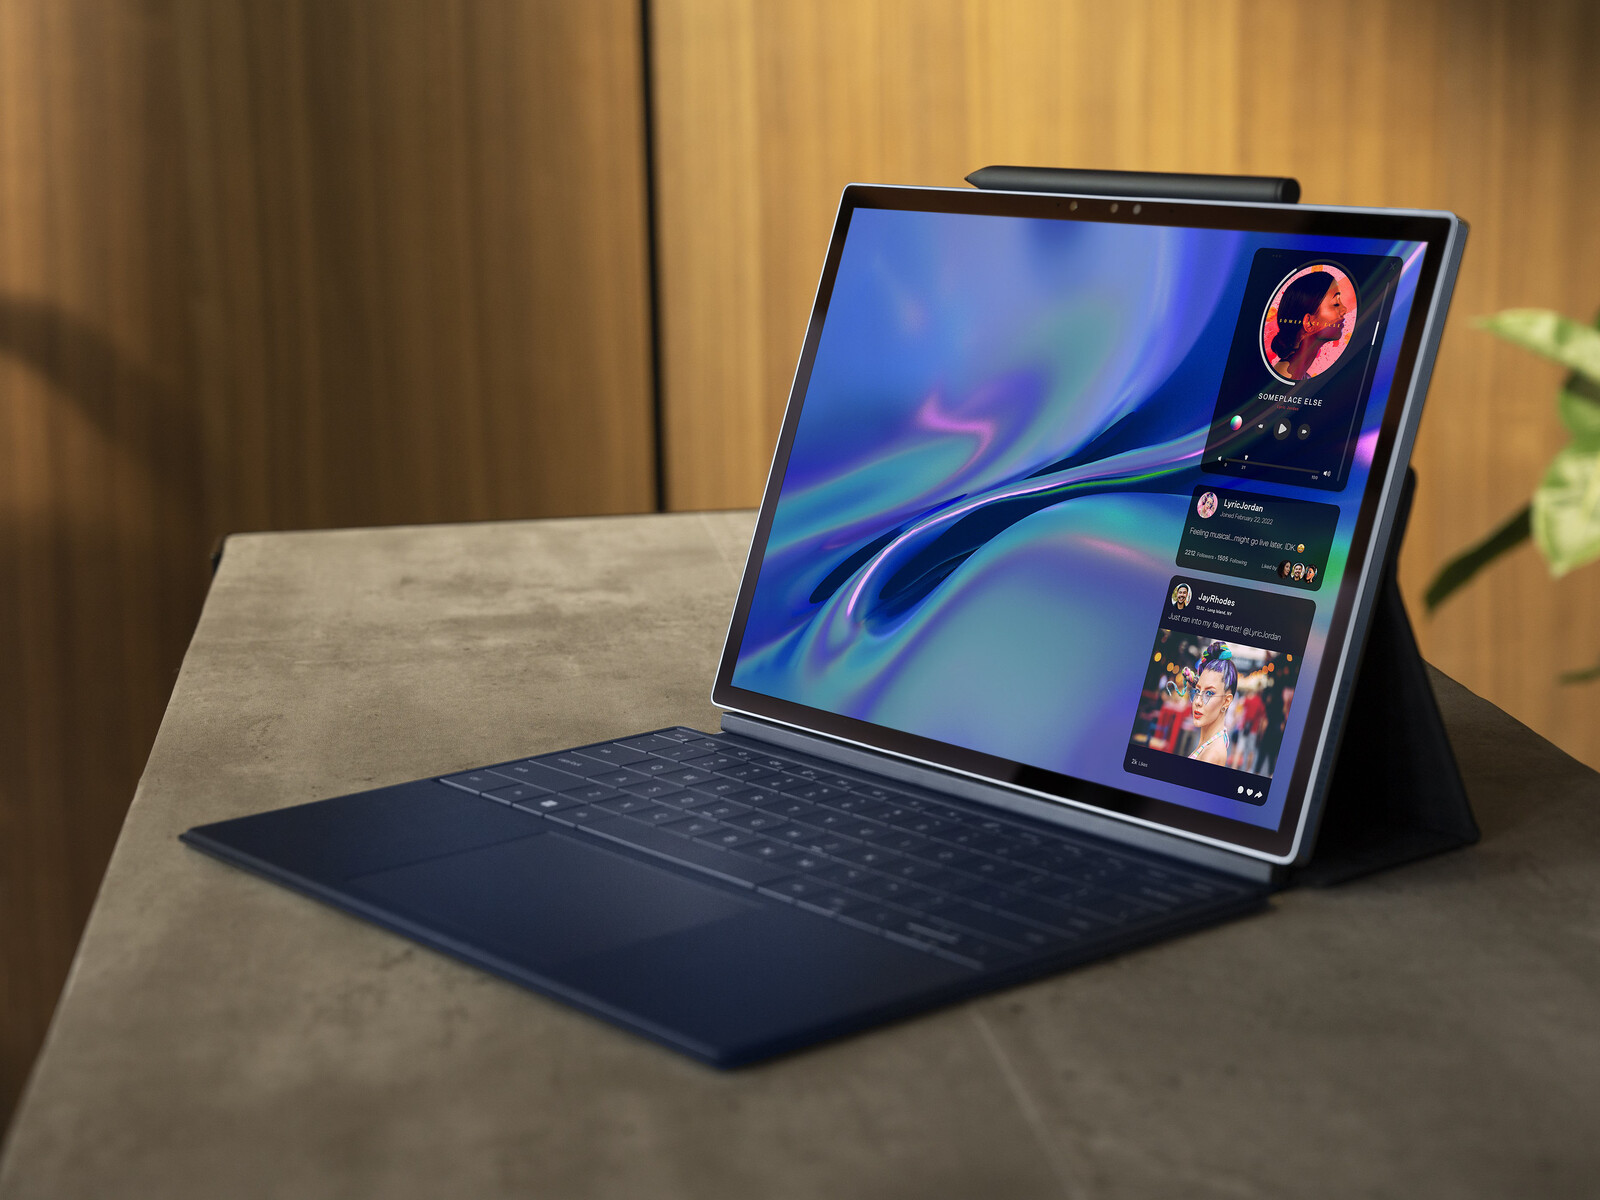
The Dell Surface Pro 8: XPS 13 9315 2-in-1 convertible review
Dell unveiled three distinct XPS 13 models at CES 2022: the XPS 13 9320 Plus clamshell, XPS 13 9315 clamshell, and XPS 13 9315 2-in-1. After reviewing the two clamshell models, we're now ready to tackle the 2-in-1 model which just so happens to be the first detachable XPS model in almost a decade.
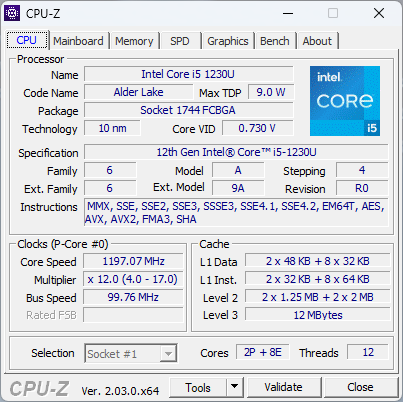
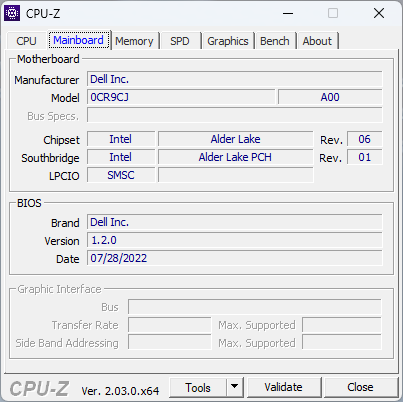
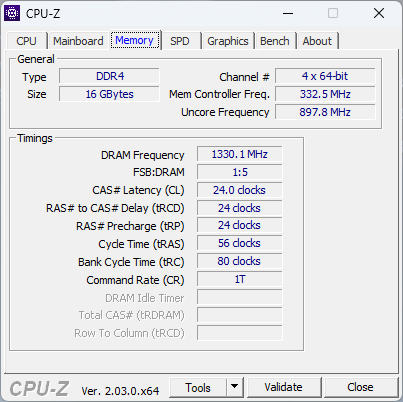
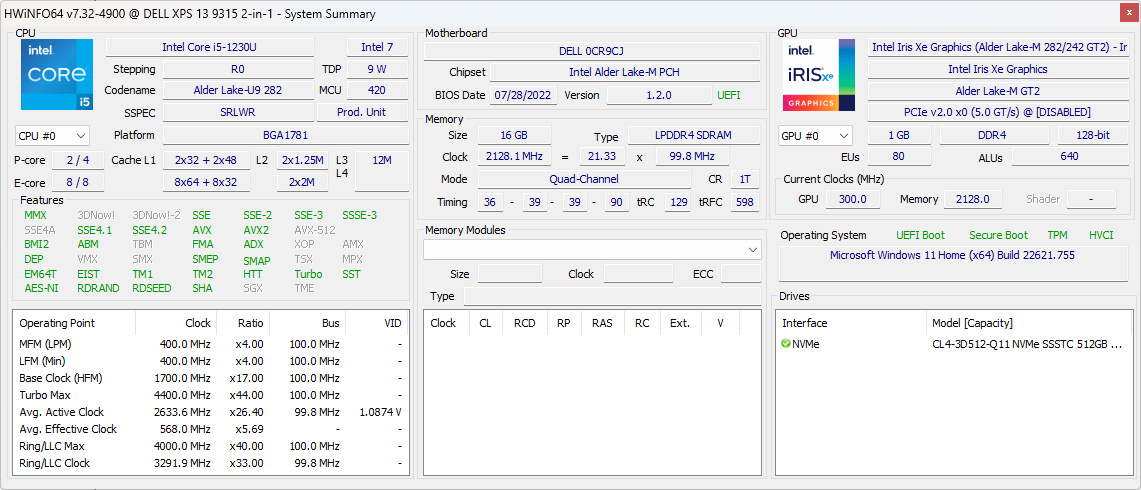
Our configuration in review comes equipped with the 12th gen Alder Lake Core i5-1230U CPU, 16 GB LPDDR4x RAM, and 512 GB NVMe SSD for approximately $1400 USD. Other SKUs with the Core i7-1250U CPU, 5G eSIM, and various RAM/SSD capacities are also available, but all options otherwise come with the same 3:2 2880 x 1920 IPS touchscreen.
Direct competitors in this space include other Windows tablets or detachables most notably the Microsoft Surface Pro 8 and the more expensive HP Elite x2 series to a lesser extent.
More Dell reviews:
Potential Competitors in Comparison
Rating | Date | Model | Weight | Height | Size | Resolution | Price |
|---|---|---|---|---|---|---|---|
| 90.1 % v7 (old) | 11 / 2022 | Dell XPS 13 9315 2-in-1 Core i5-1230U i5-1230U, Iris Xe G7 80EUs | 764 g | 7.4 mm | 13.00" | 2880x1920 | |
| 87.3 % v7 (old) | 09 / 2022 | Dell XPS 13 Plus 9320 i7-1280P OLED i7-1280P, Iris Xe G7 96EUs | 1.3 kg | 15.28 mm | 13.40" | 3456x2160 | |
| 89.1 % v7 (old) | 11 / 2021 | Microsoft Surface Pro 8, i7-1185G7 i7-1185G7, Iris Xe G7 96EUs | 891 g | 8.5 mm | 13.00" | 2880x1920 | |
| 90.3 % v7 (old) | 08 / 2022 | HP Spectre x360 13.5 14t-ef000 i7-1255U, Iris Xe G7 96EUs | 1.4 kg | 17 mm | 13.50" | 3000x2000 | |
| 86.1 % v7 (old) | 10 / 2021 | Lenovo ThinkBook Plus Gen2 Core i5 i5-1130G7, Iris Xe G7 80EUs | 1.2 kg | 13.9 mm | 13.30" | 2560x1600 | |
| 92.3 % v7 (old) | 07 / 2022 | Apple MacBook Air M2 Entry M2, M2 8-Core GPU | 1.2 kg | 11.3 mm | 13.60" | 2560x1664 |
Case — Lighter Than A Surface Pro 8
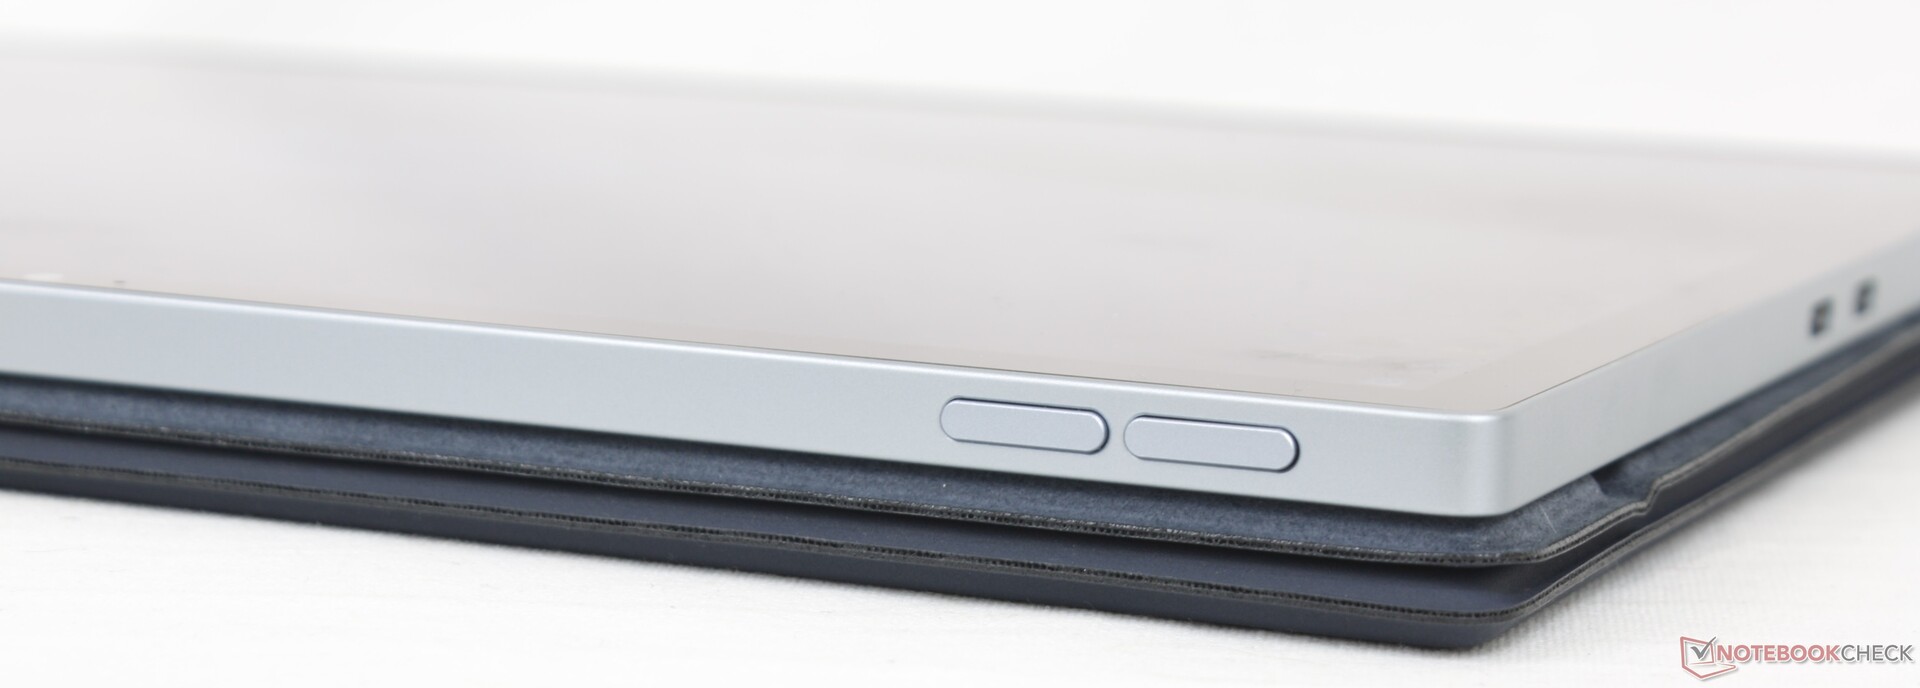
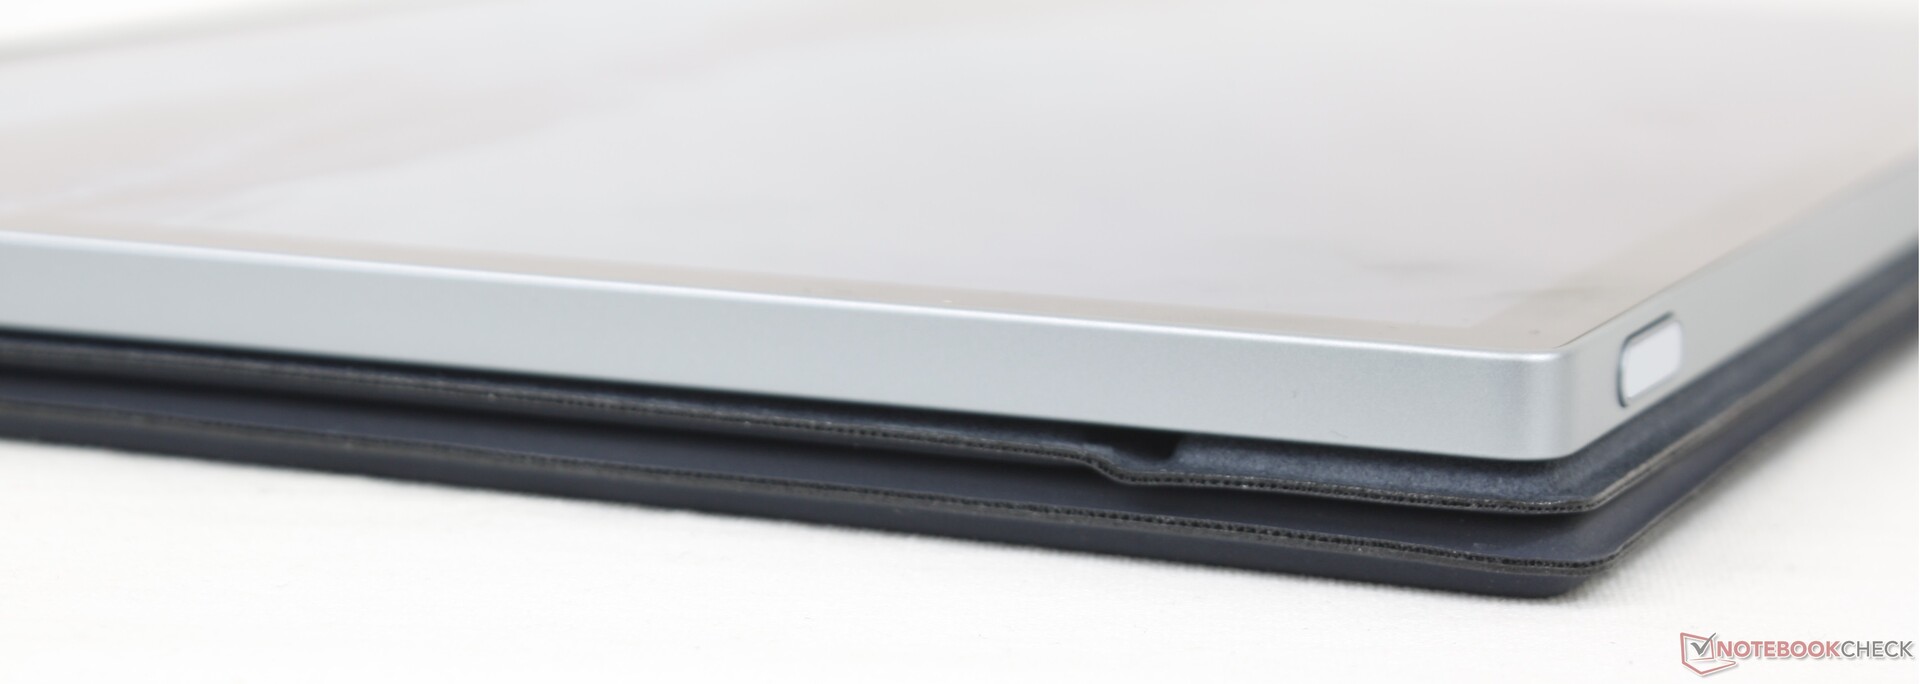
The skeleton is aluminum on the back and edges while the front is edge-to-edge Gorilla Glass. It's a sturdy, high quality matte finish as one would expect with a color and texture similar to the outer lids of the XPS 13 9300 or XPS 15 series. There is very slight warping when attempting to twist the unit, but it's not enough to be on any concern.
Applying pressure on the center of the back results in slight depressions and audible noises. This is likely due to the small air gap between the outer shell and inner components which is again nothing to worry about.
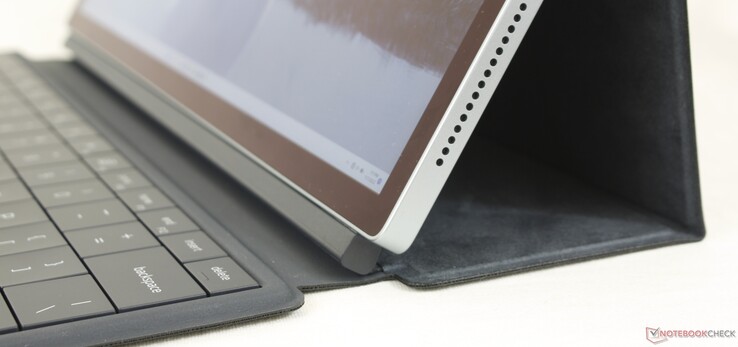
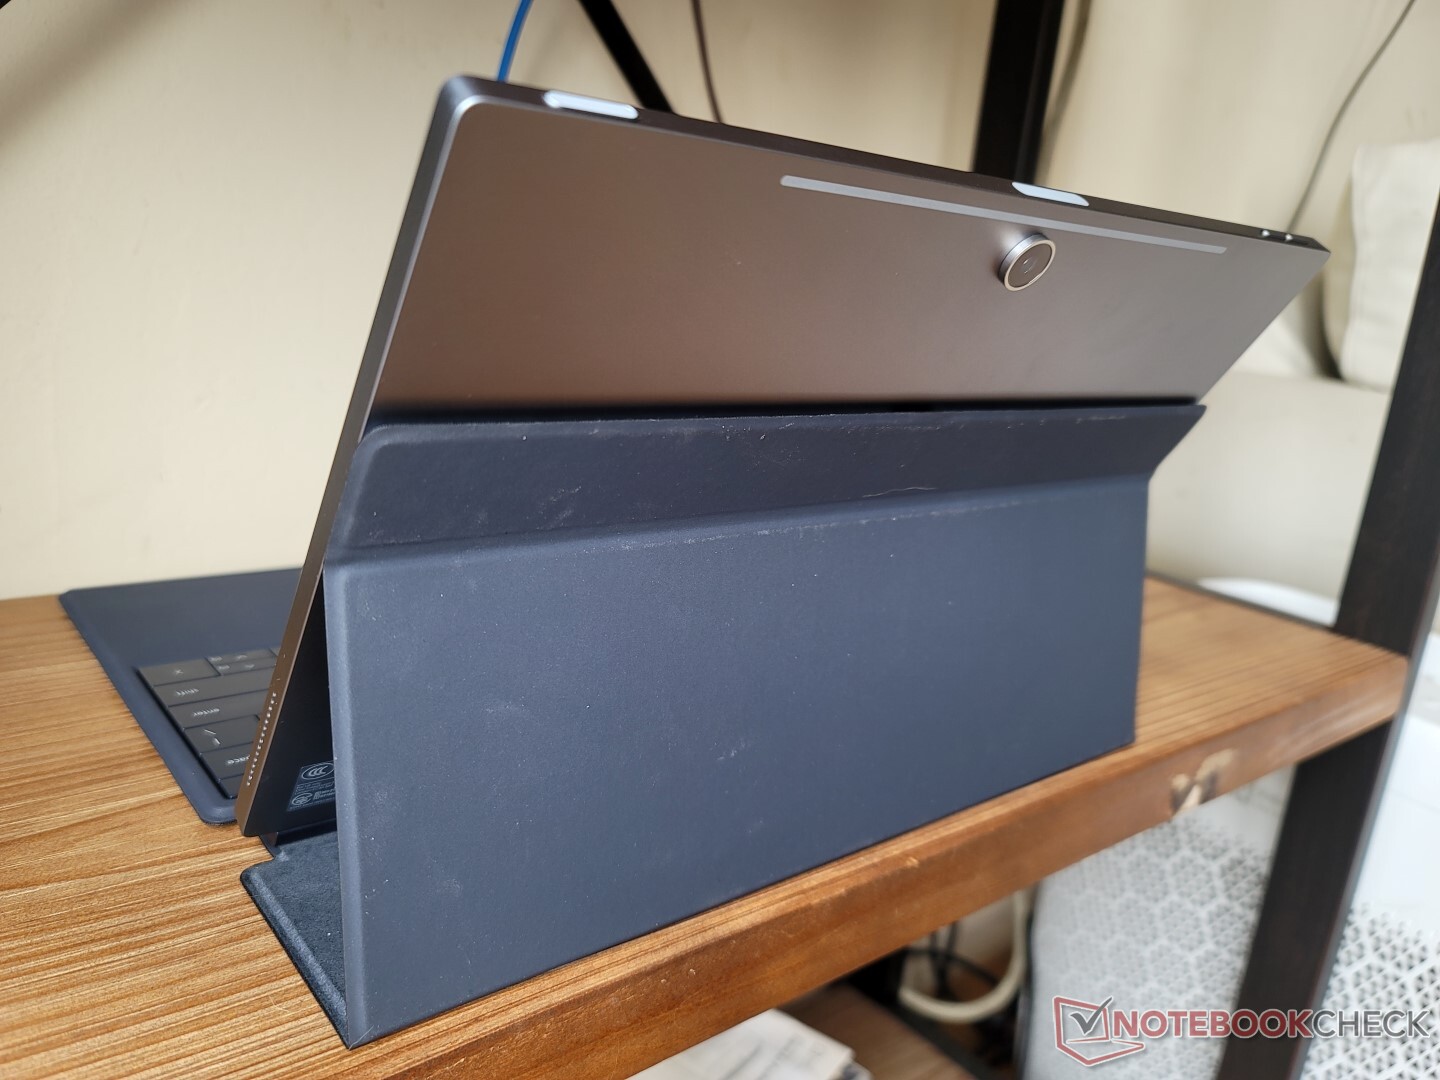
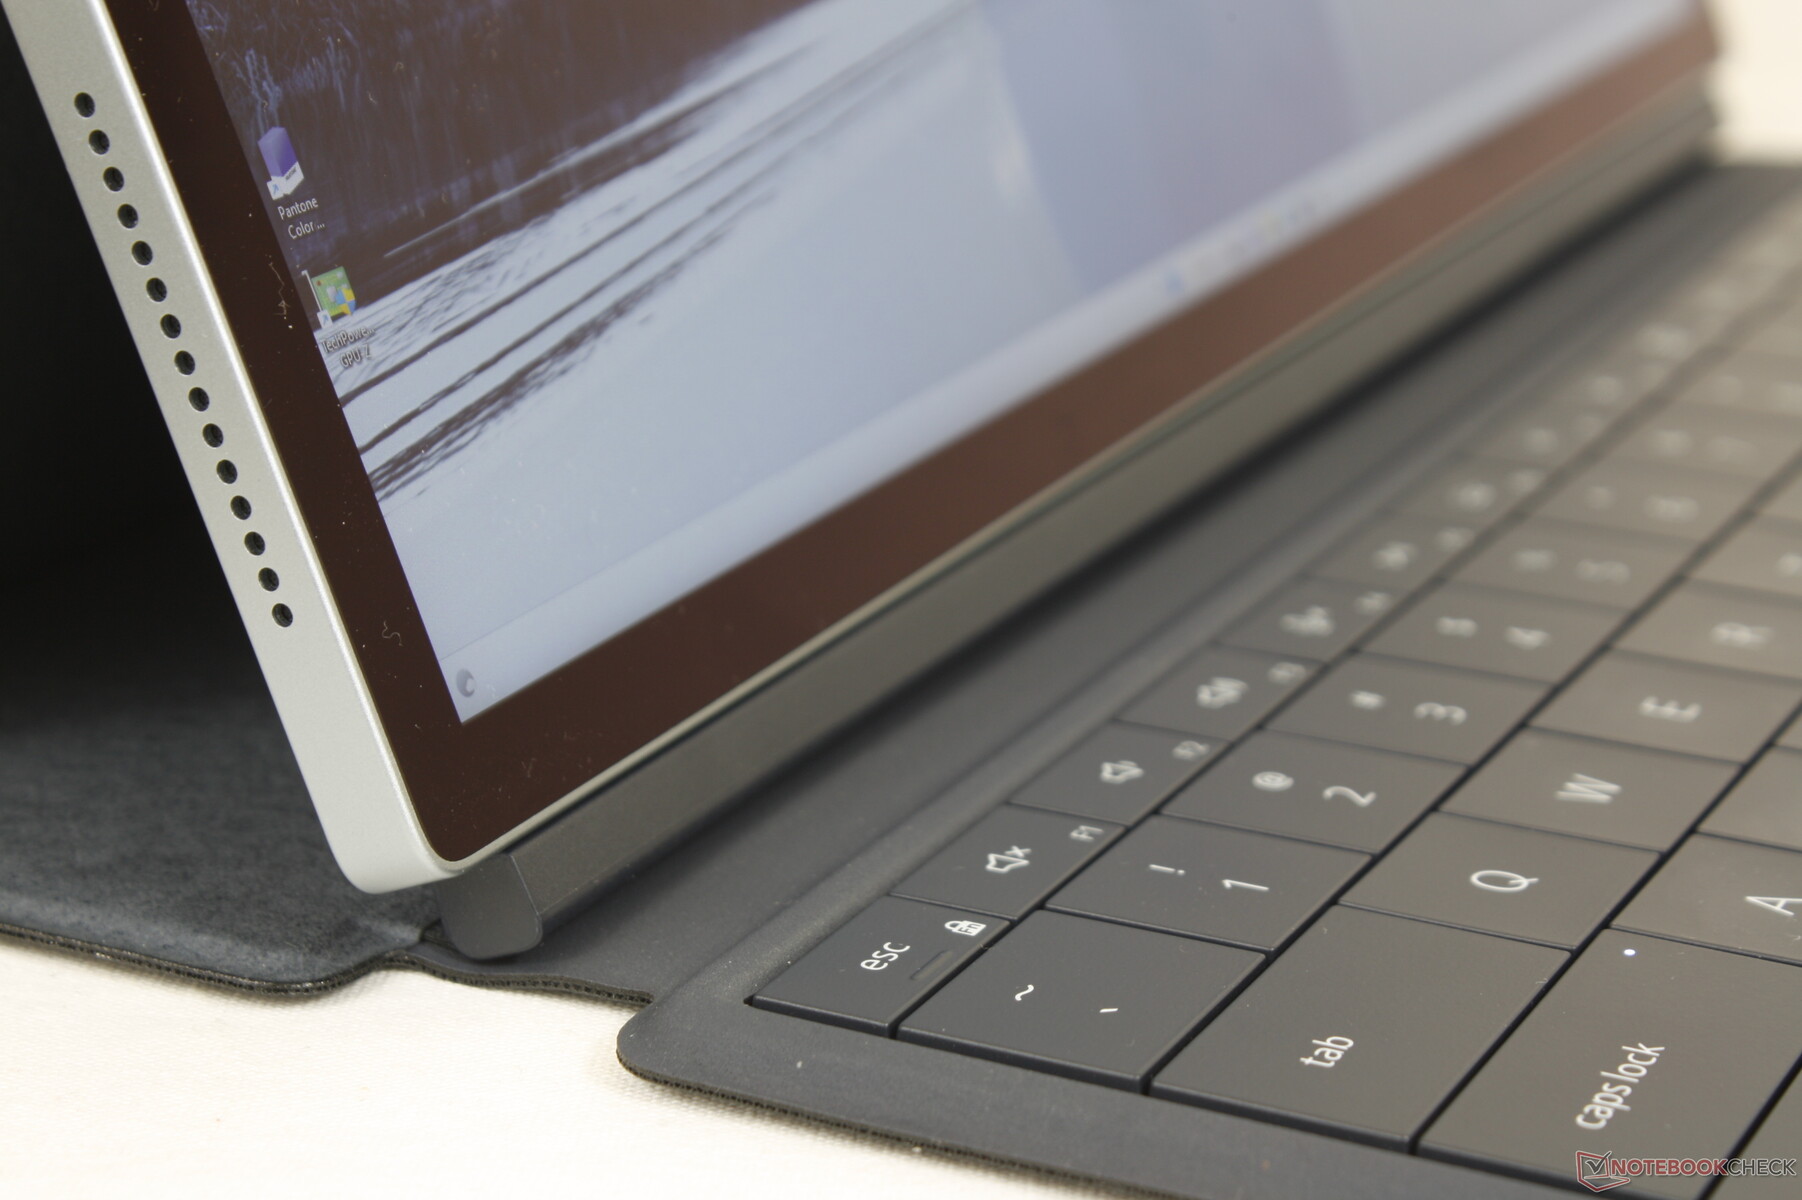
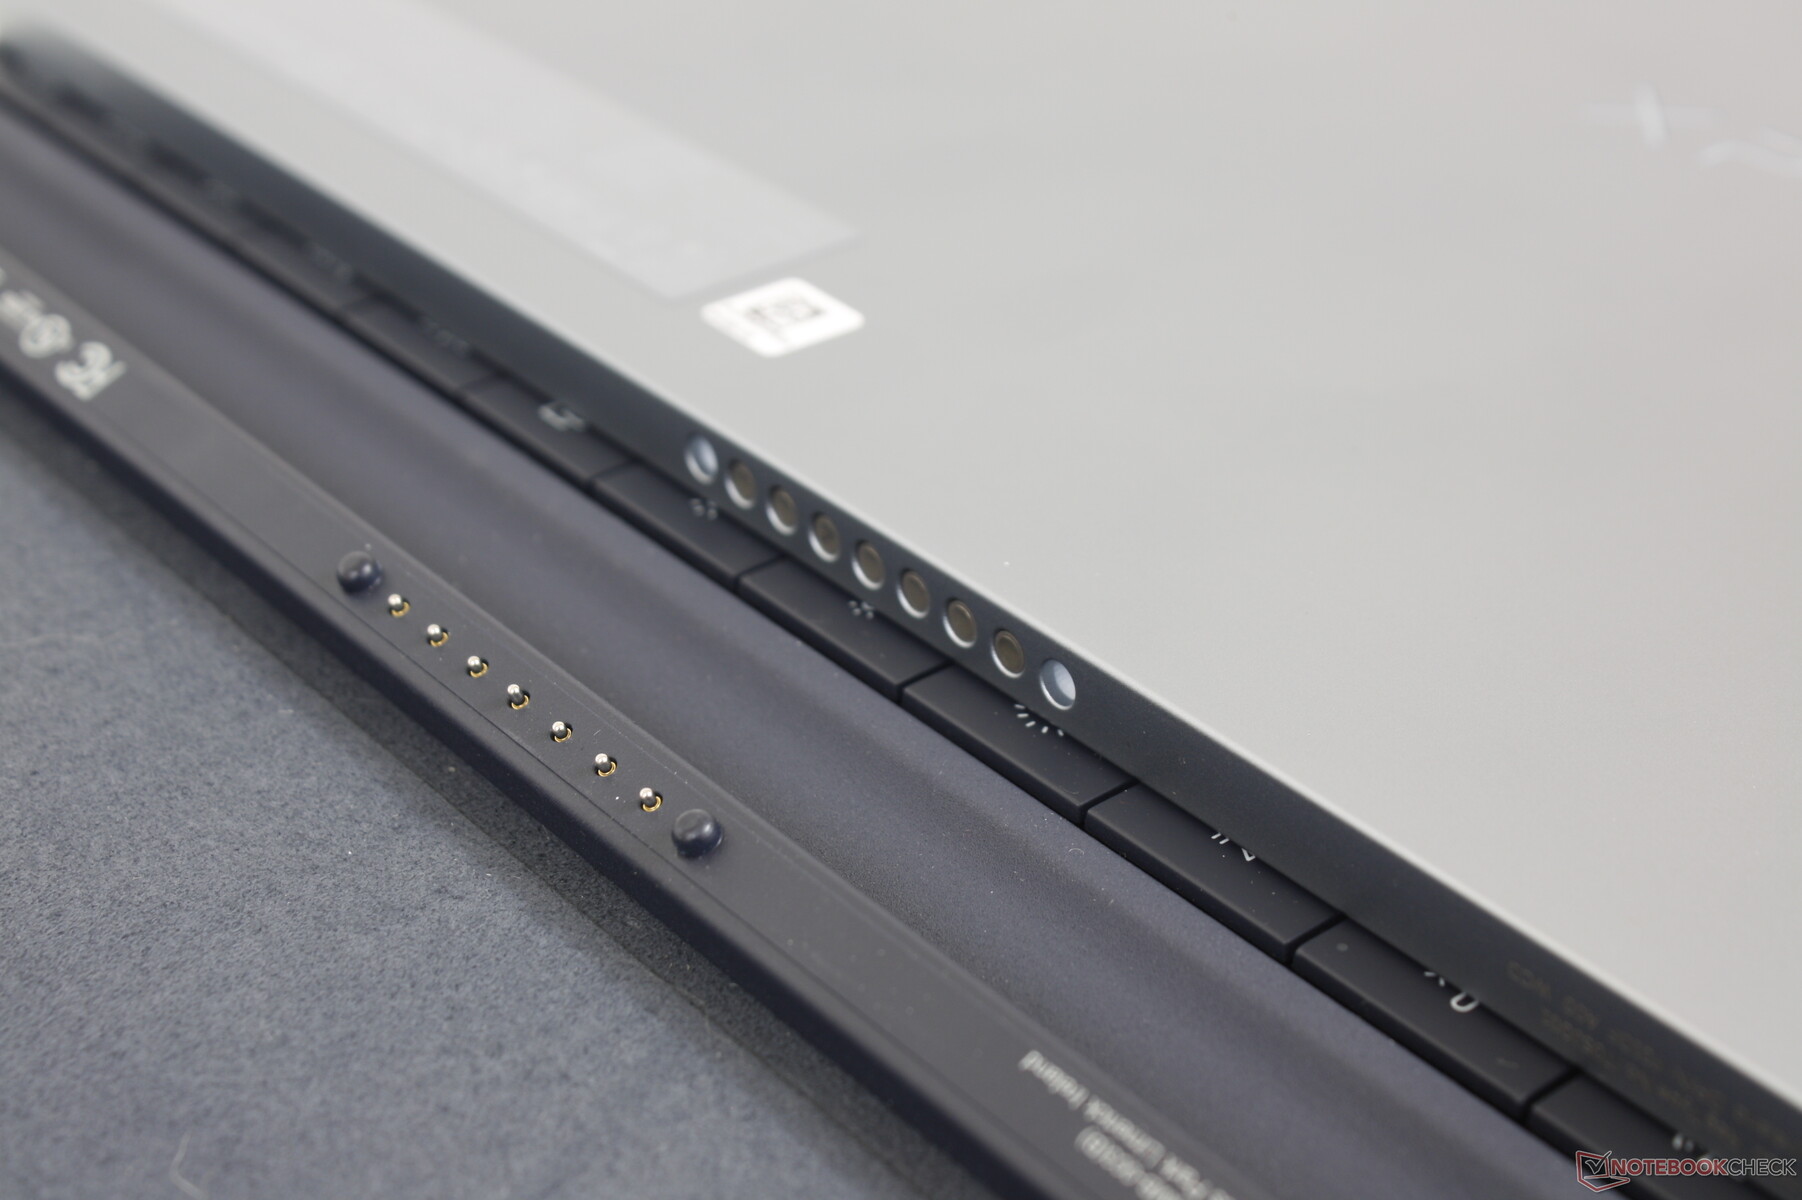
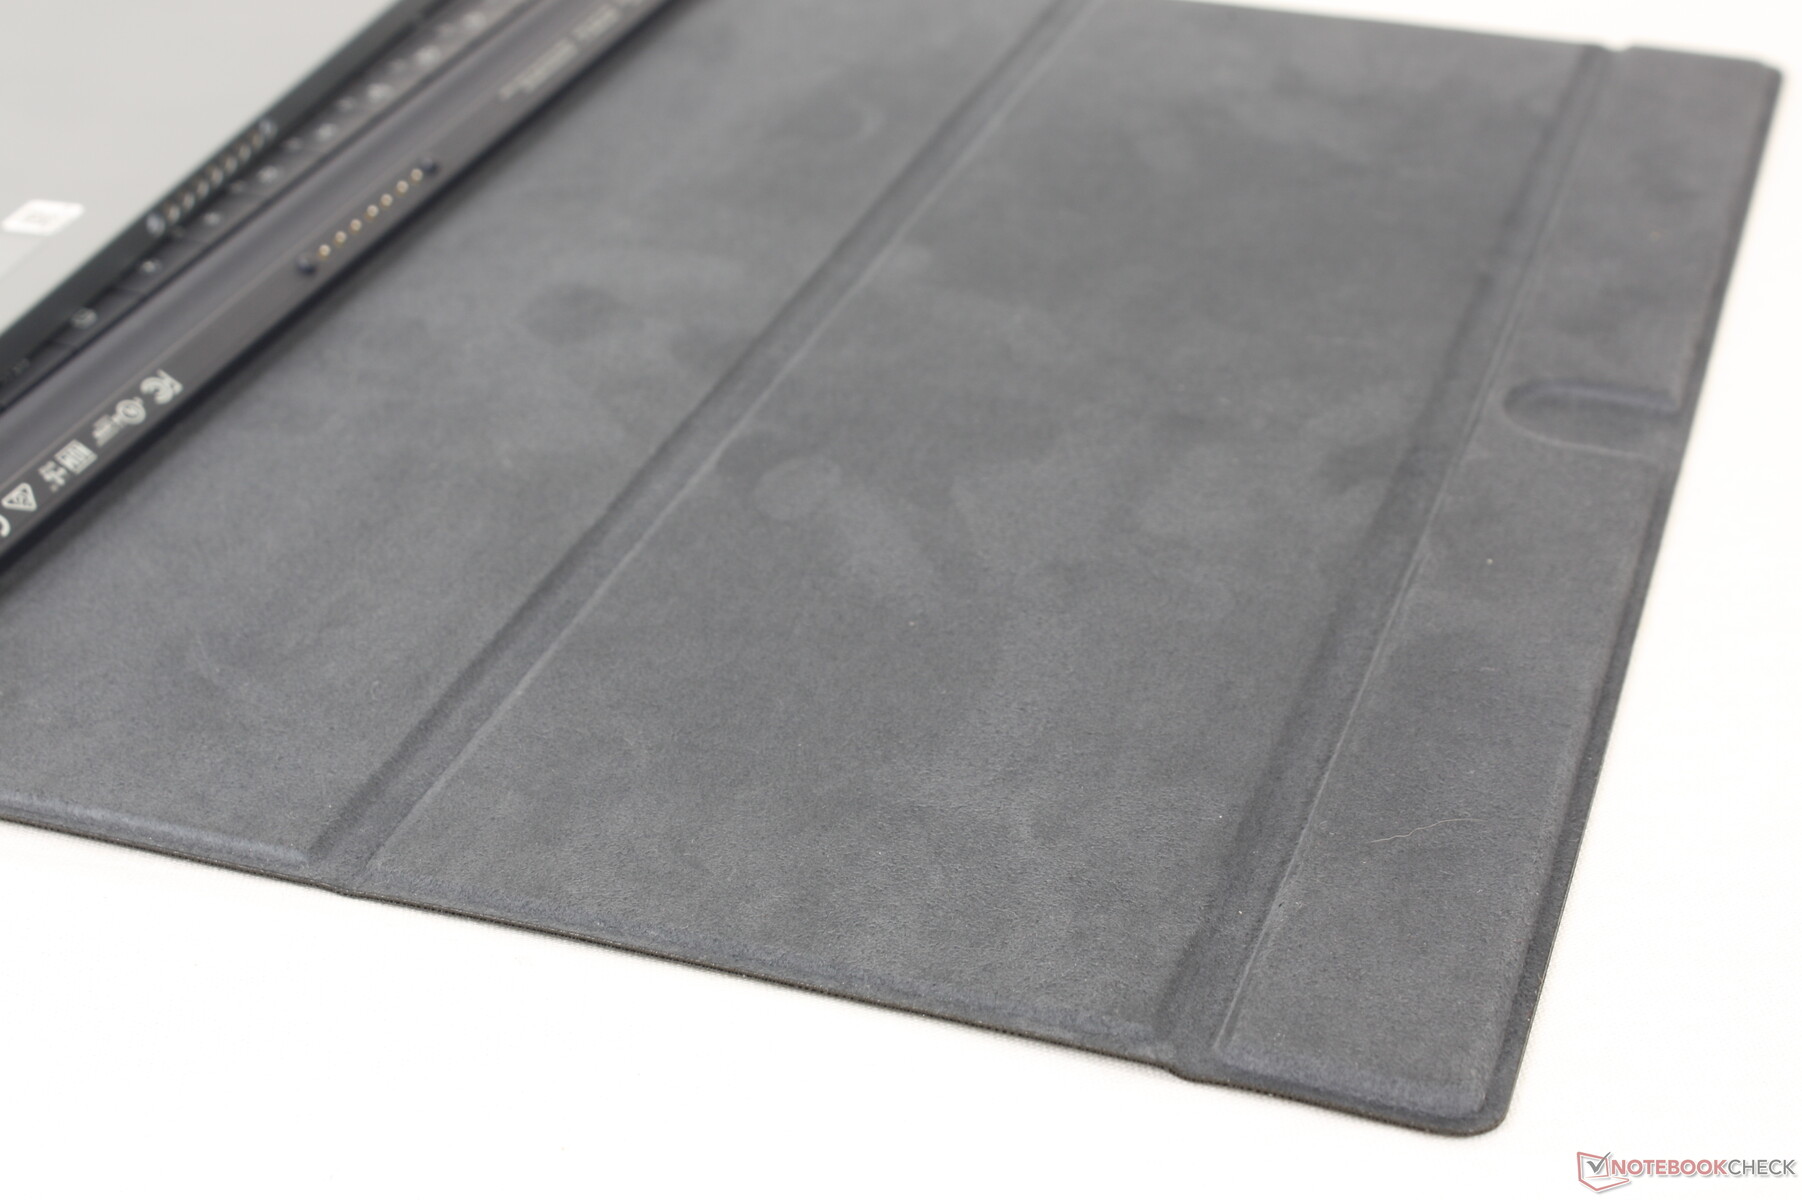
The magnetic keyboard dock (or folio) is a soft-touch material not unlike the Alcantara surfaces of the Surface Pro 8 keyboard dock. However, the Dell solution differs significantly from the Microsoft version because it includes a back cover whereas the Surface Pro Type Cover is only a keyboard and touchpad. This backside offers additional protection against scuffs and scratches at the cost of added weight.
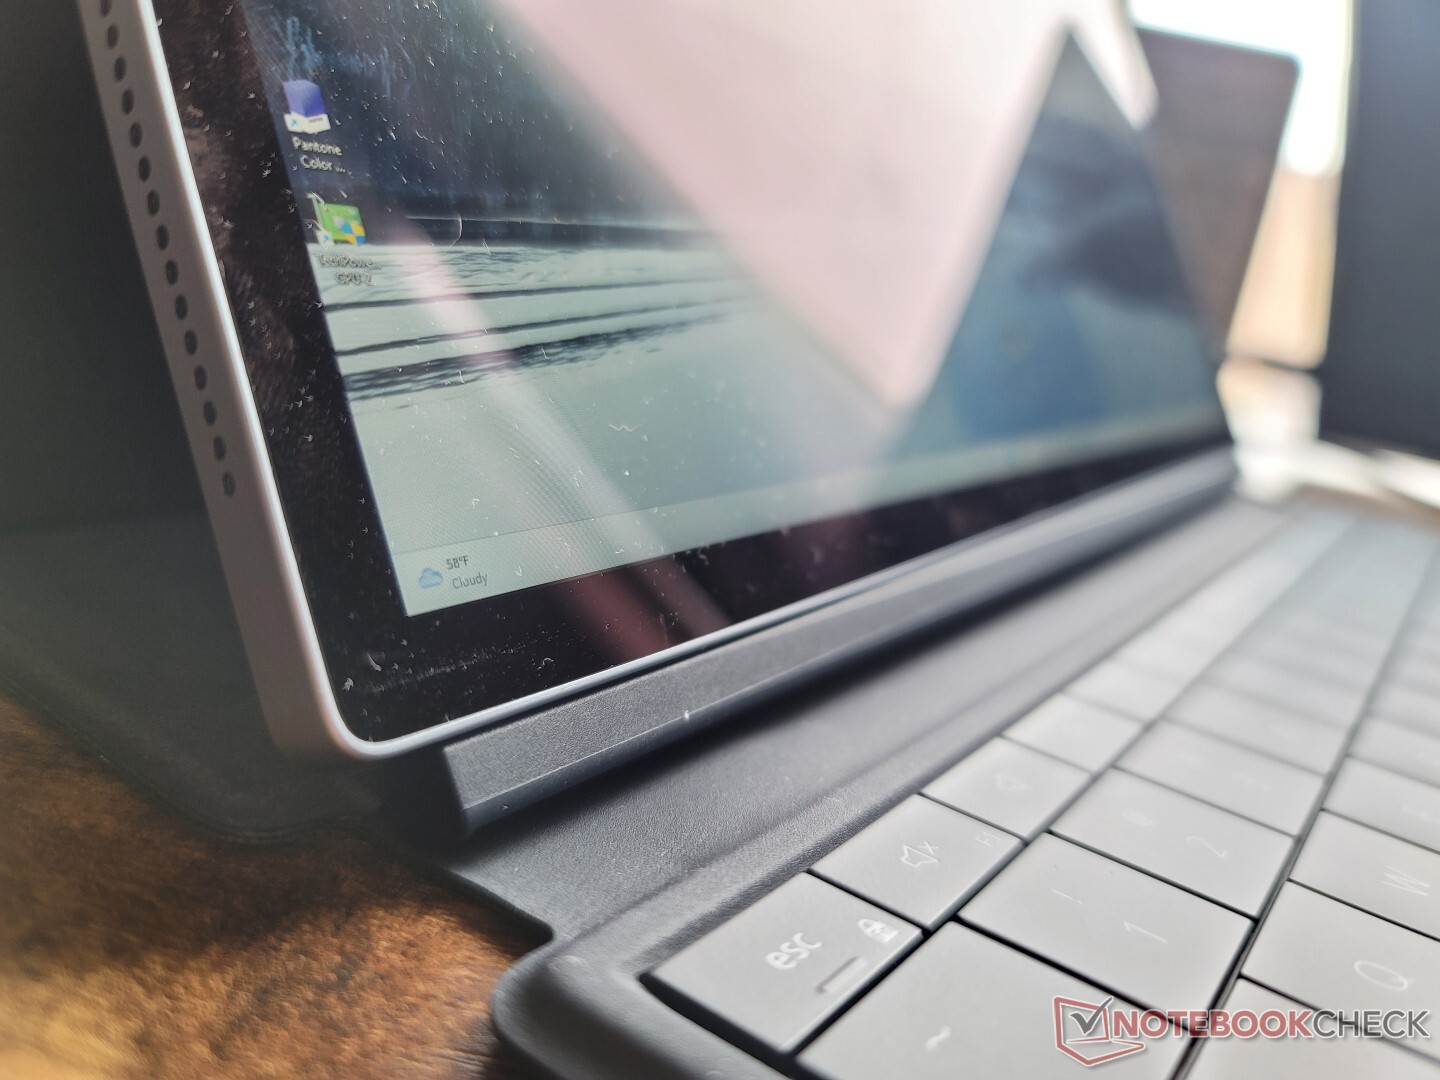
To anchor the Dell tablet in laptop mode, the backside of the folio can be adjusted to 100, 115, and 125 degrees only whereas the hinge on the Surface Pro 8 can move more freely. In other words, the XPS 13 9315 2-in-1 requires the optional folio dock to prop itself up whereas the Surface Pro 8 has a more convenient built-in stand.
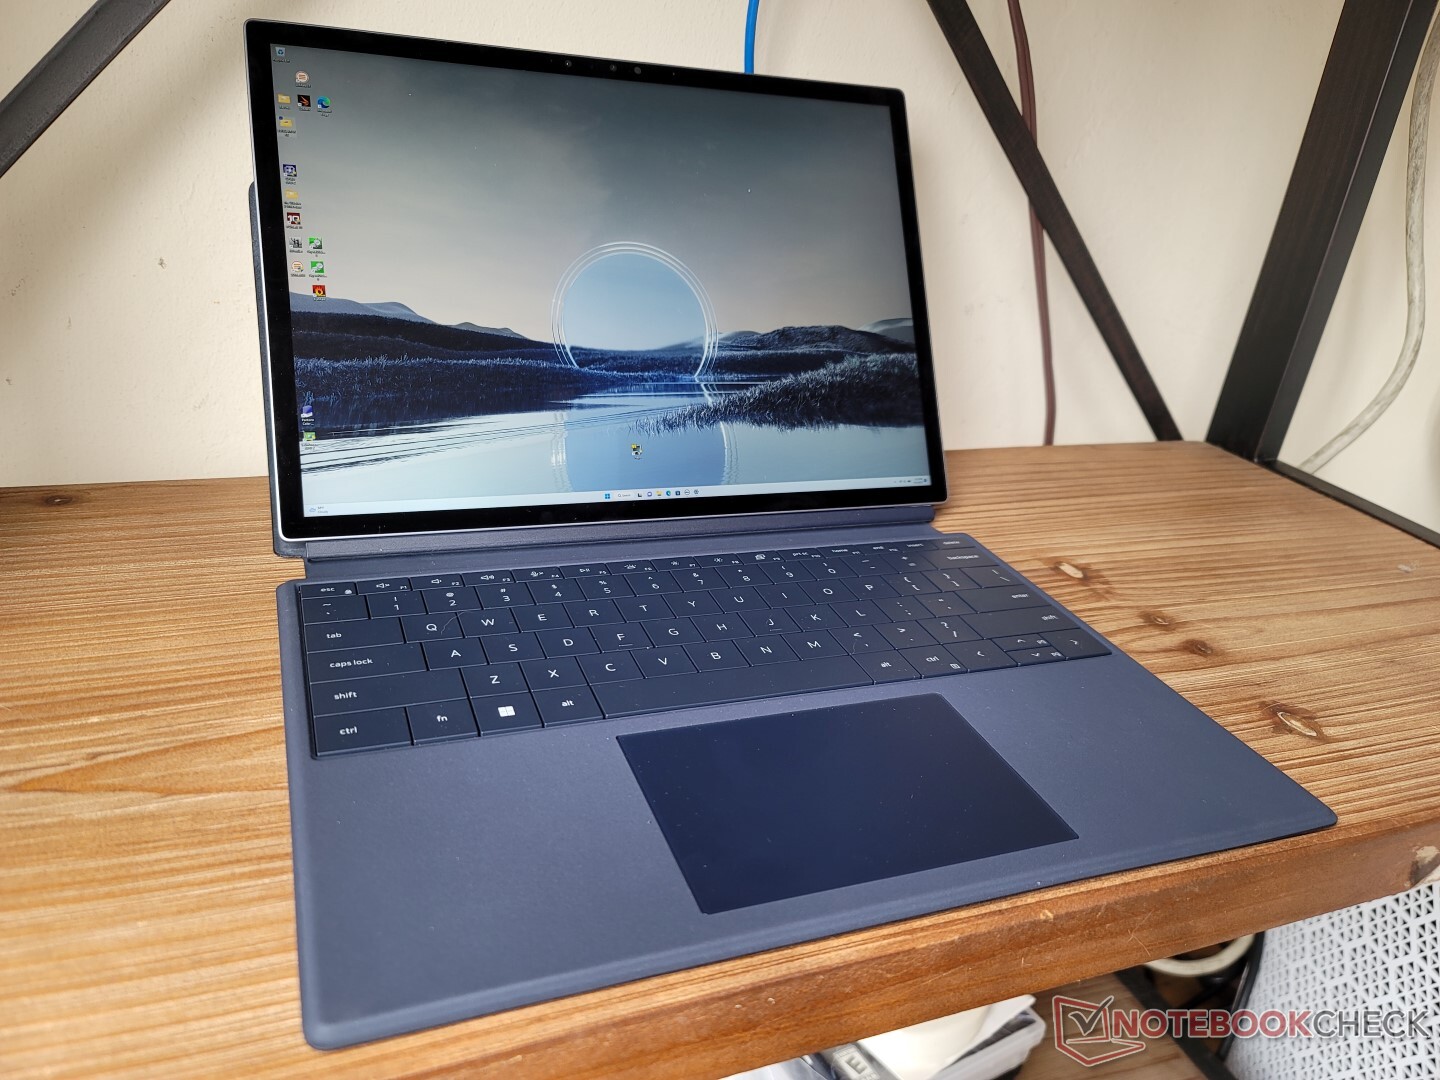
The tablet by itself is very light at just 764 g compared to almost 900 g for the Surface Pro 8. Much of the weight savings can be attributed to the fanless design of the Dell whereas the Microsoft model incorporates a fan for better cooling. The combined weight between the tablet and case is 1305 g which is close to many 13.5-inch clamshells like the HP Spectre x360 13.5.
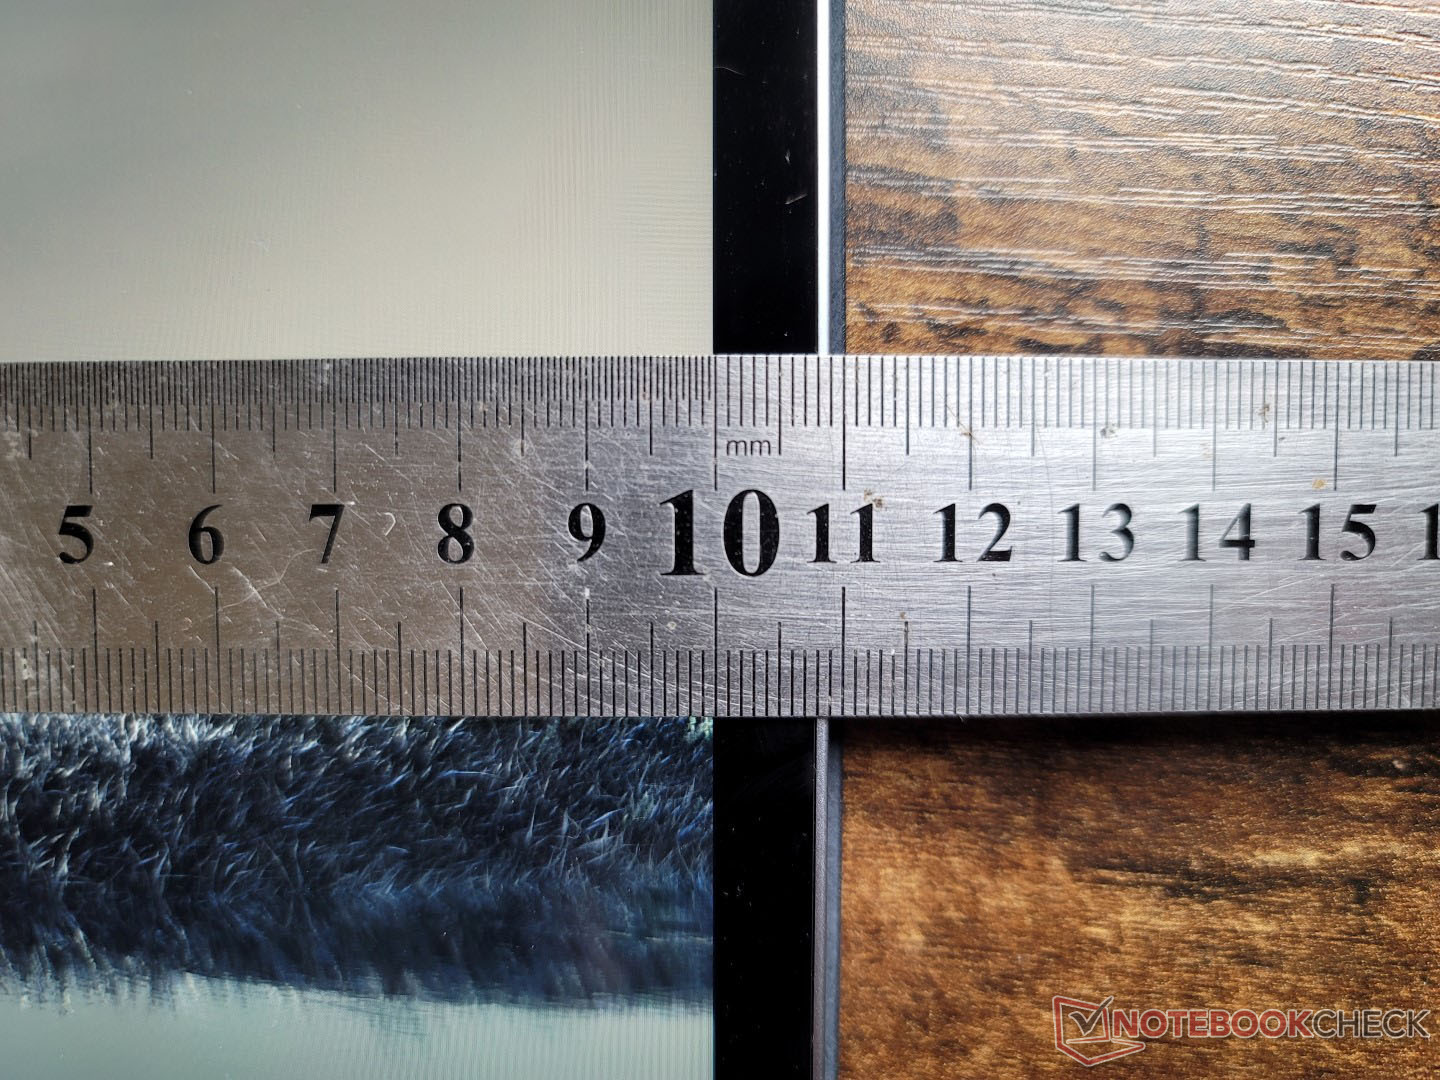
The 5G configurations of the XPS 13 9315 2-in-1 are slightly thicker by 4/10th of a millimeter (7.8 vs. 7.4 mm). All options are still thinner than the Surface Pro 8 by just a hair while being almost identical in length and width.


Connectivity — No Audio Jack
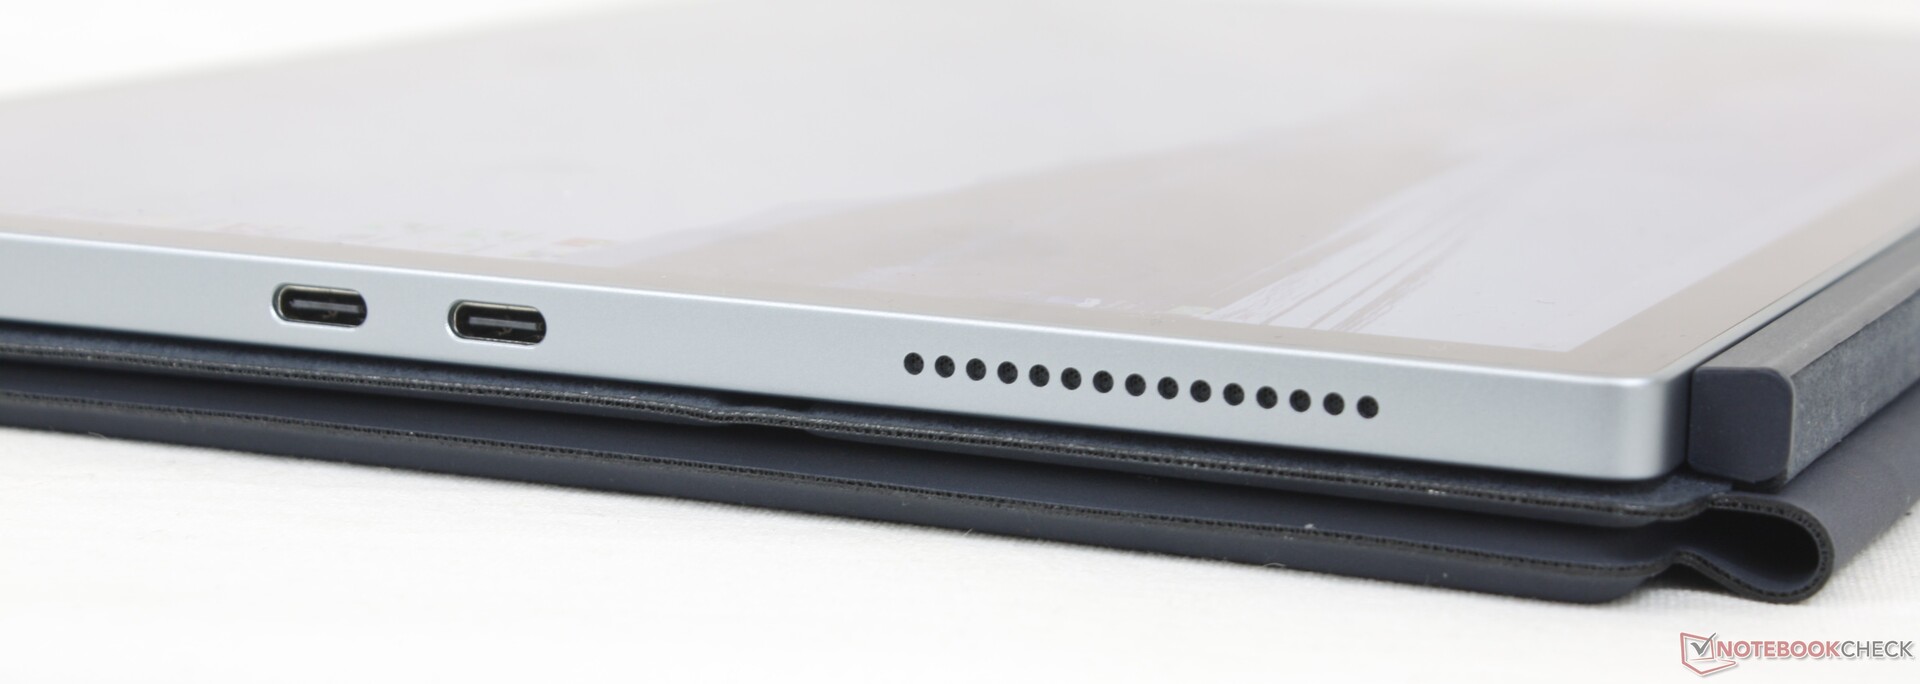
There are only two USB-C ports along the left edge each compatible with Thunderbolt 4 devices. Users are expected to have docking stations and adapters ready to better exploit the two ports. Keep in mind that there is not even a 3.5 mm audio jack whereas the Surface Pro 8 includes one.

Communication
An Intel 1675 AX211 comes standard for Wi-Fi 6E and Bluetooth 5.2 compatibility. Transfer rates are fast and steady when paired to our 6 GHz network, but average receive rates a bit slower than expected.
| Networking | |
| iperf3 transmit AX12 | |
| Microsoft Surface Pro 8, i7-1185G7 | |
| Lenovo ThinkBook Plus Gen2 Core i5 | |
| iperf3 receive AX12 | |
| Microsoft Surface Pro 8, i7-1185G7 | |
| Lenovo ThinkBook Plus Gen2 Core i5 | |
| iperf3 receive AXE11000 6GHz | |
| HP Spectre x360 13.5 14t-ef000 | |
| Dell XPS 13 9315 2-in-1 Core i5-1230U | |
| iperf3 receive AXE11000 | |
| Apple MacBook Air M2 Entry | |
| iperf3 transmit AXE11000 | |
| Apple MacBook Air M2 Entry | |
| iperf3 transmit AXE11000 6GHz | |
| HP Spectre x360 13.5 14t-ef000 | |
| Dell XPS 13 9315 2-in-1 Core i5-1230U | |
Webcam
The rear camera is 11 MP which, perhaps not by coincidence, is 1 MP more than the camera on the Surface Pro 8. Image quality is significantly sharper than anything on a laptop webcam even if color accuracy still has a long way to go.
IR is present for Windows Hello support. There is unfortunately no webcam shutter for privacy concerns.


Accessories and Warranty
The retail box includes two handy USB-C adapters for converting to USB-A and 3.5 mm audio. Much like Microsoft and its Surface Pro tablet series, however, the detachable keyboard base and magnetic active stylus are sold separately for an additional $100 USD each. In other words, you'll have to add $200 on top of the initial price if you want both the keyboard base and pen.
The standard one-year limited manufacturer warranty applies if purchased in the US.
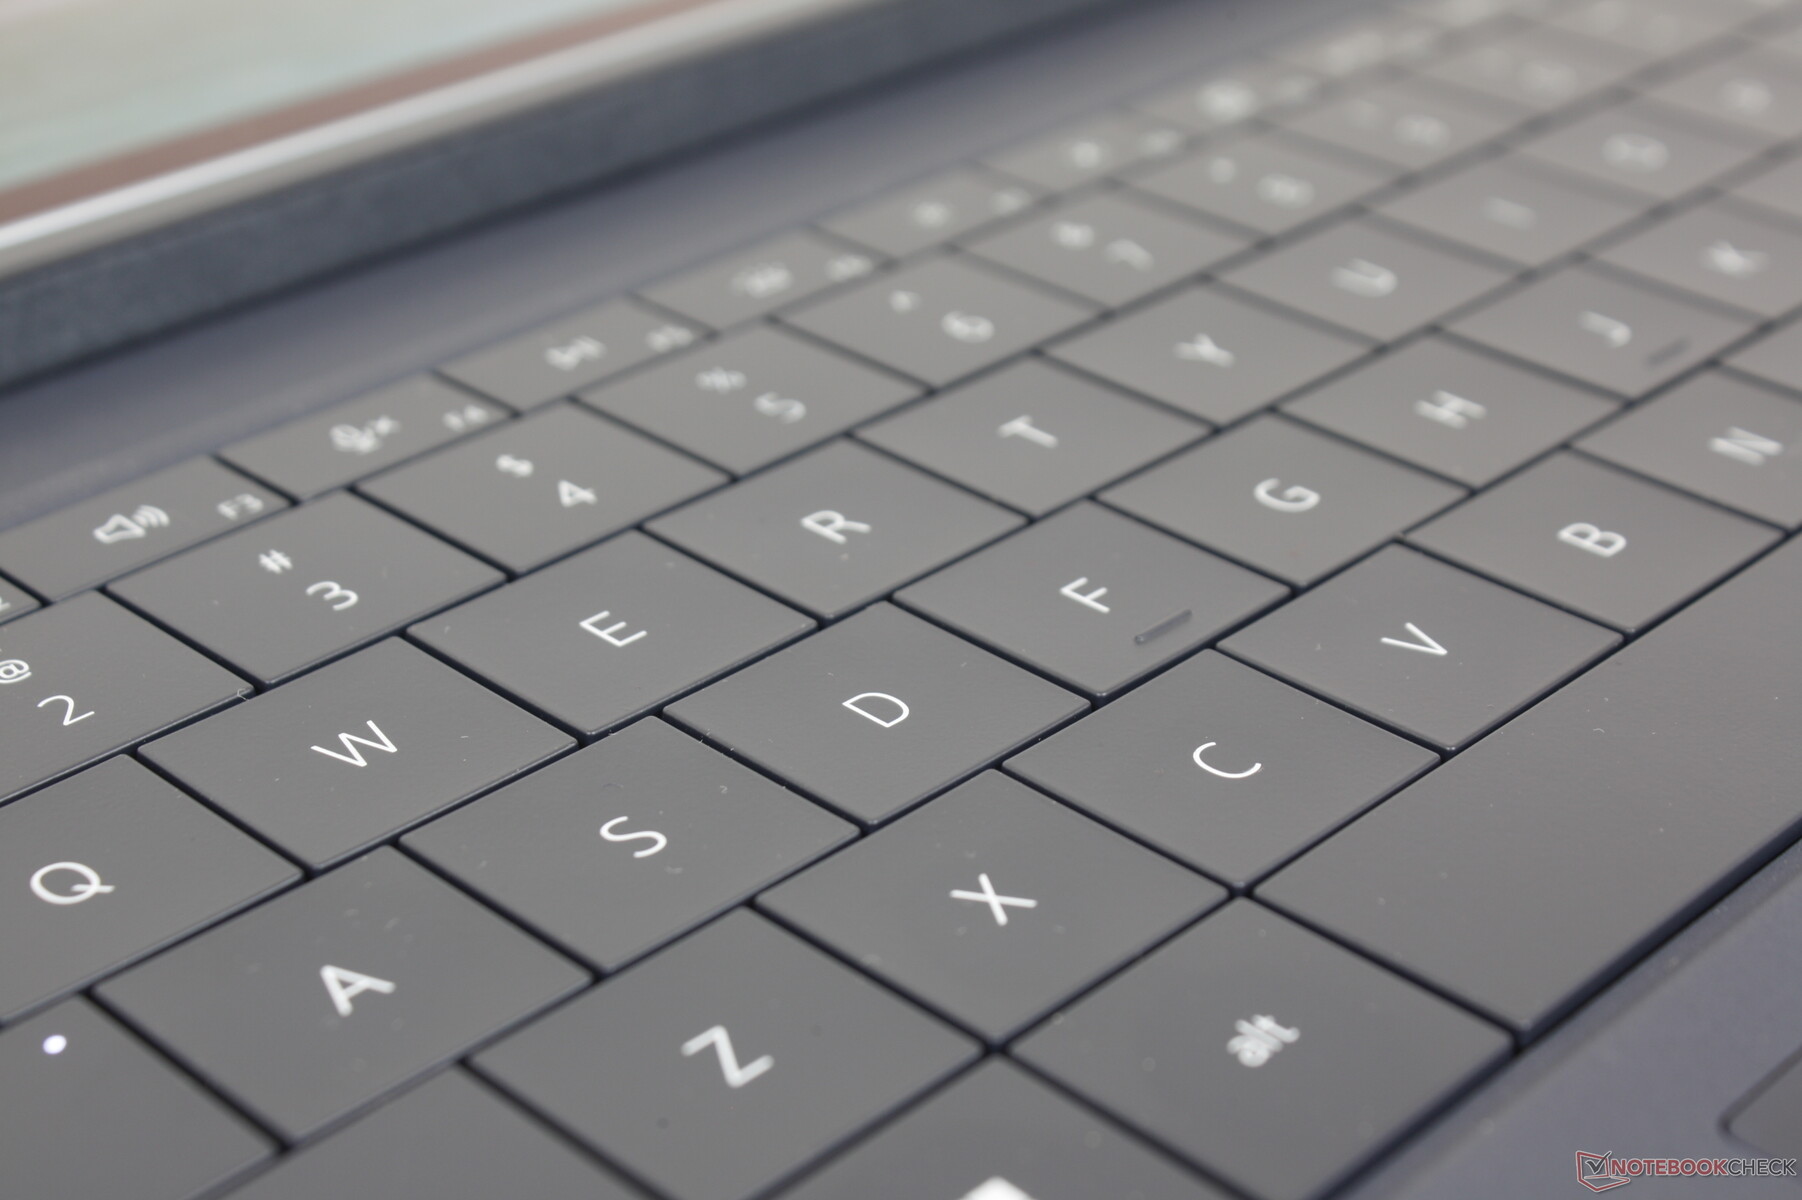
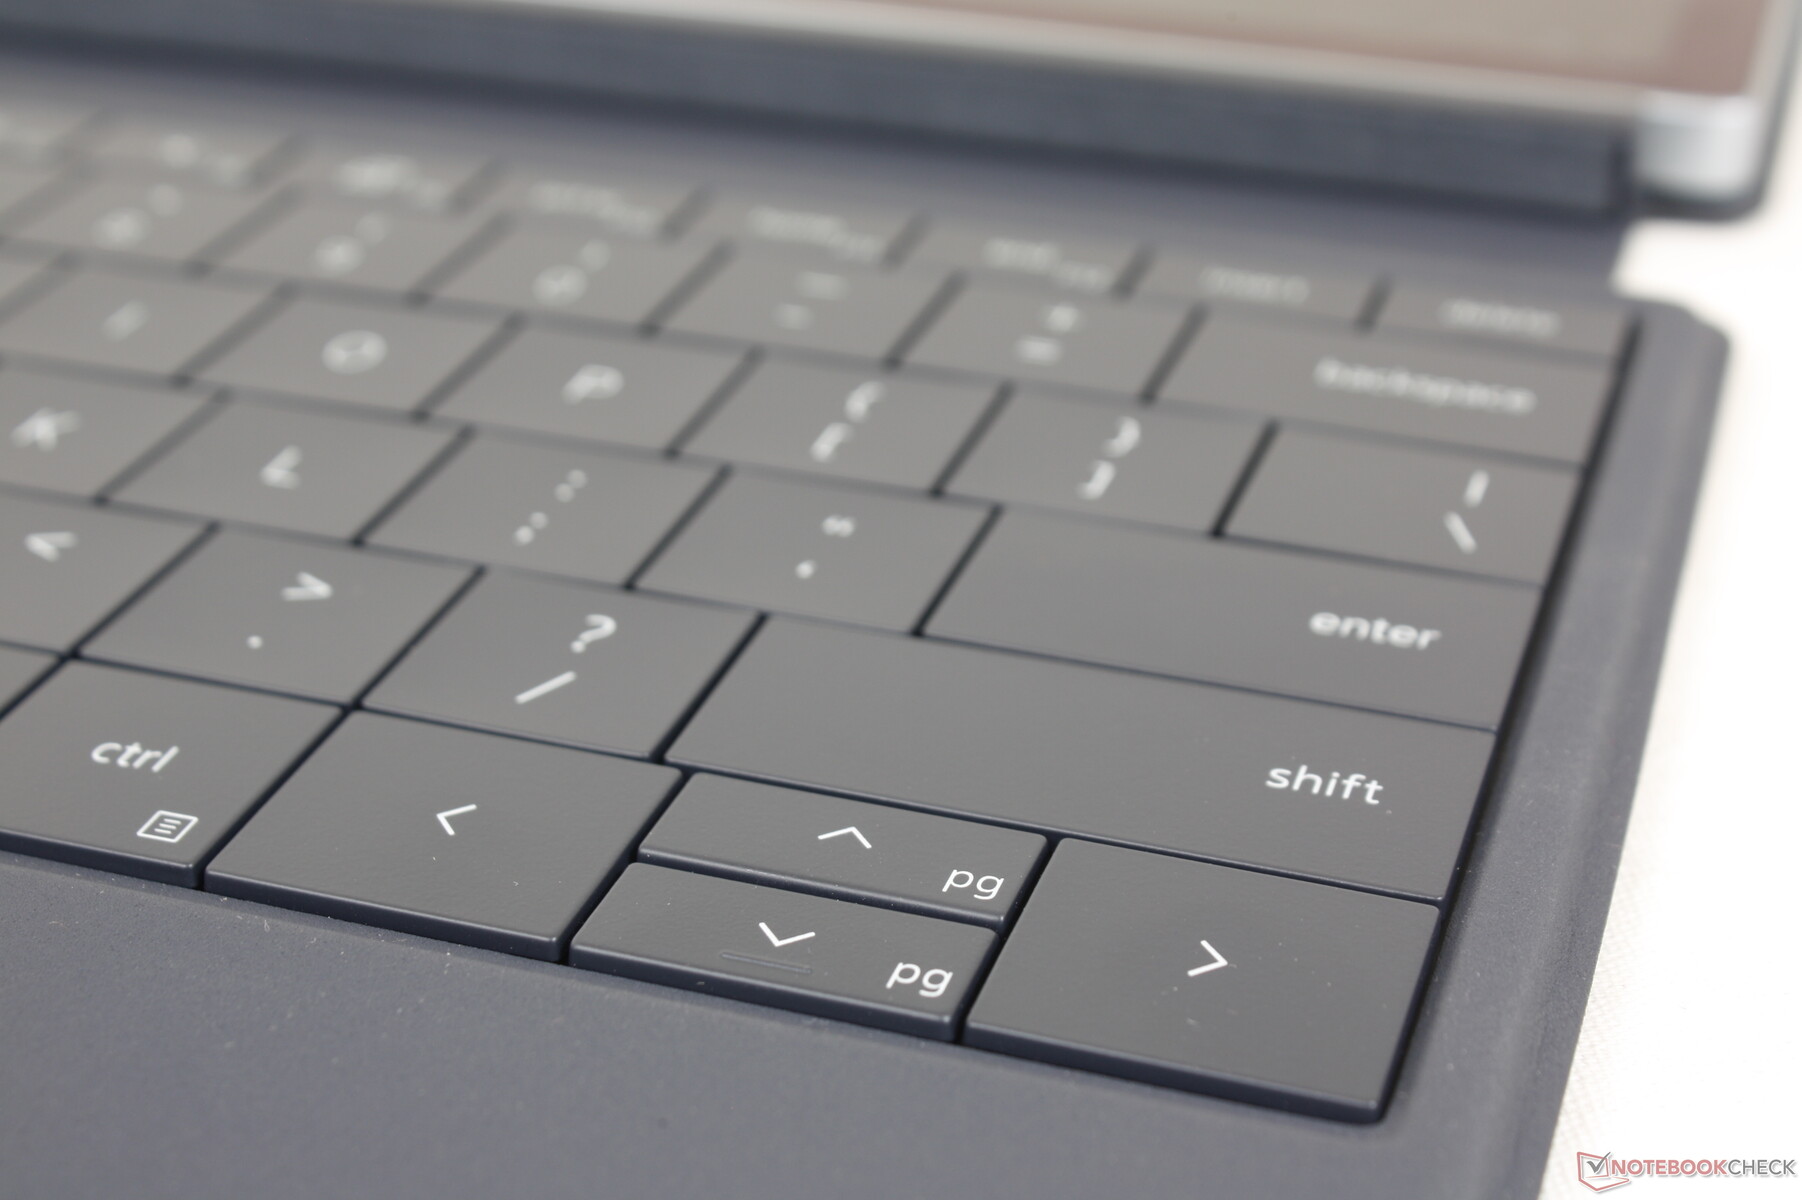
Input Devices — One Of The Most Comfortable Detachable Keyboards
Keyboard
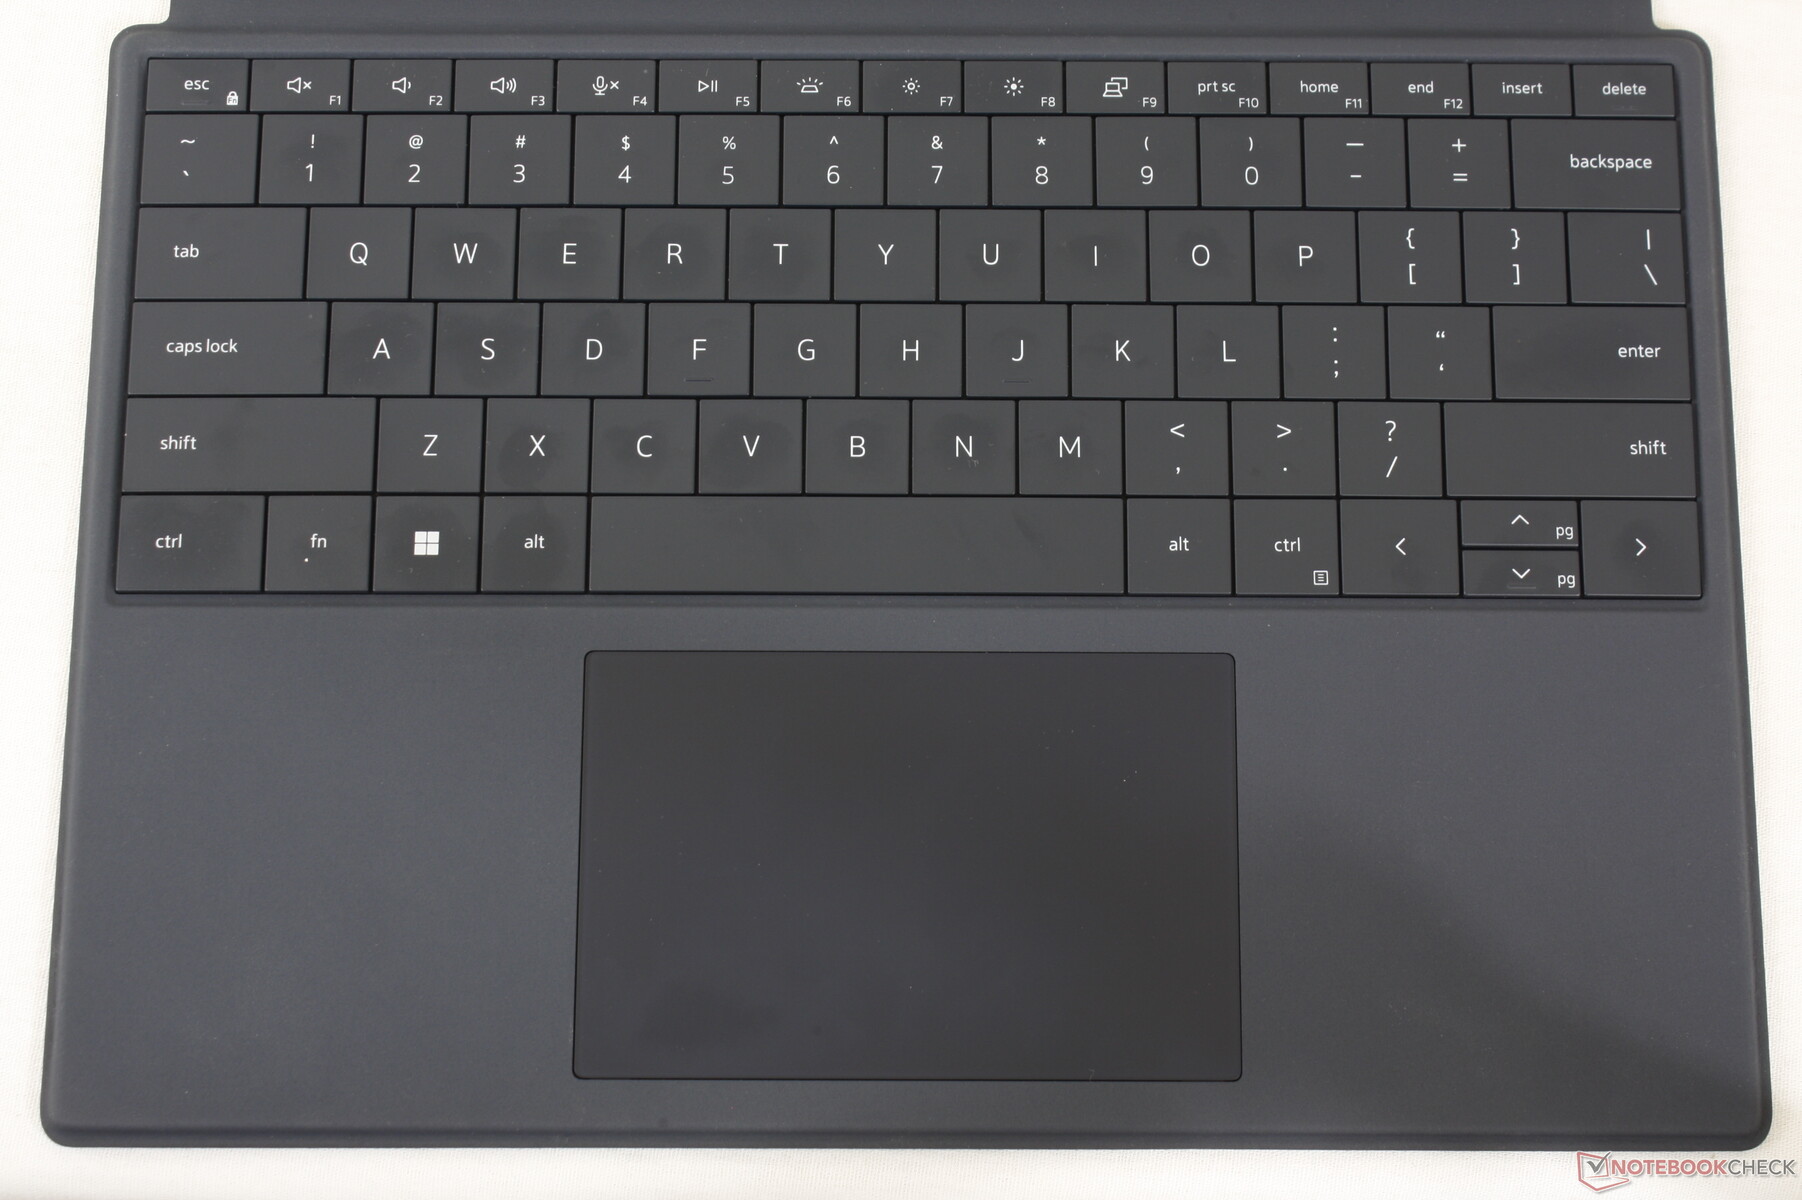
The keyboard is modeled after the keyboard on the XPS 13 Plus 9320 and so they feel nearly the same when it comes to travel and feedback. Some may find the 1.0 mm key travel to be too shallow, but the overall feel is still much better than expected for a detachable base as many in the category are notorious for their poor key feedback, cheap feel, and spongy keys. The XPS 13 9315 2-in-1 keyboard comes closest thus far to an actual Ultrabook keyboard.
With that said, the keyboard layout is not one-to-one with the XPS 13 Plus 9320. The latter keyboard is slightly wider while incorporating both the Power button and the capacitive row of function commands. The font styling and white backlight are otherwise essentially identical.
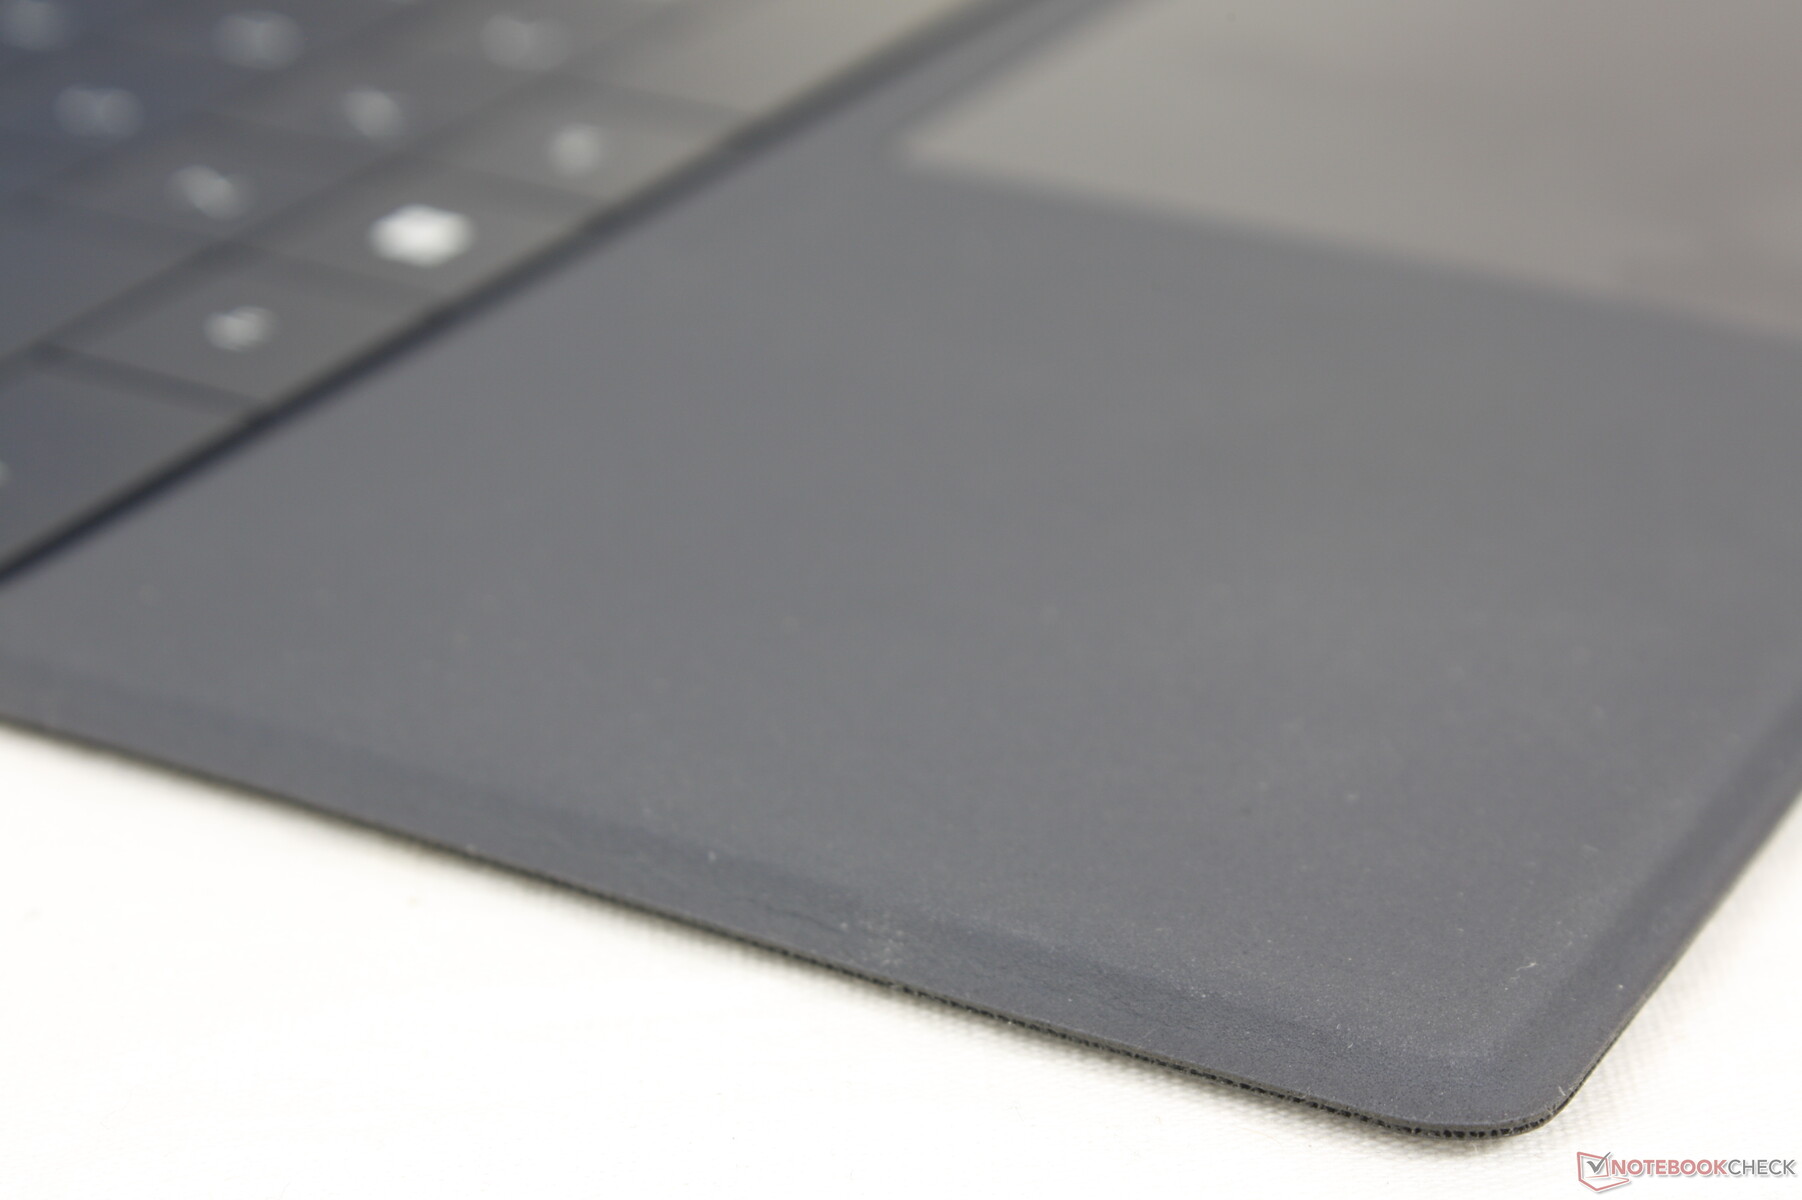
Touchpad
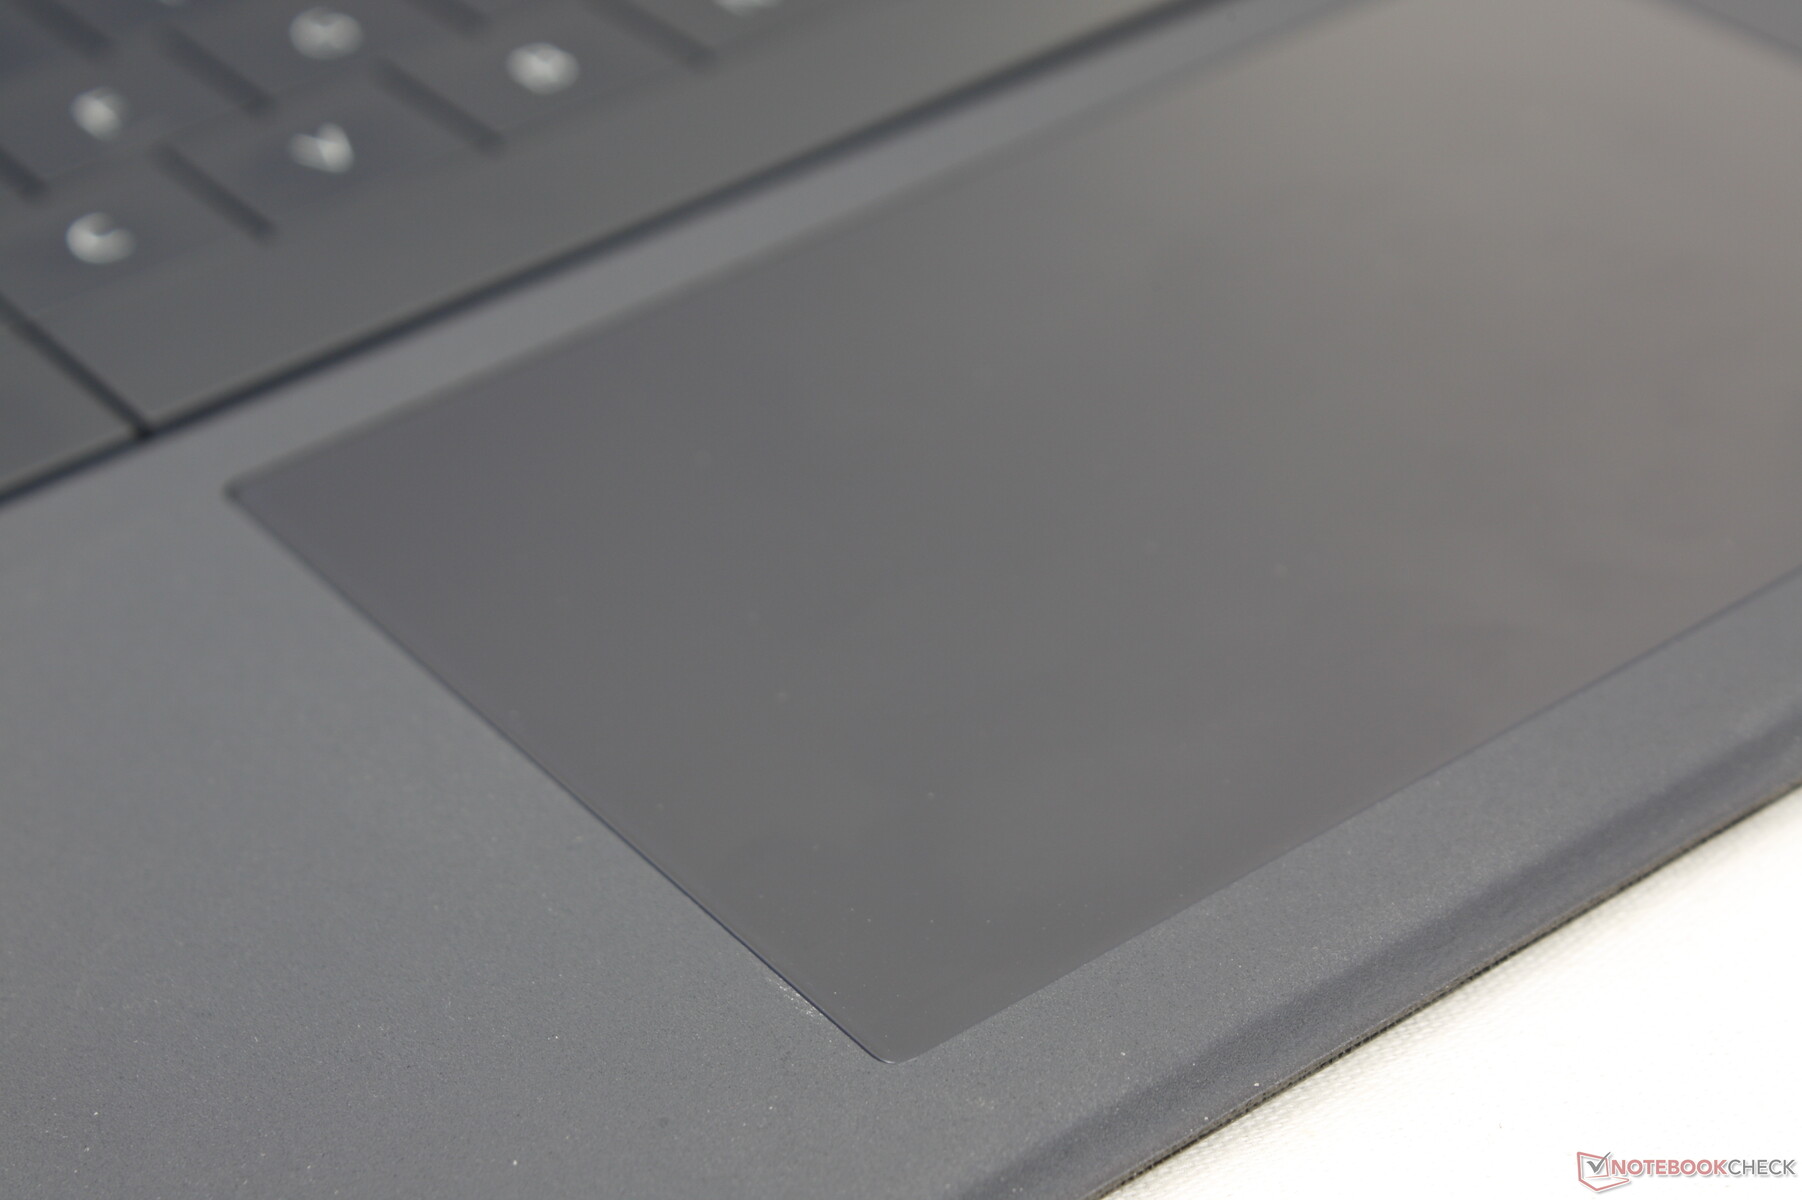
The clickpad is larger than the one on the Surface Pro series (11.4 x 7.5 vs. 10.2 x 5.3 cm) for an easier time scrolling and performing multi-touch inputs. Its surface is completely smooth and with very little sticking even when gliding at shower speeds. Feedback when clicking is much shallower than on most laptops, however, and so it isn't as satisfying to use as the clickpad on the more traditional XPS 13 9315 clamshell.
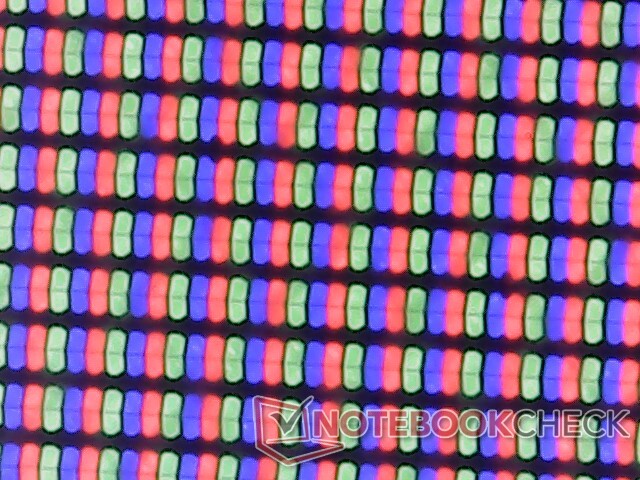
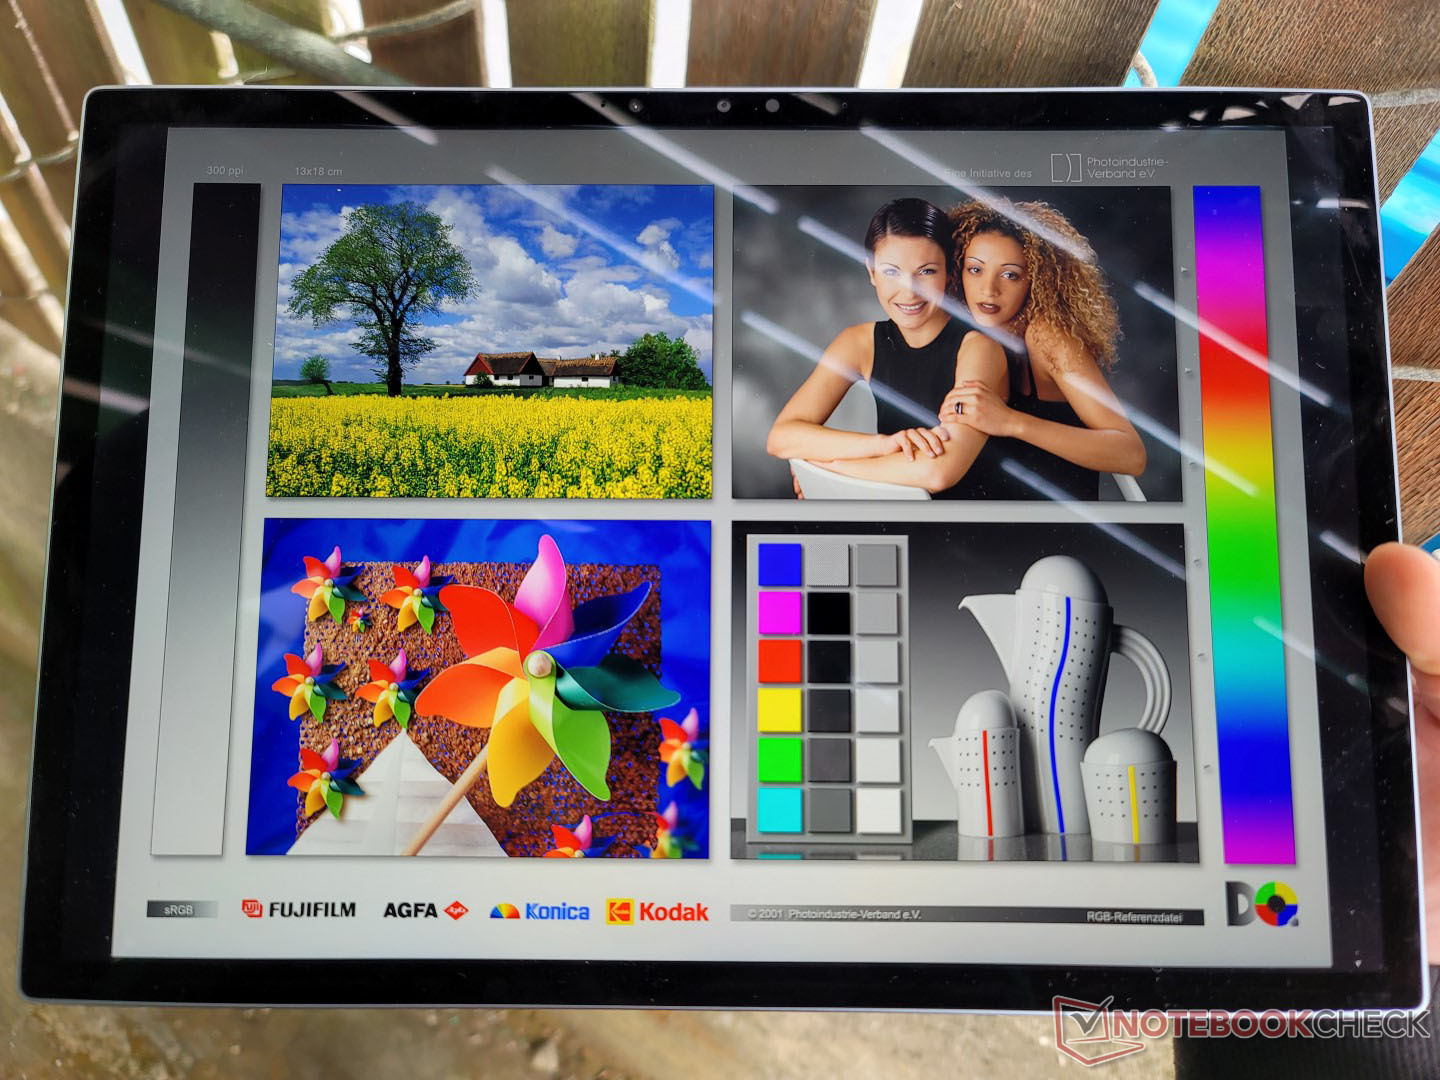
Display — 60 Hz Only
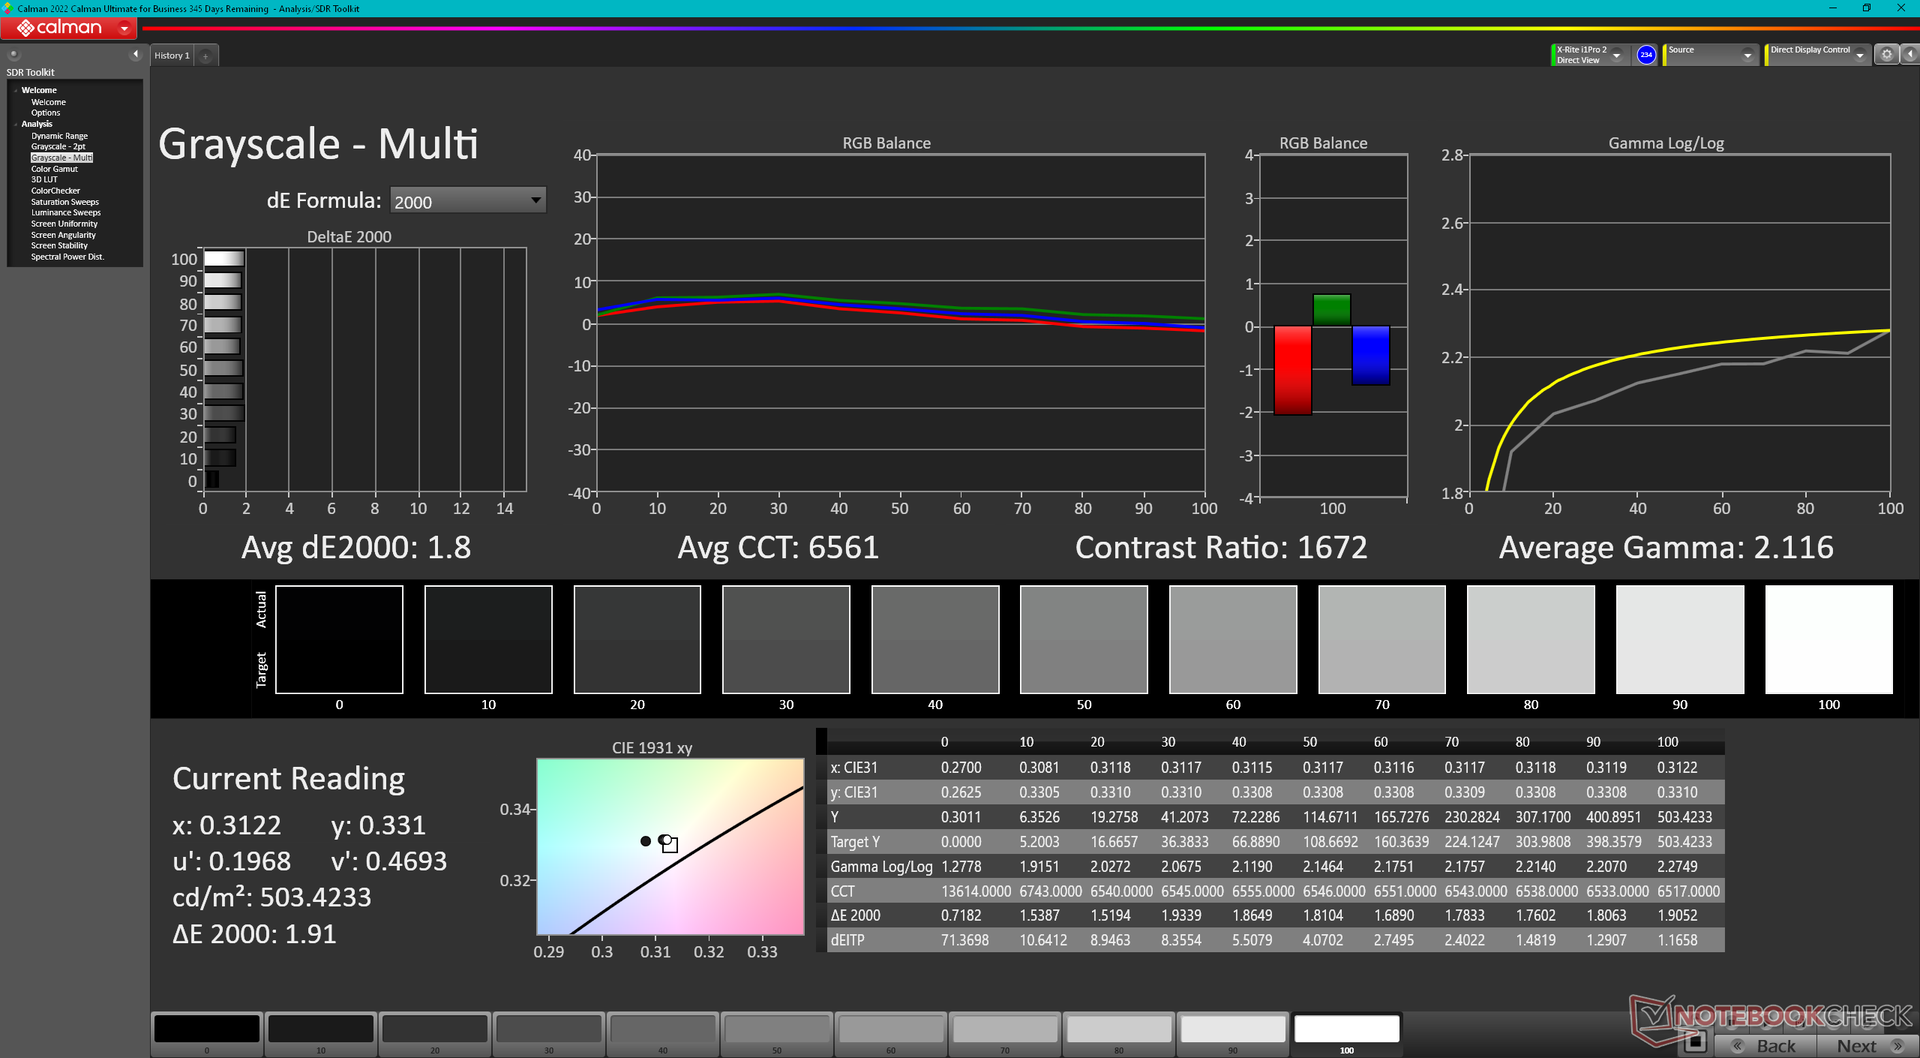
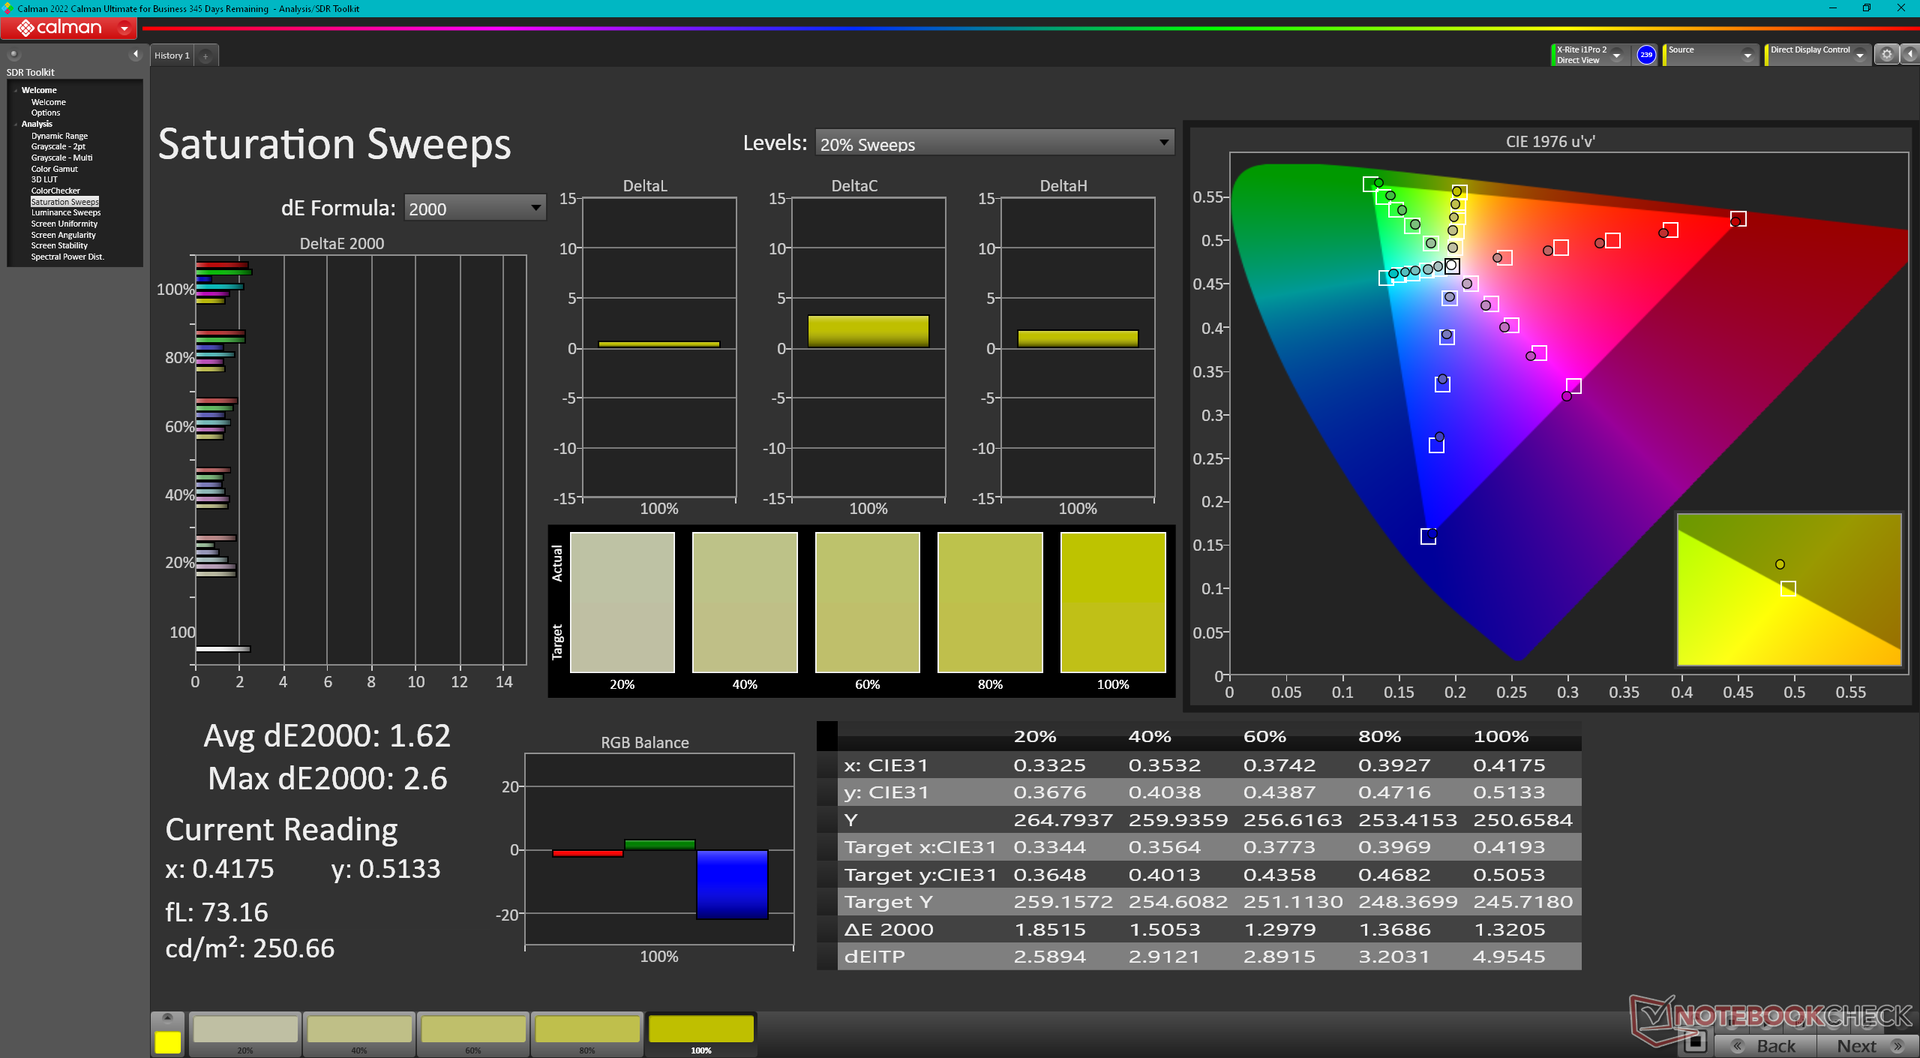
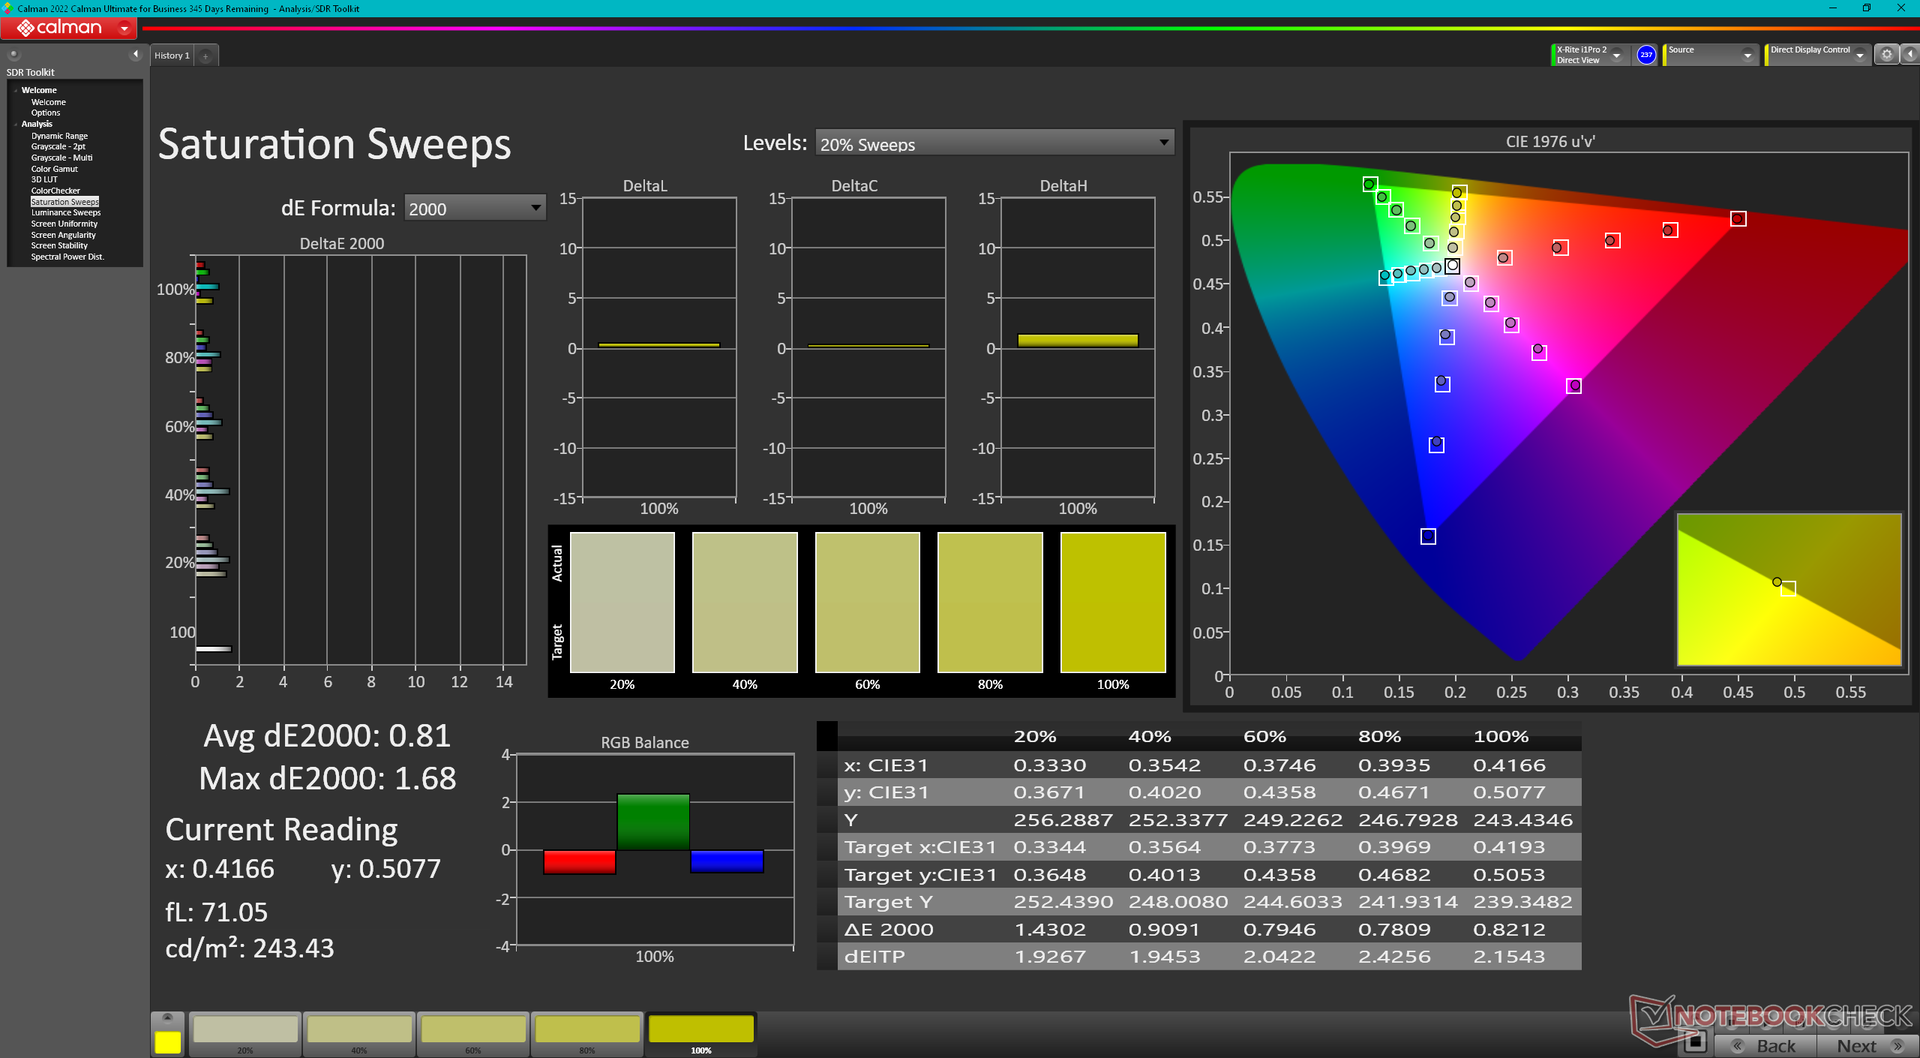
Dell advertises a 500-nit display with full sRGB coverage which we can confirm with our own independent measurements. Contrast ratio is also very good for an IPS panel at about 1500:1 and there is no PWM on lower brightness levels unlike on the Microsoft equivalent. The visual experience is appropriate for a high-end Windows tablet at least at first glance.
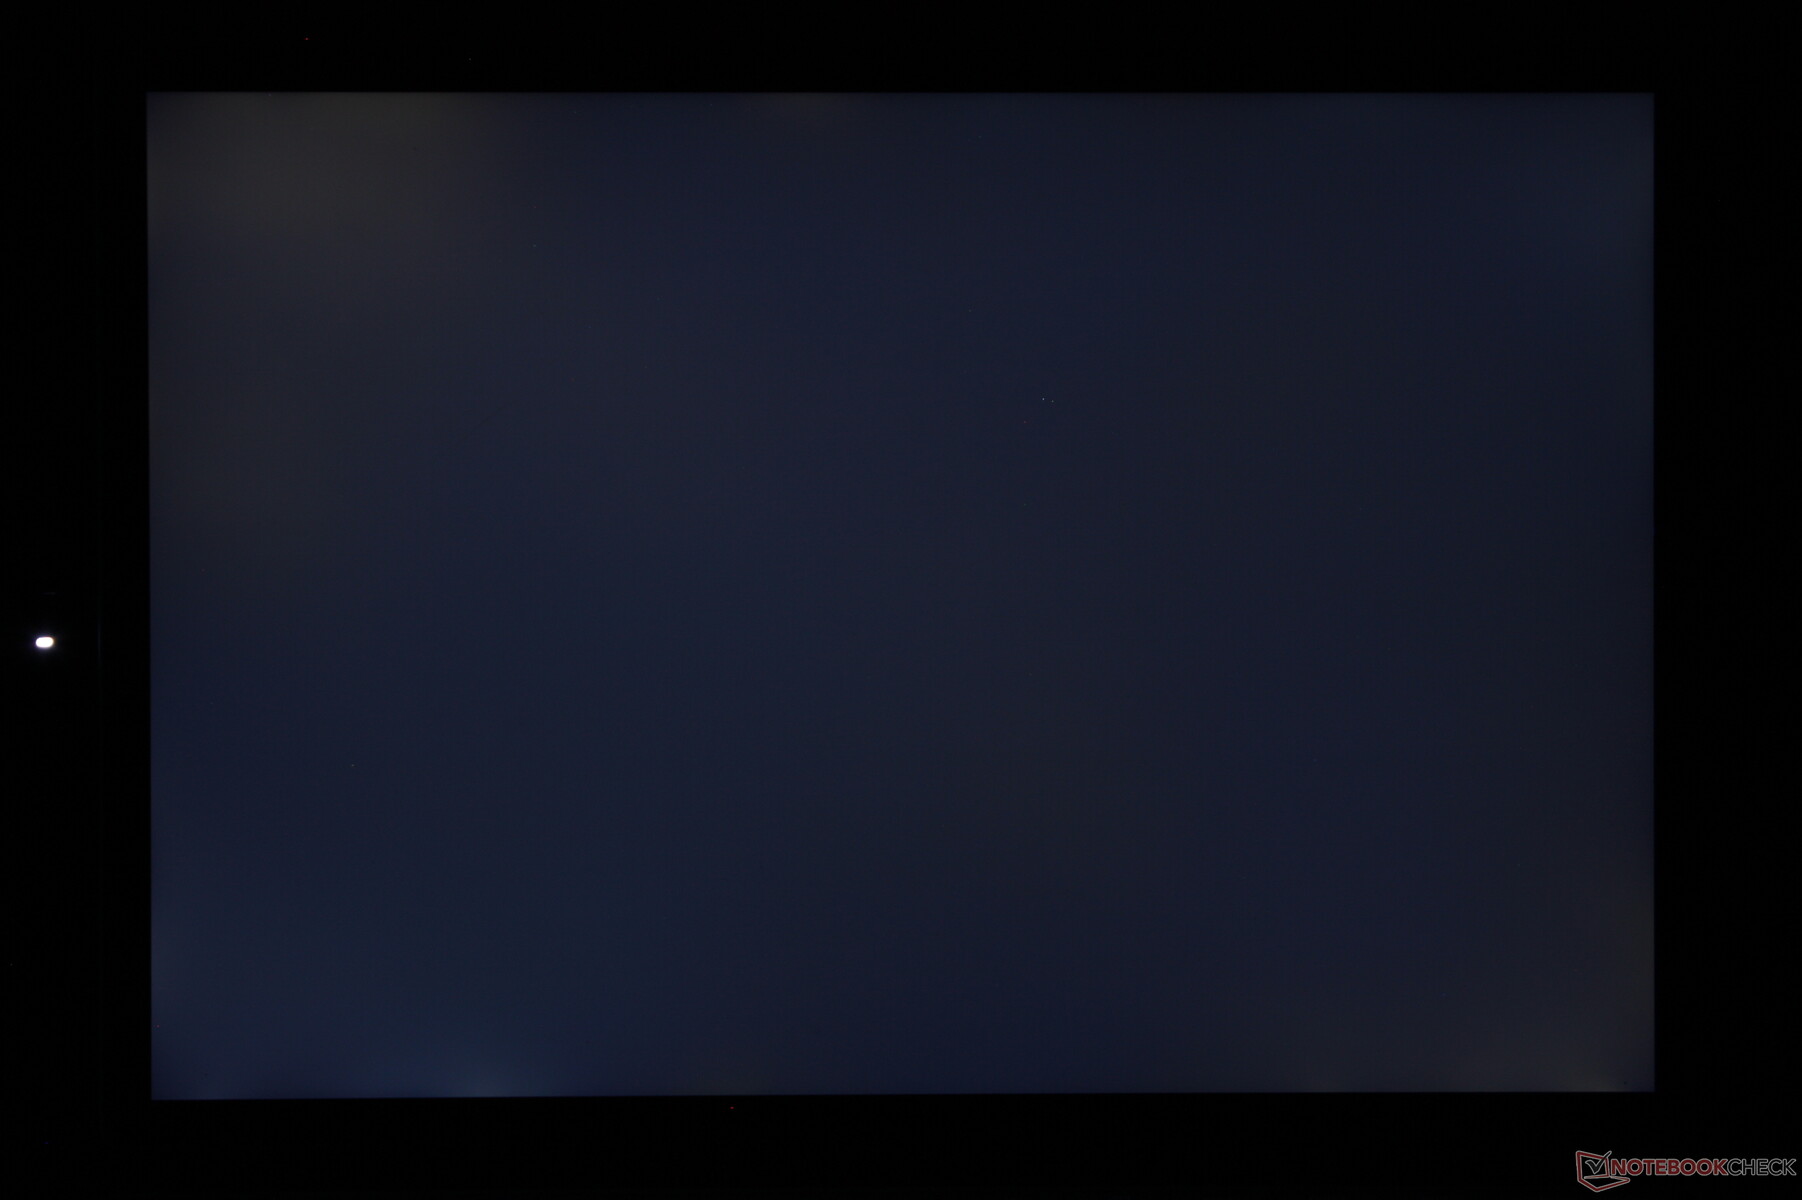
There are two notable drawbacks worth mentioning. Firstly, black-white and gray-gray response times are relatively slow for noticeable ghosting when moving the cursor or scrolling through web pages. Secondly, brightness uniformity could have been better as the top left of the screen is about 50 nits brighter than the bottom right. It's nothing major, but an OLED option could have easily addressed both of these disadvantages.
We would like to see higher refresh rate panels and perhaps full P3 colors on future SKUs. The Surface Pro 8, for example, has 120 Hz refresh rate options to boost UI responsiveness. Meanwhile, users will have to consider clamshell laptops like the Dell XPS 13 Plus 9320 or Asus VivoBook to find OLED features at the moment.
| |||||||||||||||||||||||||
Brightness Distribution: 87 %
Center on Battery: 507 cd/m²
Contrast: 1491:1 (Black: 0.34 cd/m²)
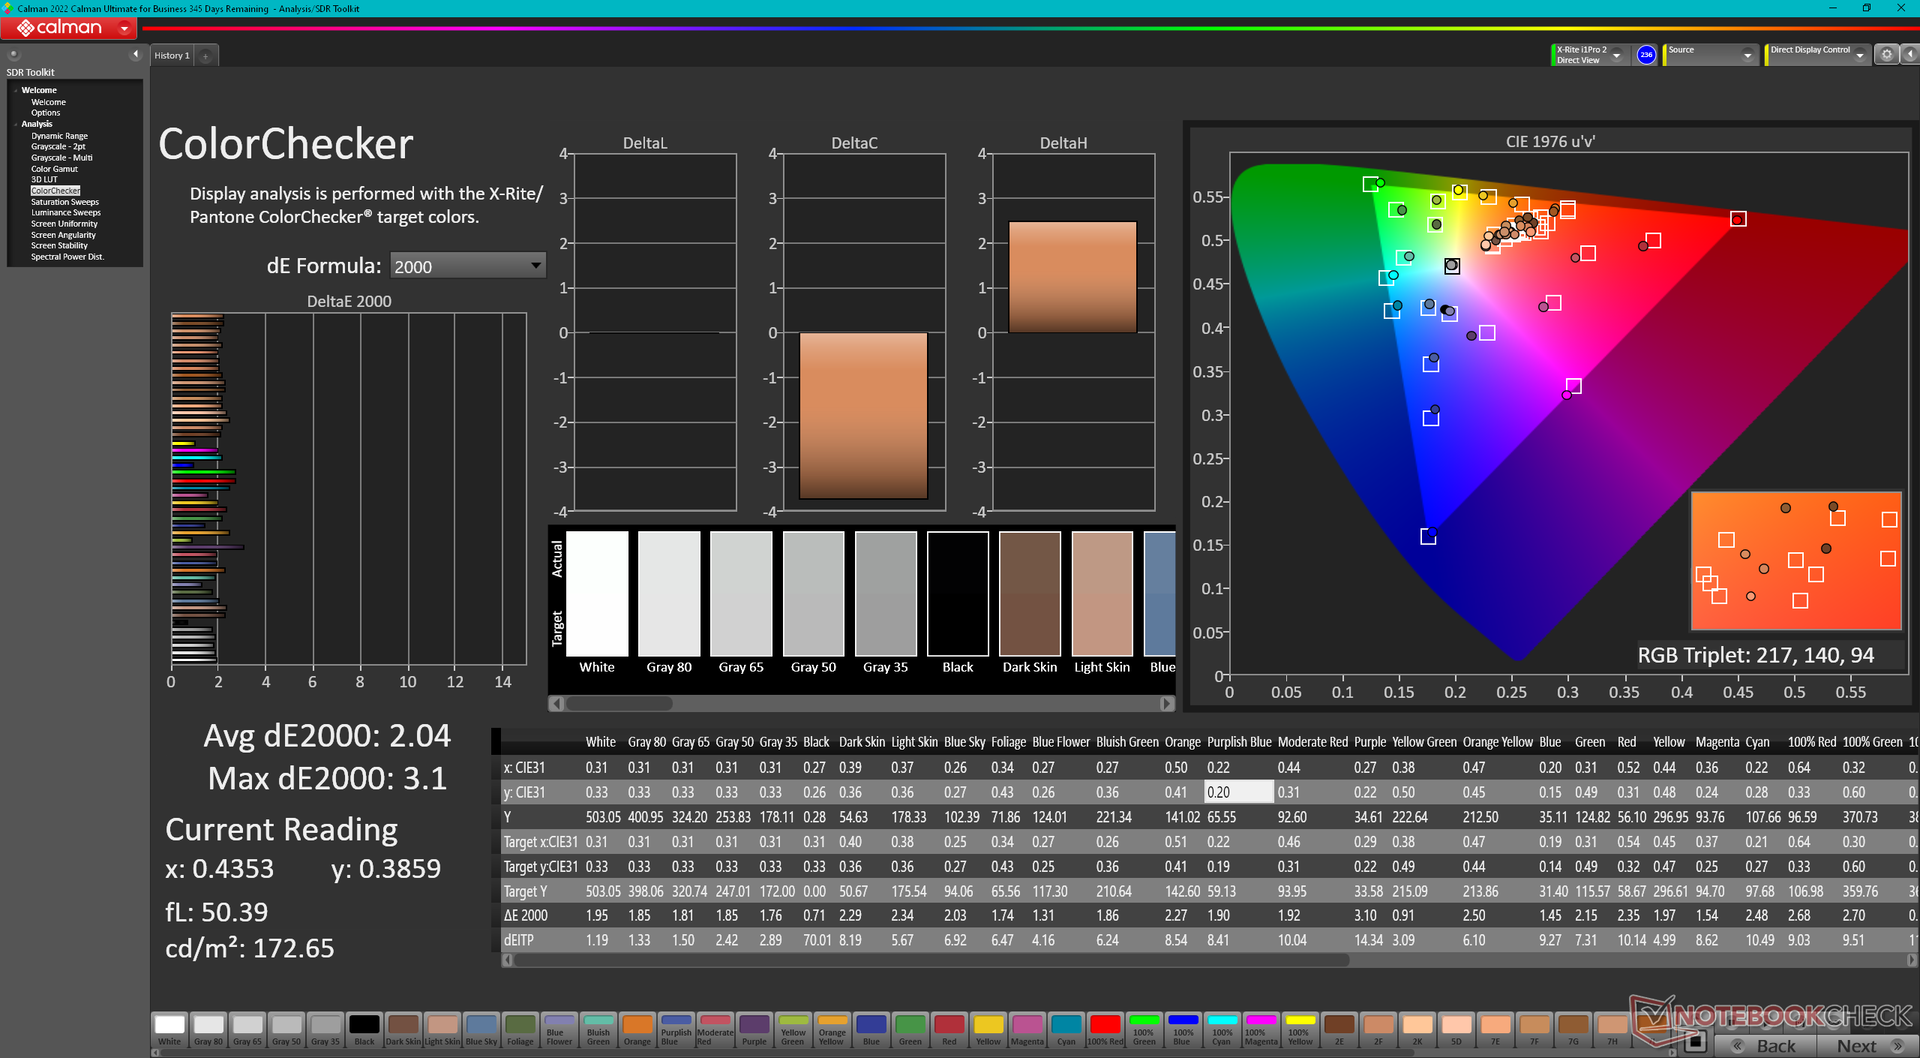
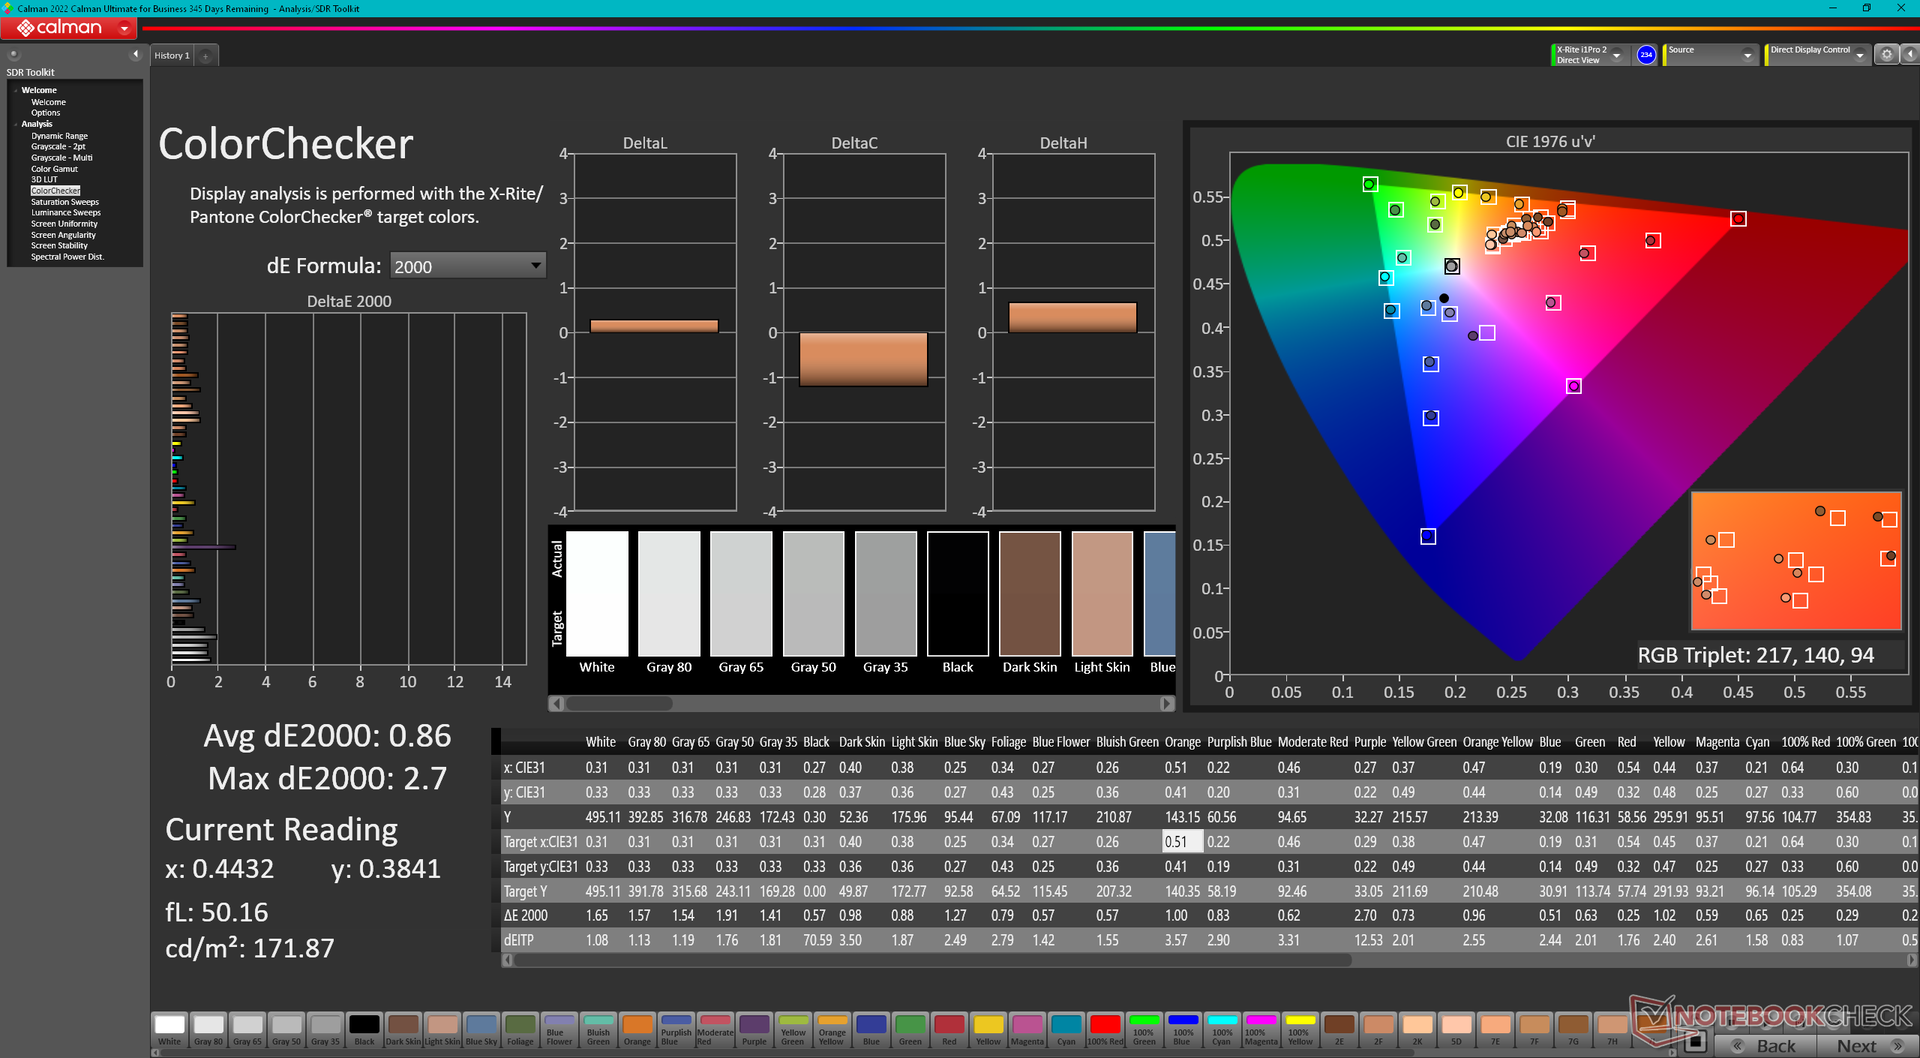
ΔE ColorChecker Calman: 2.04 | ∀{0.5-29.43 Ø4.75}
calibrated: 0.86
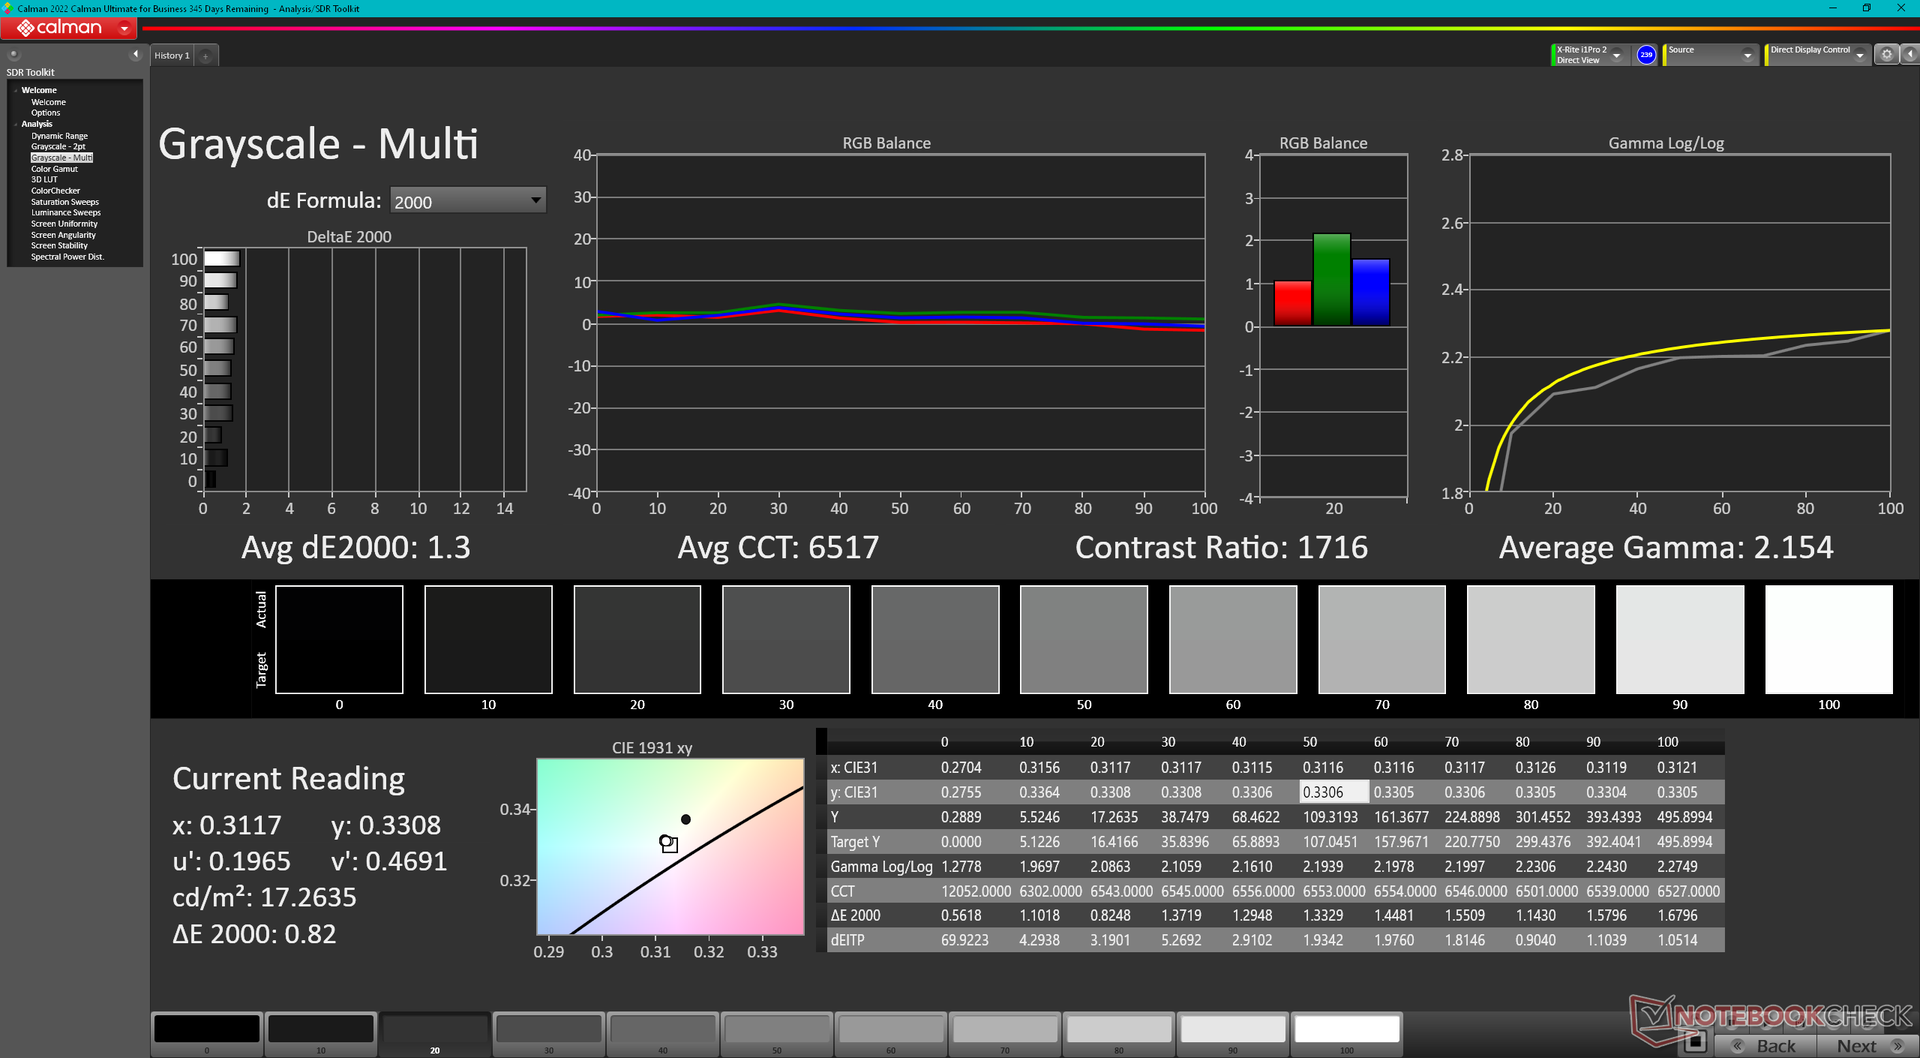
ΔE Greyscale Calman: 1.8 | ∀{0.09-98 Ø5}
72.6% AdobeRGB 1998 (Argyll 3D)
99.8% sRGB (Argyll 3D)
70.7% Display P3 (Argyll 3D)
Gamma: 2.12
CCT: 6561 K
| Dell XPS 13 9315 2-in-1 Core i5-1230U BOE NE13A1M, IPS, 2880x1920, 13" | Dell XPS 13 Plus 9320 i7-1280P OLED Samsung 134XK04, OLED, 3456x2160, 13.4" | Microsoft Surface Pro 8, i7-1185G7 LP129WT212166, IPS, 2880x1920, 13" | HP Spectre x360 13.5 14t-ef000 SDC4160, OLED, 3000x2000, 13.5" | Lenovo ThinkBook Plus Gen2 Core i5 CSOT T3 MND307DA1-5 (LCD), IPS, E-Ink, 2560x1600, 13.3" | Apple MacBook Air M2 Entry IPS, 2560x1664, 13.6" | |
|---|---|---|---|---|---|---|
| Display | 26% | 6% | 22% | -1% | 20% | |
| Display P3 Coverage (%) | 70.7 | 99.5 41% | 78.2 11% | 99.9 41% | 70.1 -1% | 98.4 39% |
| sRGB Coverage (%) | 99.8 | 100 0% | 100 0% | 100 0% | 98 -2% | 99.9 0% |
| AdobeRGB 1998 Coverage (%) | 72.6 | 98.4 36% | 77.6 7% | 90.8 25% | 72.2 -1% | 87.6 21% |
| Response Times | 93% | 1% | 94% | -5% | 13% | |
| Response Time Grey 50% / Grey 80% * (ms) | 44 ? | 2.6 ? 94% | 46.4 ? -5% | 1.9 ? 96% | 42.8 ? 3% | 32.9 ? 25% |
| Response Time Black / White * (ms) | 24.8 ? | 2.1 ? 92% | 23.2 ? 6% | 2.16 ? 91% | 28 ? -13% | 24.9 ? -0% |
| PWM Frequency (Hz) | 59.5 | 29760 ? | 60.2 ? | |||
| Screen | -27% | -19% | -29% | -36% | 5% | |
| Brightness middle (cd/m²) | 507 | 371.8 -27% | 444 -12% | 351.7 -31% | 404 -20% | 526 4% |
| Brightness (cd/m²) | 486 | 374 -23% | 451 -7% | 351 -28% | 388 -20% | 486 0% |
| Brightness Distribution (%) | 87 | 98 13% | 91 5% | 87 0% | 94 8% | 87 0% |
| Black Level * (cd/m²) | 0.34 | 0.43 -26% | 0.24 29% | 0.38 -12% | ||
| Contrast (:1) | 1491 | 1033 -31% | 1683 13% | 1384 -7% | ||
| Colorchecker dE 2000 * | 2.04 | 2.37 -16% | 2 2% | 1.78 13% | 3.1 -52% | 1.3 36% |
| Colorchecker dE 2000 max. * | 3.1 | 6.1 -97% | 3.2 -3% | 6.14 -98% | 6.9 -123% | 2.7 13% |
| Colorchecker dE 2000 calibrated * | 0.86 | 1.7 -98% | 1.3 -51% | 0.7 19% | ||
| Greyscale dE 2000 * | 1.8 | 2 -11% | 1.8 -0% | 2.3 -28% | 3.7 -106% | 2 -11% |
| Gamma | 2.12 104% | 2.29 96% | 2.11 104% | 2.11 104% | 2.26 97% | 2.25 98% |
| CCT | 6561 99% | 6261 104% | 6417 101% | 6683 97% | 5936 110% | 6858 95% |
| Total Average (Program / Settings) | 31% /
9% | -4% /
-11% | 29% /
7% | -14% /
-24% | 13% /
9% |
* ... smaller is better
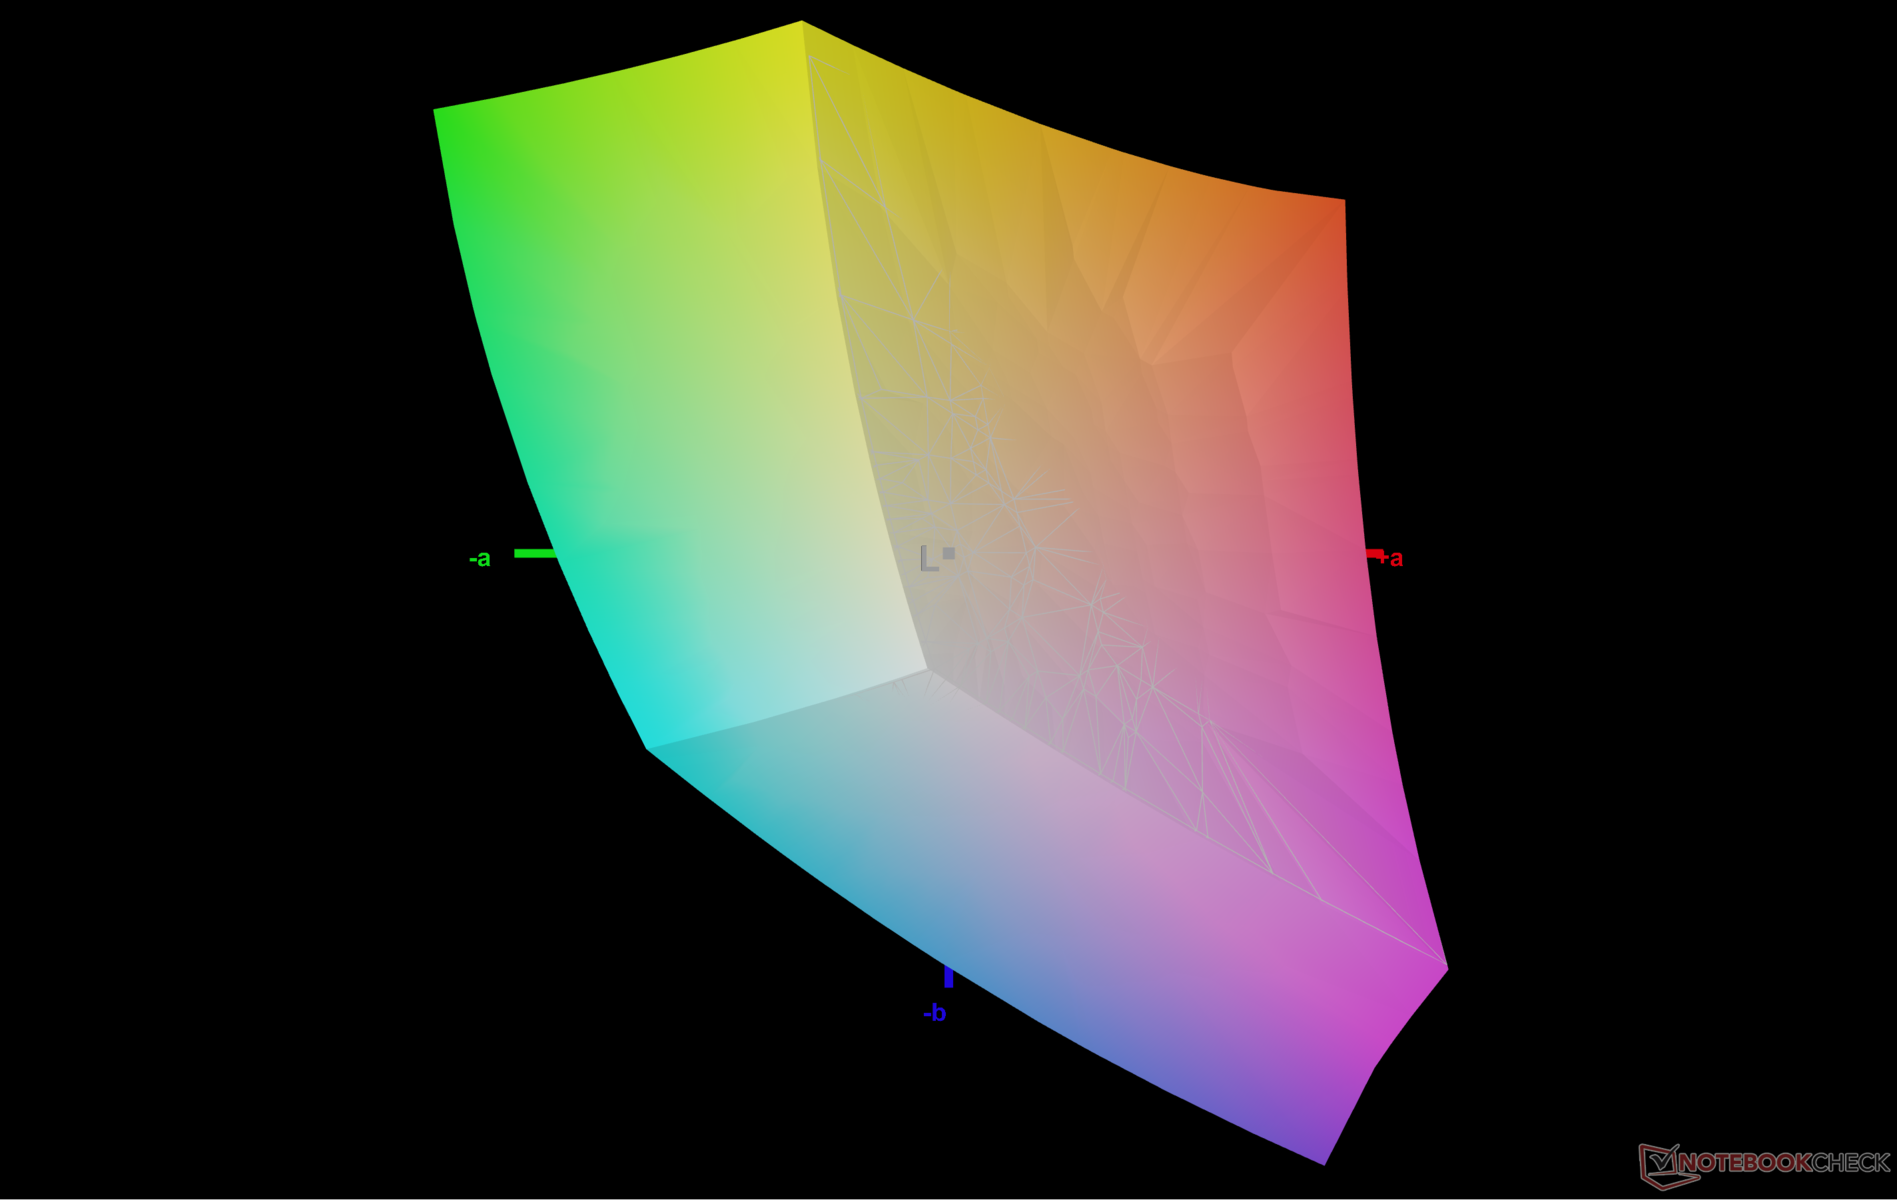
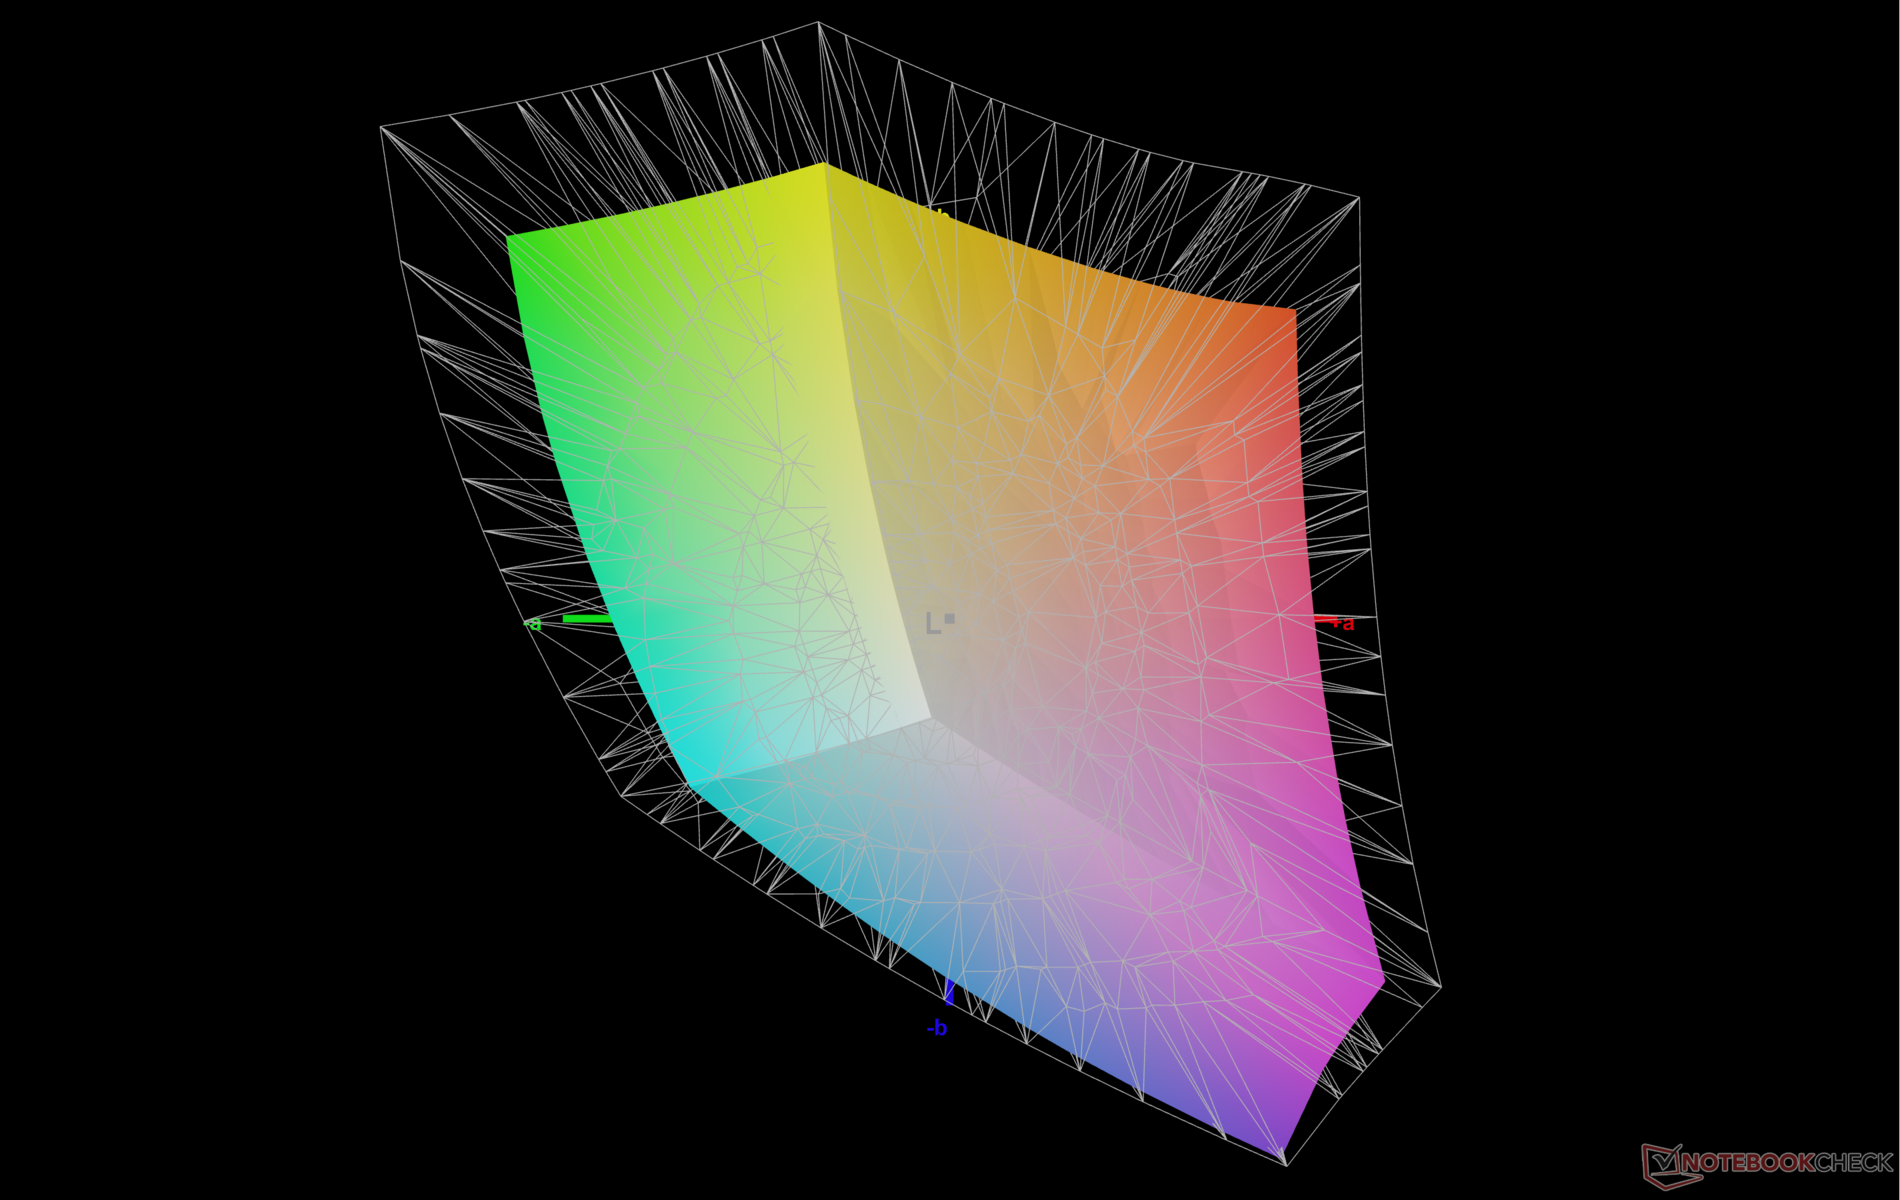
The display is already well-calibrated out of the box with average grayscale and color DeltaE values of only 1.8 and 2.04, respectively. Calibrating the display even further ourselves with an X-Rite colorimeter would improve the averages down to just 1.3 and 0.86, but end-user calibration won't be necessary for most.
Display Response Times
| ↔ Response Time Black to White | ||
|---|---|---|
| 24.8 ms ... rise ↗ and fall ↘ combined | ↗ 11.6 ms rise |  |
| ↘ 13.2 ms fall | ||
| The screen shows good response rates in our tests, but may be too slow for competitive gamers. In comparison, all tested devices range from 0.1 (minimum) to 240 (maximum) ms. » 57 % of all devices are better. This means that the measured response time is worse than the average of all tested devices (20.1 ms). | ||
| ↔ Response Time 50% Grey to 80% Grey | ||
| 44 ms ... rise ↗ and fall ↘ combined | ↗ 23.6 ms rise | 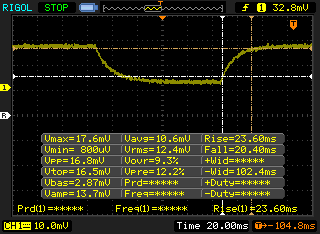 |
| ↘ 20.4 ms fall | ||
| The screen shows slow response rates in our tests and will be unsatisfactory for gamers. In comparison, all tested devices range from 0.165 (minimum) to 636 (maximum) ms. » 73 % of all devices are better. This means that the measured response time is worse than the average of all tested devices (31.4 ms). | ||
Screen Flickering / PWM (Pulse-Width Modulation)
| Screen flickering / PWM not detected | 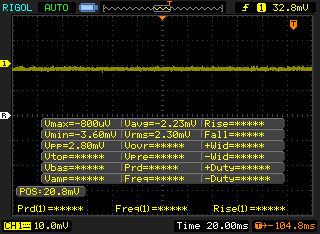 | ||
In comparison: 53 % of all tested devices do not use PWM to dim the display. If PWM was detected, an average of 7996 (minimum: 5 - maximum: 343500) Hz was measured. | |||
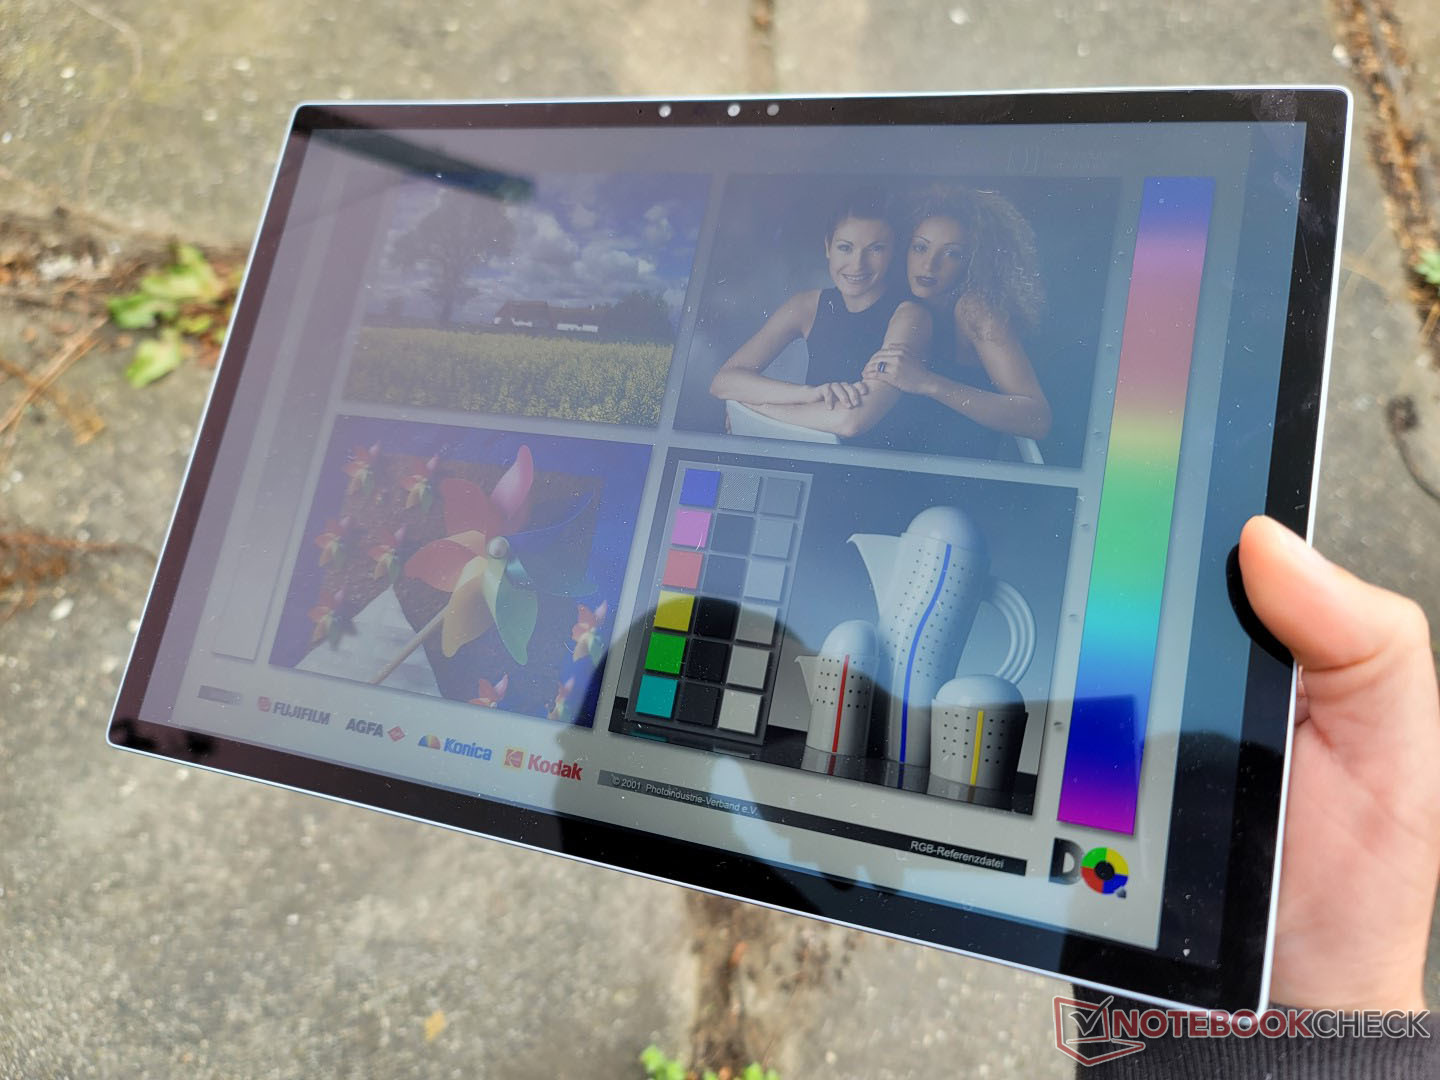
Glare is ever-present and essentially unavoidable on the glossy touchscreen. The display is fortunately bright enough to keep glare at a minimum when working outdoors under shade. If under brighter conditions, however, the colors and viewing experience degrade quickly. Certain HP Elite x2 models have 1000-nit display options which would make it 2x brighter than the Dell for easier readability outdoors.

Performance — Good CPU Performance, Meh GPU Performance
Testing Conditions
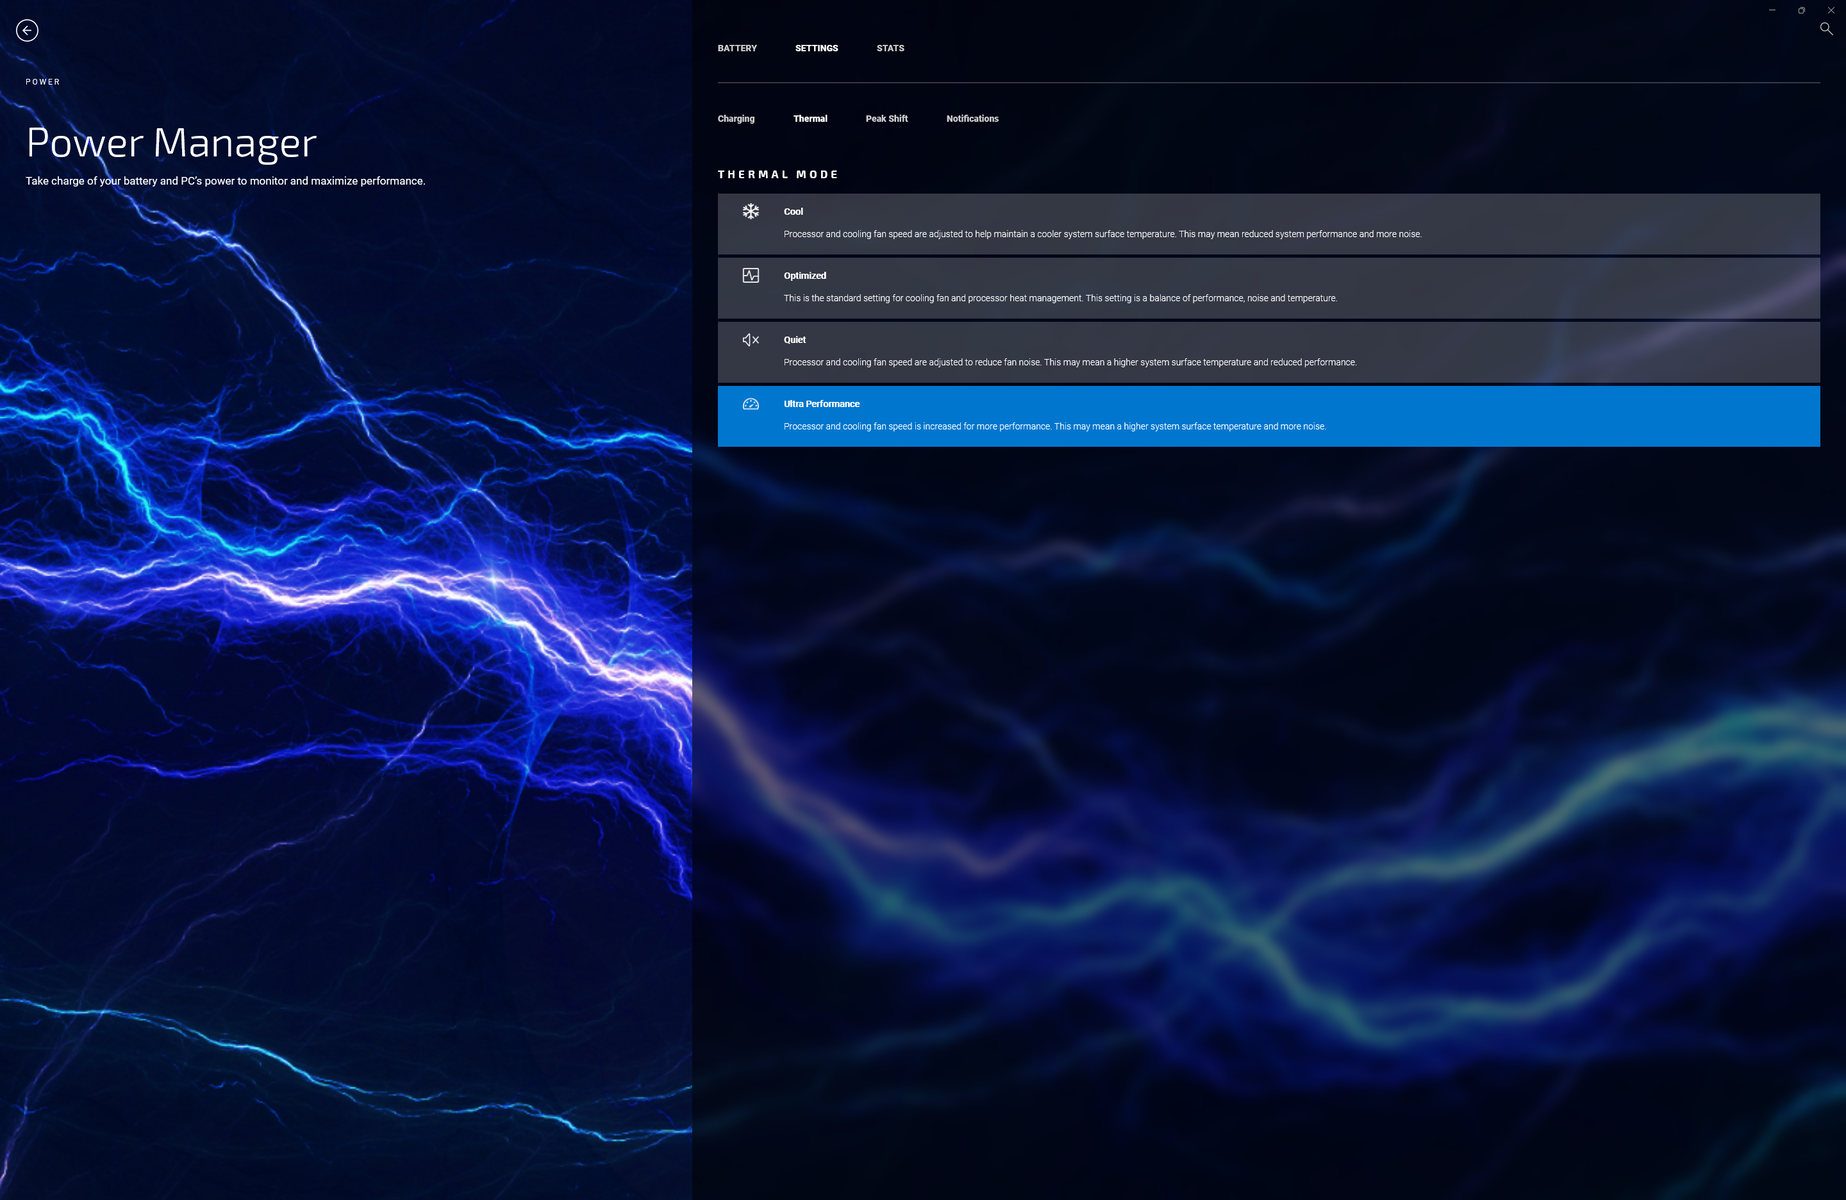
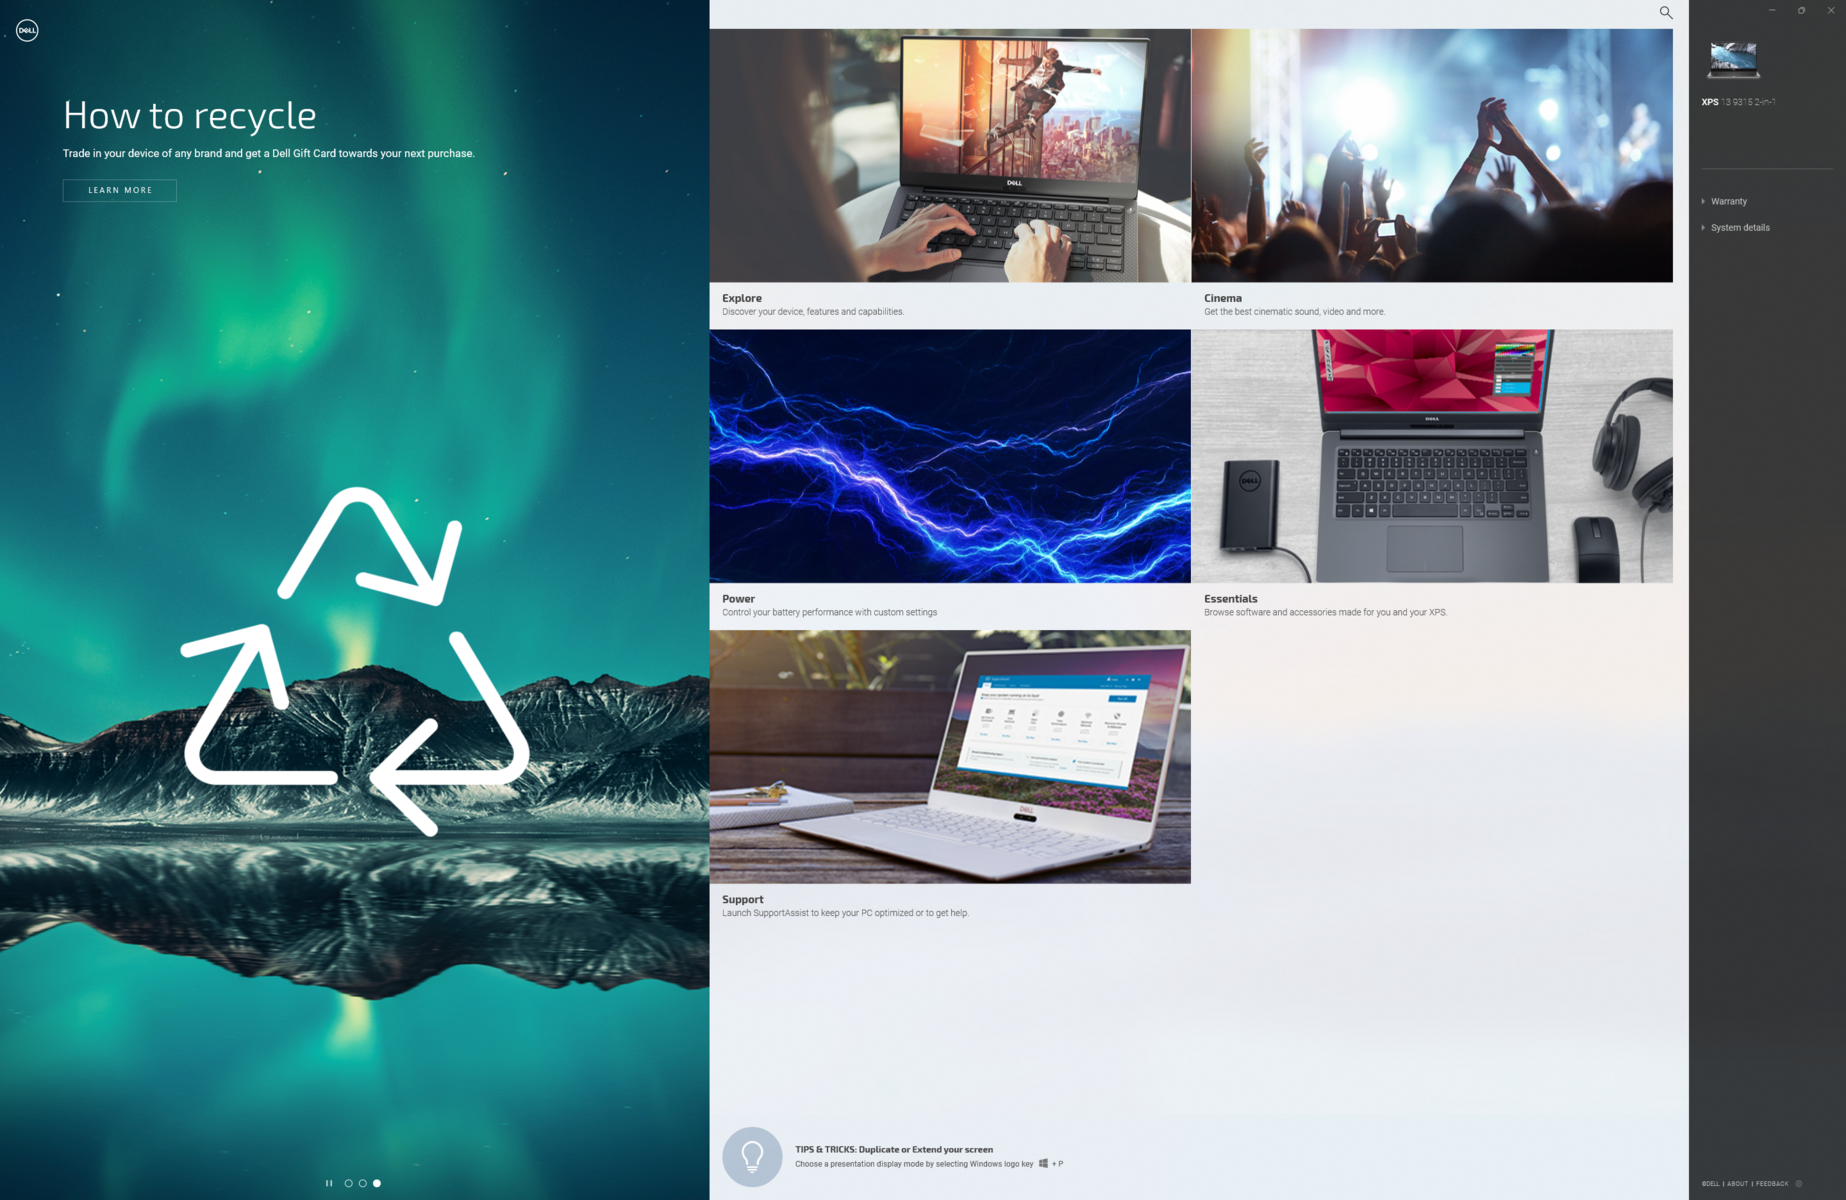
We set our unit to 'Ultra performance mode' and 'Best performance' mode via Dell Power Manager and Windows, respectively, prior to running any benchmarks below. Owners should become familiar with the My Dell software as it is the control hub for adjusting charging behavior, system performance, notifications, and more as shown by the screenshots below.
Processor
The XPS 13 9315 2-in-1 shares the same Core i5-1230U CPU as found on the XPS 13 9315 clamshell. One might expect the clamshell model to perform a little faster than the 2-in-1 model, but the opposite is true. Our results below show the XPS 13 9315 2-in-1 consistently ahead of the XPS 13 9315 clamshell by significant margins of about 70 percent in multi-threaded workloads. The results are wide enough to pull out ahead of even the Core i7-1185G7 in the Surface Pro 8.
Upgrading to the Core i7-1250U SKU is only expected to boost performance by about 5 percent based on our experience with the latest HP Envy x360 13. For much faster performance, you'll want to consider the XPS 13 Plus 9320 and its P-series CPU options instead.
Performance sustainability is limited on the XPS 13 9315 2-in-1 since it is a fanless design. When running CineBench R15 xT in a loop, for example, the initial score of 1252 points would steadily drop to 750 points over time to represent a performance loss of 40 percent. Nonetheless, performance is still faster than the same CPU in the XPS 13 9315 clamshell by about 50 percent even after accounting for throttling on both machines.
Cinebench R15 Multi Loop
Cinebench R23: Multi Core | Single Core
Cinebench R15: CPU Multi 64Bit | CPU Single 64Bit
Blender: v2.79 BMW27 CPU
7-Zip 18.03: 7z b 4 | 7z b 4 -mmt1
Geekbench 5.5: Multi-Core | Single-Core
HWBOT x265 Benchmark v2.2: 4k Preset
LibreOffice : 20 Documents To PDF
R Benchmark 2.5: Overall mean
| HWBOT x265 Benchmark v2.2 / 4k Preset | |
| Dell XPS 13 Plus 9320 i7-1280P OLED | |
| HP Spectre x360 13.5 14t-ef000 | |
| Dell XPS 13 9315 2-in-1 Core i5-1230U | |
| Microsoft Surface Pro 8, i7-1185G7 | |
* ... smaller is better
AIDA64: FP32 Ray-Trace | FPU Julia | CPU SHA3 | CPU Queen | FPU SinJulia | FPU Mandel | CPU AES | CPU ZLib | FP64 Ray-Trace | CPU PhotoWorxx
| Performance rating | |
| Dell XPS 13 Plus 9320 i7-1280P OLED | |
| HP Spectre x360 13.5 14t-ef000 | |
| Microsoft Surface Pro 8, i7-1185G7 | |
| Dell XPS 13 9315 2-in-1 Core i5-1230U | |
| Lenovo ThinkBook Plus Gen2 Core i5 | |
| Average Intel Core i5-1230U | |
| AIDA64 / FP32 Ray-Trace | |
| Dell XPS 13 Plus 9320 i7-1280P OLED | |
| HP Spectre x360 13.5 14t-ef000 | |
| Microsoft Surface Pro 8, i7-1185G7 | |
| Dell XPS 13 9315 2-in-1 Core i5-1230U | |
| Lenovo ThinkBook Plus Gen2 Core i5 | |
| Average Intel Core i5-1230U (2344 - 6360, n=3) | |
| AIDA64 / FPU Julia | |
| Dell XPS 13 Plus 9320 i7-1280P OLED | |
| HP Spectre x360 13.5 14t-ef000 | |
| Dell XPS 13 9315 2-in-1 Core i5-1230U | |
| Microsoft Surface Pro 8, i7-1185G7 | |
| Lenovo ThinkBook Plus Gen2 Core i5 | |
| Average Intel Core i5-1230U (11867 - 31714, n=3) | |
| AIDA64 / CPU SHA3 | |
| Dell XPS 13 Plus 9320 i7-1280P OLED | |
| HP Spectre x360 13.5 14t-ef000 | |
| Microsoft Surface Pro 8, i7-1185G7 | |
| Dell XPS 13 9315 2-in-1 Core i5-1230U | |
| Lenovo ThinkBook Plus Gen2 Core i5 | |
| Average Intel Core i5-1230U (772 - 1711, n=3) | |
| AIDA64 / CPU Queen | |
| Dell XPS 13 Plus 9320 i7-1280P OLED | |
| HP Spectre x360 13.5 14t-ef000 | |
| Dell XPS 13 9315 2-in-1 Core i5-1230U | |
| Microsoft Surface Pro 8, i7-1185G7 | |
| Average Intel Core i5-1230U (30824 - 52533, n=3) | |
| Lenovo ThinkBook Plus Gen2 Core i5 | |
| AIDA64 / FPU SinJulia | |
| Dell XPS 13 Plus 9320 i7-1280P OLED | |
| Microsoft Surface Pro 8, i7-1185G7 | |
| HP Spectre x360 13.5 14t-ef000 | |
| Dell XPS 13 9315 2-in-1 Core i5-1230U | |
| Lenovo ThinkBook Plus Gen2 Core i5 | |
| Average Intel Core i5-1230U (2269 - 3947, n=3) | |
| AIDA64 / FPU Mandel | |
| Dell XPS 13 Plus 9320 i7-1280P OLED | |
| HP Spectre x360 13.5 14t-ef000 | |
| Microsoft Surface Pro 8, i7-1185G7 | |
| Dell XPS 13 9315 2-in-1 Core i5-1230U | |
| Lenovo ThinkBook Plus Gen2 Core i5 | |
| Average Intel Core i5-1230U (6379 - 15896, n=3) | |
| AIDA64 / CPU AES | |
| HP Spectre x360 13.5 14t-ef000 | |
| Lenovo ThinkBook Plus Gen2 Core i5 | |
| Dell XPS 13 Plus 9320 i7-1280P OLED | |
| Microsoft Surface Pro 8, i7-1185G7 | |
| Dell XPS 13 9315 2-in-1 Core i5-1230U | |
| Average Intel Core i5-1230U (18011 - 31941, n=3) | |
| AIDA64 / CPU ZLib | |
| Dell XPS 13 Plus 9320 i7-1280P OLED | |
| HP Spectre x360 13.5 14t-ef000 | |
| Dell XPS 13 9315 2-in-1 Core i5-1230U | |
| Average Intel Core i5-1230U (229 - 495, n=3) | |
| Lenovo ThinkBook Plus Gen2 Core i5 | |
| Microsoft Surface Pro 8, i7-1185G7 | |
| AIDA64 / FP64 Ray-Trace | |
| Dell XPS 13 Plus 9320 i7-1280P OLED | |
| HP Spectre x360 13.5 14t-ef000 | |
| Microsoft Surface Pro 8, i7-1185G7 | |
| Dell XPS 13 9315 2-in-1 Core i5-1230U | |
| Lenovo ThinkBook Plus Gen2 Core i5 | |
| Average Intel Core i5-1230U (1328 - 3305, n=3) | |
| AIDA64 / CPU PhotoWorxx | |
| Dell XPS 13 Plus 9320 i7-1280P OLED | |
| HP Spectre x360 13.5 14t-ef000 | |
| Lenovo ThinkBook Plus Gen2 Core i5 | |
| Microsoft Surface Pro 8, i7-1185G7 | |
| Dell XPS 13 9315 2-in-1 Core i5-1230U | |
| Average Intel Core i5-1230U (17516 - 37042, n=3) | |
System Performance
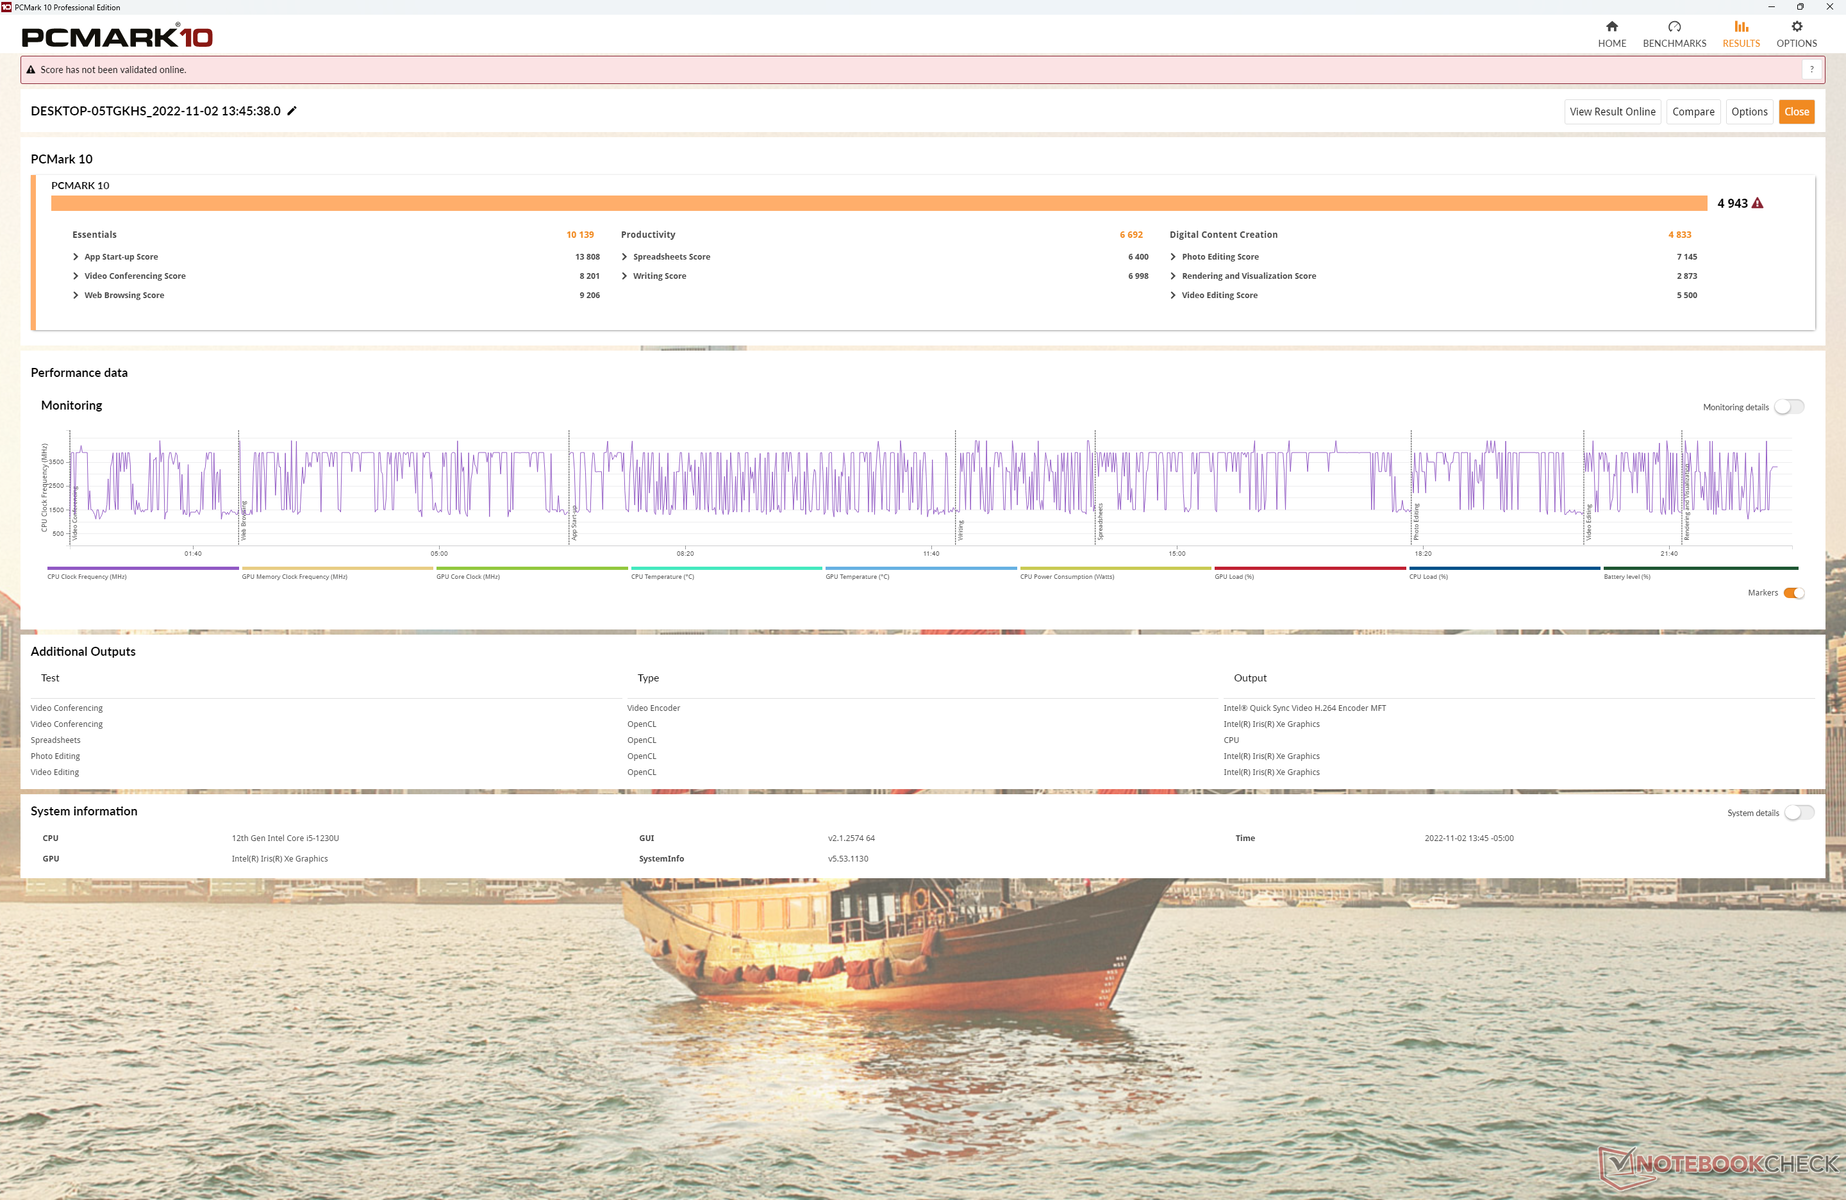
PCMark 10 results are comparable to the Surface Pro 8 except in the Digital Content Creation subtest where graphics performance matters most. This aligns with our GPU test results below where the XPS 13 9315 2-in-1 would exhibit slower-than-average graphics performance for the category.
CrossMark: Overall | Productivity | Creativity | Responsiveness
| PCMark 10 / Score | |
| Dell XPS 13 Plus 9320 i7-1280P OLED | |
| HP Spectre x360 13.5 14t-ef000 | |
| Microsoft Surface Pro 8, i7-1185G7 | |
| Dell XPS 13 9315 2-in-1 Core i5-1230U | |
| Average Intel Core i5-1230U, Intel Iris Xe Graphics G7 80EUs (4001 - 4943, n=3) | |
| Lenovo ThinkBook Plus Gen2 Core i5 | |
| PCMark 10 / Essentials | |
| HP Spectre x360 13.5 14t-ef000 | |
| Dell XPS 13 Plus 9320 i7-1280P OLED | |
| Lenovo ThinkBook Plus Gen2 Core i5 | |
| Dell XPS 13 9315 2-in-1 Core i5-1230U | |
| Microsoft Surface Pro 8, i7-1185G7 | |
| Average Intel Core i5-1230U, Intel Iris Xe Graphics G7 80EUs (8348 - 10139, n=3) | |
| PCMark 10 / Productivity | |
| HP Spectre x360 13.5 14t-ef000 | |
| Dell XPS 13 Plus 9320 i7-1280P OLED | |
| Dell XPS 13 9315 2-in-1 Core i5-1230U | |
| Microsoft Surface Pro 8, i7-1185G7 | |
| Average Intel Core i5-1230U, Intel Iris Xe Graphics G7 80EUs (5735 - 6692, n=3) | |
| Lenovo ThinkBook Plus Gen2 Core i5 | |
| PCMark 10 / Digital Content Creation | |
| Dell XPS 13 Plus 9320 i7-1280P OLED | |
| Microsoft Surface Pro 8, i7-1185G7 | |
| HP Spectre x360 13.5 14t-ef000 | |
| Dell XPS 13 9315 2-in-1 Core i5-1230U | |
| Average Intel Core i5-1230U, Intel Iris Xe Graphics G7 80EUs (3632 - 4833, n=3) | |
| Lenovo ThinkBook Plus Gen2 Core i5 | |
| CrossMark / Overall | |
| Dell XPS 13 Plus 9320 i7-1280P OLED | |
| HP Spectre x360 13.5 14t-ef000 | |
| Apple MacBook Air M2 Entry | |
| Microsoft Surface Pro 8, i7-1185G7 | |
| Dell XPS 13 9315 2-in-1 Core i5-1230U | |
| Average Intel Core i5-1230U, Intel Iris Xe Graphics G7 80EUs (1117 - 1383, n=3) | |
| CrossMark / Productivity | |
| Dell XPS 13 Plus 9320 i7-1280P OLED | |
| HP Spectre x360 13.5 14t-ef000 | |
| Microsoft Surface Pro 8, i7-1185G7 | |
| Apple MacBook Air M2 Entry | |
| Dell XPS 13 9315 2-in-1 Core i5-1230U | |
| Average Intel Core i5-1230U, Intel Iris Xe Graphics G7 80EUs (1187 - 1356, n=3) | |
| CrossMark / Creativity | |
| Dell XPS 13 Plus 9320 i7-1280P OLED | |
| Apple MacBook Air M2 Entry | |
| HP Spectre x360 13.5 14t-ef000 | |
| Microsoft Surface Pro 8, i7-1185G7 | |
| Dell XPS 13 9315 2-in-1 Core i5-1230U | |
| Average Intel Core i5-1230U, Intel Iris Xe Graphics G7 80EUs (1095 - 1469, n=3) | |
| CrossMark / Responsiveness | |
| Dell XPS 13 Plus 9320 i7-1280P OLED | |
| HP Spectre x360 13.5 14t-ef000 | |
| Dell XPS 13 9315 2-in-1 Core i5-1230U | |
| Average Intel Core i5-1230U, Intel Iris Xe Graphics G7 80EUs (990 - 1224, n=3) | |
| Microsoft Surface Pro 8, i7-1185G7 | |
| Apple MacBook Air M2 Entry | |
| PCMark 10 Score | 4943 points | |
Help | ||
| AIDA64 / Memory Copy | |
| Dell XPS 13 Plus 9320 i7-1280P OLED | |
| HP Spectre x360 13.5 14t-ef000 | |
| Dell XPS 13 9315 2-in-1 Core i5-1230U | |
| Microsoft Surface Pro 8, i7-1185G7 | |
| Lenovo ThinkBook Plus Gen2 Core i5 | |
| Average Intel Core i5-1230U (32539 - 60944, n=3) | |
| AIDA64 / Memory Read | |
| Dell XPS 13 Plus 9320 i7-1280P OLED | |
| Lenovo ThinkBook Plus Gen2 Core i5 | |
| HP Spectre x360 13.5 14t-ef000 | |
| Microsoft Surface Pro 8, i7-1185G7 | |
| Dell XPS 13 9315 2-in-1 Core i5-1230U | |
| Average Intel Core i5-1230U (31342 - 60435, n=3) | |
| AIDA64 / Memory Write | |
| Dell XPS 13 9315 2-in-1 Core i5-1230U | |
| Lenovo ThinkBook Plus Gen2 Core i5 | |
| HP Spectre x360 13.5 14t-ef000 | |
| Dell XPS 13 Plus 9320 i7-1280P OLED | |
| Microsoft Surface Pro 8, i7-1185G7 | |
| Average Intel Core i5-1230U (33224 - 65665, n=3) | |
| AIDA64 / Memory Latency | |
| Dell XPS 13 9315 2-in-1 Core i5-1230U | |
| Dell XPS 13 Plus 9320 i7-1280P OLED | |
| Microsoft Surface Pro 8, i7-1185G7 | |
| HP Spectre x360 13.5 14t-ef000 | |
| Lenovo ThinkBook Plus Gen2 Core i5 | |
| Average Intel Core i5-1230U (104.3 - 105.3, n=3) | |
* ... smaller is better
DPC Latency
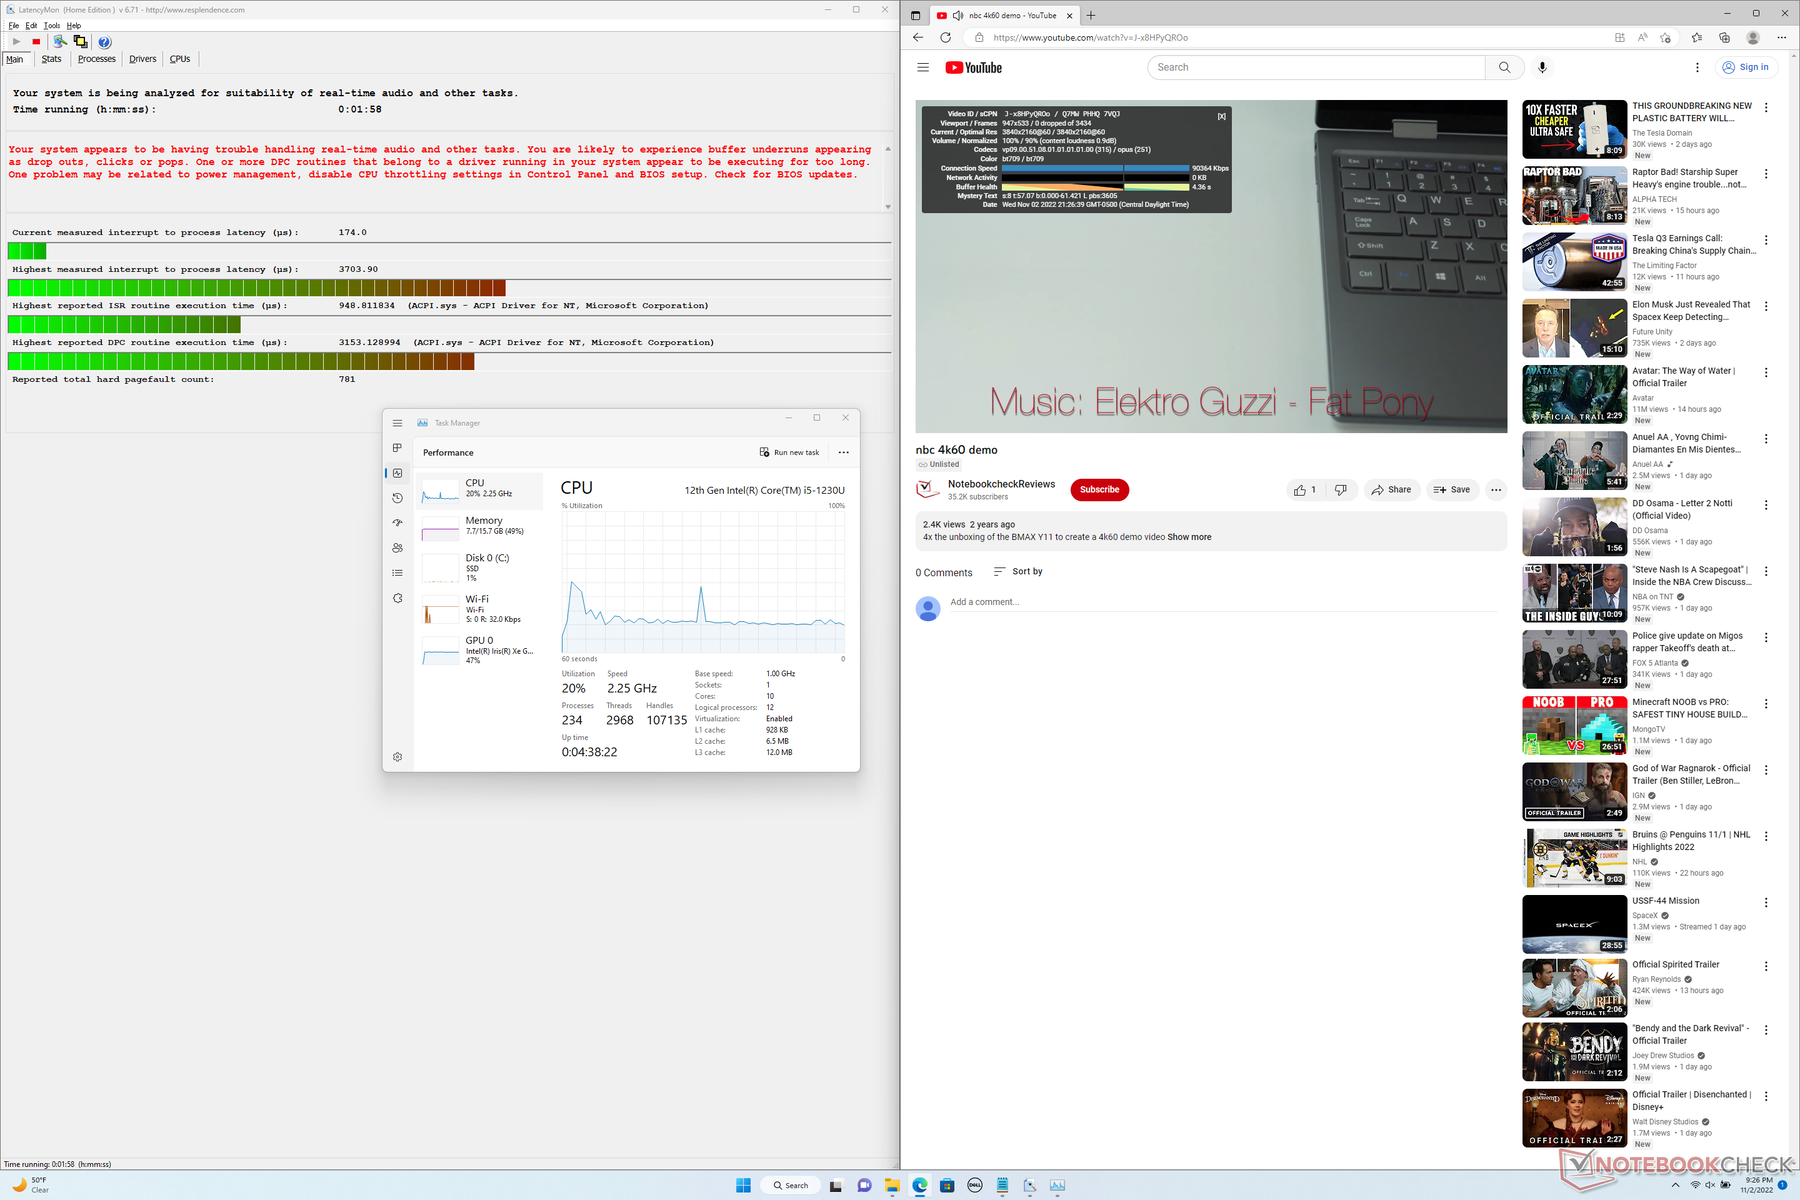
LatencyMon reveals DPC issues when opening multiple browser tabs of our homepage. 4K video playback at 60 FPS is otherwise perfect with no dropped frames.
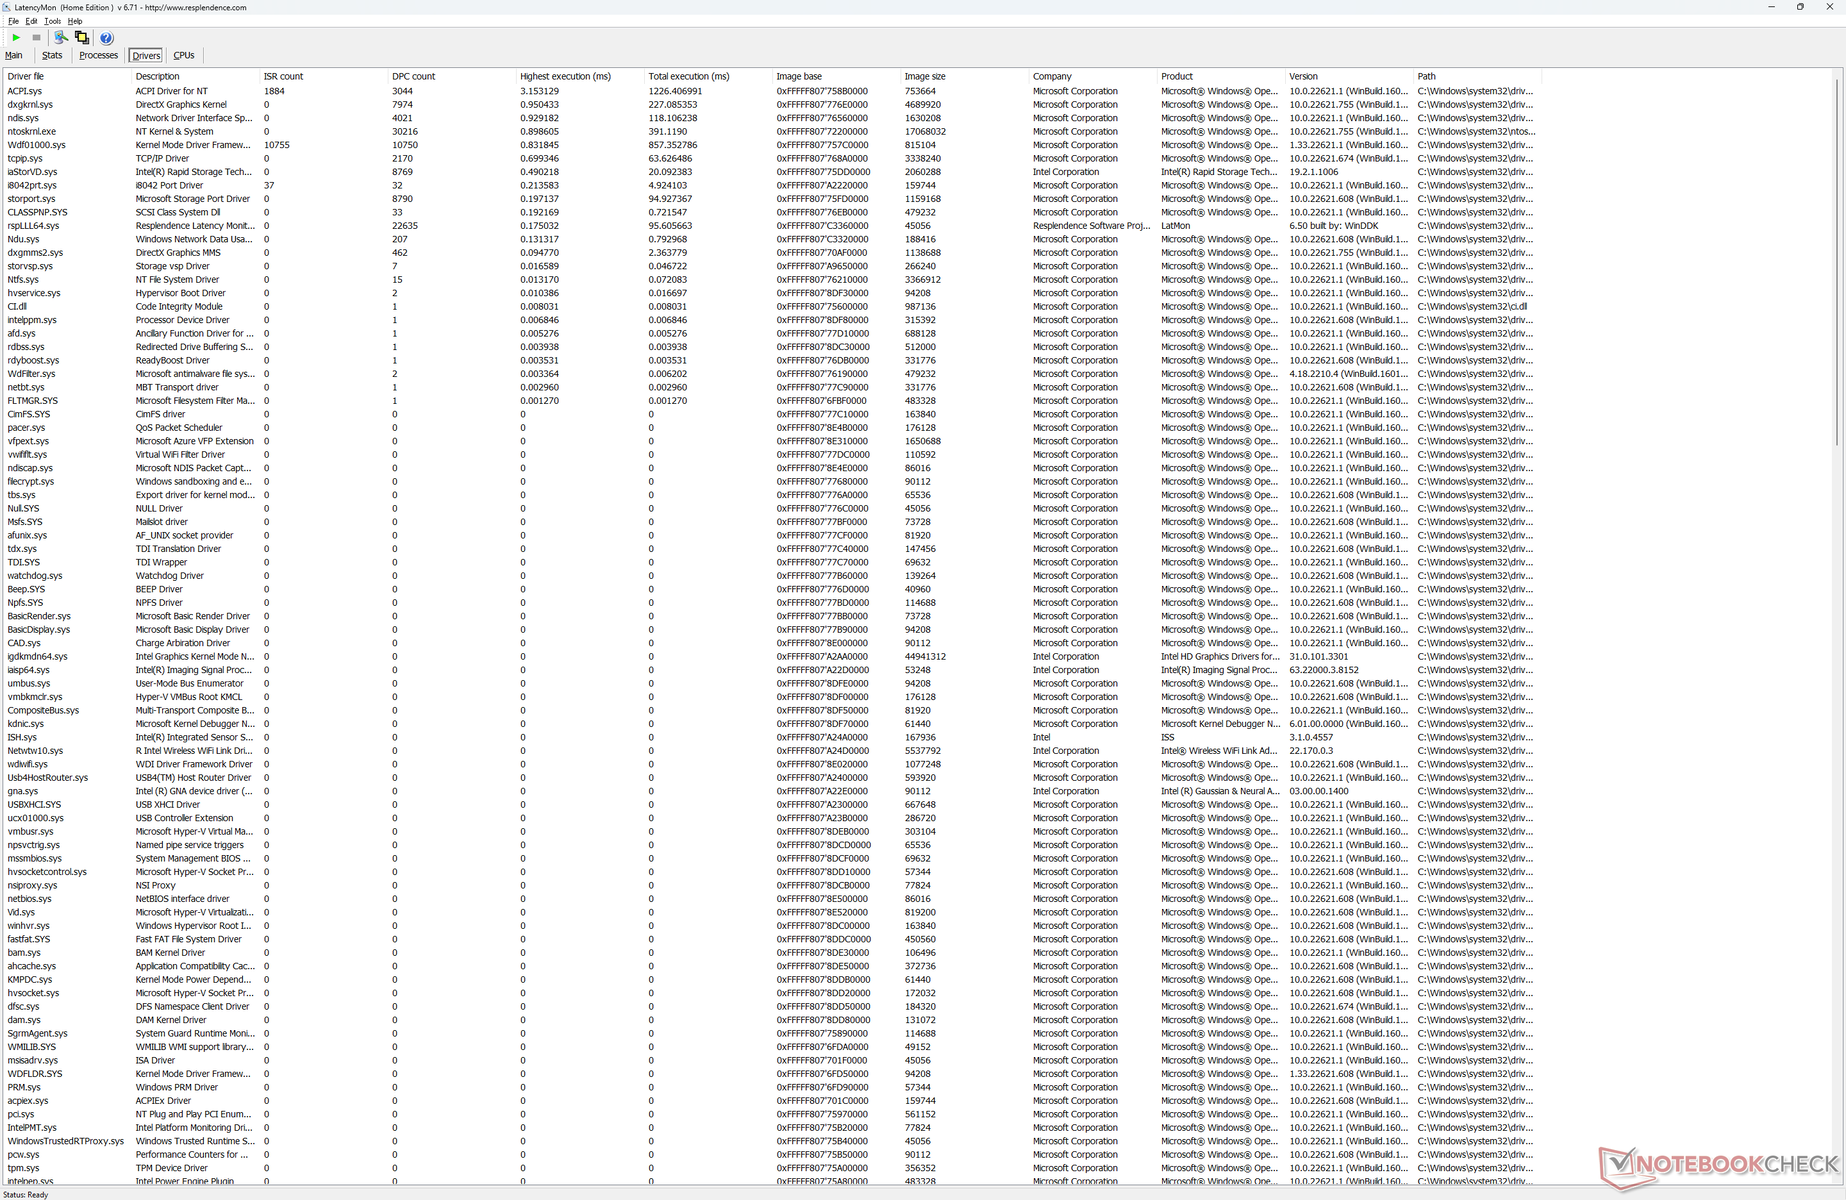
| DPC Latencies / LatencyMon - interrupt to process latency (max), Web, Youtube, Prime95 | |
| Dell XPS 13 9315 2-in-1 Core i5-1230U | |
| Lenovo ThinkBook Plus Gen2 Core i5 | |
| HP Spectre x360 13.5 14t-ef000 | |
| Microsoft Surface Pro 8, i7-1185G7 | |
| Dell XPS 13 Plus 9320 i7-1280P OLED | |
* ... smaller is better
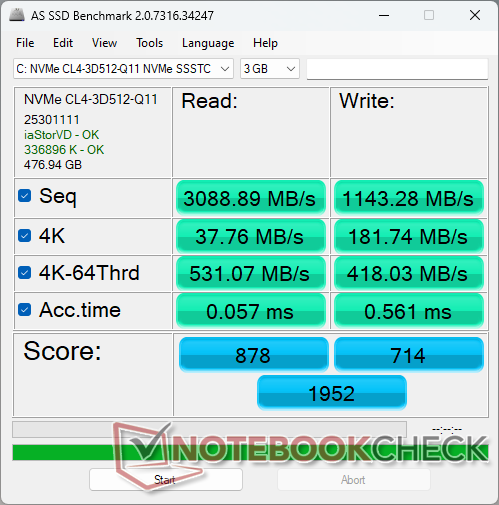
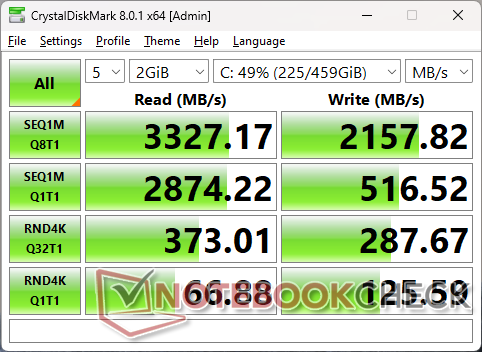
Storage Devices — PCIe4 at PCIe3 Speeds
Dell offers 256 GB, 512 GB, and 1 TB PCIe4 x4 storage options. Unfortunately, performance is closer to most PCIe3 x4 drives than PCIe4 x4. Benchmarks such as CrystalDiskMark and DiskSpd are showing maximum read and write rates of only 3300 MB/s and 2200 MB/s, respectively, compared to 7000 MB/s or faster on the Samsung 980 Pro PCIe4 x4 series. Even so, the 3000 MB/s range is more than enough considering the form factor and Core U-series CPU.

* ... smaller is better
Disk Throttling: DiskSpd Read Loop, Queue Depth 8
GPU Performance
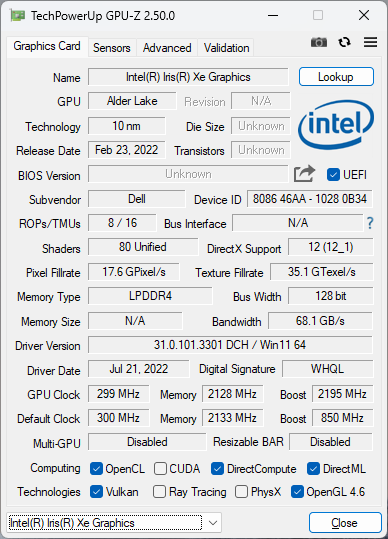
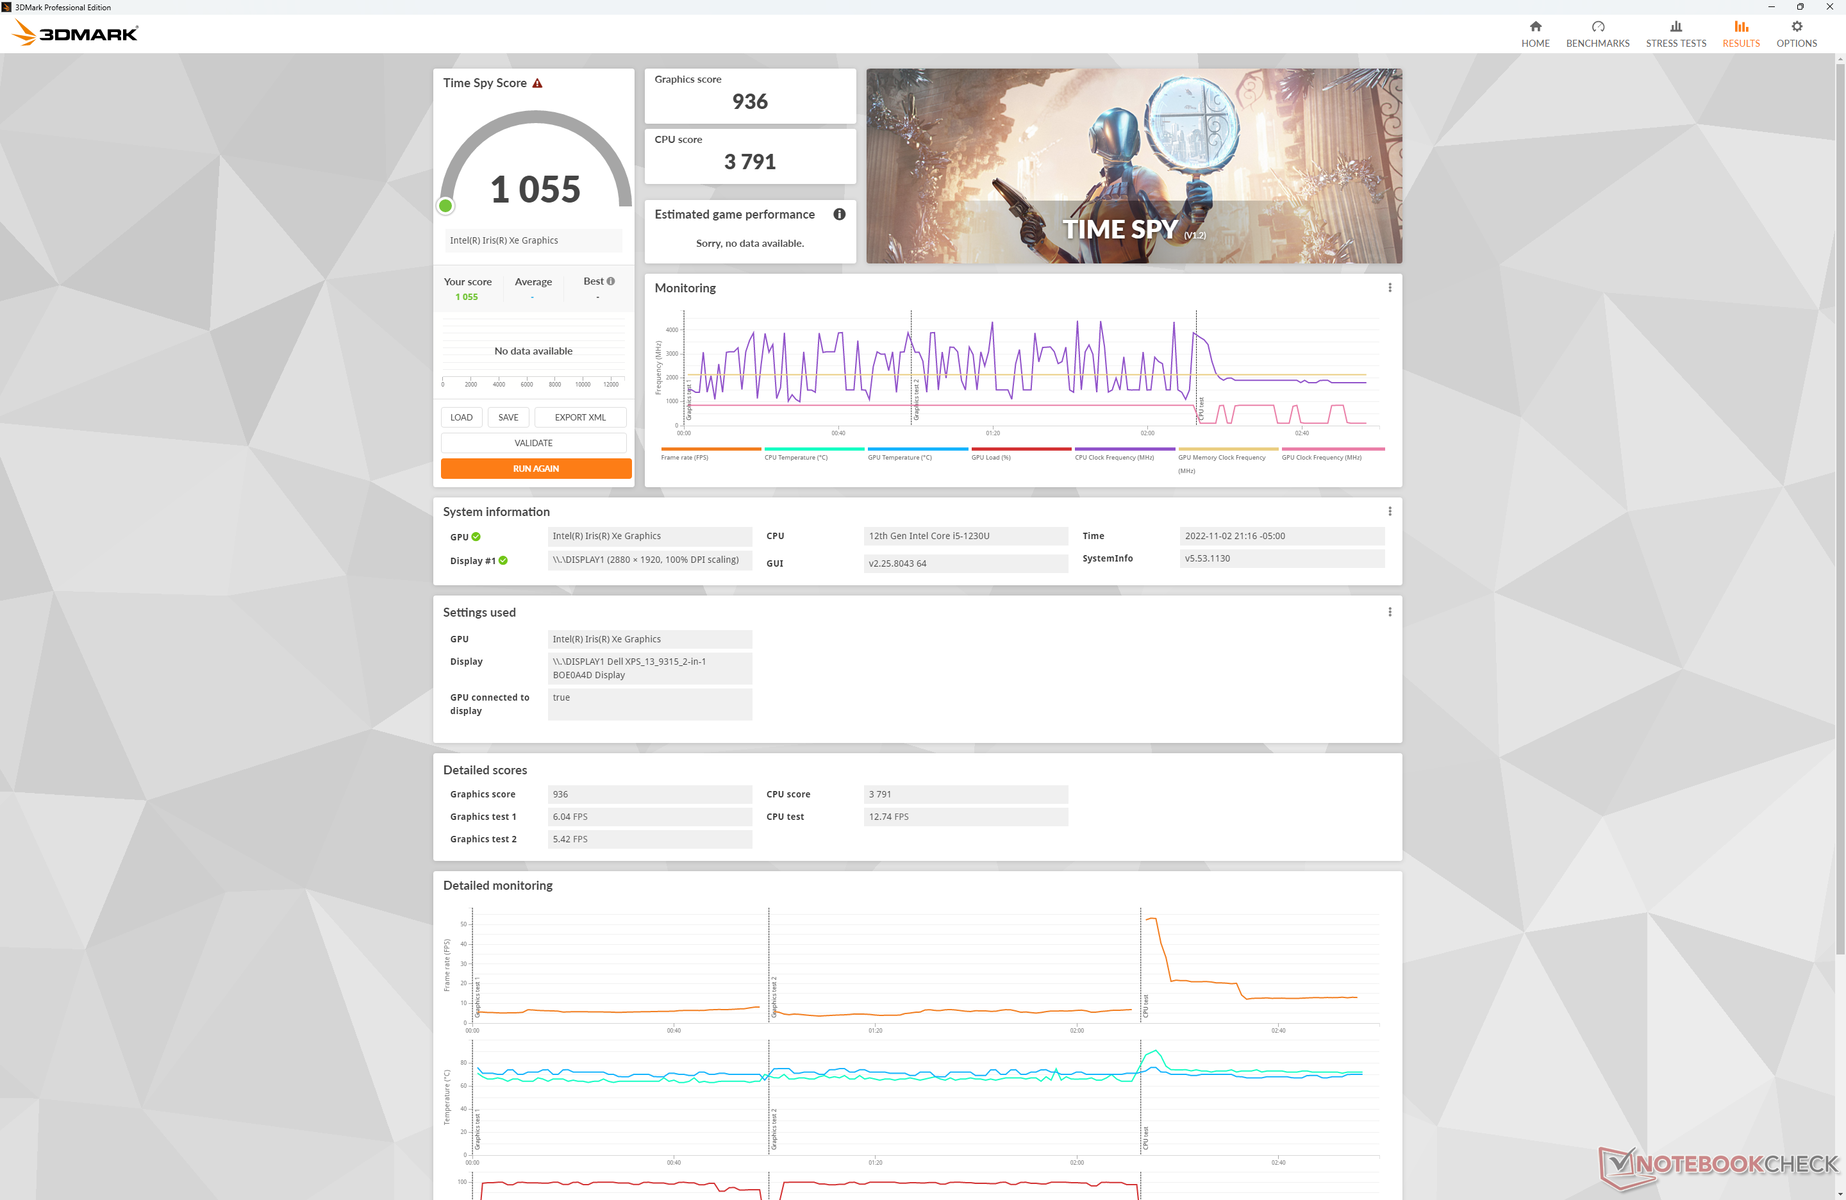
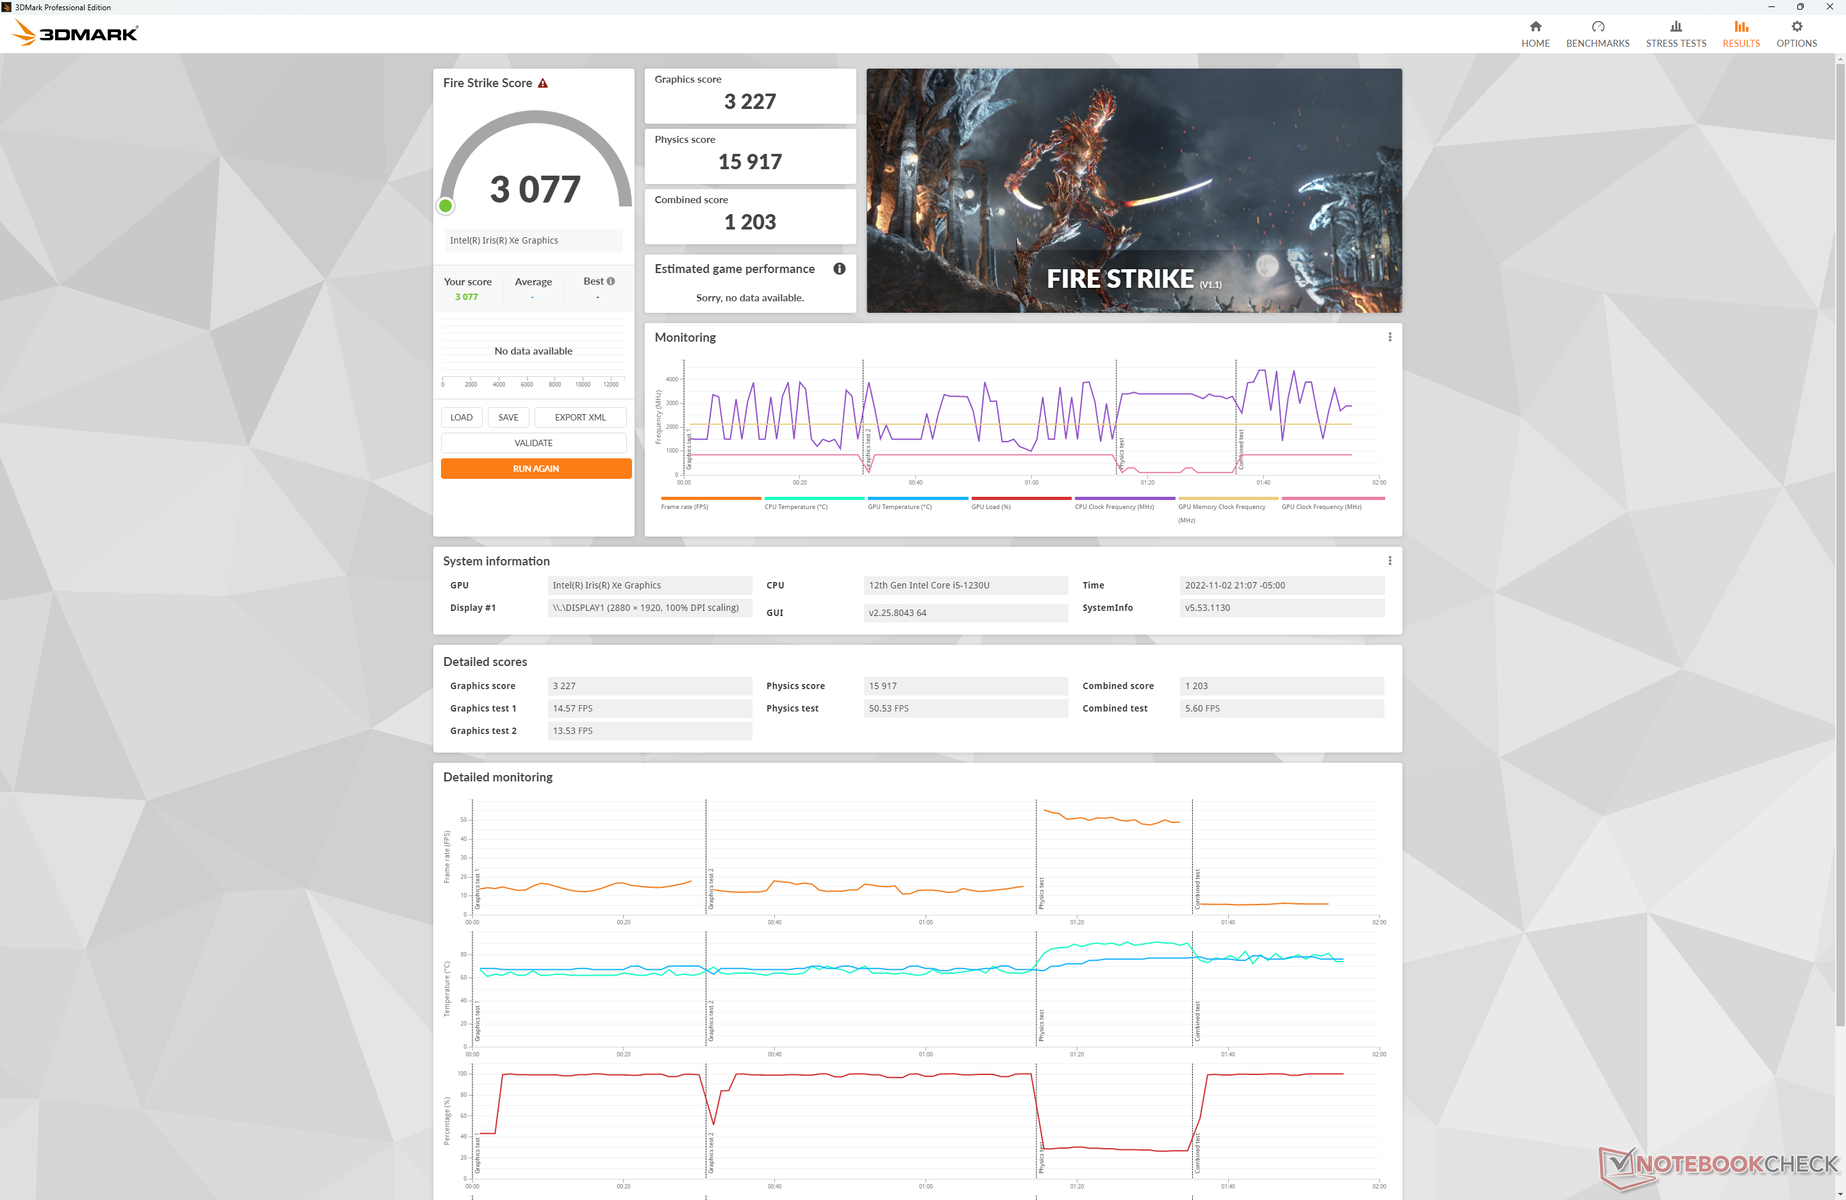
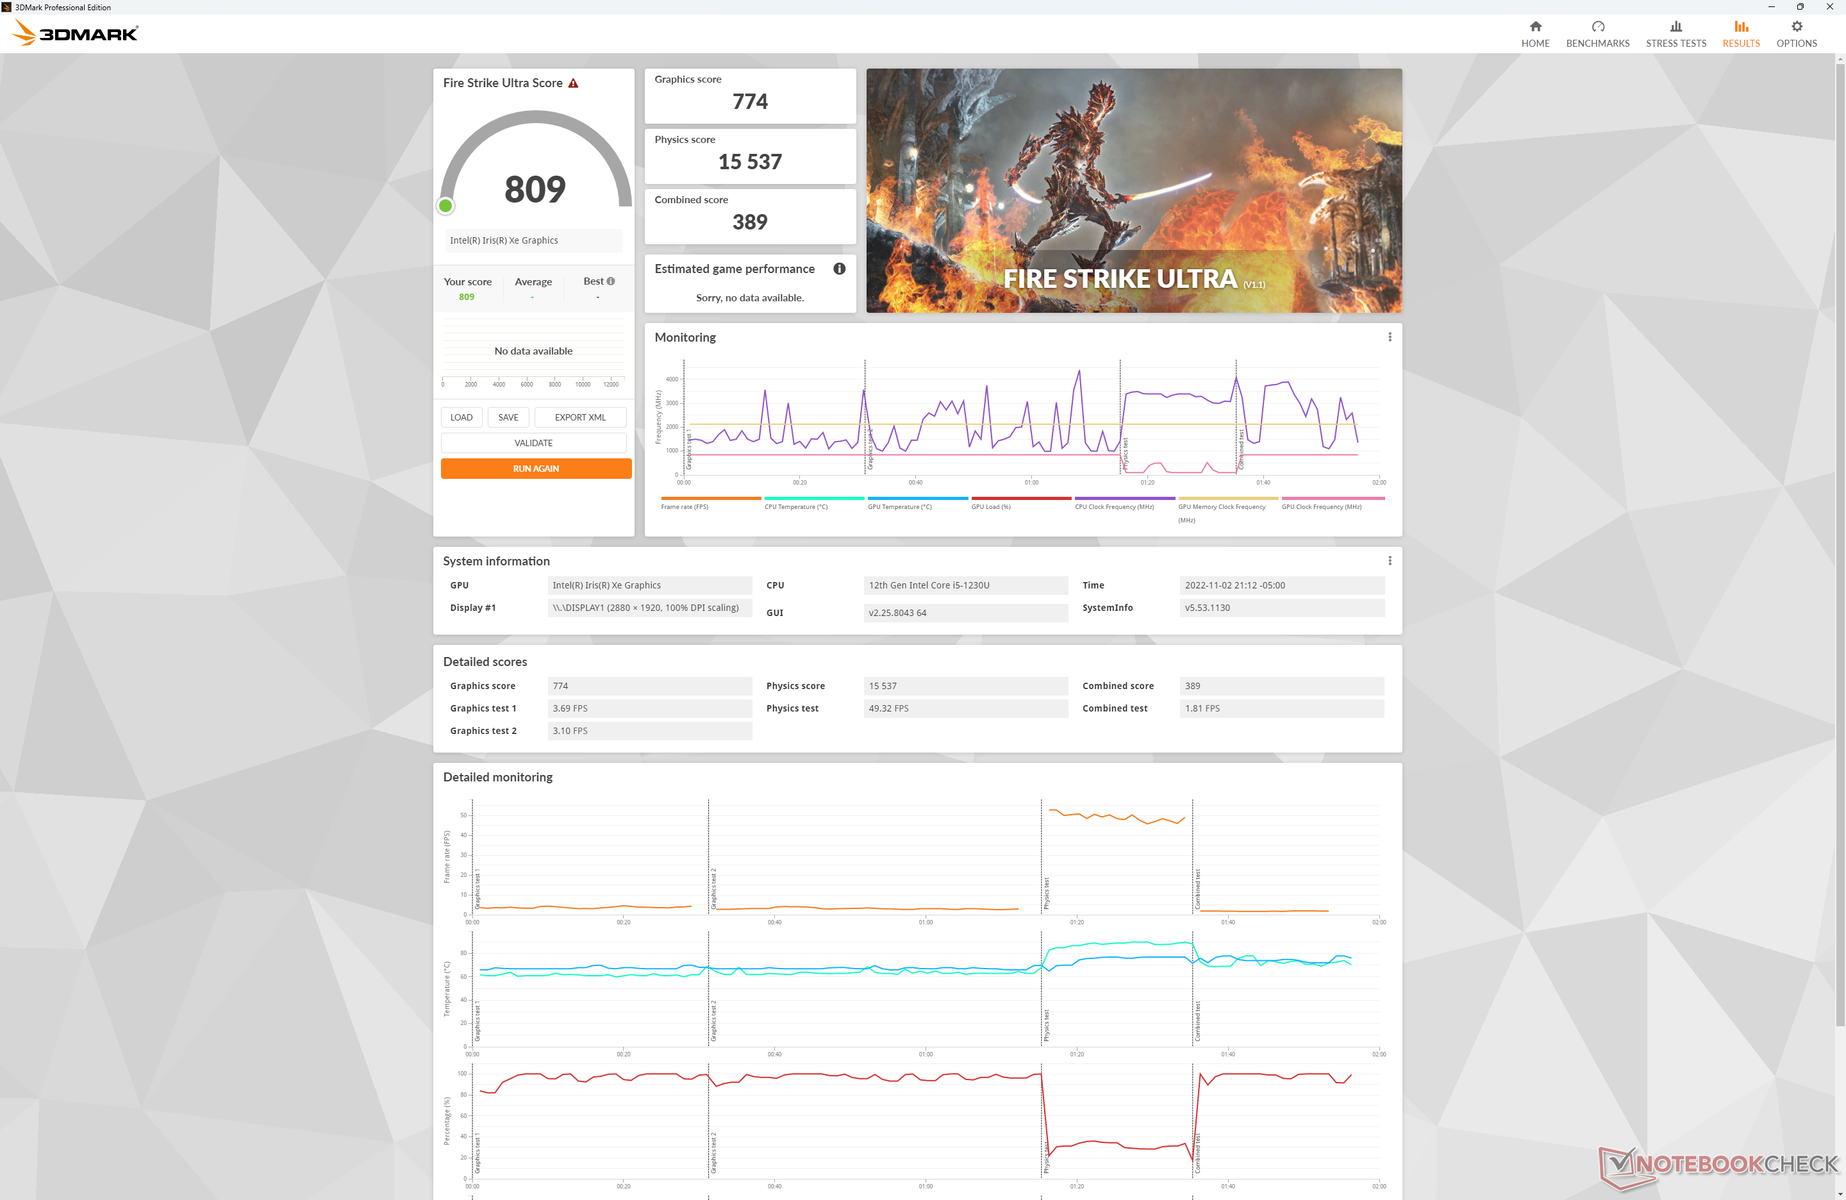
While CPU performance is better than expected, graphics performance is not as good. 3DMark results are about 10 to 20 percent slower than the average laptop in our database with the same integrated Iris Xe 80 EUs to be comparable to last year's ThinkBook Plus Gen 2. Gaming is still possible if on the lowest settings only.
Upgrading to the Core i7-1250U SKU with the Iris Xe 96 EUs is expected to boost graphics performance by about 36 percent based on our experience with the HP Envy x360 13. There are configurations with just 8 GB of RAM instead of 16 GB which we don't recommend or else graphics performance would suffer even more.

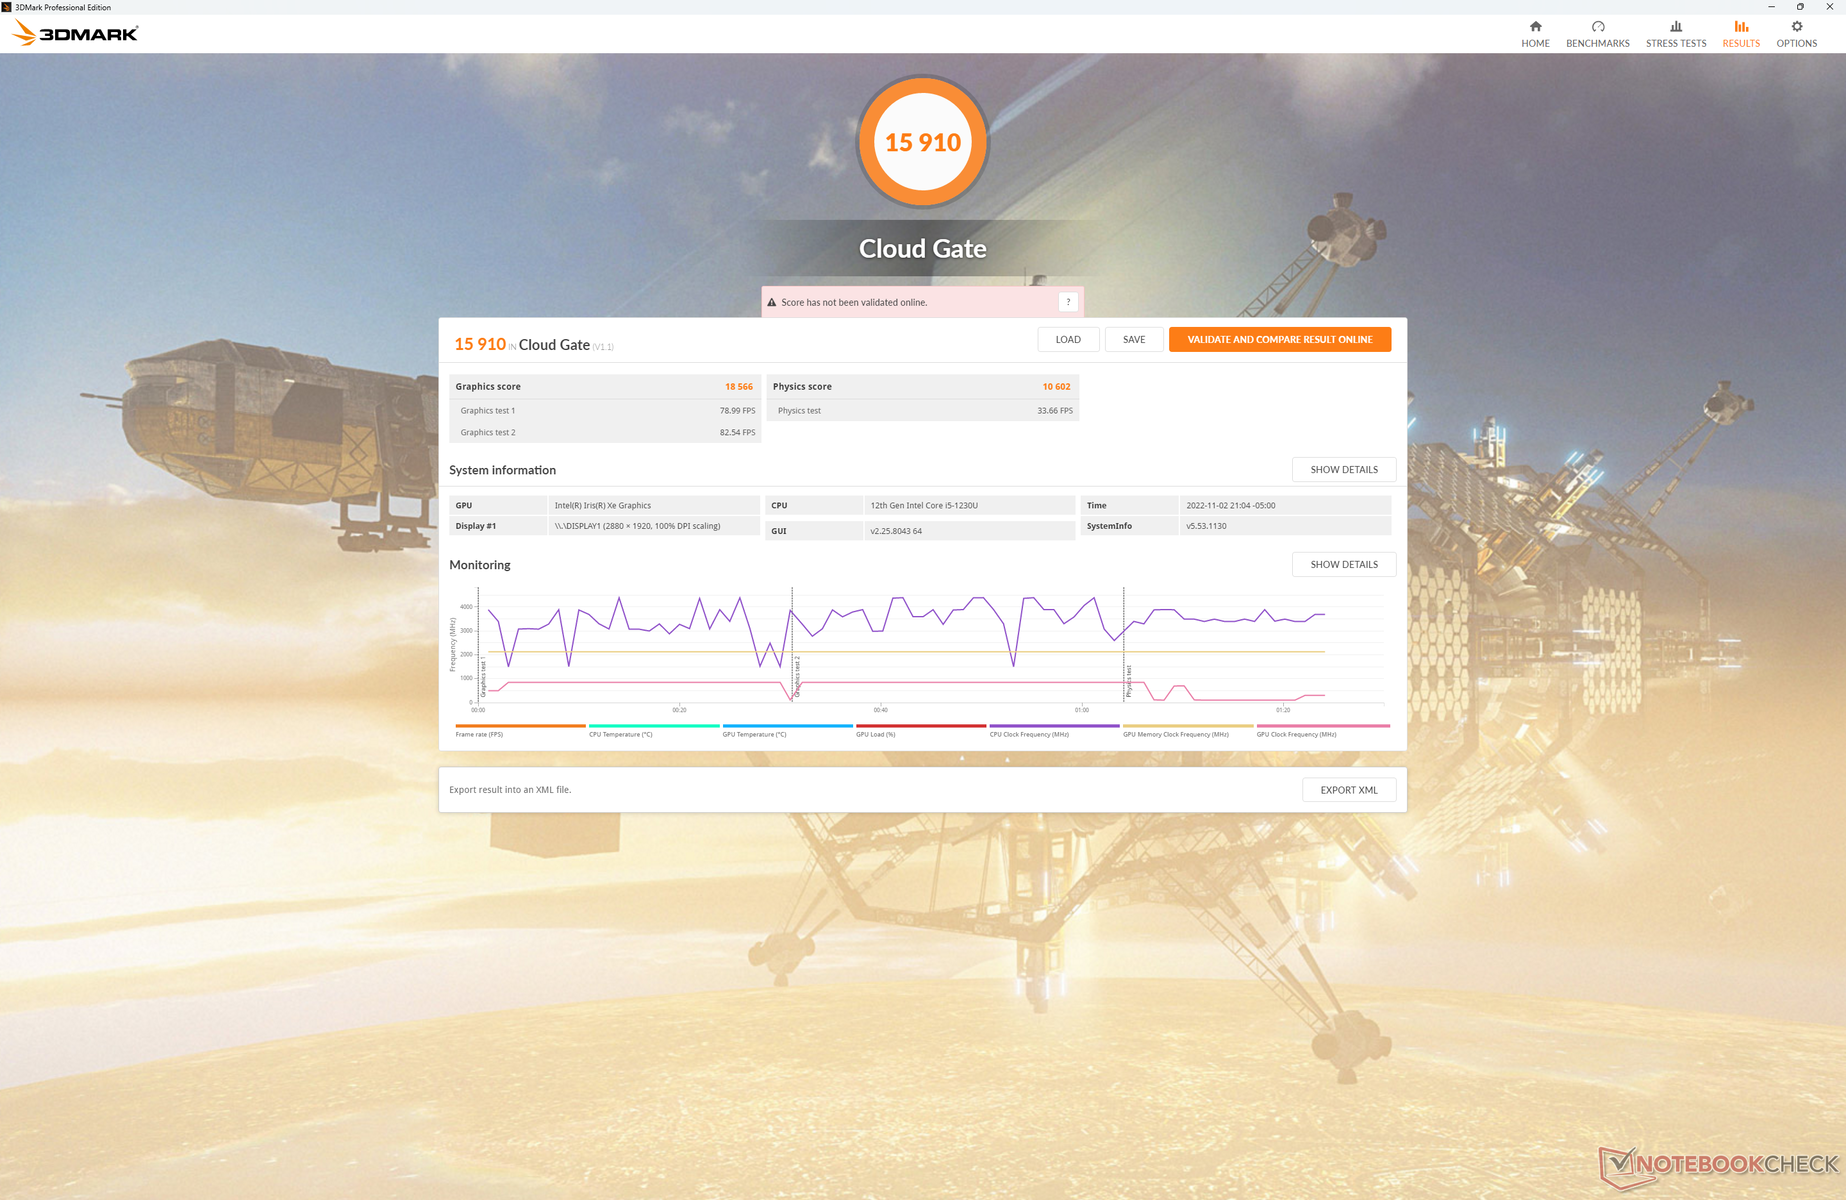
| 3DMark 11 Performance | 4331 points | |
| 3DMark Cloud Gate Standard Score | 15910 points | |
| 3DMark Fire Strike Score | 3077 points | |
| 3DMark Time Spy Score | 1055 points | |
Help | ||
* ... smaller is better
| Final Fantasy XV Benchmark - 1280x720 Lite Quality | |
| Microsoft Surface Pro 8, i7-1185G7 | |
| Dell XPS 13 Plus 9320 i7-1280P OLED | |
| HP Spectre x360 13.5 14t-ef000 | |
| Average Intel Iris Xe Graphics G7 80EUs (8.32 - 45.6, n=106) | |
| Dell XPS 13 9315 2-in-1 Core i5-1230U | |
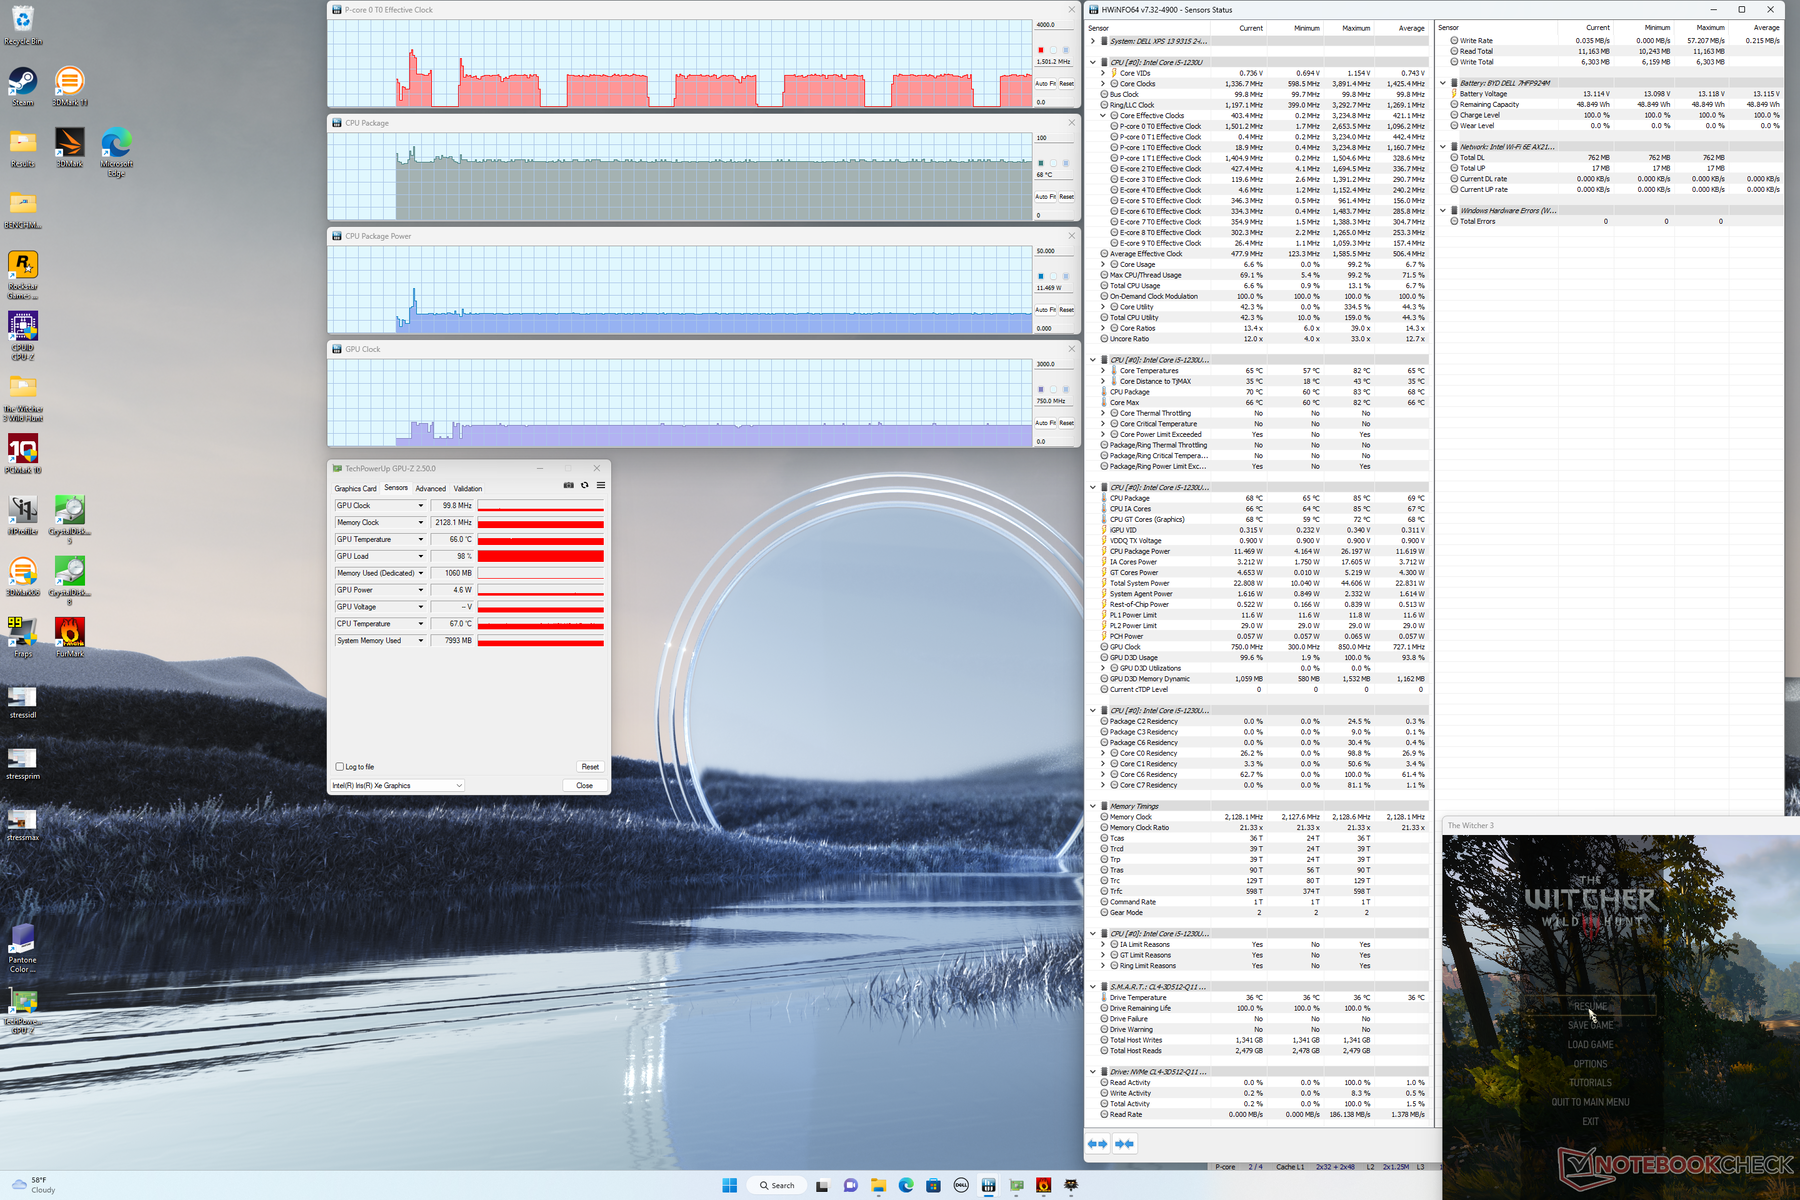
Frame rates are steady when idling on Witcher 3 to represent no major interrupting activities in the background. We experienced a single instance where performance would drop to 36 FPS before rising back up to normal, but this was thankfully only an exception and a pattern.
Witcher 3 FPS Chart
| low | med. | high | ultra | |
|---|---|---|---|---|
| GTA V (2015) | 60.9 | 38.4 | 11.7 | 6.06 |
| The Witcher 3 (2015) | 57.7 | 38.9 | 19.9 | 8.5 |
| Dota 2 Reborn (2015) | 101.2 | 75.8 | 37.6 | 34.2 |
| Final Fantasy XV Benchmark (2018) | 27 | |||
| X-Plane 11.11 (2018) | 31.2 | 25.1 | 22 |
Emissions — No Fans!
System Noise
Whereas the Surface Pro 8 utilizes an internal fan for cooling, the XPS 13 9315 2-in-1 is passively cooled for all configurations including the Core i7 SKU. There is no fan noise or coil whine at all for a completely silent system.
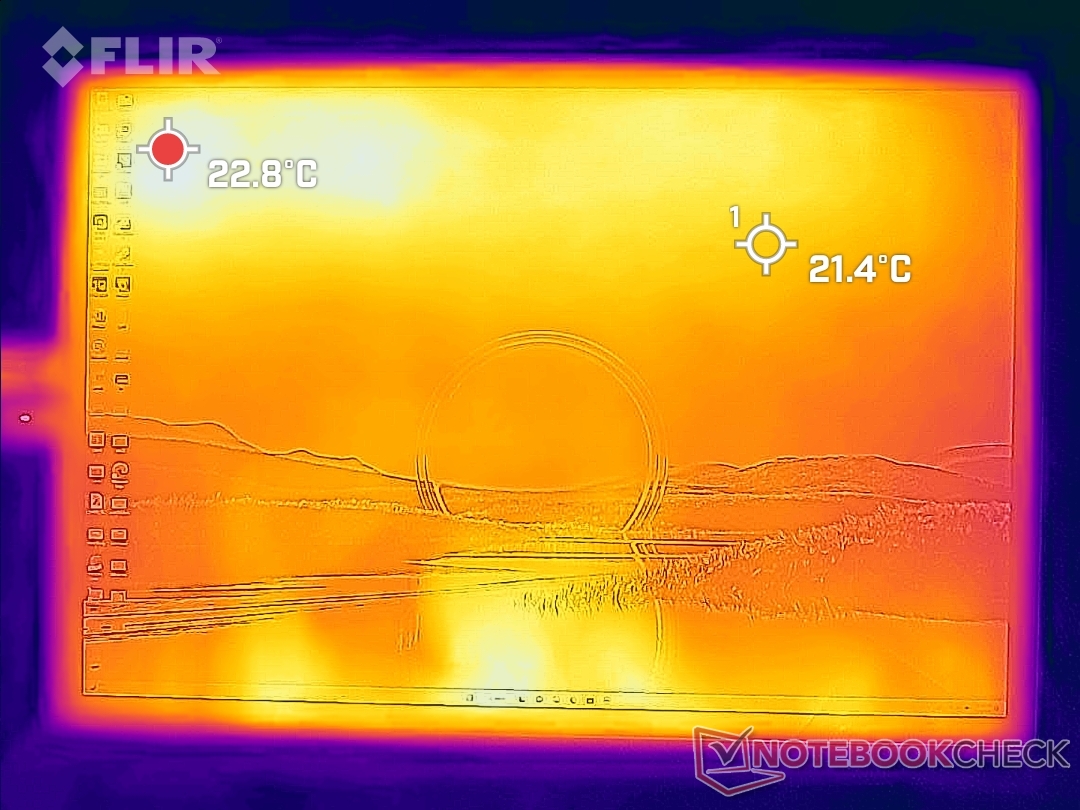
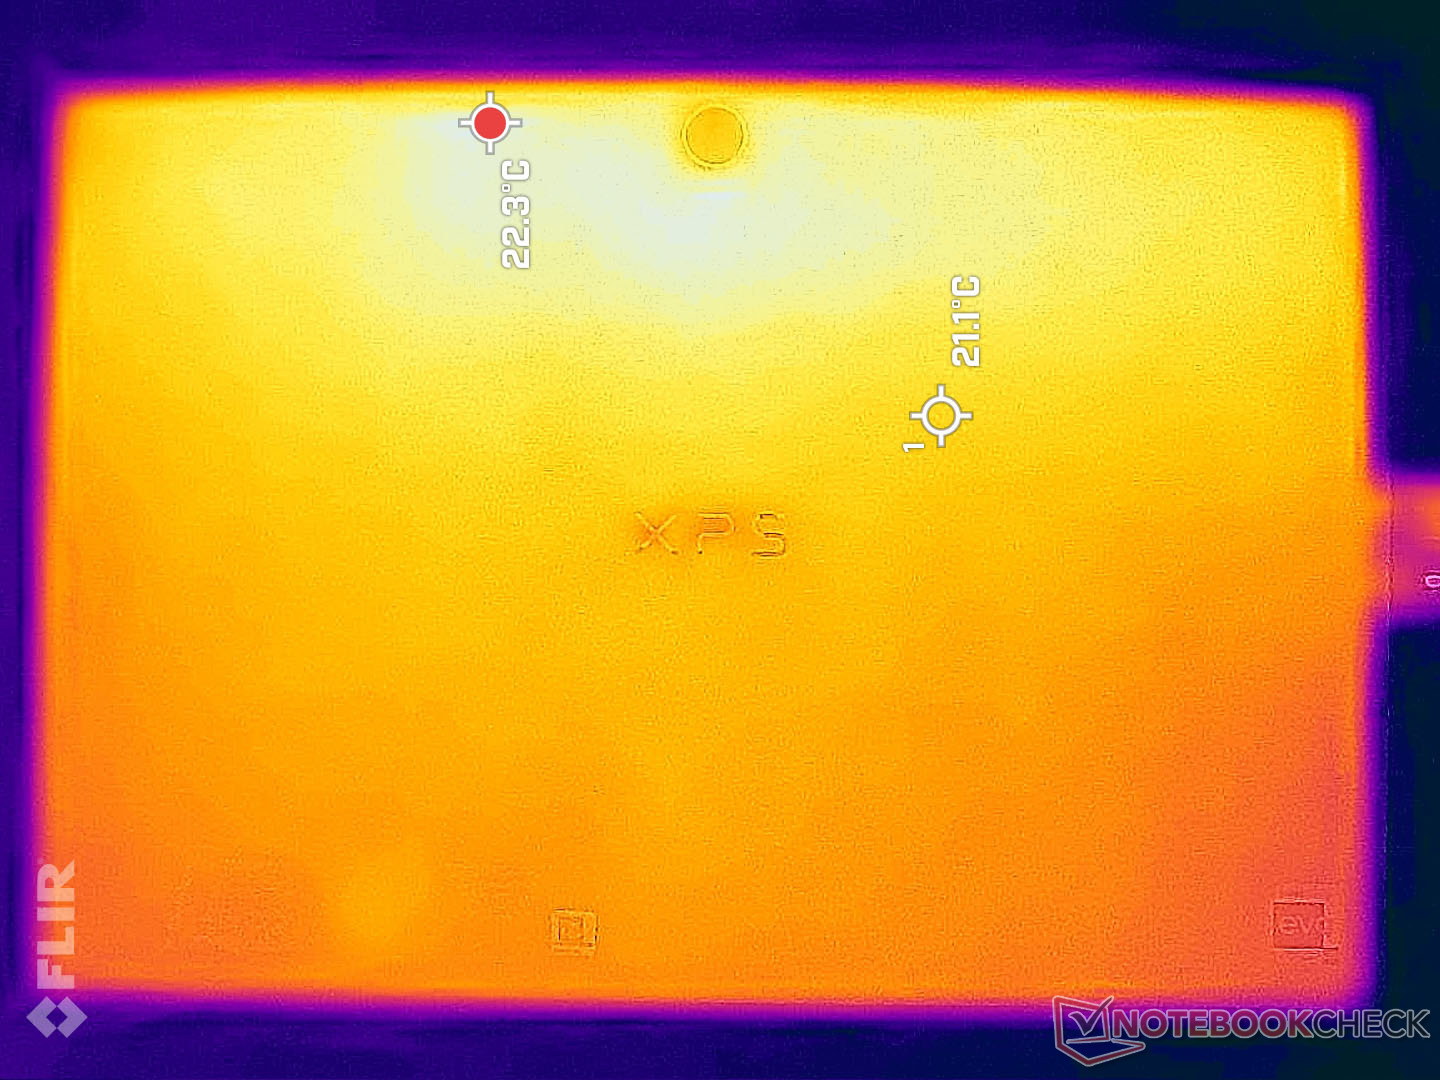
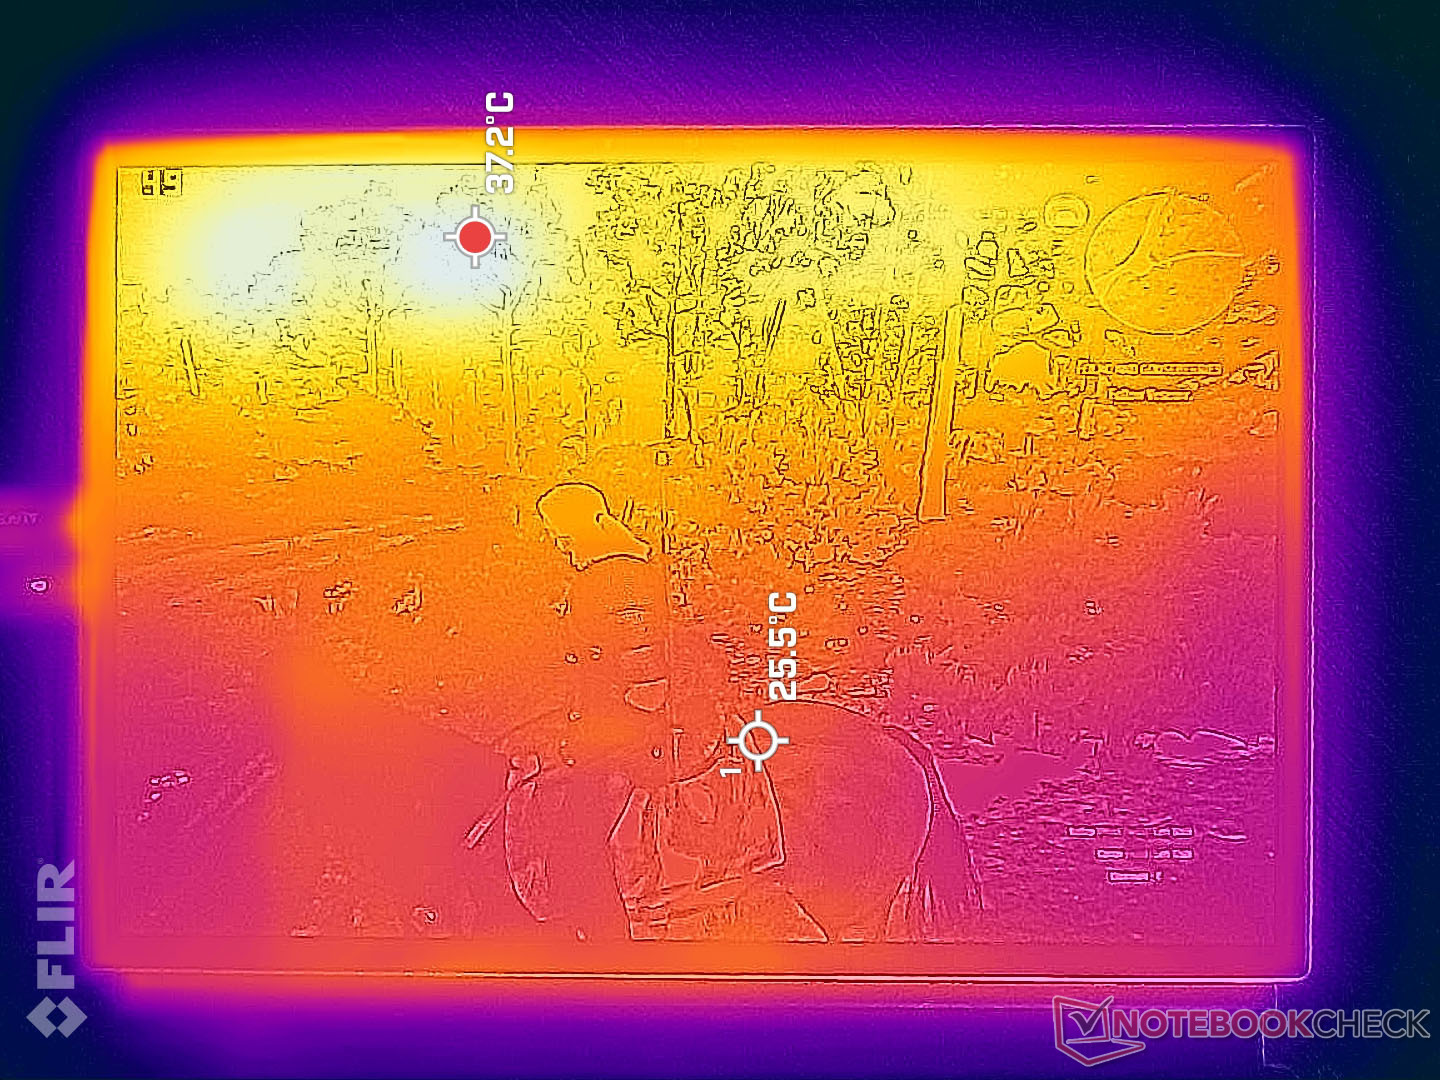
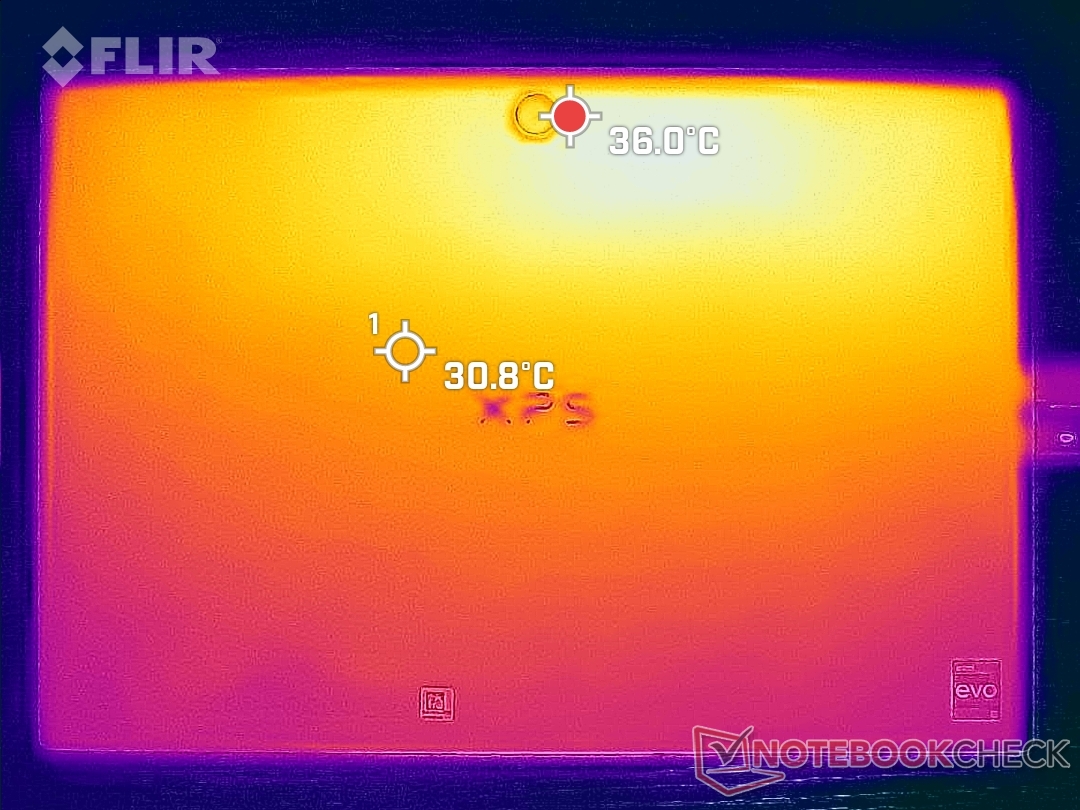
Temperature
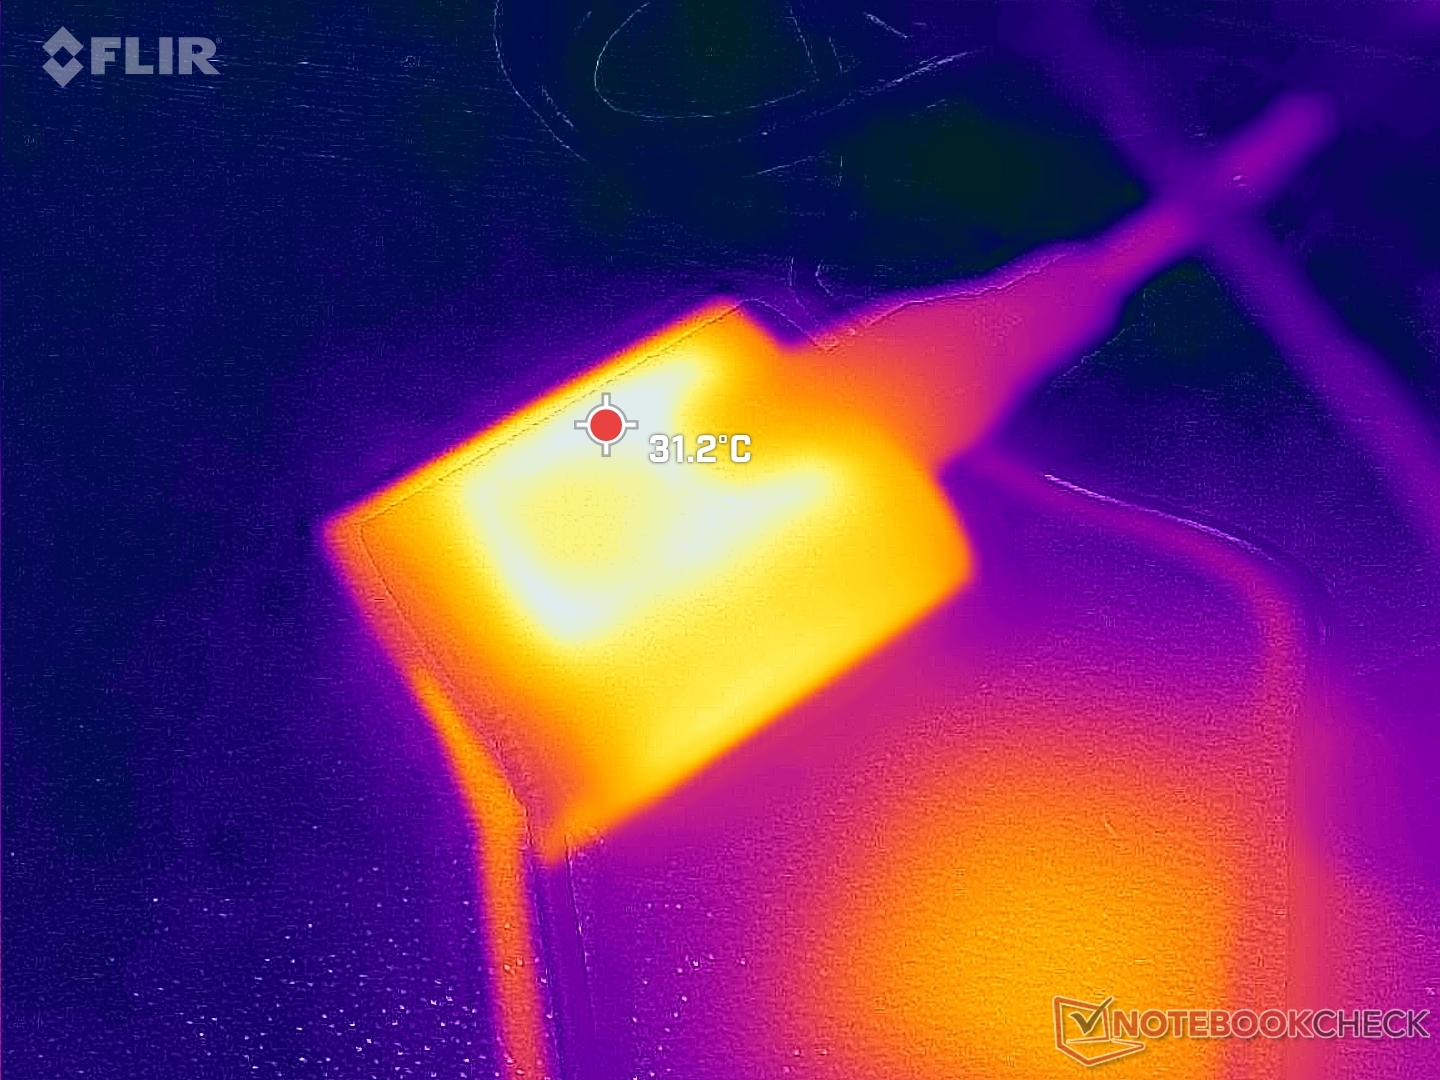
Surface temperatures are generally warmer along the top half of the unit whereas the bottom half is noticeably cooler. Hot spots on the front and back can reach 42 C and 39 C, respectively, compared to only 30 C on the cooler spots. The unit never becomes uncomfortable to hold no matter the orientation or positioning. Overall temperatures are much cooler than what we recorded on the Surface Pro 8 where the entire front and back of the unit can reach 43 C to 48 C.
(±) The maximum temperature on the upper side is 41.8 °C / 107 F, compared to the average of 35.4 °C / 96 F, ranging from 19.6 to 60 °C for the class Convertible.
(+) The bottom heats up to a maximum of 38.2 °C / 101 F, compared to the average of 36.8 °C / 98 F
(+) In idle usage, the average temperature for the upper side is 25.5 °C / 78 F, compared to the device average of 30.3 °C / 87 F.
(+) The palmrests and touchpad are cooler than skin temperature with a maximum of 29.8 °C / 85.6 F and are therefore cool to the touch.
(±) The average temperature of the palmrest area of similar devices was 27.9 °C / 82.2 F (-1.9 °C / -3.4 F).
| Dell XPS 13 9315 2-in-1 Core i5-1230U Intel Core i5-1230U, Intel Iris Xe Graphics G7 80EUs | Microsoft Surface Pro 8, i7-1185G7 Intel Core i7-1185G7, Intel Iris Xe Graphics G7 96EUs | HP Spectre x360 13.5 14t-ef000 Intel Core i7-1255U, Intel Iris Xe Graphics G7 96EUs | Lenovo ThinkBook Plus Gen2 Core i5 Intel Core i5-1130G7, Intel Iris Xe Graphics G7 80EUs | Apple MacBook Air M2 Entry Apple M2, Apple M2 8-Core GPU | |
|---|---|---|---|---|---|
| Heat | -2% | 14% | -11% | 1% | |
| Maximum Upper Side * (°C) | 41.8 | 45 -8% | 36.4 13% | 42 -0% | 44.5 -6% |
| Maximum Bottom * (°C) | 38.2 | 47.2 -24% | 37 3% | 44.5 -16% | 44.4 -16% |
| Idle Upper Side * (°C) | 27.4 | 24.1 12% | 20.8 24% | 29.8 -9% | 23.9 13% |
| Idle Bottom * (°C) | 27.2 | 23.4 14% | 22.6 17% | 31.9 -17% | 23.6 13% |
* ... smaller is better
Stress Test
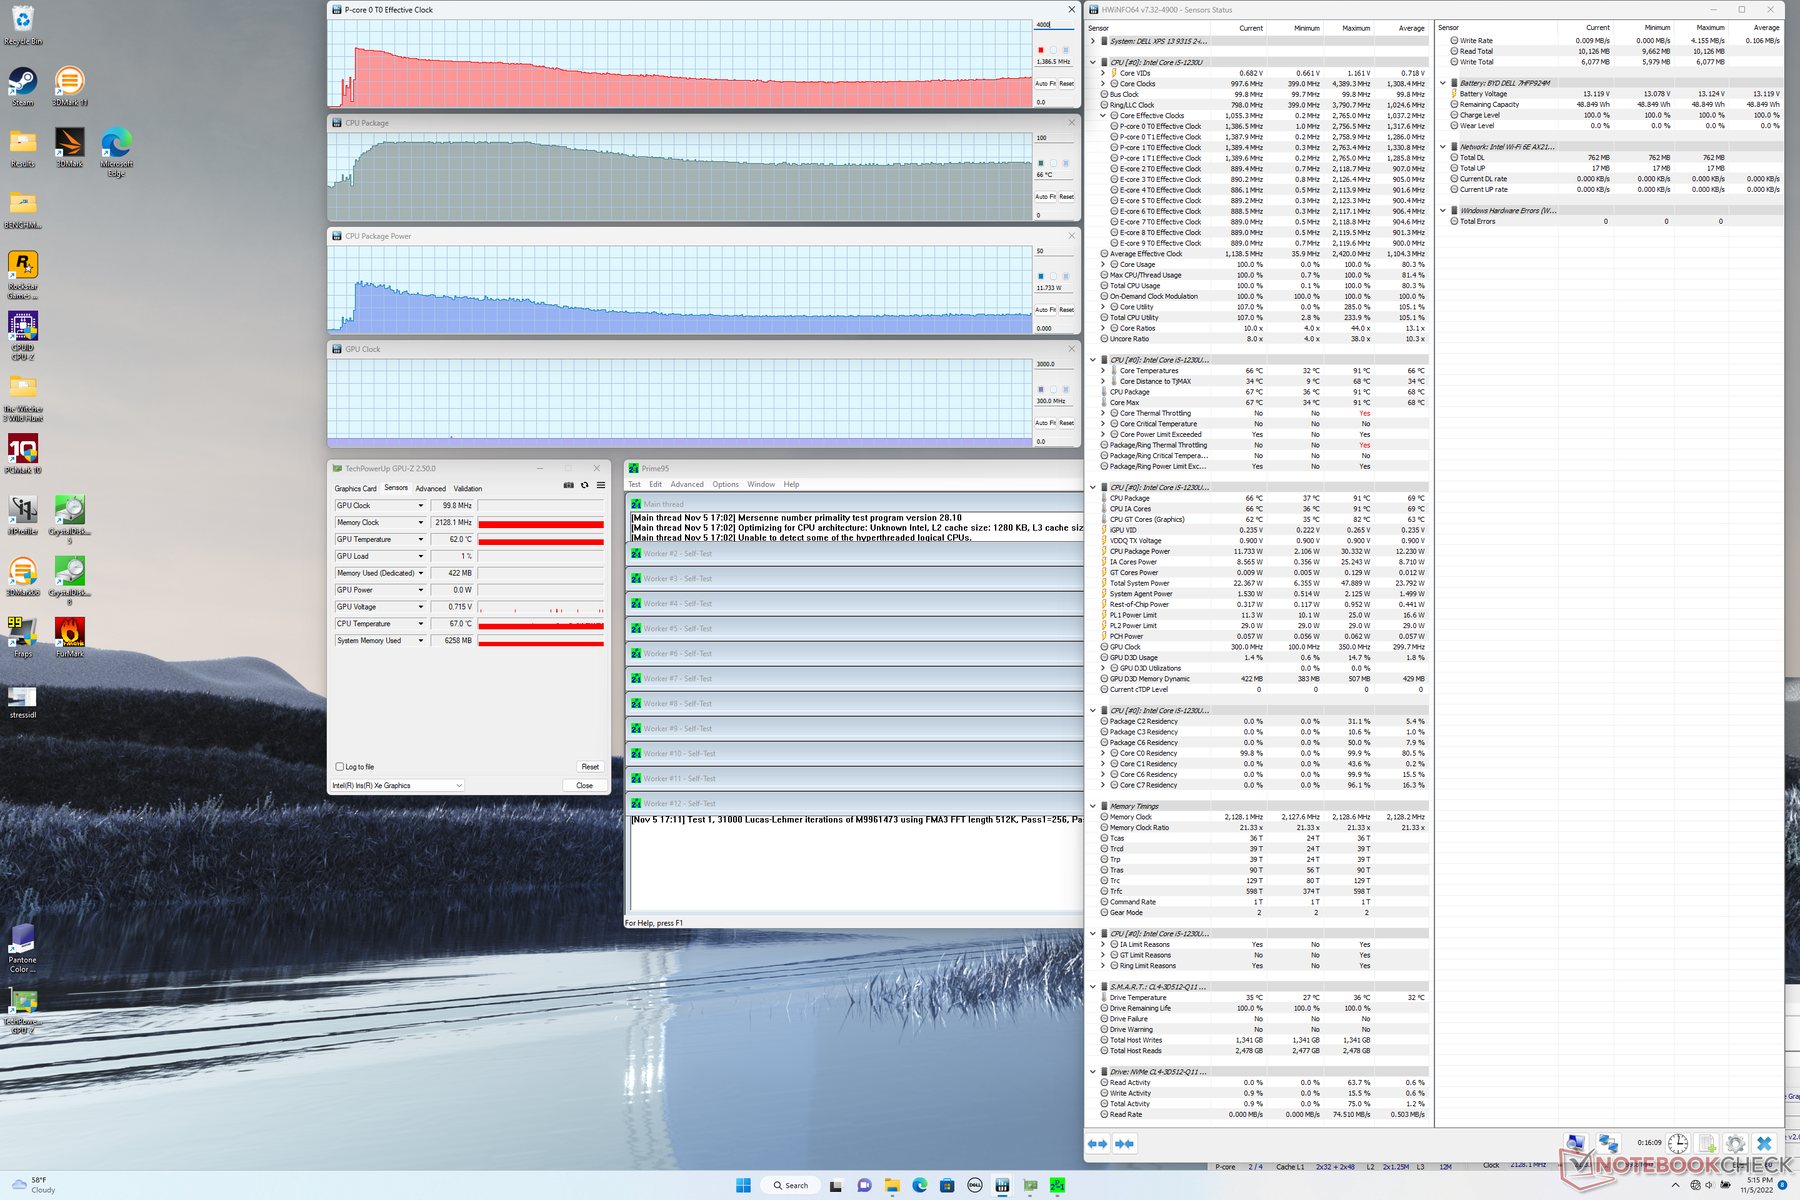
When under Prime95 stress, the CPU would boost to 2.7 GHz and 29 W for about 20 seconds or until the core temperature reaches 90 C. Thereafter, clock rates and board power draw would steadily fall before eventually stabilizing at 1.4 GHz and 12 W, respectively, in order to maintain a much cooler 66 C core temperature. The limited clock rates are not unexpected when considering the fanless design and tablet form factor. Repeating this test on the fan-cooled Surface Pro 8 would see a higher CPU power draw of 26 W but with a similar 65 C core temperature.
GPU clock rate would stabilize at 750 MHz when running Witcher 3 compared to 1147 MHz on the much faster XPS 14 9320 Core i7 clamshell.
CPU performance is not artificially throttled if running on battery power. 3DMark 11 results between battery and mains are nearly identical.

| CPU Clock (GHz) | GPU Clock (MHz) | Average CPU Temperature (°C) | |
| System Idle | -- | -- | 44 |
| Prime95 Stress | 1.4 | -- | 66 |
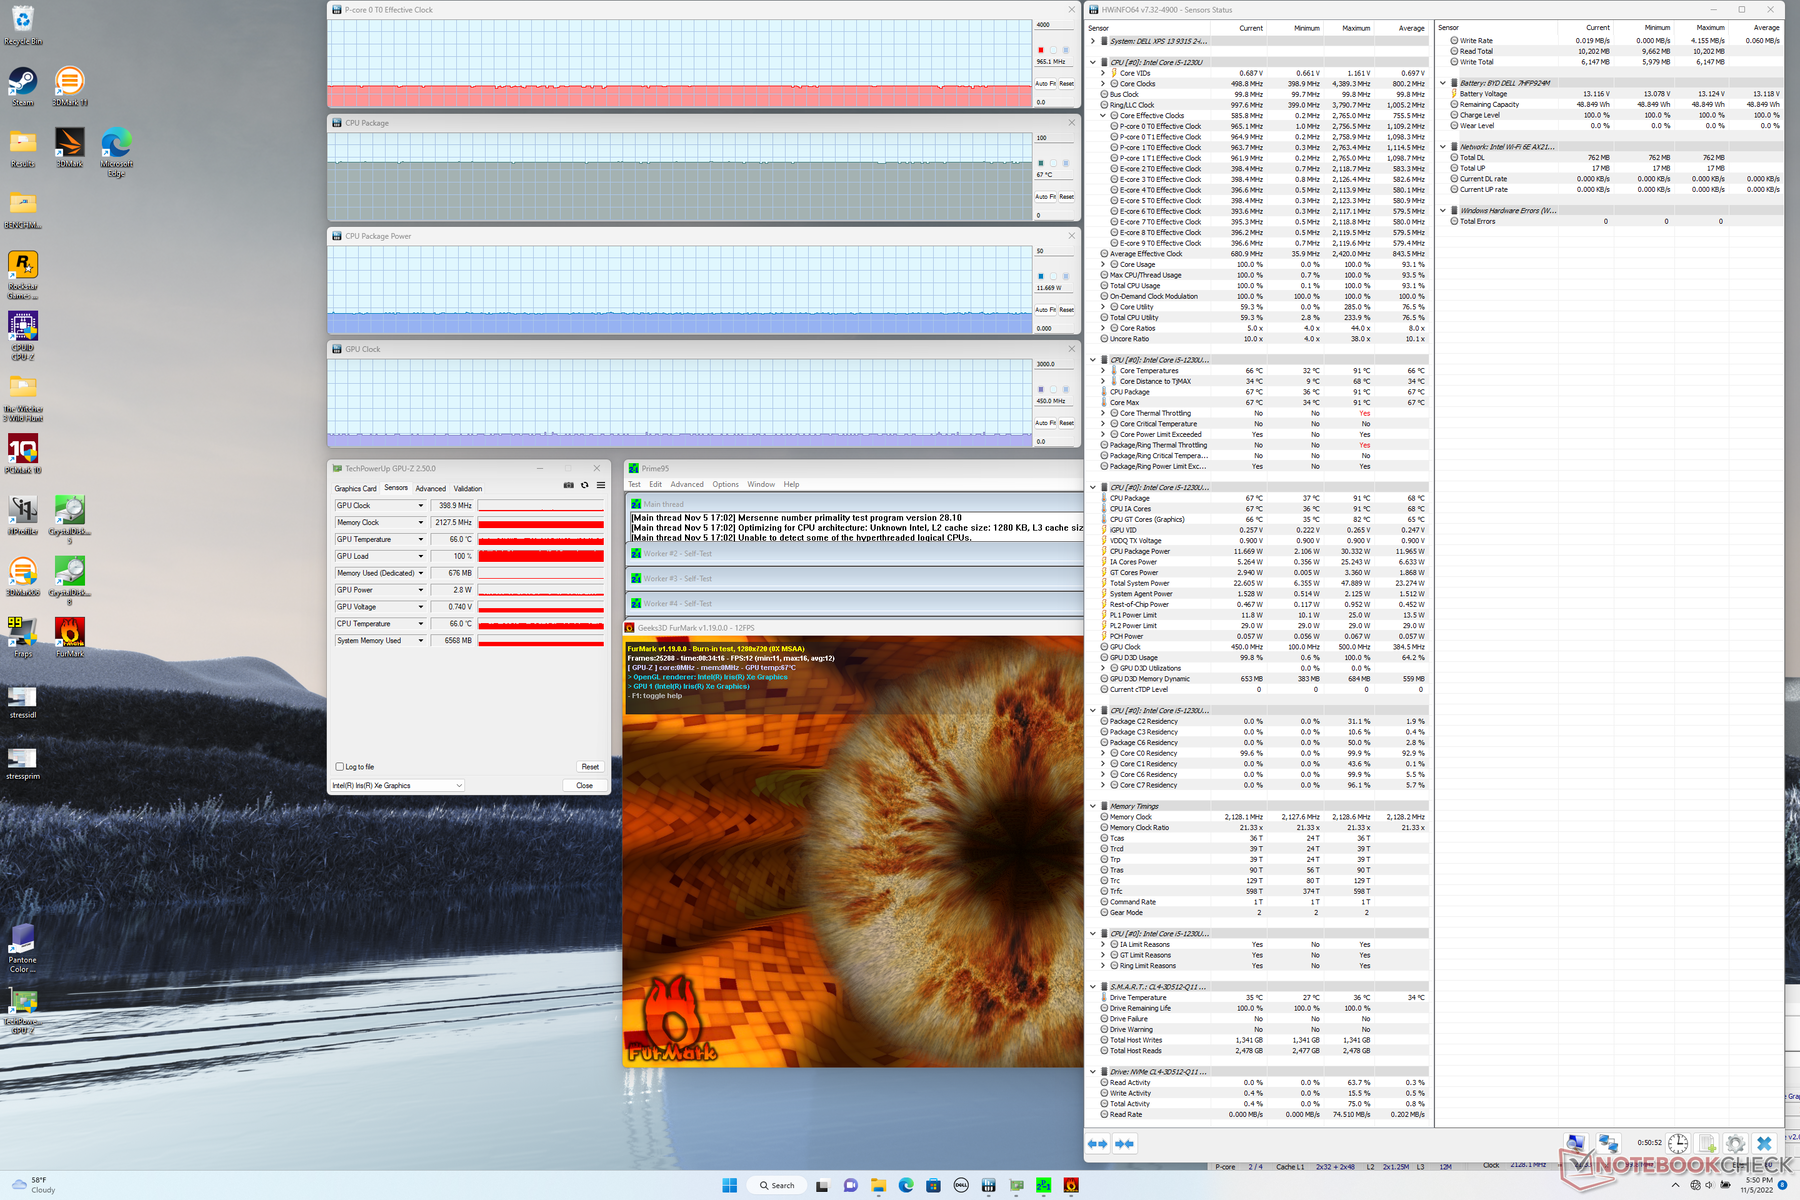
| Prime95 + FurMark Stress | 1.0 | 450 | 67 |
| Witcher 3 Stress | ~1.5 | 750 | 68 |
Speakers
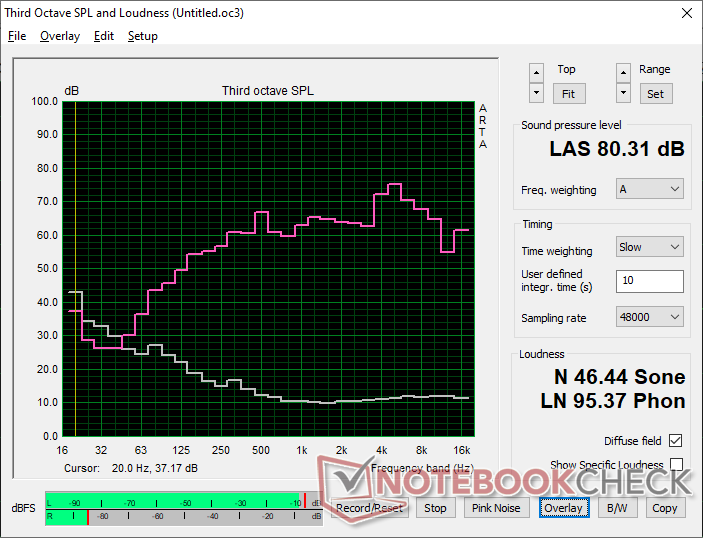
Dell XPS 13 9315 2-in-1 Core i5-1230U audio analysis
(±) | speaker loudness is average but good (80.3 dB)
Bass 100 - 315 Hz
(±) | reduced bass - on average 8.9% lower than median
(+) | bass is linear (5.7% delta to prev. frequency)
Mids 400 - 2000 Hz
(+) | balanced mids - only 2.2% away from median
(+) | mids are linear (5.2% delta to prev. frequency)
Highs 2 - 16 kHz
(±) | higher highs - on average 5.5% higher than median
(+) | highs are linear (6.8% delta to prev. frequency)
Overall 100 - 16.000 Hz
(+) | overall sound is linear (11.9% difference to median)
Compared to same class
» 11% of all tested devices in this class were better, 3% similar, 85% worse
» The best had a delta of 6%, average was 20%, worst was 57%
Compared to all devices tested
» 9% of all tested devices were better, 2% similar, 89% worse
» The best had a delta of 4%, average was 24%, worst was 134%
Apple MacBook Pro 16 2021 M1 Pro audio analysis
(+) | speakers can play relatively loud (84.7 dB)
Bass 100 - 315 Hz
(+) | good bass - only 3.8% away from median
(+) | bass is linear (5.2% delta to prev. frequency)
Mids 400 - 2000 Hz
(+) | balanced mids - only 1.3% away from median
(+) | mids are linear (2.1% delta to prev. frequency)
Highs 2 - 16 kHz
(+) | balanced highs - only 1.9% away from median
(+) | highs are linear (2.7% delta to prev. frequency)
Overall 100 - 16.000 Hz
(+) | overall sound is linear (4.6% difference to median)
Compared to same class
» 0% of all tested devices in this class were better, 0% similar, 100% worse
» The best had a delta of 5%, average was 17%, worst was 45%
Compared to all devices tested
» 0% of all tested devices were better, 0% similar, 100% worse
» The best had a delta of 4%, average was 24%, worst was 134%
Energy Management — Very Power Efficient
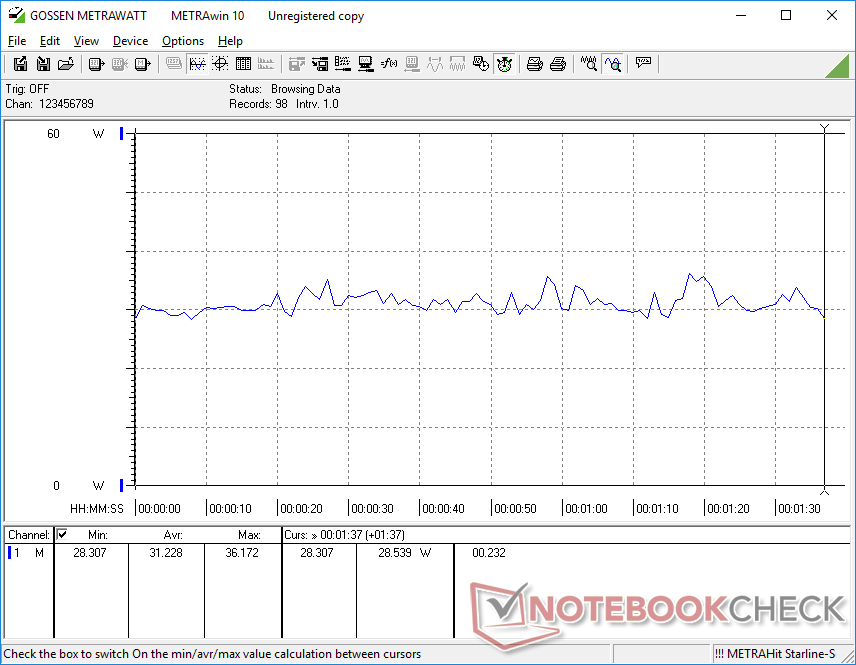
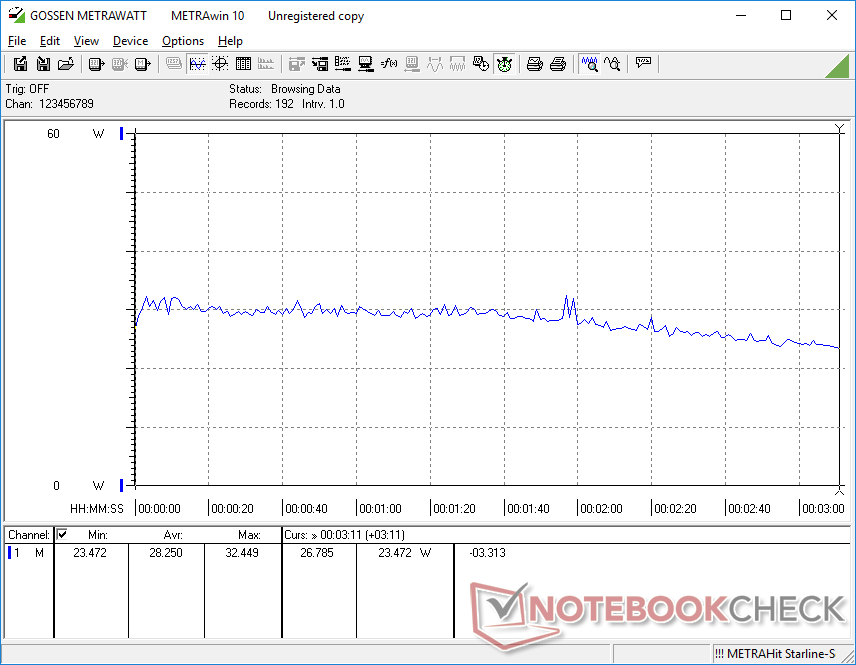
Power Consumption
Idling on desktop at the lowest brightness setting consumes just 5 W whereas the maximum brightness setting would demand about 3 W more. Results are very close to what we recorded on the ThinkBook Plus Gen 2 equipped with the same Core i5-1230U CPU when under similar loads. The Surface Pro 8 Core i7 draws over 50 percent more power when under high loads since it offers much faster graphics performance than our Core i5 Dell SKU.
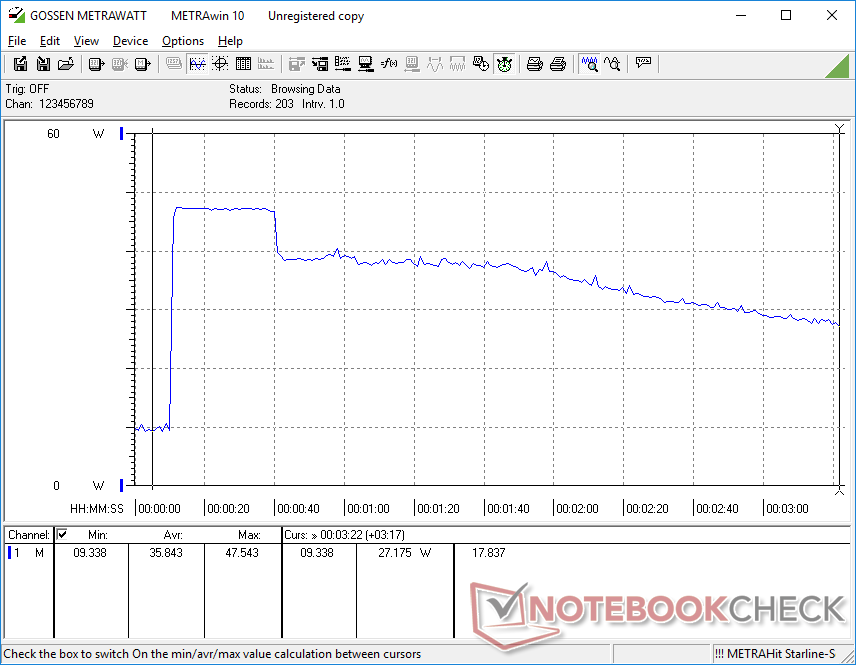
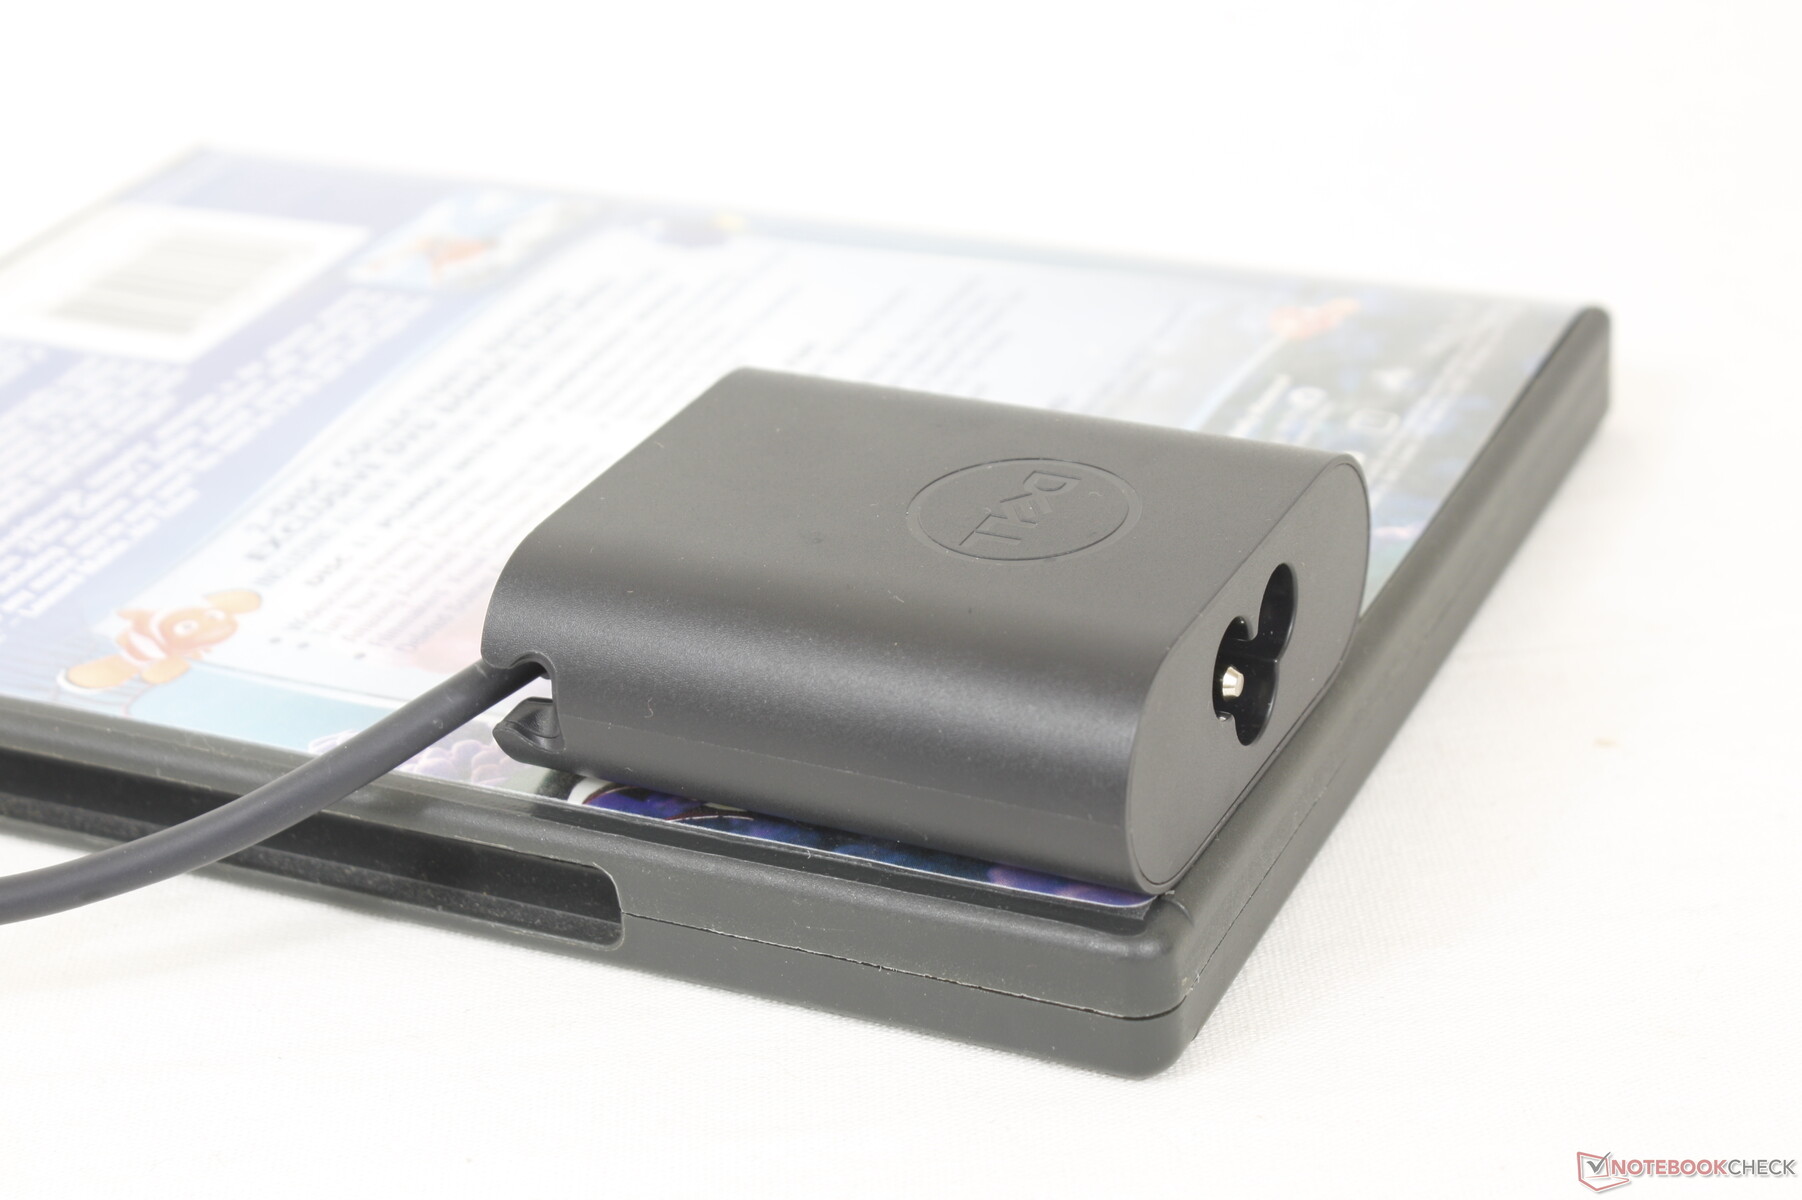
We're able to record a maximum draw of 48 W from the small (~6 x 5.5 x 2.2 cm) 45 W USB-C AC adapter. This rate is only temporary as shown by our graphs below since CPU Turbo Boost is limited.

| Off / Standby | |
| Idle | |
| Load |
|
Key:
min: | |
| Dell XPS 13 9315 2-in-1 Core i5-1230U i5-1230U, Iris Xe G7 80EUs, , IPS, 2880x1920, 13" | Dell XPS 13 Plus 9320 i7-1280P OLED i7-1280P, Iris Xe G7 96EUs, WDC PC SN810 512GB, OLED, 3456x2160, 13.4" | Microsoft Surface Pro 8, i7-1185G7 i7-1185G7, Iris Xe G7 96EUs, Toshiba KBG40ZNS256G NVMe, IPS, 2880x1920, 13" | HP Spectre x360 13.5 14t-ef000 i7-1255U, Iris Xe G7 96EUs, Micron 3400 1TB MTFDKBA1T0TFH, OLED, 3000x2000, 13.5" | Lenovo ThinkBook Plus Gen2 Core i5 i5-1130G7, Iris Xe G7 80EUs, Samsung PM9A1 MZVL2512HCJQ, IPS, E-Ink, 2560x1600, 13.3" | Apple MacBook Air M2 Entry M2, M2 8-Core GPU, Apple SSD AP0256Z, IPS, 2560x1664, 13.6" | |
|---|---|---|---|---|---|---|
| Power Consumption | -46% | -23% | -19% | -5% | 13% | |
| Idle Minimum * (Watt) | 5.2 | 6.5 -25% | 3.9 25% | 4 23% | 5 4% | 1.87 64% |
| Idle Average * (Watt) | 7.9 | 7.8 1% | 8.5 -8% | 4.9 38% | 7.9 -0% | 9.2 -16% |
| Idle Maximum * (Watt) | 8 | 13 -63% | 9.8 -23% | 12.5 -56% | 8.3 -4% | 9.3 -16% |
| Load Average * (Watt) | 31.2 | 56.6 -81% | 48 -54% | 48.1 -54% | 30.9 1% | 28.5 9% |
| Witcher 3 ultra * (Watt) | 28.2 | 49.2 -74% | 41.5 -47% | 35.8 -27% | 25.2 11% | 27.4 3% |
| Load Maximum * (Watt) | 47.6 | 63 -32% | 63 -32% | 65.2 -37% | 66.8 -40% | 31 35% |
* ... smaller is better
Power Consumption Witcher 3 / Stresstest
Power Consumption external Monitor
Battery Life
The 49.5 Wh battery is just slightly smaller than the 51.5 Wh and 53 Wh batteries in the Surface Pro 8 and ThinkBook Plus Gen 2, respectively. Runtimes are nonetheless excellent at almost 9 hours of real-world WLAN usage compared to ~8 hours on the aforementioned Microsoft and Lenovo alternatives.
Charging from empty to full capacity takes about 2 to 2.5 hours.
| Dell XPS 13 9315 2-in-1 Core i5-1230U i5-1230U, Iris Xe G7 80EUs, 49.5 Wh | Dell XPS 13 Plus 9320 i7-1280P OLED i7-1280P, Iris Xe G7 96EUs, 55 Wh | Microsoft Surface Pro 8, i7-1185G7 i7-1185G7, Iris Xe G7 96EUs, 51.5 Wh | HP Spectre x360 13.5 14t-ef000 i7-1255U, Iris Xe G7 96EUs, 66 Wh | Lenovo ThinkBook Plus Gen2 Core i5 i5-1130G7, Iris Xe G7 80EUs, 53 Wh | Apple MacBook Air M2 Entry M2, M2 8-Core GPU, 52.6 Wh | |
|---|---|---|---|---|---|---|
| Battery runtime | -36% | -28% | 16% | -16% | 45% | |
| Reader / Idle (h) | 13.6 | 20.4 50% | ||||
| WiFi v1.3 (h) | 9 | 5.8 -36% | 7.6 -16% | 8 -11% | 7.6 -16% | 15.2 69% |
| Load (h) | 2 | 1.2 -40% | 2.2 10% | 2.4 20% | ||
| H.264 (h) | 10.1 | 16.5 |
Pros
Cons
Verdict — XPS Or Surface Pro?
The XPS 13 9315 2-in-1 is the best competitor yet to the Microsoft Surface Pro series. Some aspects are better than the Microsoft model while others are worse. The detachable keyboard base in particular offers firmer keyboard keys, a larger clickpad, and better protection against scratches. The tablet itself is also thinner and lighter than the Surface Pro 8 without needing to make drastic cuts to processor performance. In fact, the Core i5-1230U in the Dell performs similarly to the Core i7-1185G7 in the Surface Pro 8 despite the fanless design of the Dell. The manufacturer is promising 5G eSIM SKUs in the near future as well whereas no such options exist for the Surface Pro at the time of writing.
There are still a handful of reasons to consider the Microsoft model instead of the Dell. For one, the Surface Pro 8 integrates a 3.5 mm audio jack which some users might appreciate. Graphics performance is also significantly faster as the GPU in the Dell tends to underperform even when against other laptops with similar integrated graphics. The lack of any 120 Hz display options is perhaps the most noticeable as it makes the Dell tablet feel clunkier and less responsive. The 60 Hz limitation wasn't a huge issue in the past, but it is becoming more of a handicap now that high refresh rate laptops, monitors, and smartphones are commonplace.
A Surface Pro without the Surface Pro name. The XPS 13 9315 2-in-1 one-ups the Microsoft Surface Pro Type Cover in terms of comfort, but the 60 Hz touchscreen feels dated next to the 120 Hz Surface Pro 8.
If you intend to do a lot of typing and emailing, then the XPS 13 9315 2-in-1 may be the better option for its superior keyboard dock. If you intend to use the touchscreen in tablet mode more frequently, then the higher refresh rate and responsiveness of the Surface Pro display is hard to pass up. If Dell can offer additional display options in the future, then its XPS 13 9315 2-in-1 series can be a much easier recommendation for more usage scenarios.
Price and Availability
The XPS 13 9315 2-in-1 will become widely available on November 14. Retailers like Amazon are already listing certain SKUs for pre-order. The best place to order at the moment is through Dell where prices start at $1000 USD with no keyboard dock or pen.
Dell XPS 13 9315 2-in-1 Core i5-1230U
- 11/08/2022 v7 (old)
Allen Ngo
