Dell XPS 13 9315 laptop in review: Low performance, incredible battery life

The latest version of Dell's popular 13-inch laptop not only launches with a "Plus" sister model, but also an updated chassis with even fewer ports. Since minimalism is fashionable, Intel's Alder Lake-U CPUs being the only options fit the overall concept of the "basic" XPS 13. While this CPU lineup offers significantly lower peak and continuous performance, it is very energy-efficient thanks to the large number of E cores. As a result, our test device manages to scratch the 15-hour mark in our Wi-Fi test at a reduced brightness.
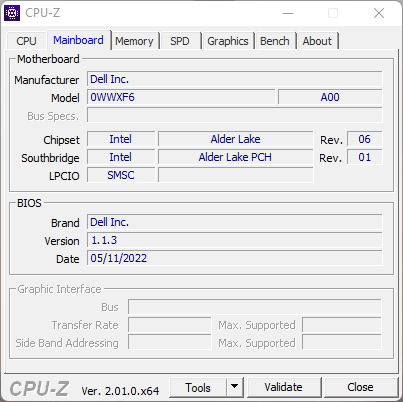
Today, we are taking a look at the base model of the XPS 13 9315. With an i5-1230U, only 8 GB of RAM, and a 256-GB SSD, it is unlikely to break any records. Since all (!) components including the Wi-Fi module are soldered, upgrading the system later on is not possible.
We are comparing the XPS 13 9315 with the Plus model 9320 (P processor, 4K) and models from Dell's competitors. The following table shows the models that come close to the XPS 13 and those that received an even better rating.
More XPS laptops from Dell reviewed by Notebookcheck:
XPS 13 Plus 9320 i7-1260P (4K, Alder Lake 2022)
XPS 13 Plus 9320 i5-1240P (FHD, to be published shortly)
XPS 13 9310 Core i7 (FHD, Tiger Lake 2021)
Potential Competitors in Comparison
Rating | Date | Model | Weight | Height | Size | Resolution | Price |
|---|---|---|---|---|---|---|---|
| 88.2 % v7 (old) | 08 / 2022 | Dell XPS 13 9315, i5-1230U i5-1230U, Iris Xe G7 80EUs | 1.2 kg | 14 mm | 13.40" | 1920x1200 | |
| 91.1 % v7 (old) | 12 / 2020 | Apple MacBook Air 2020 M1 Entry M1, M1 7-Core GPU | 1.3 kg | 16.1 mm | 13.30" | 2560x1600 | |
| 90.1 % v7 (old) | 07 / 2022 | Asus Zenbook S 13 OLED R7 6800U, Radeon 680M | 1.1 kg | 14.9 mm | 13.30" | 2880x1800 | |
| 89.8 % v7 (old) | 02 / 2021 | Lenovo ThinkPad X1 Nano-20UN002UGE i7-1160G7, Iris Xe G7 96EUs | 946 g | 16 mm | 13.00" | 2160x1350 | |
| 88.8 % v7 (old) | 02 / 2022 | Huawei MateBook 13s i5 11300H i5-11300H, Iris Xe G7 80EUs | 1.3 kg | 16.5 mm | 13.40" | 2520x1680 | |
| 86.9 % v7 (old) | 07 / 2022 | Dell XPS 13 Plus 9320 4K i7-1260P, Iris Xe G7 96EUs | 1.2 kg | 15.3 mm | 13.40" | 3840x2400 | |
| 86.1 % v7 (old) | 08 / 2022 | Dell XPS 13 Plus 9320 i5-1240p i5-1240P, Iris Xe G7 80EUs | 1.2 kg | 15.3 mm | 13.40" | 1920x1200 |
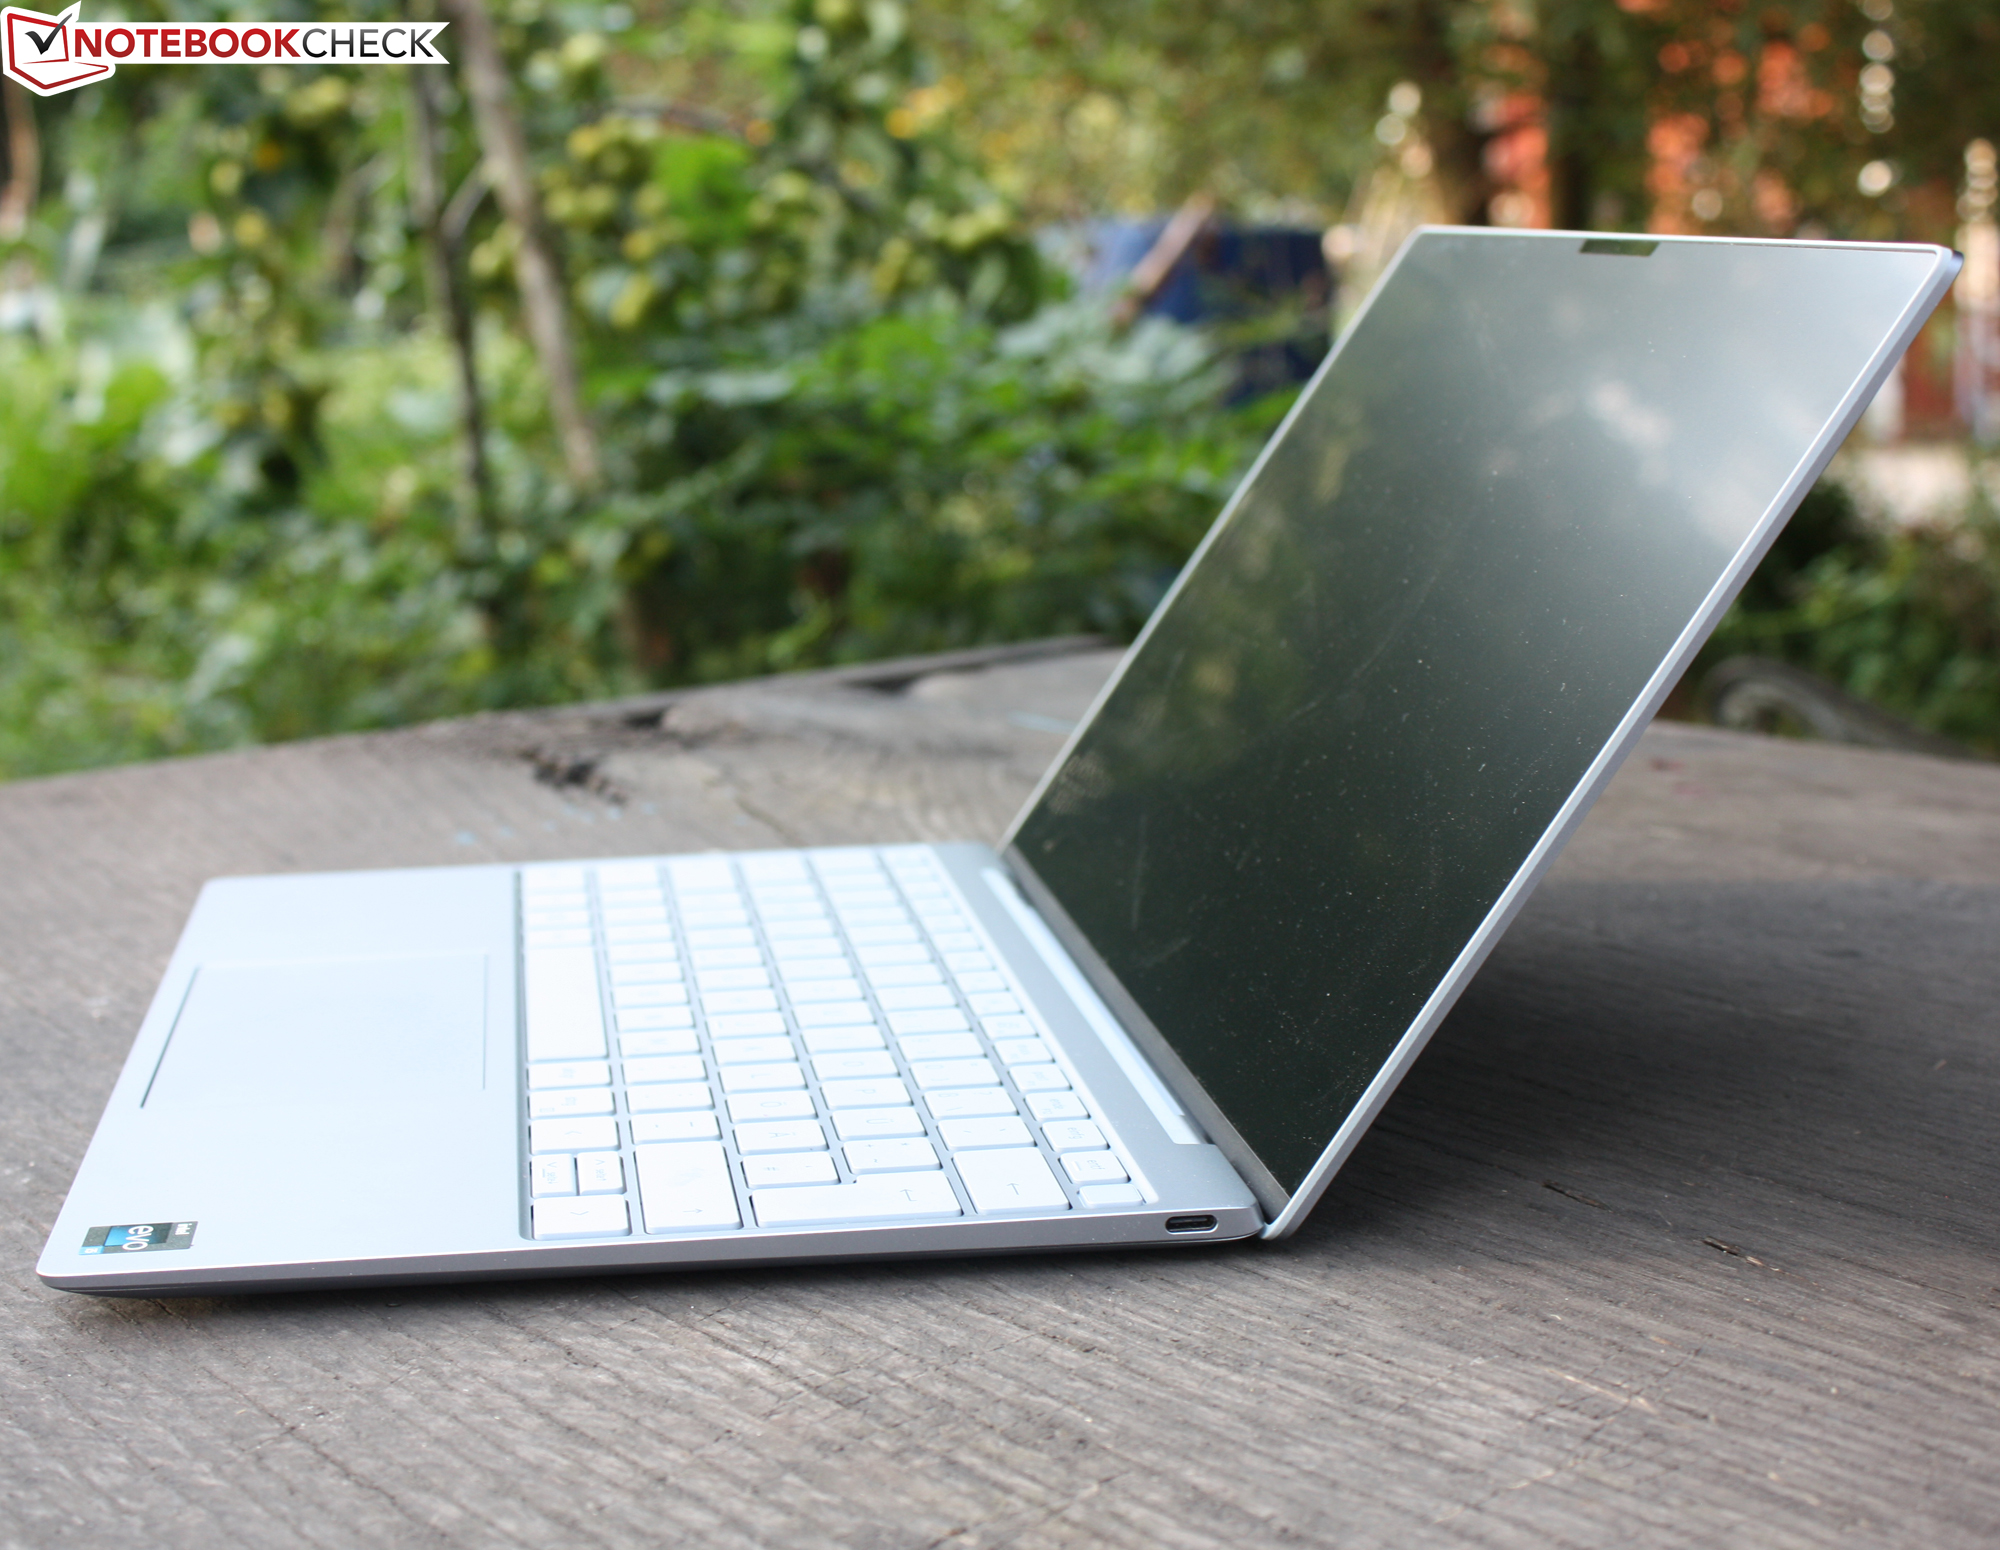
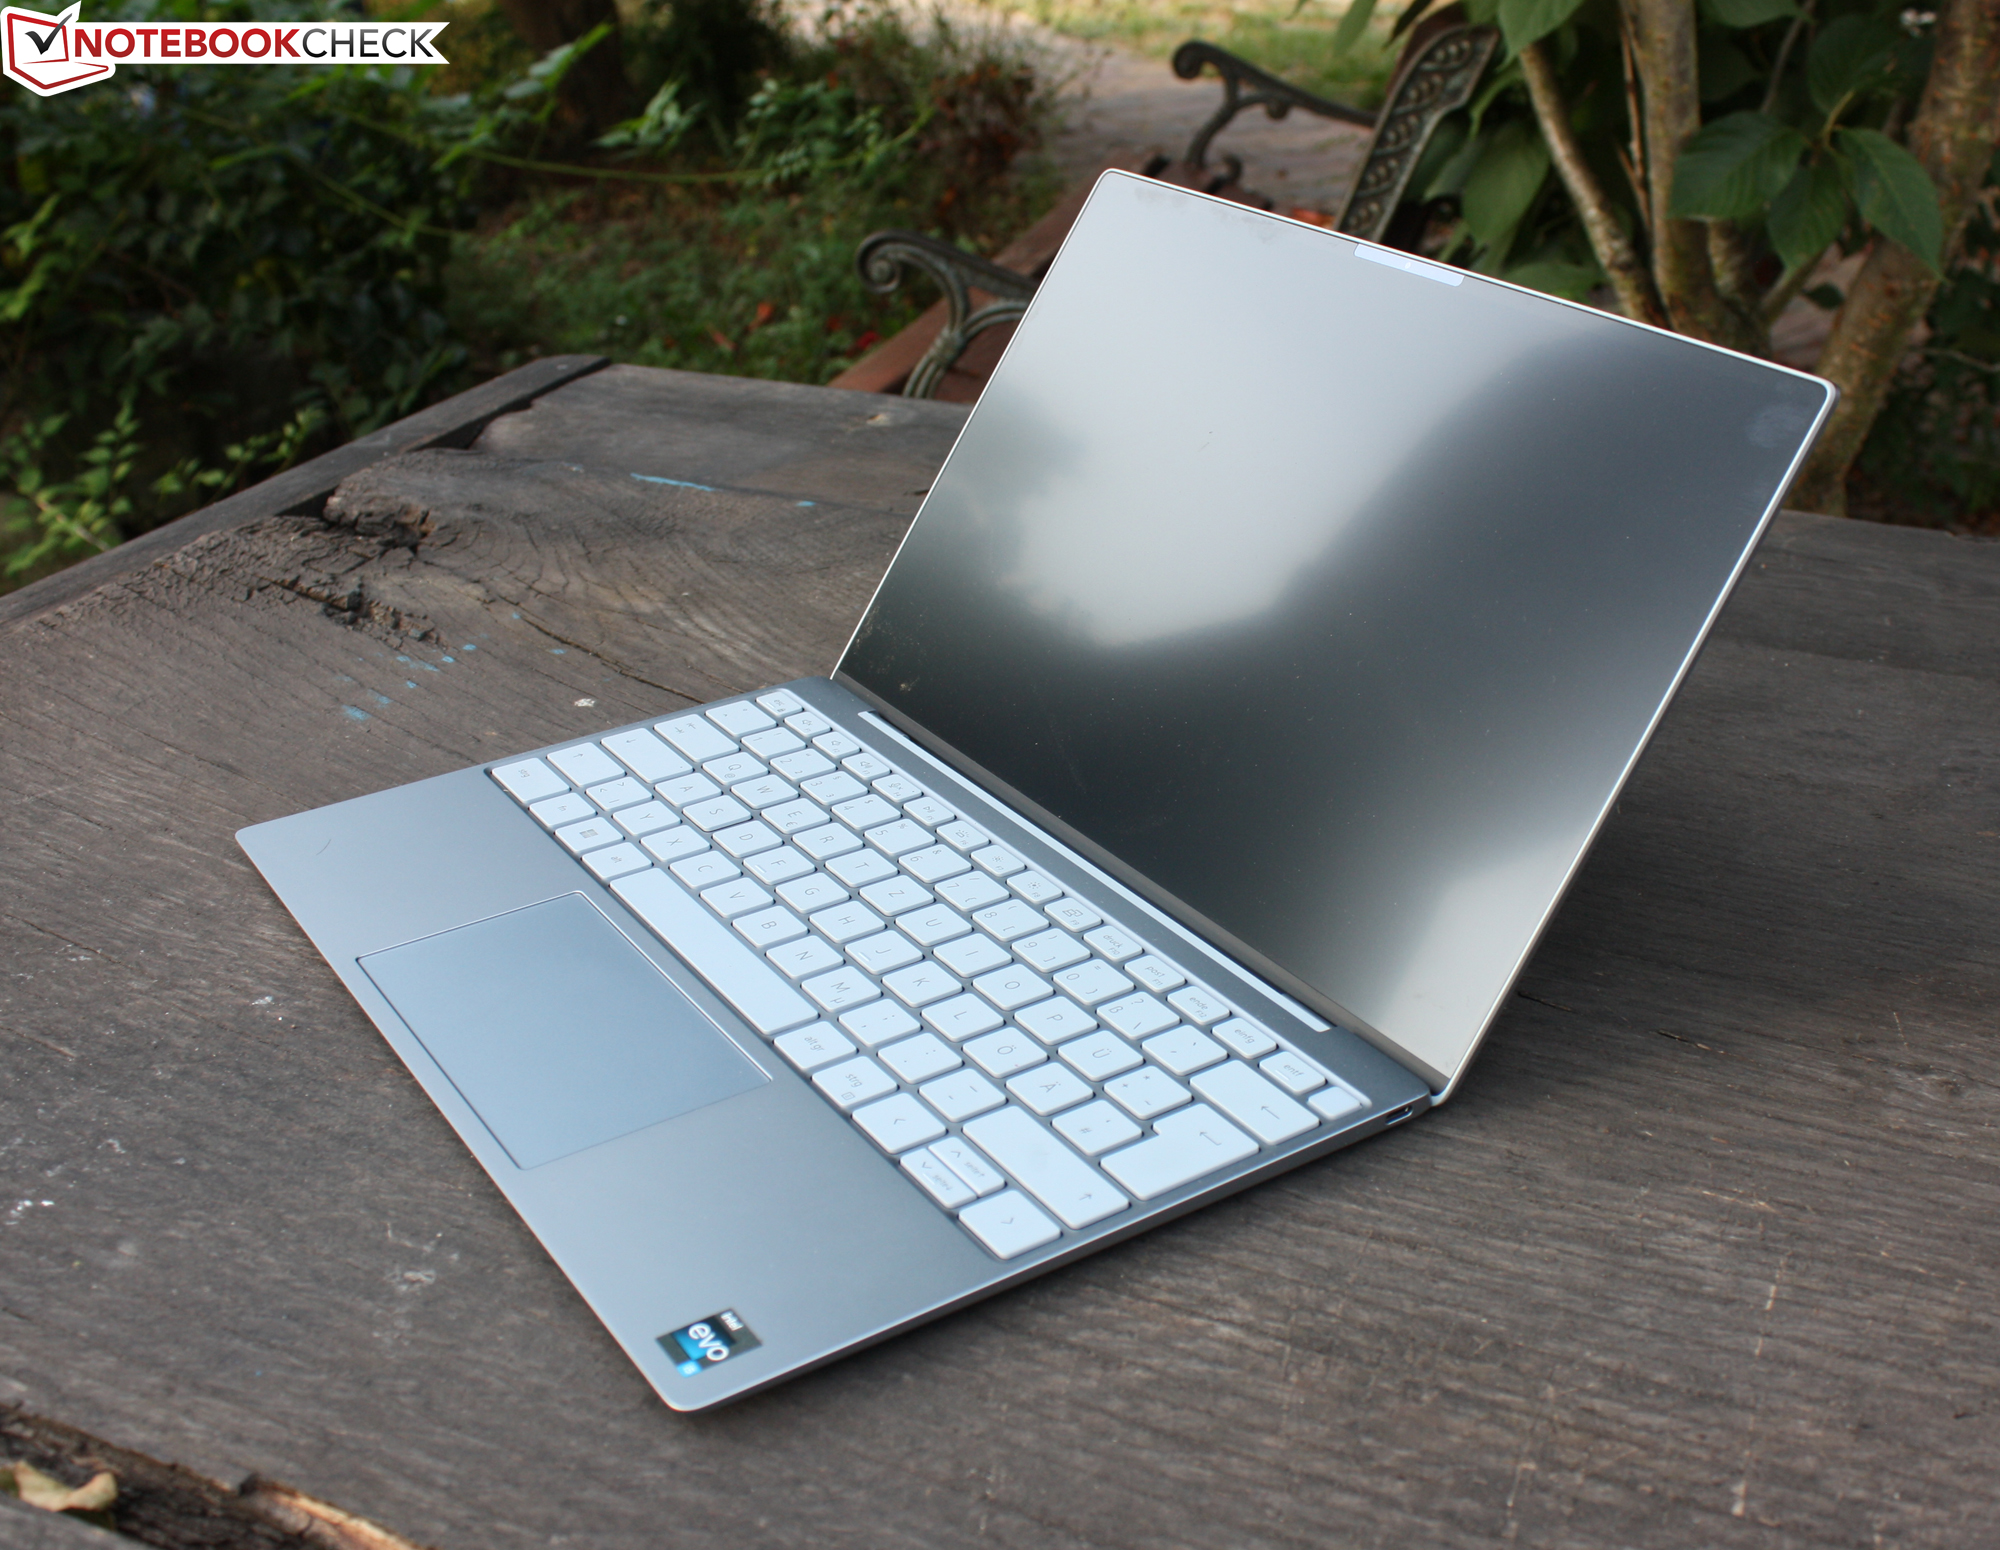
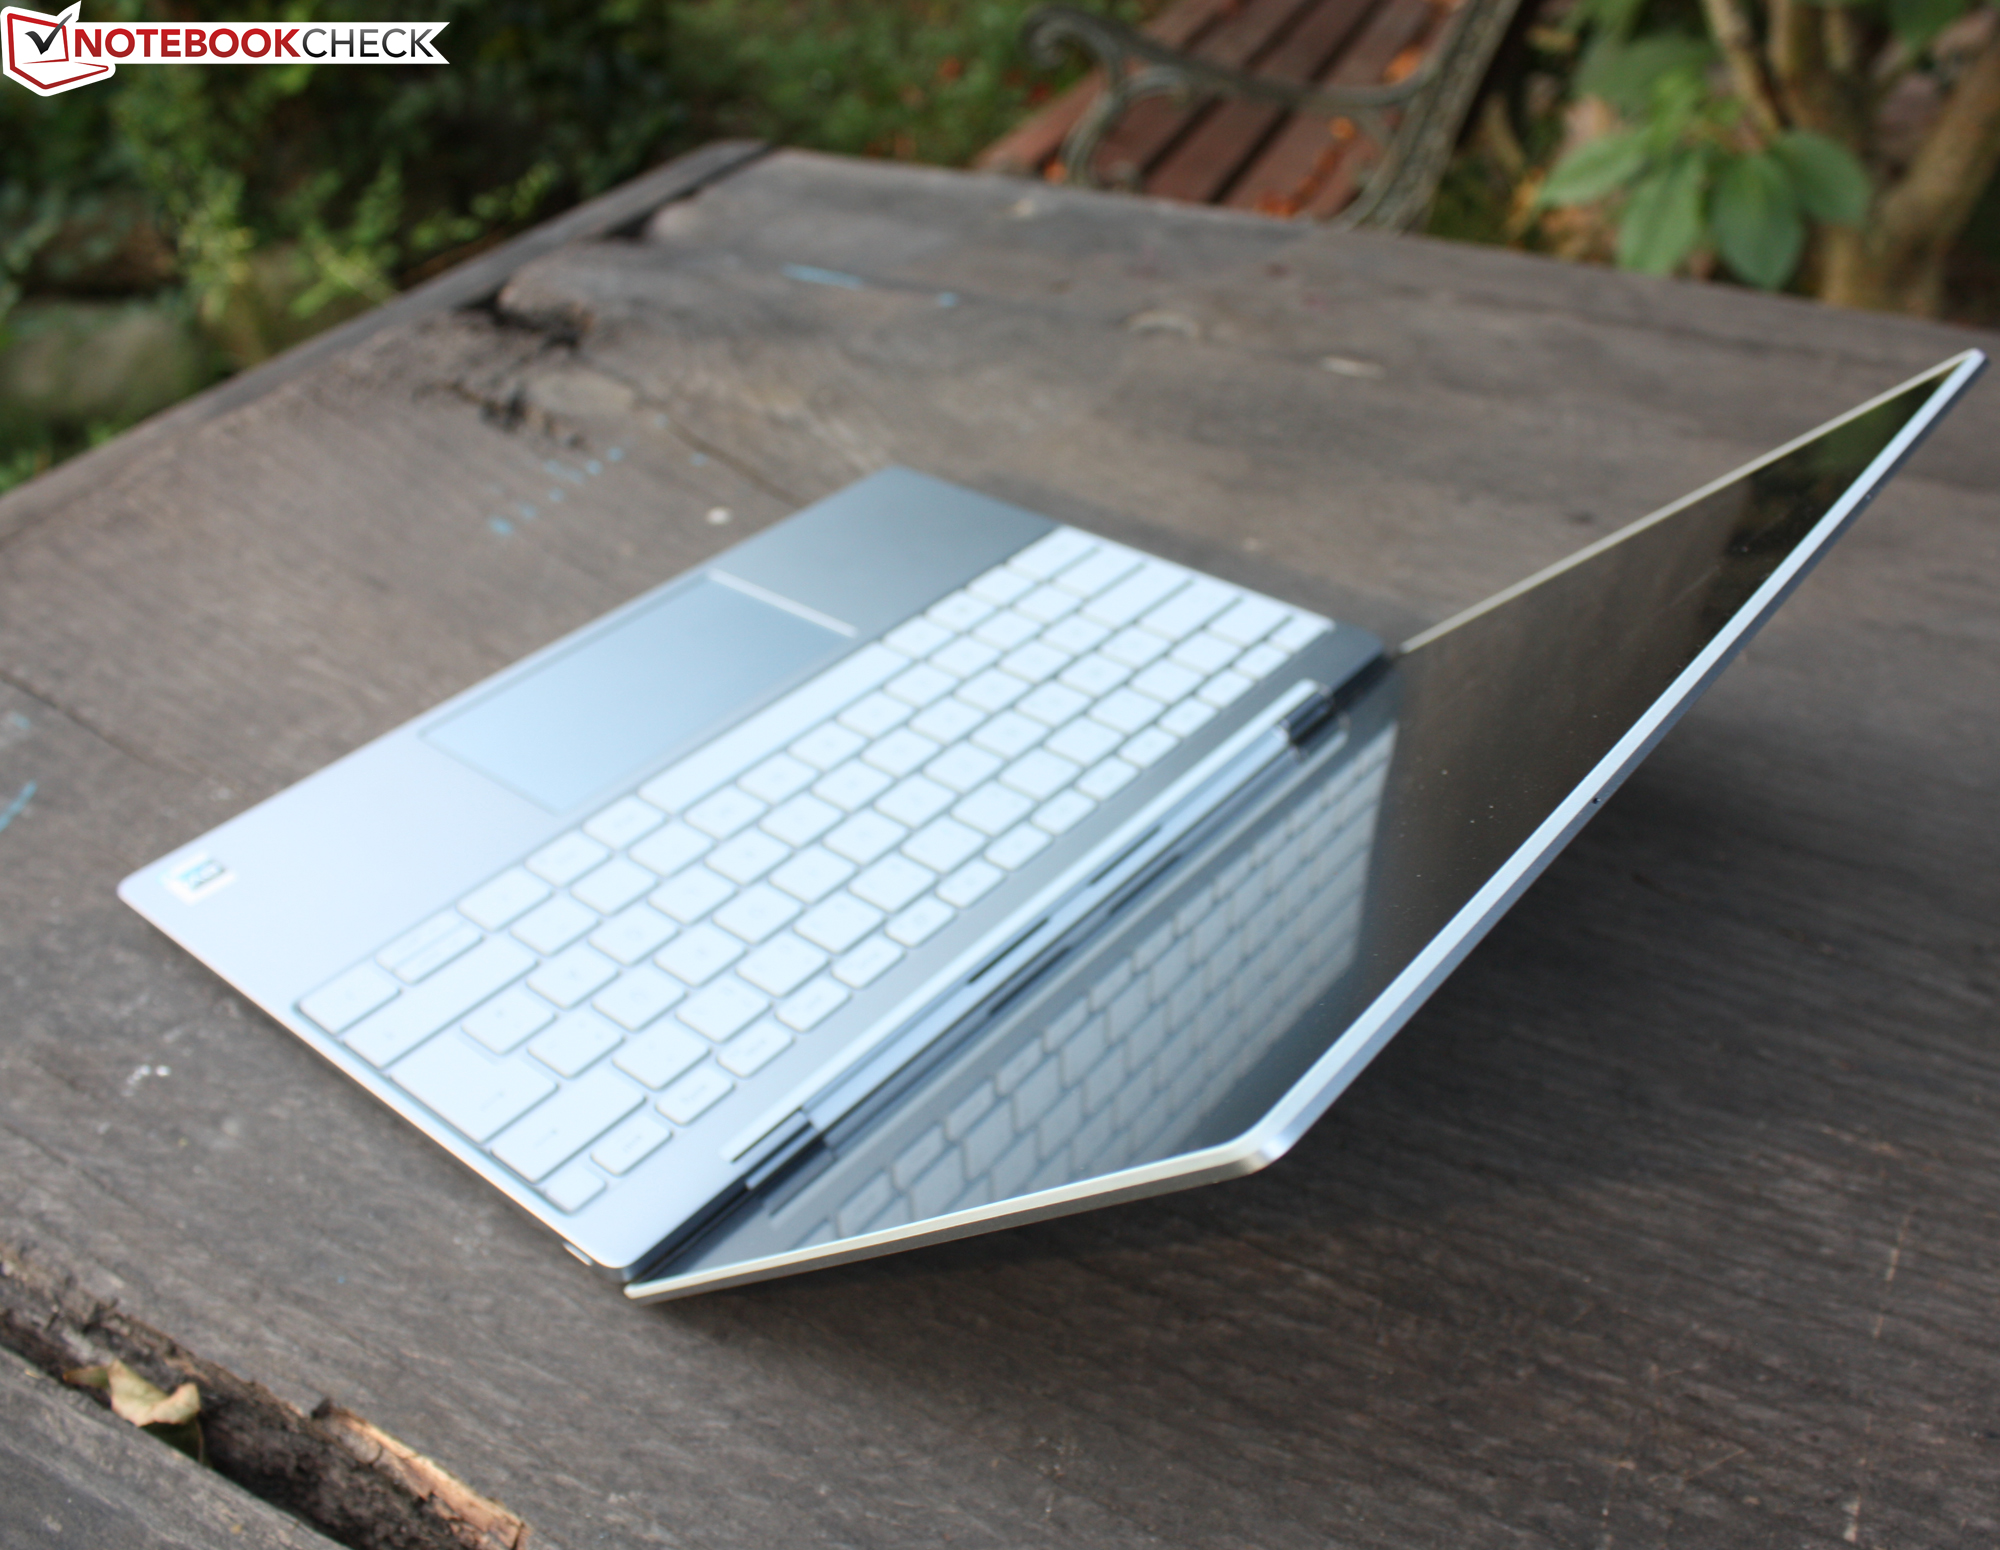
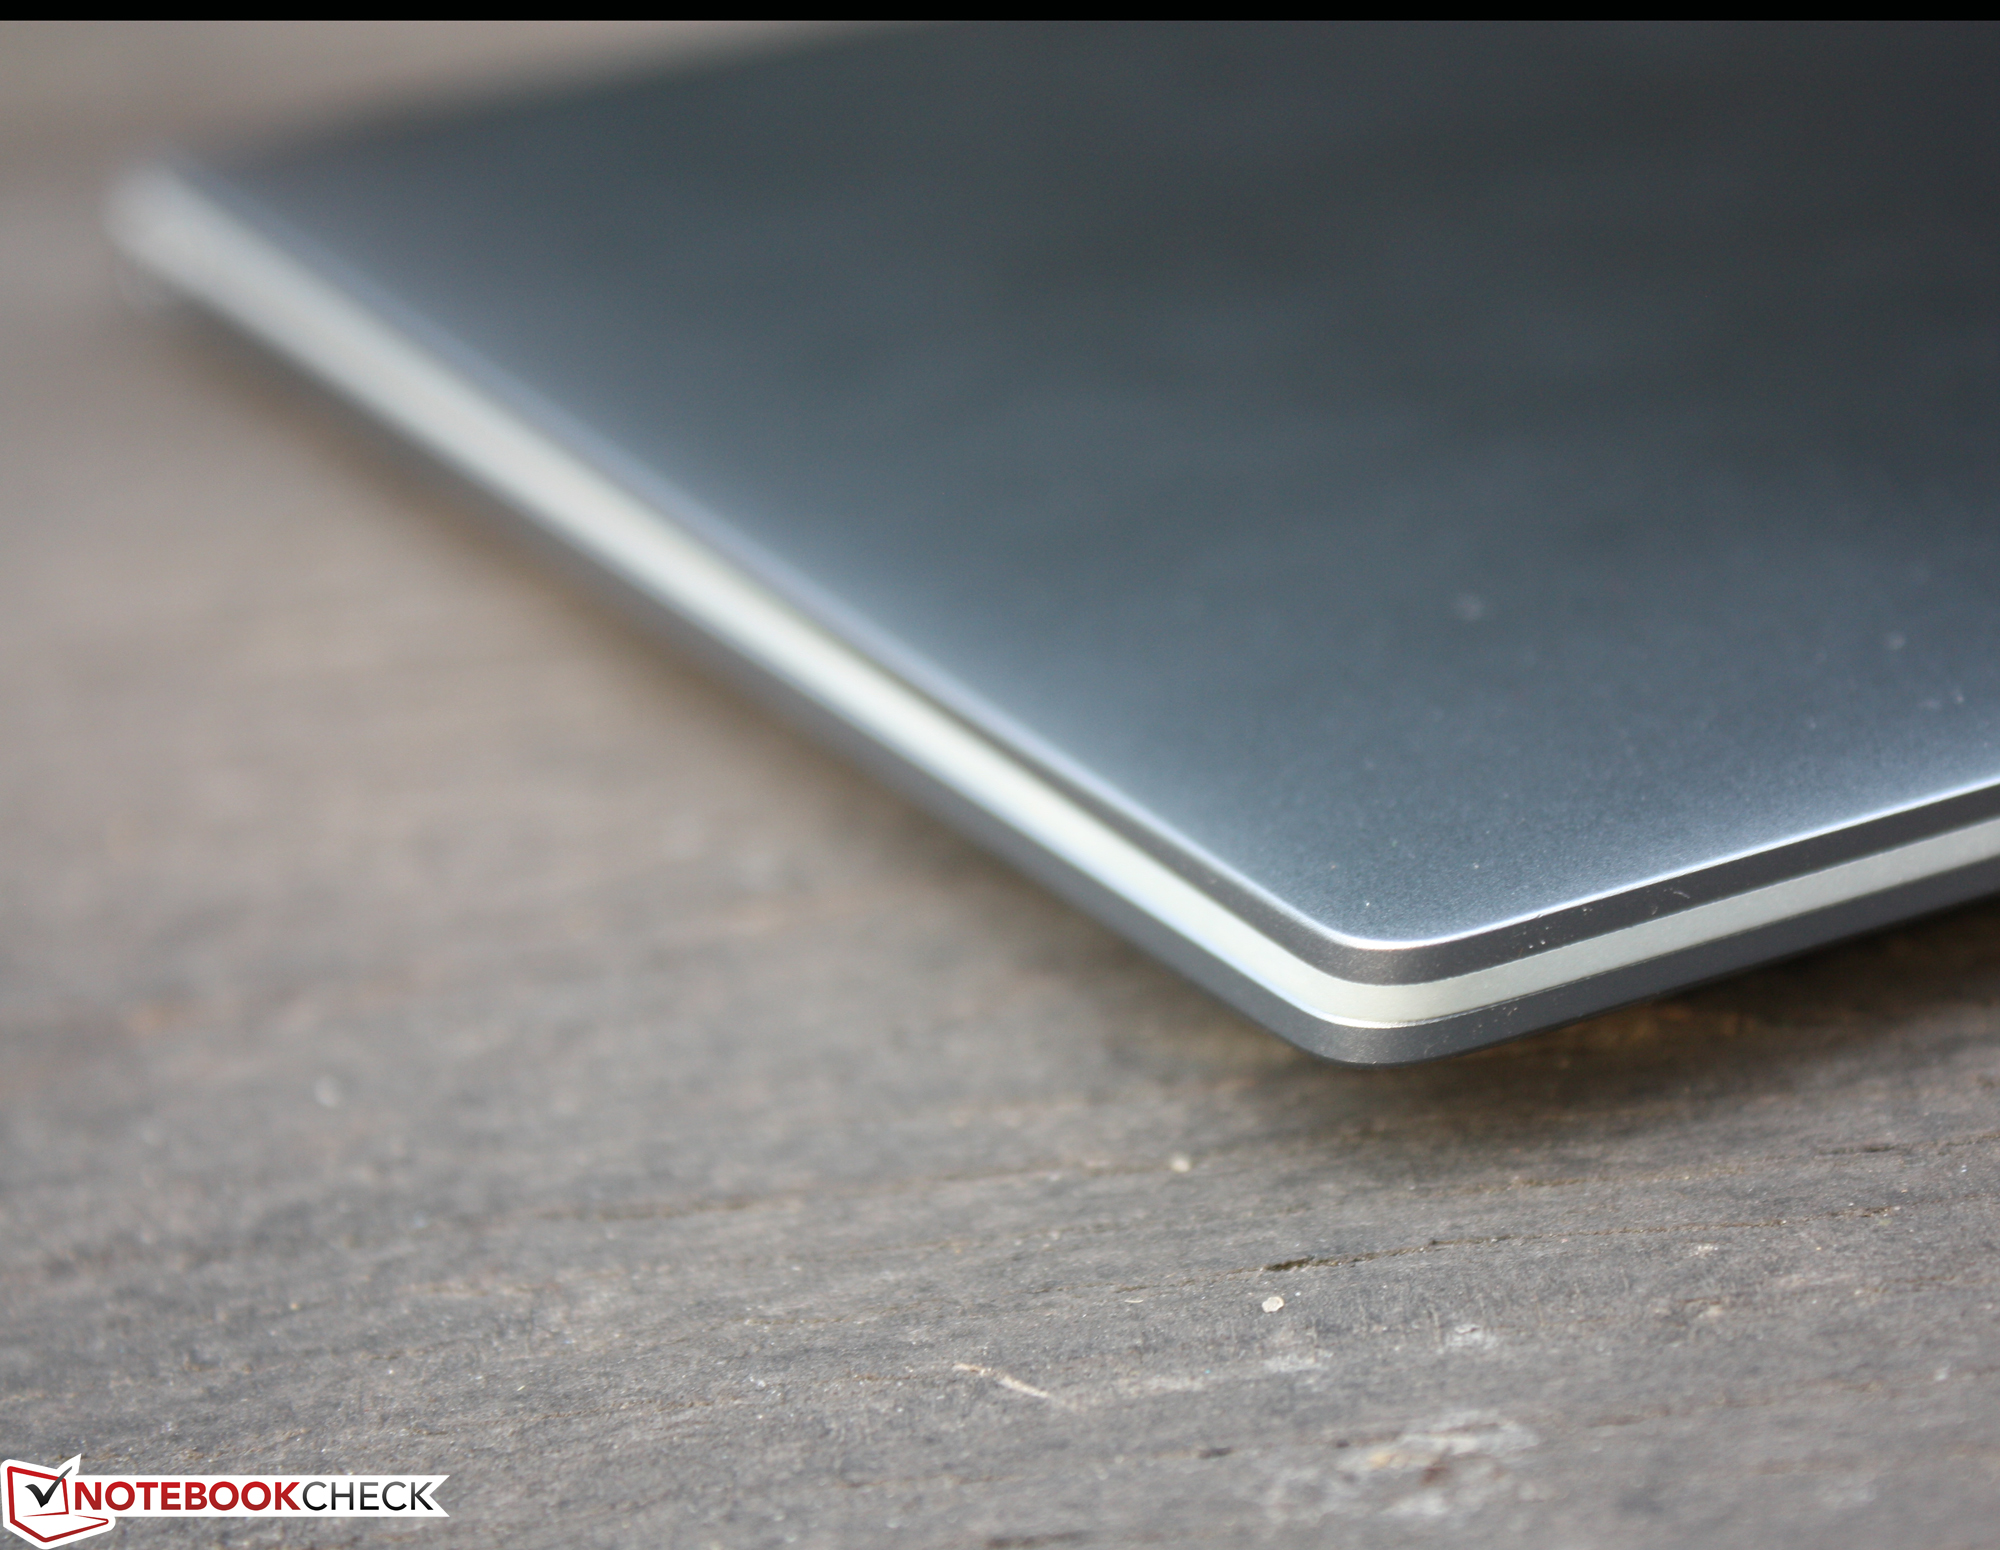
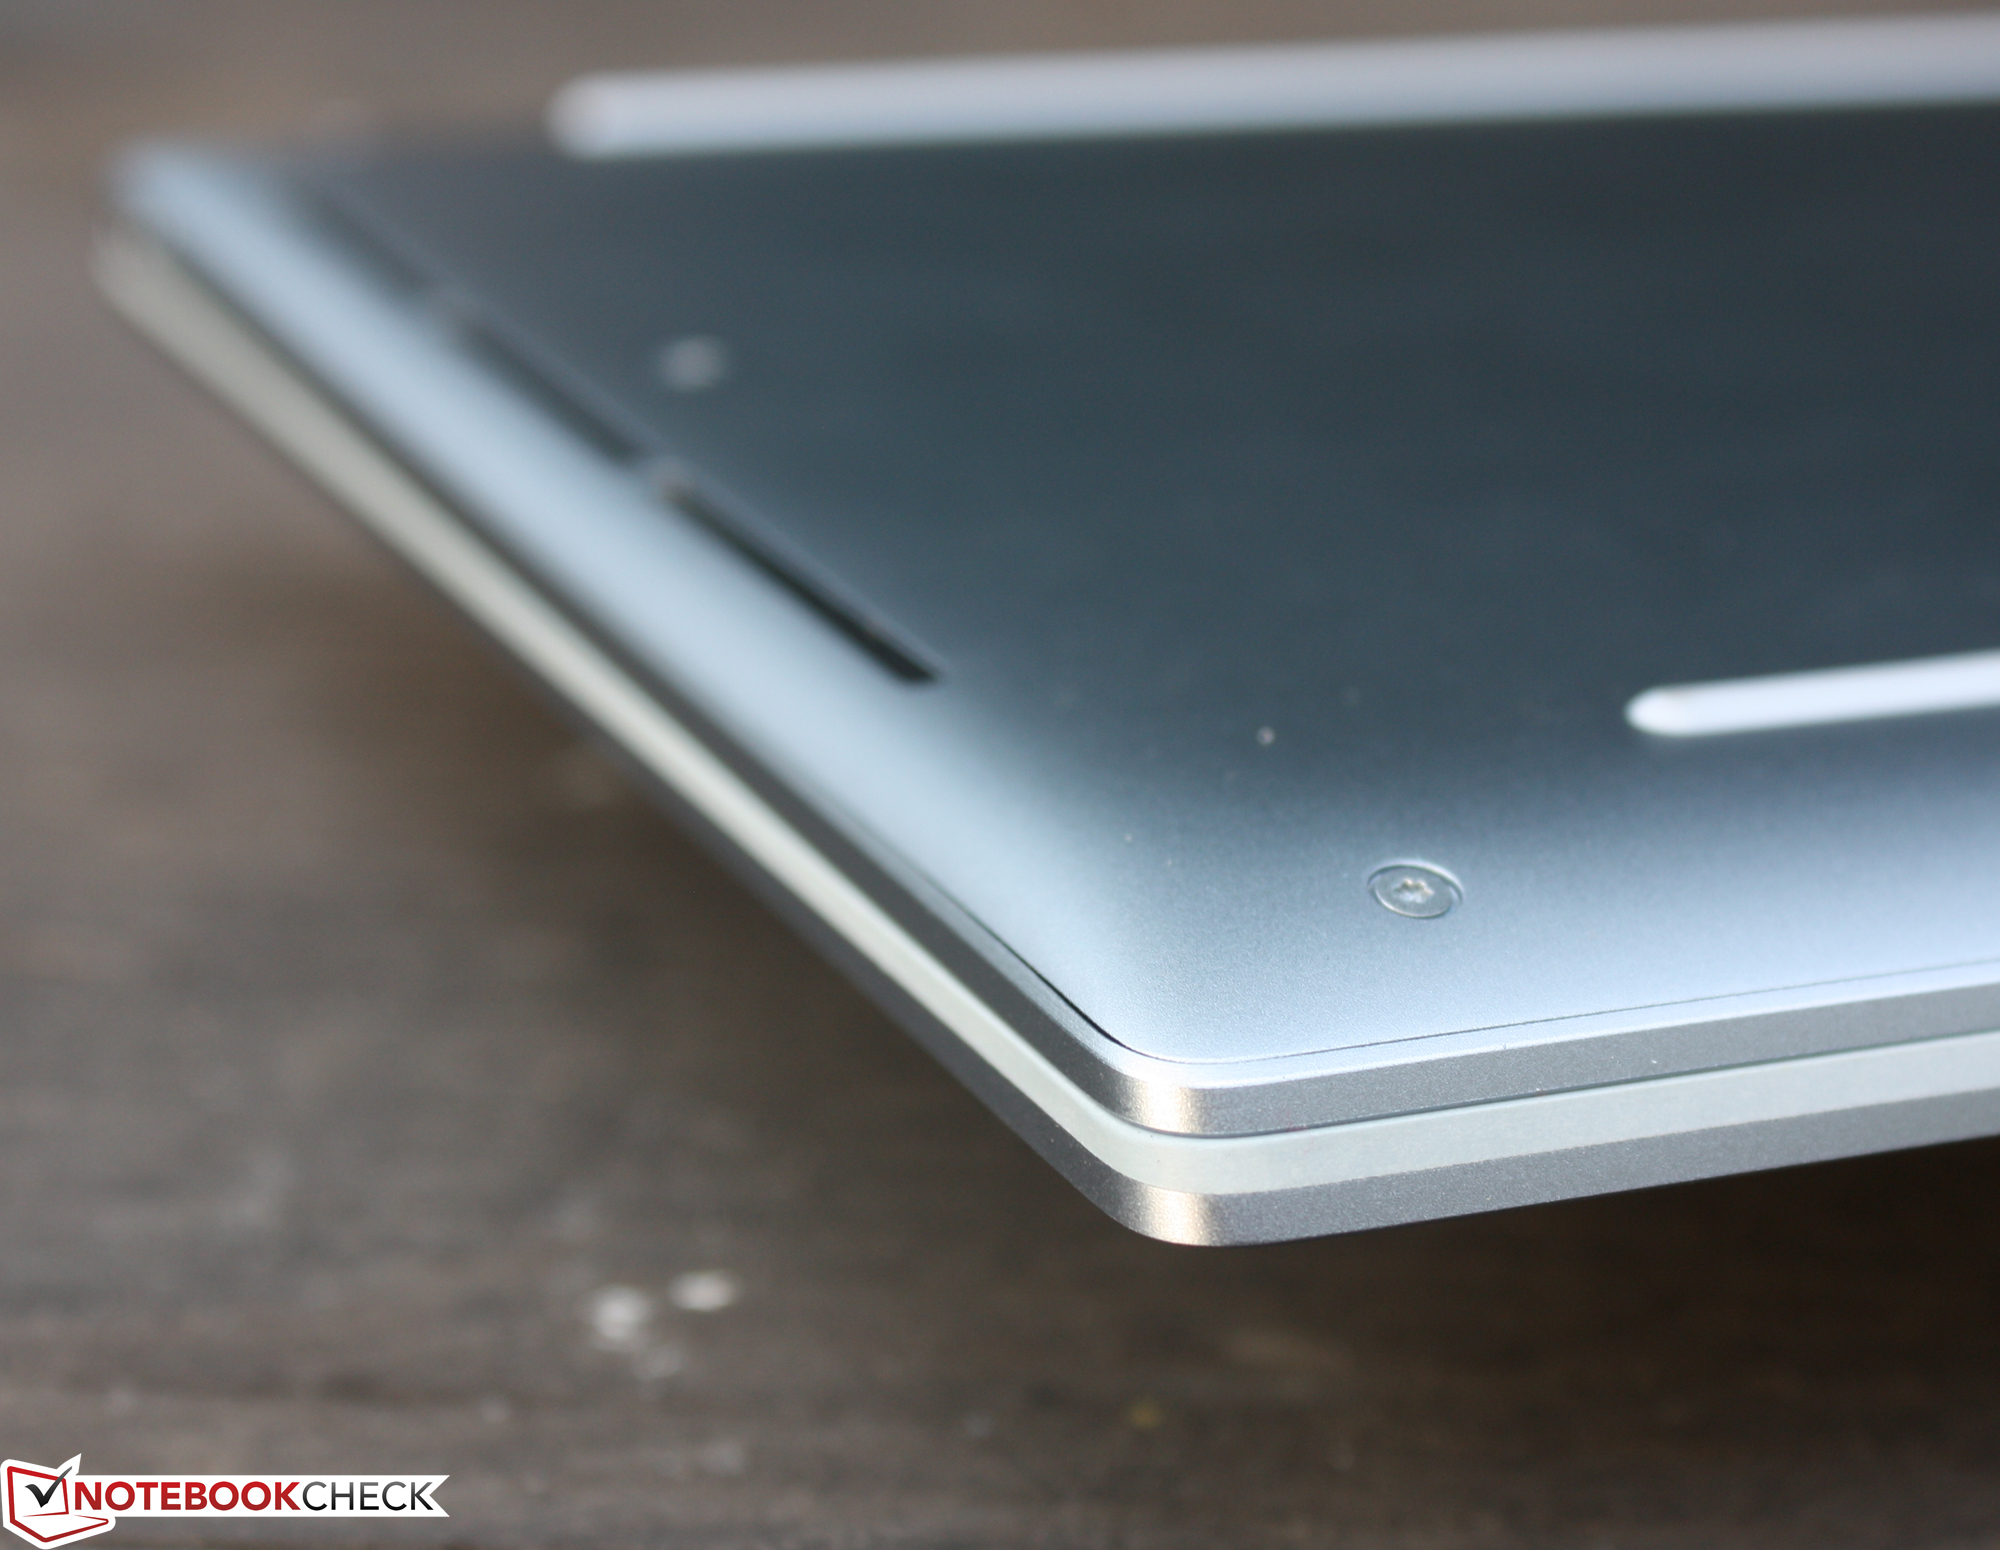
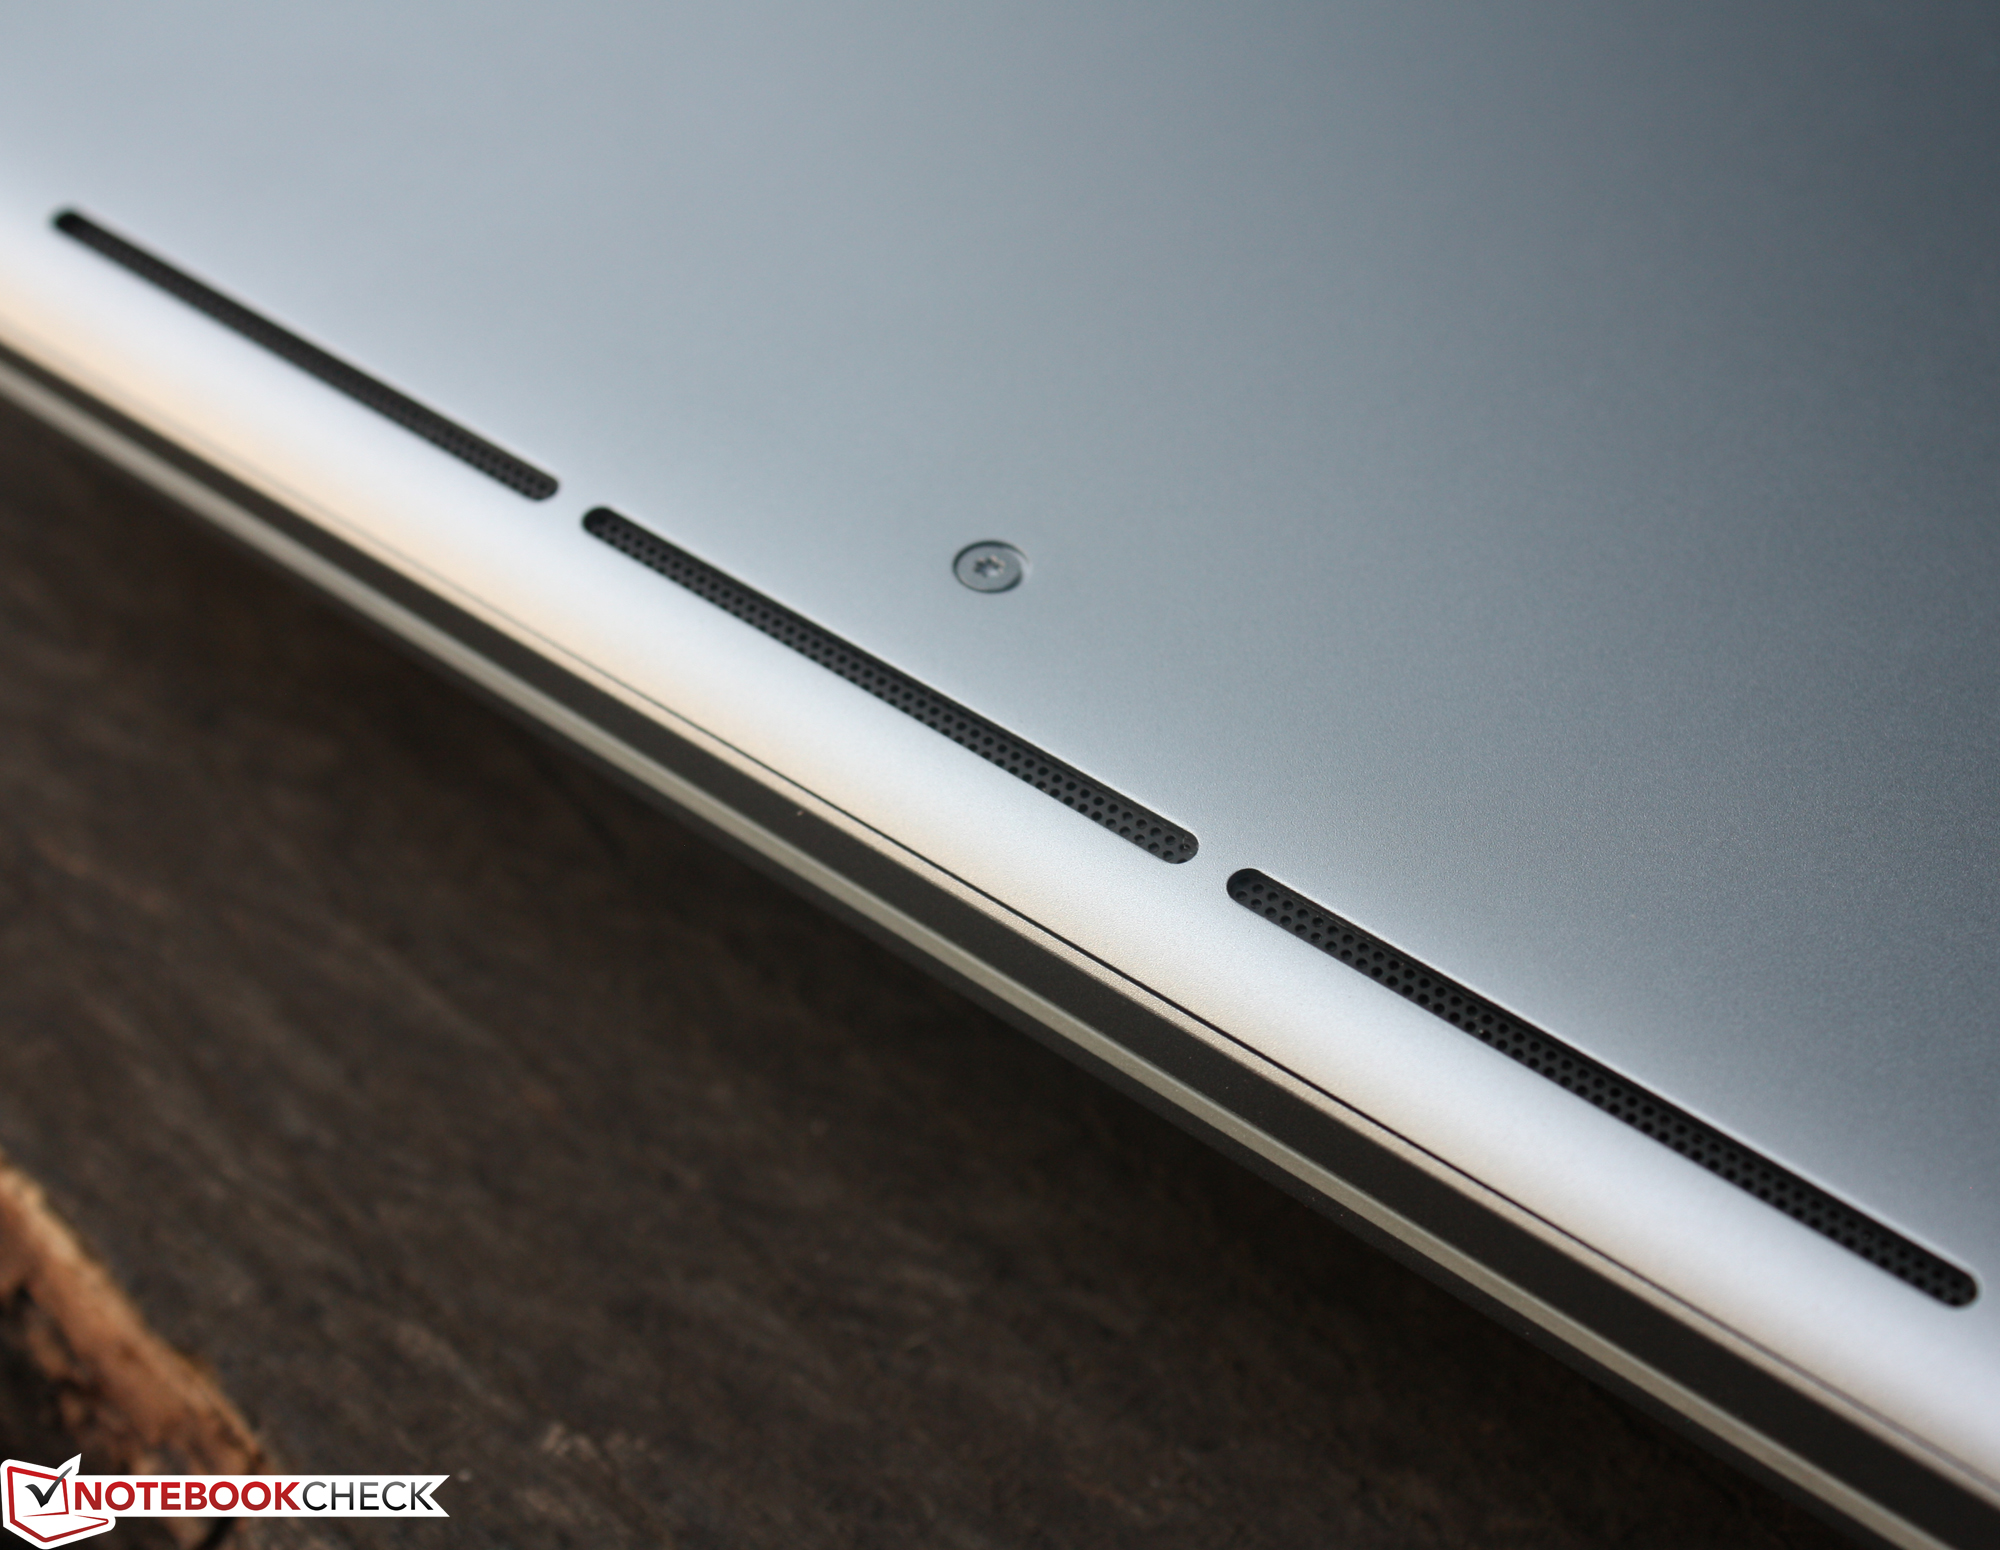
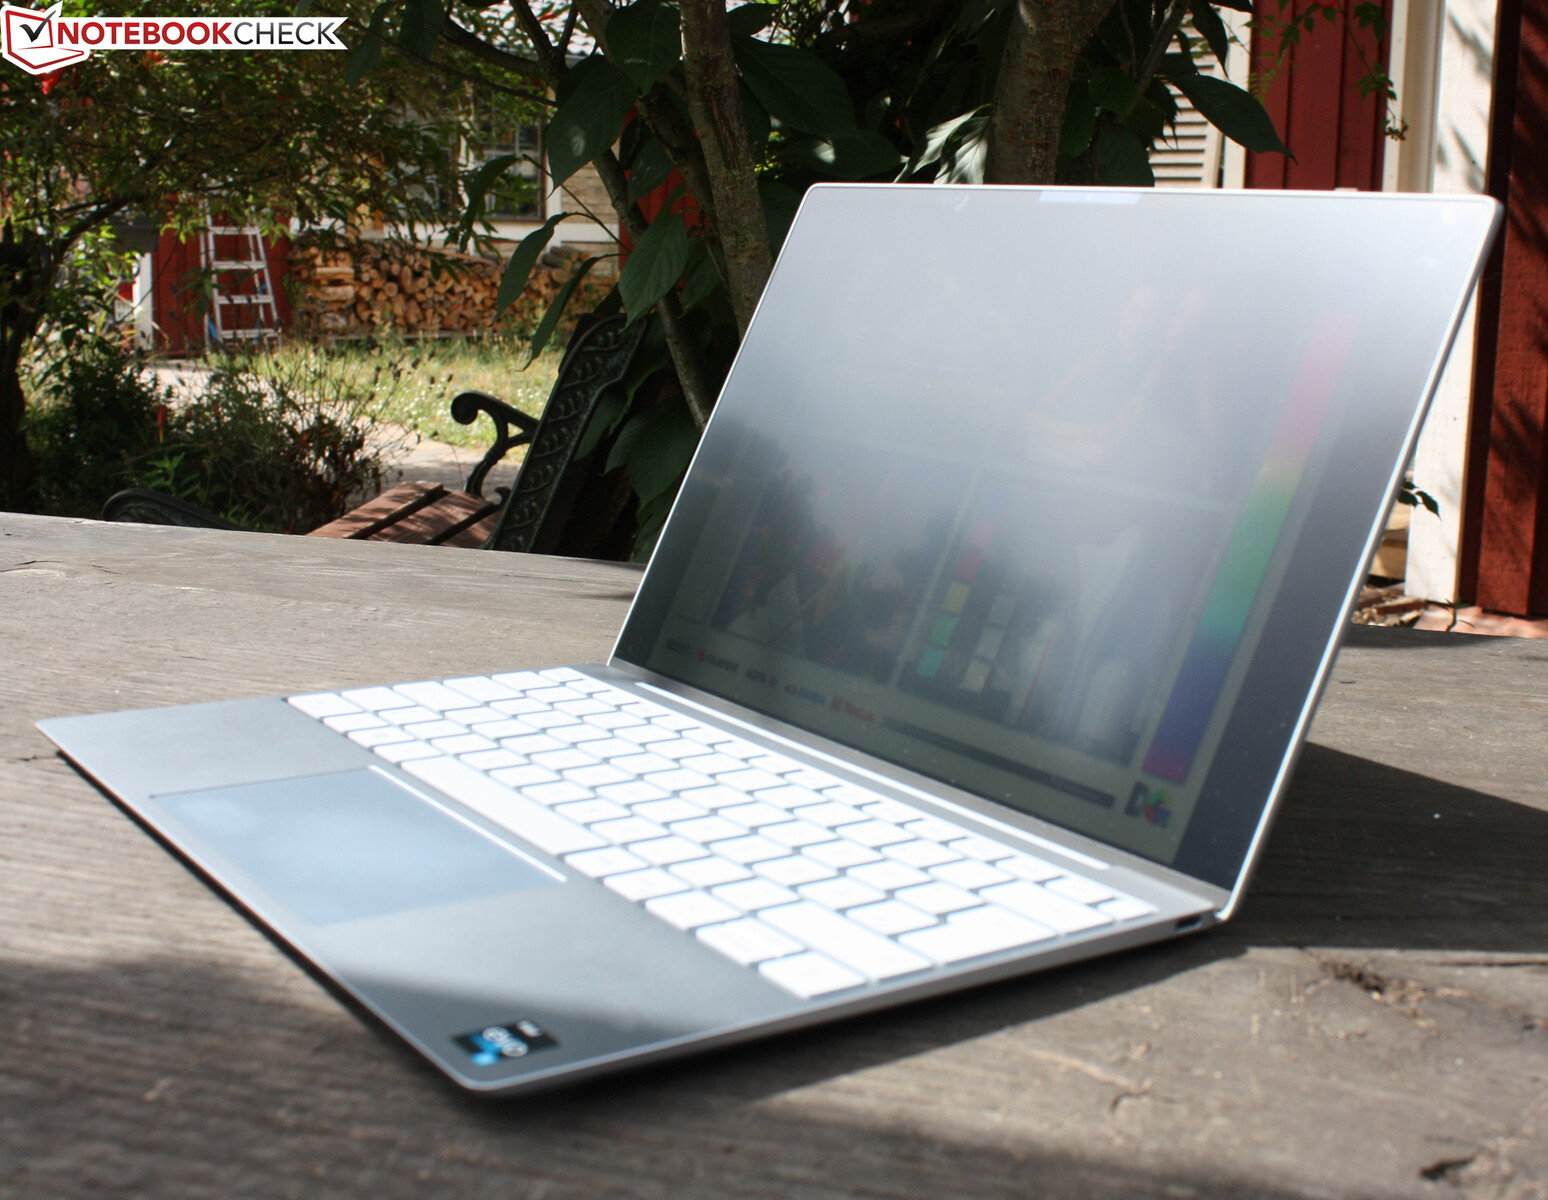
Case - Robust & Sleek Ultrabook
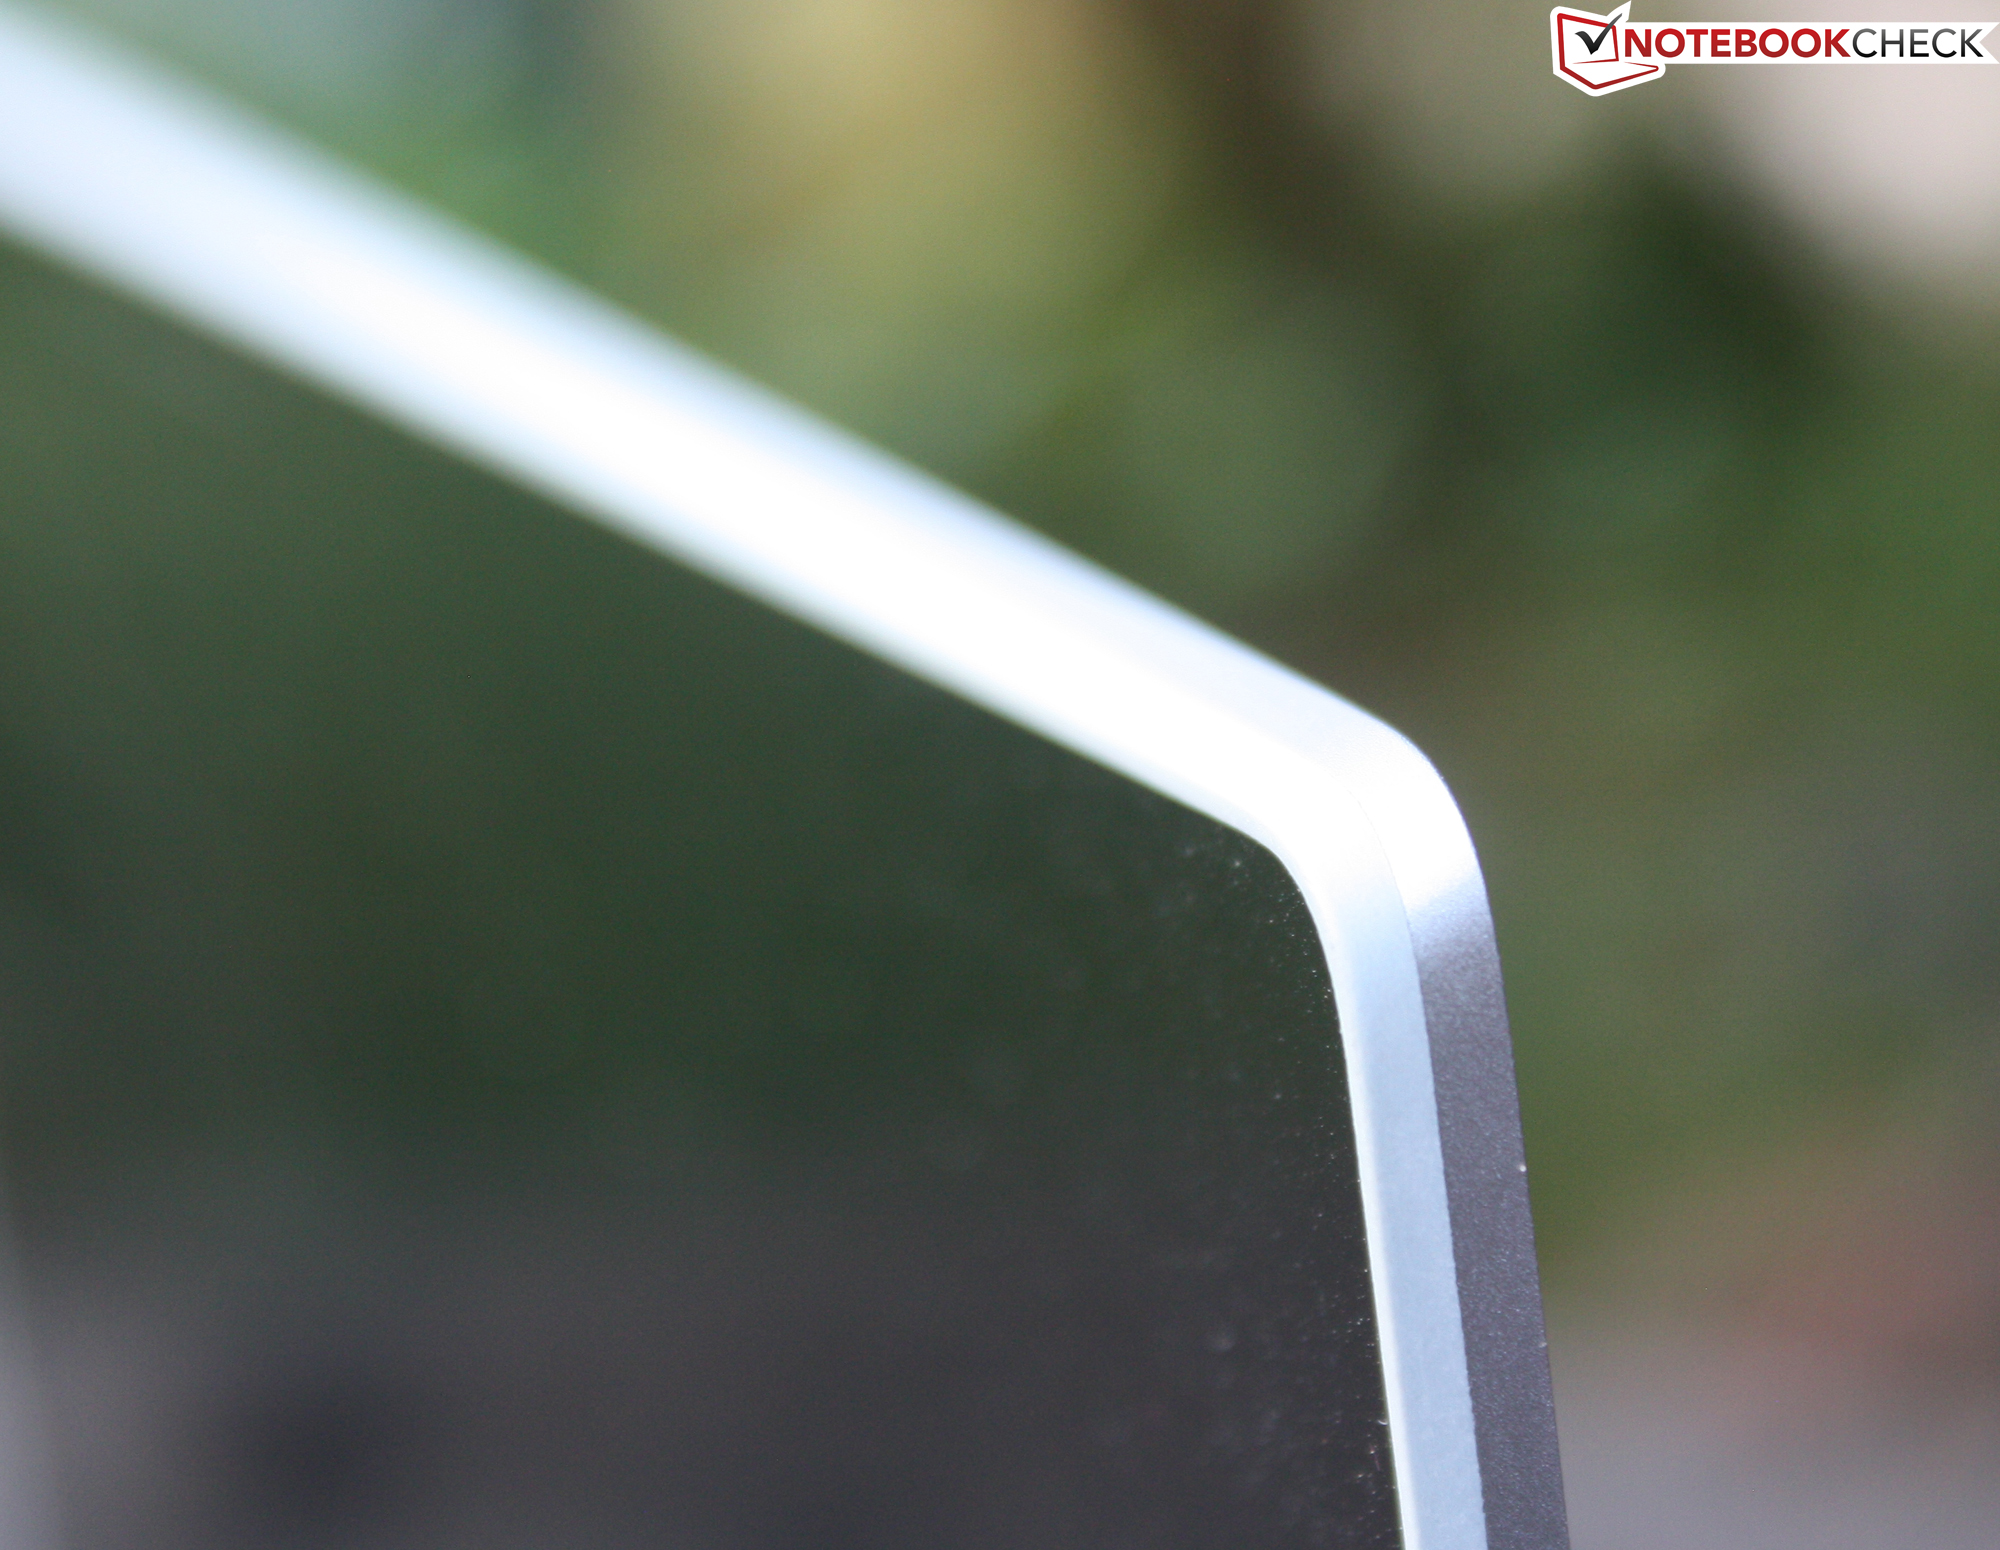
Despite favoring sharp edges in the past, things are slightly more round this time around. All corners are rounded-off and the bottom plate has a slight curve. Cutting almost all ports - except for the two type-C ports - allows for a minimalistic design language that is very resistant to twisting. The base unit feels sturdy and robust, although there is some creaking when attempting to twist it from the corners. The keyboard area is rigid and does not yield under pressure. The same holds true for the palm rests, which are rock solid.
The hinges are firm and are held in the closed position magnetically. Opening the lid is somewhat difficult, since there is nothing on the edge to help grasp it and it seamlessly transitions into base unit. However, after securing a small gap, opening the laptop with one hand is possible. During this, the heavy base ensures that the device remains on the table.
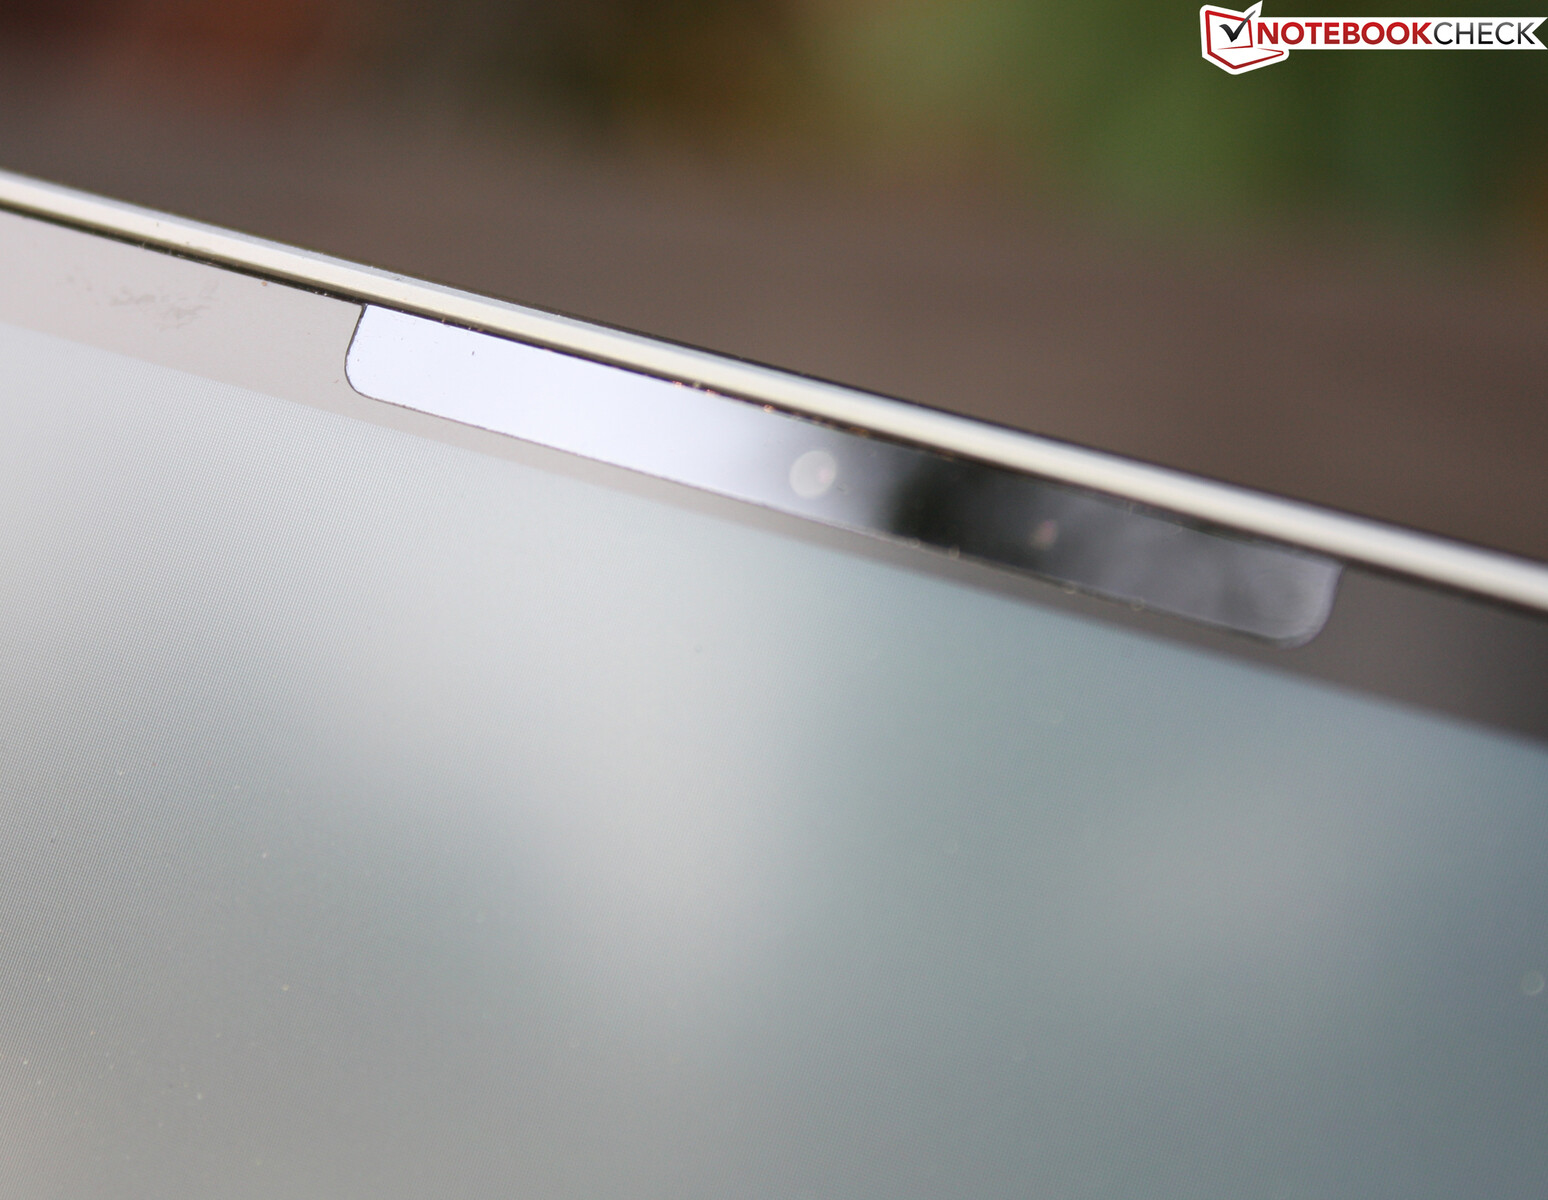
The hinge can be opened to a maximum angle of around 135 degrees, where it stops abruptly without any teetering. The aluminum lid is resistant to twisting. Applying pressure to its back does not result in any yielding or distortions on the display. The webcam has been moved to the black display bezel making it effectively disappear visually. However, the webcam notch does not protrude into the display area. The screen bezels are very small resulting in a screen-to-body ratio of 89 percent.
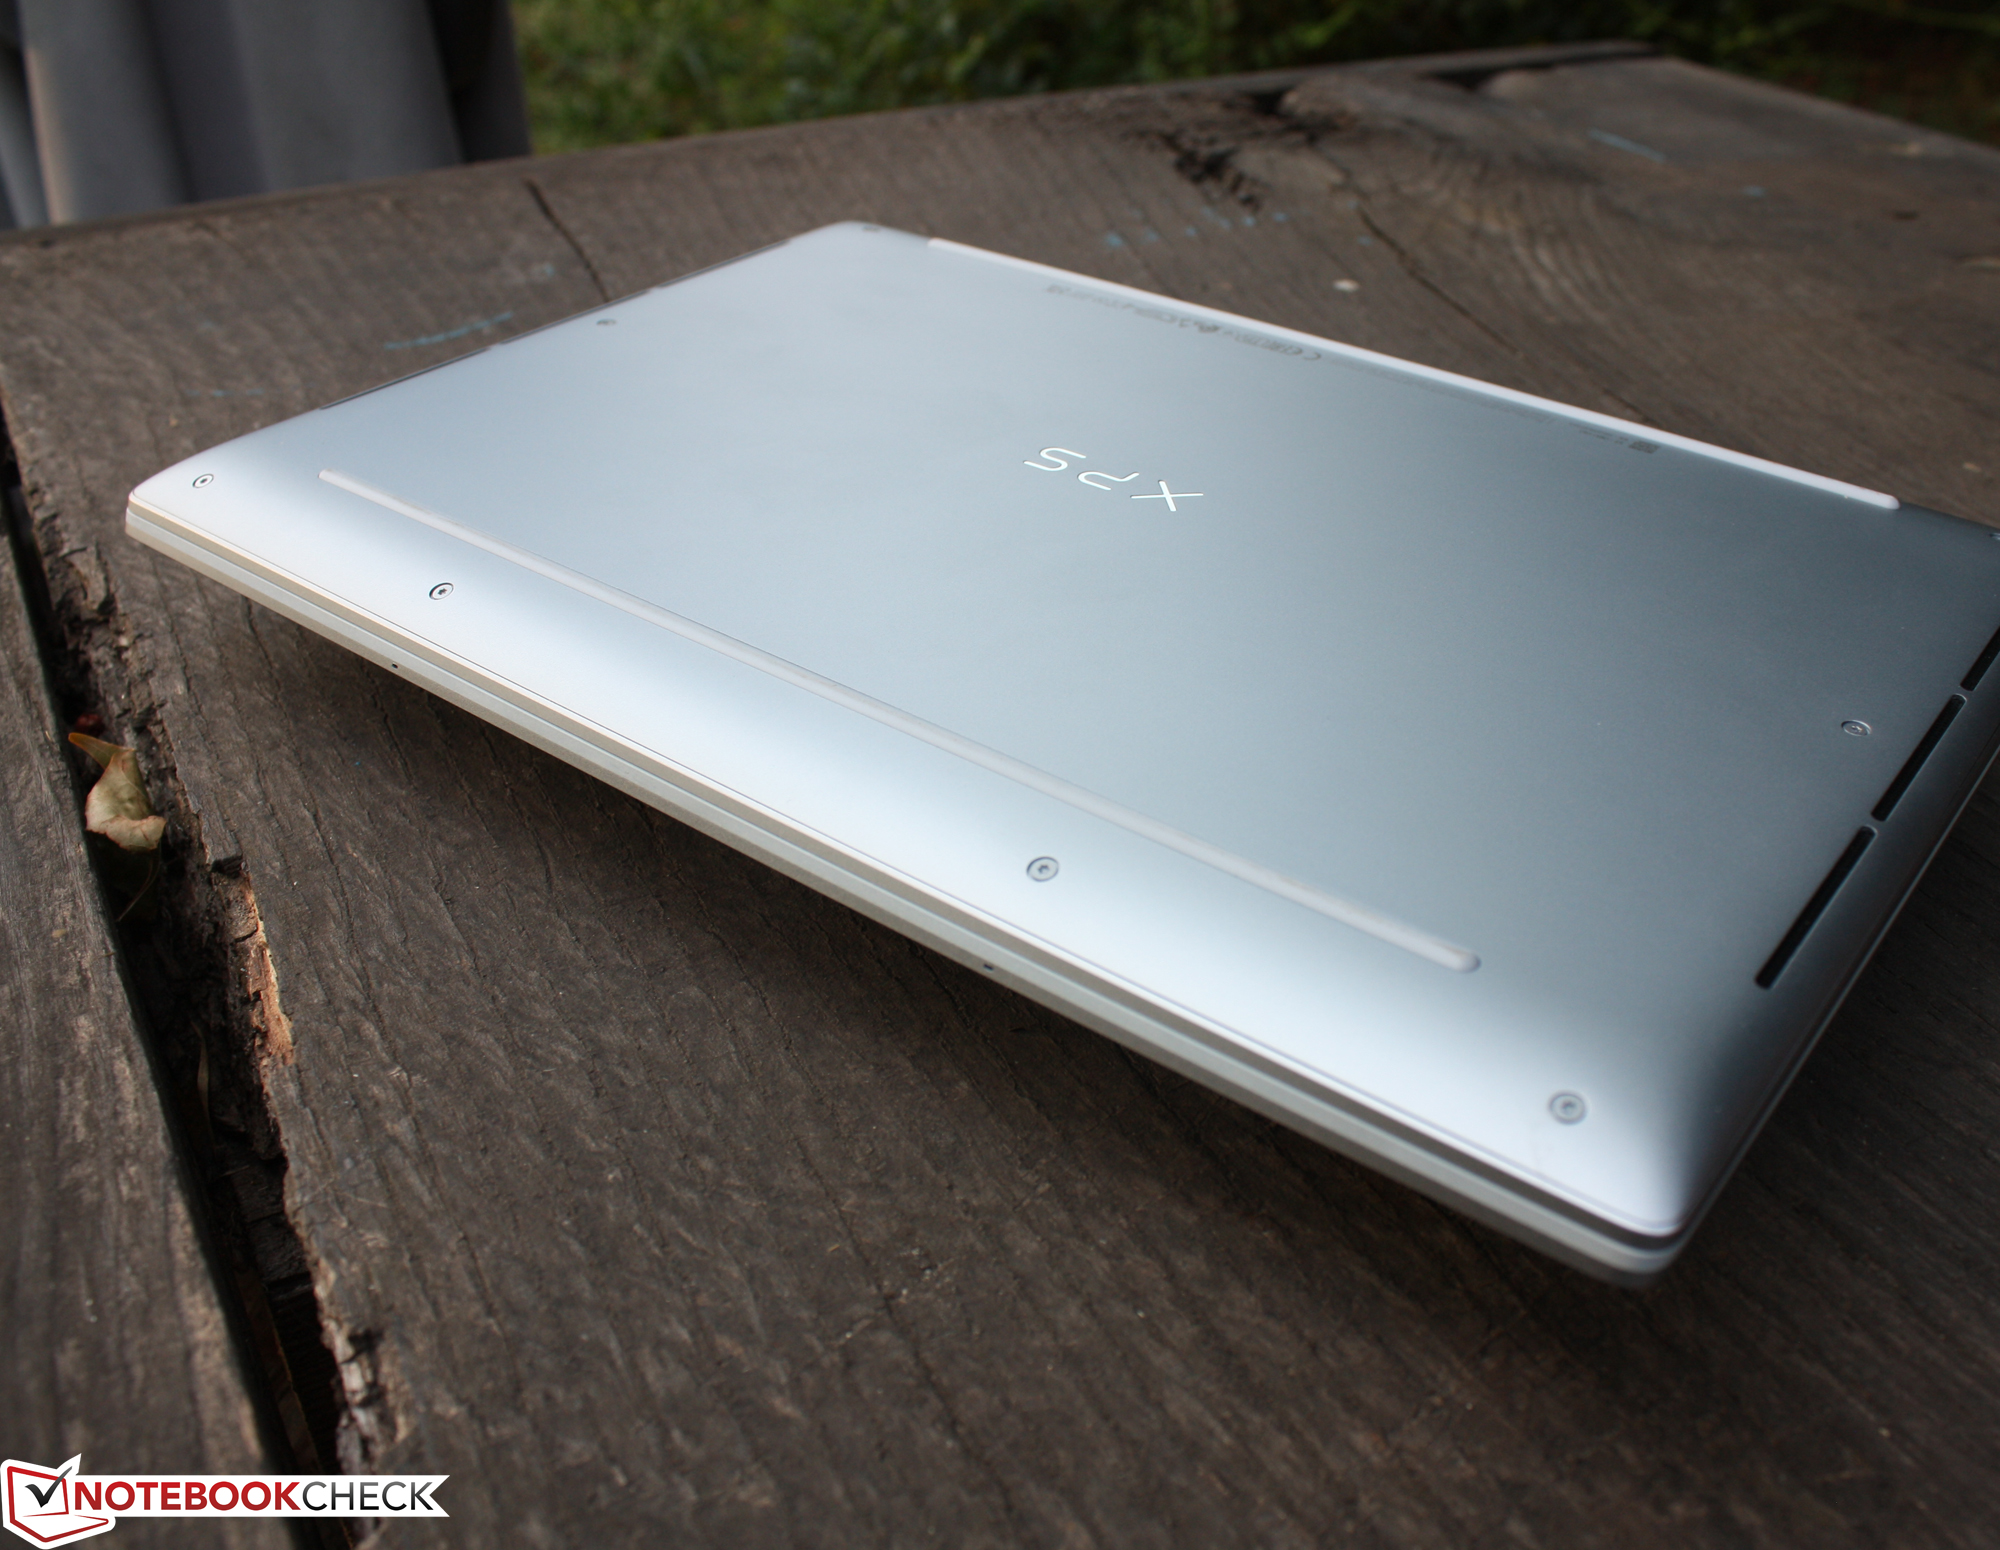
The new XPS 13 9315 and the older Dell XPS 13 9310 are the most compact devices in our comparison and can be easily transported in any bag or backpack. It is average in terms of the weight with both the Asus Zenbook S 13 and the ThinkPad X1 Nano being lighter. However, the 9315 weighs 100 grams less than the 9310 from 2021. There is just one tiny difference between the Plus and the non-Plus version of 81 grams or ~0.18 lbs (1161 vs. 1242 grams/~2.56 vs. 2.74 lbs) in favor of the non-Plus. Although the 45-watt AC adapter is as compact as a wallet, the long cables result in a weight of 245 grams (~0.54 lbs). The 65-watt charger of the Plus model has the same small dimensions.
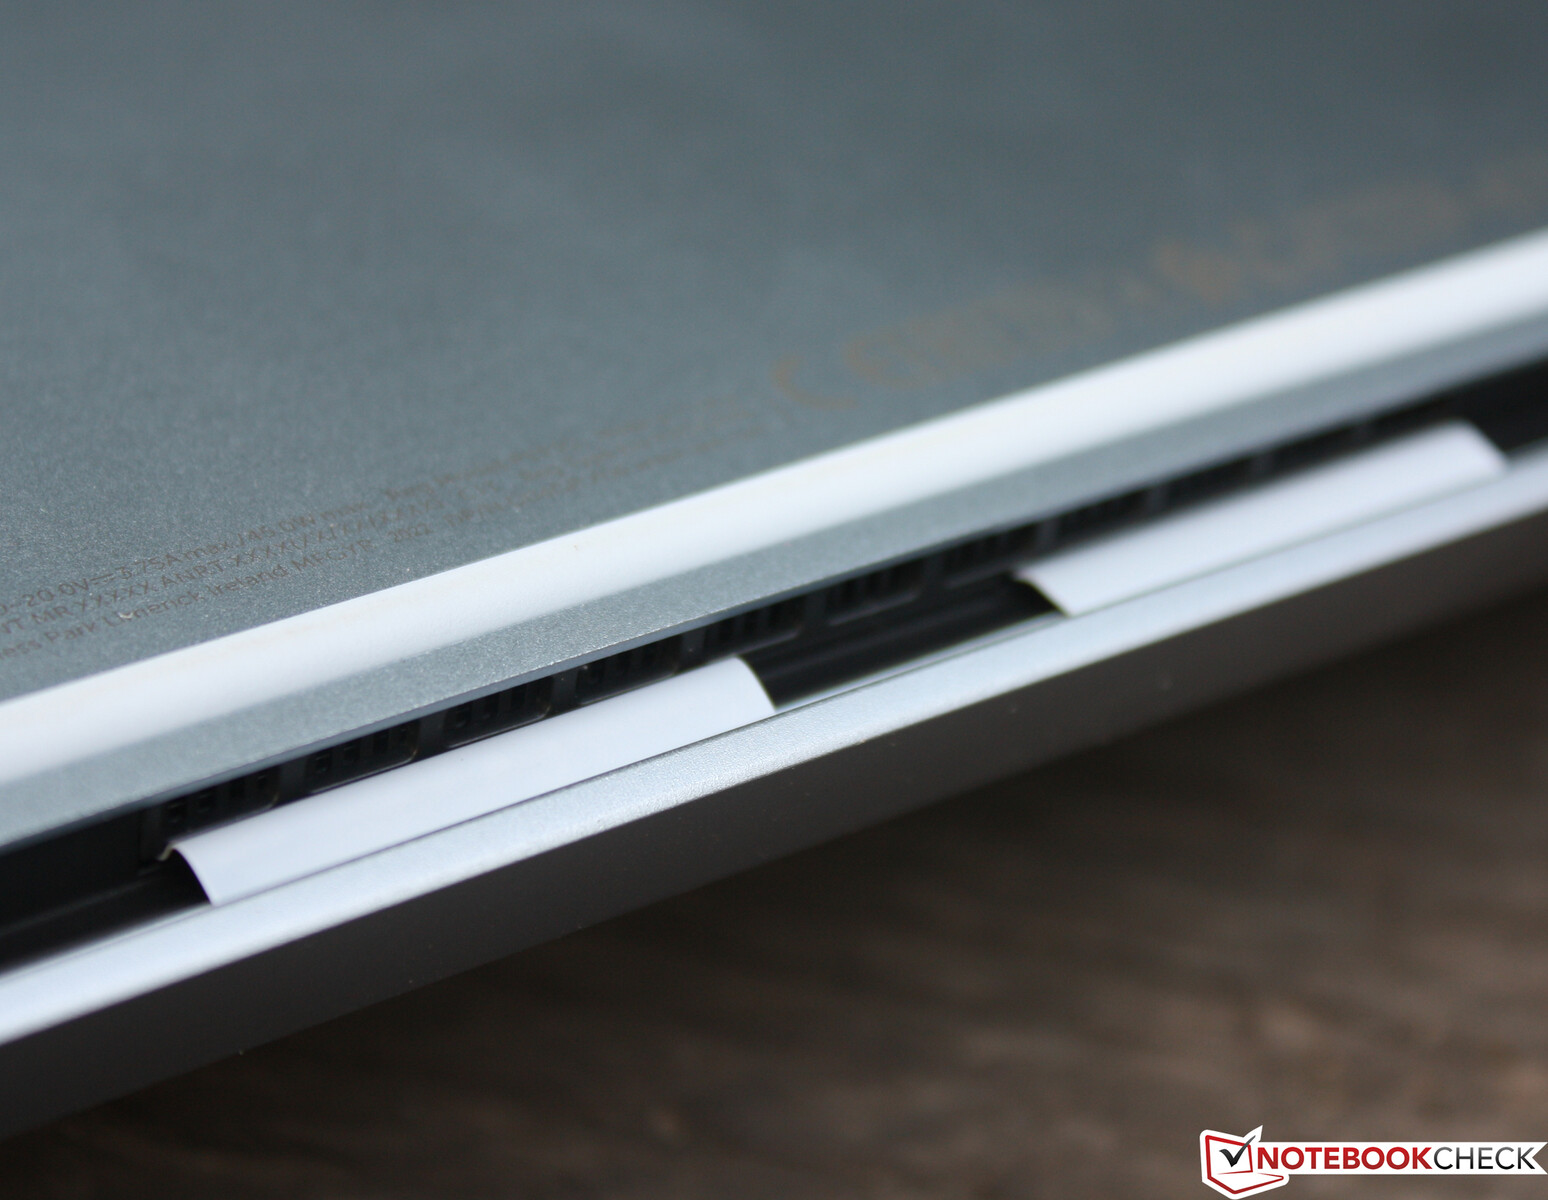
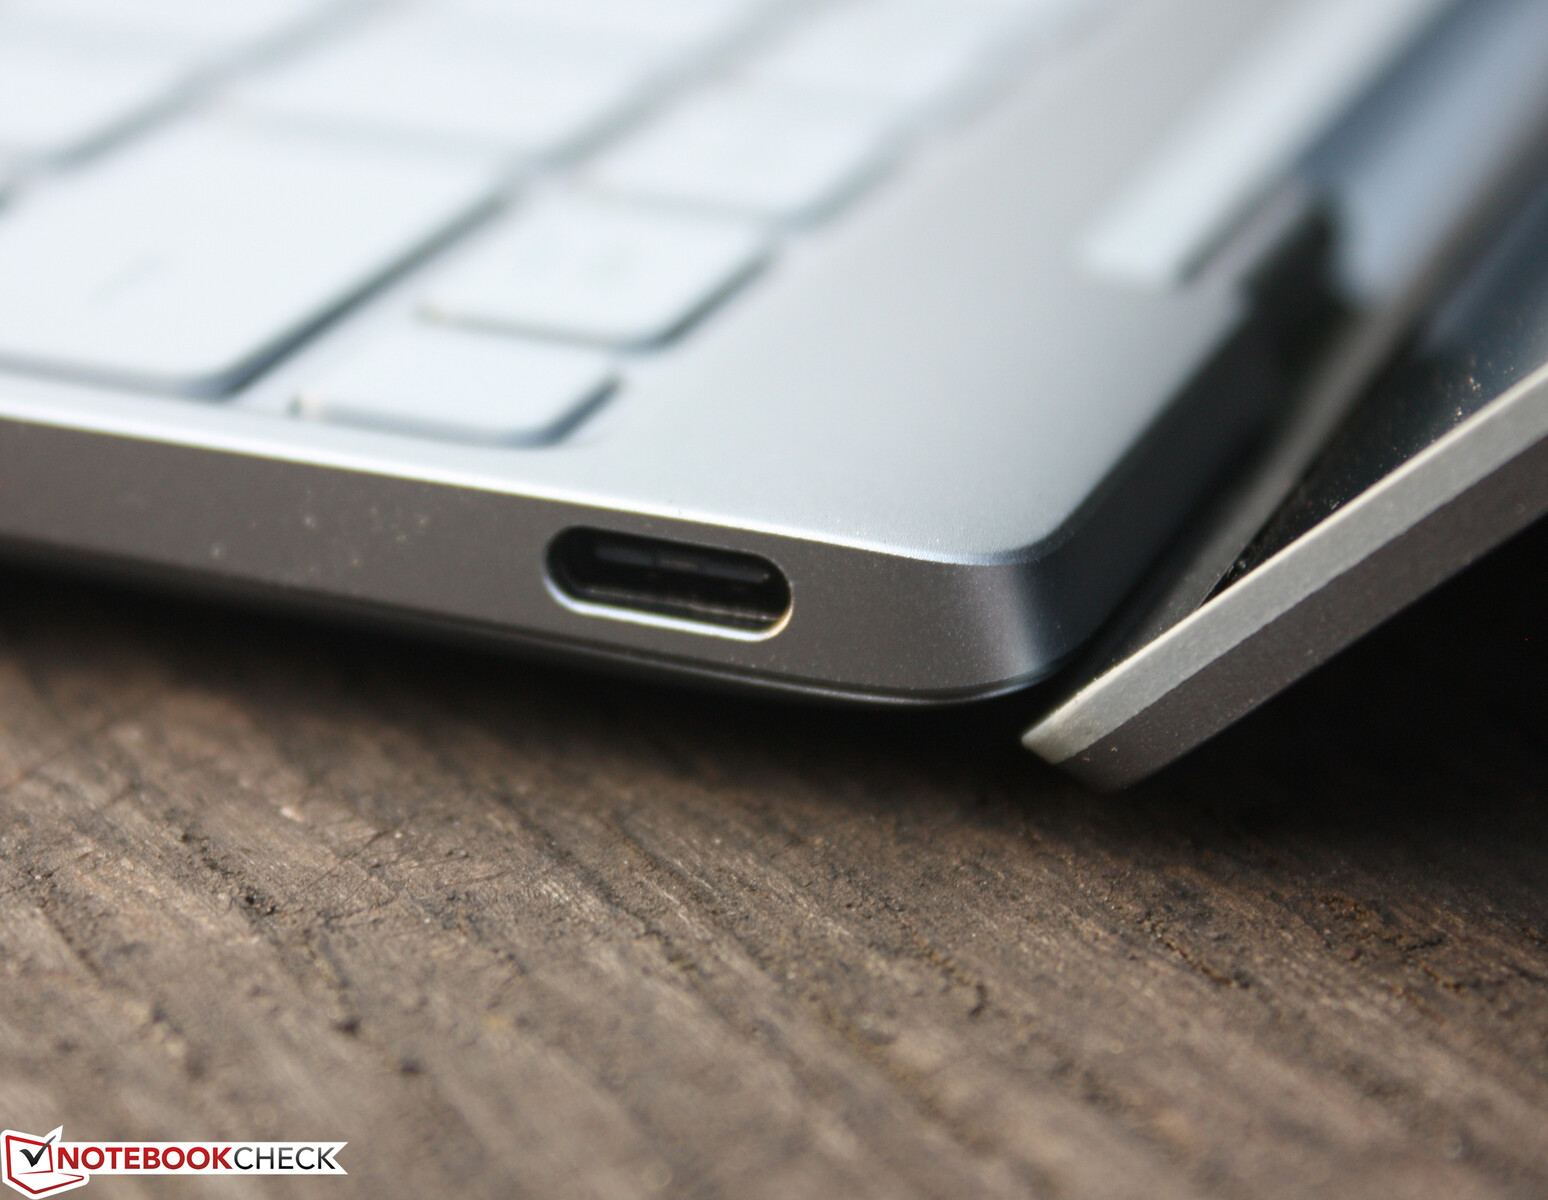
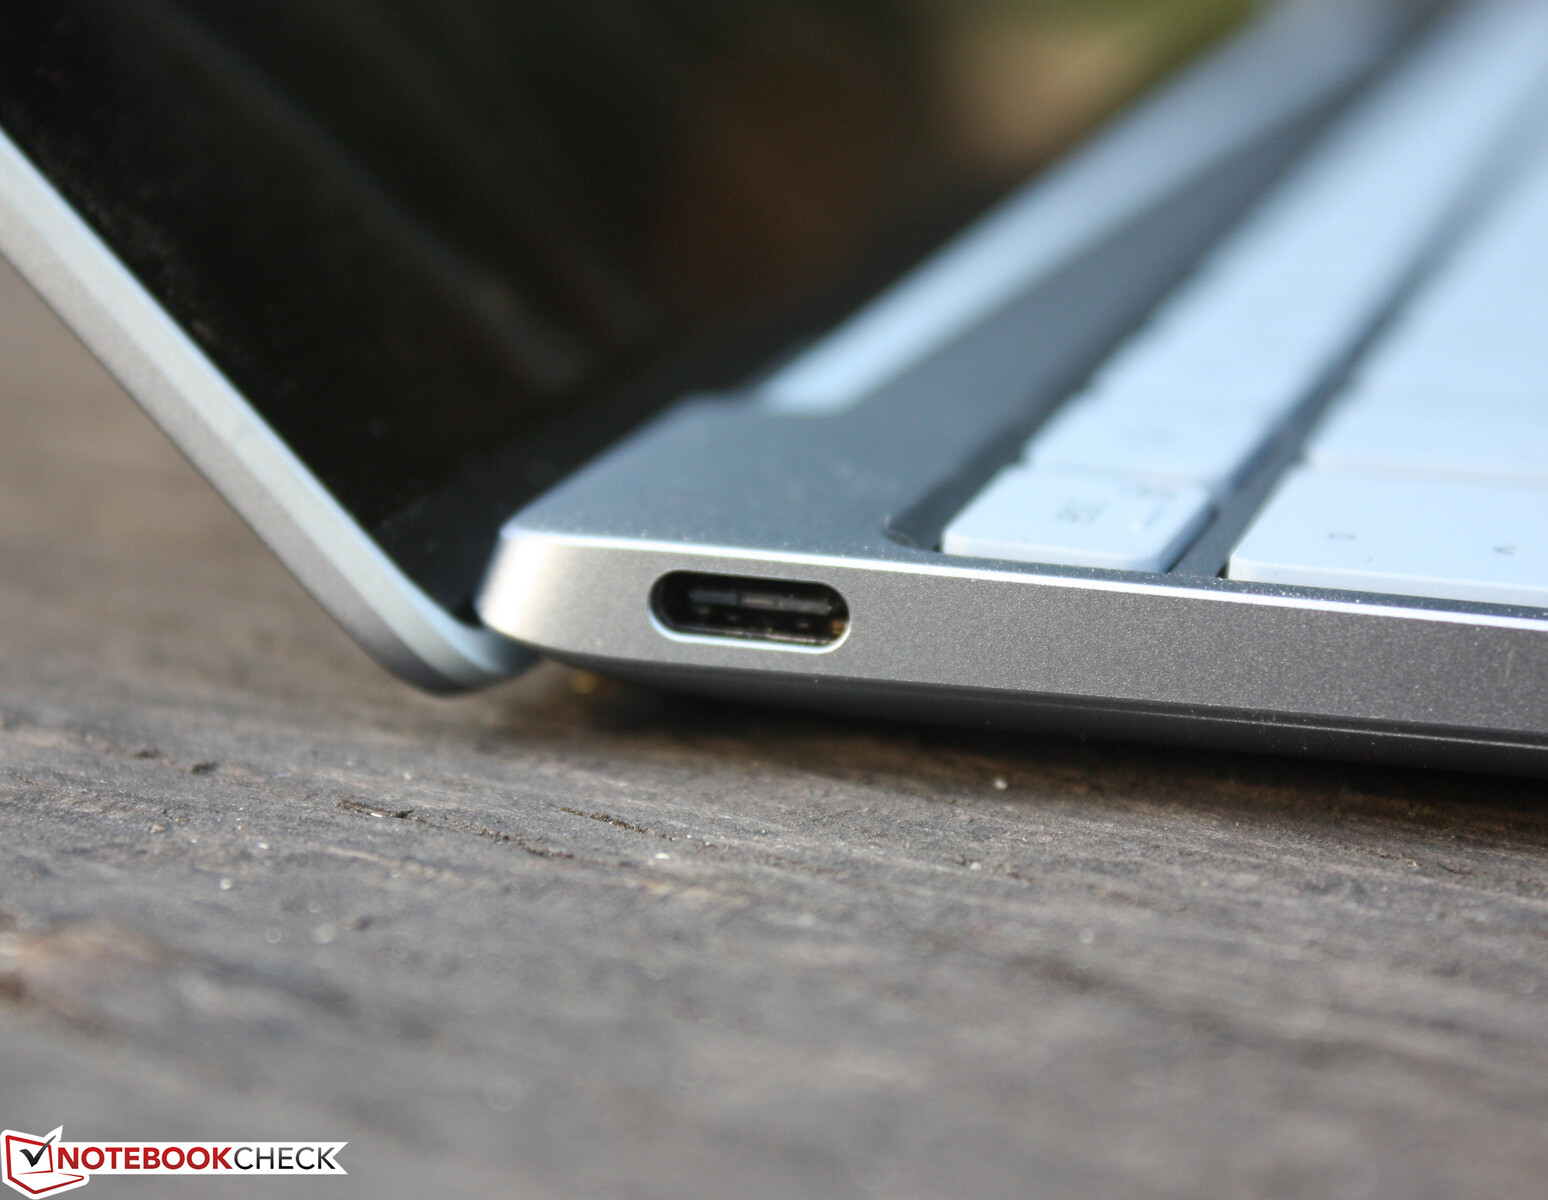
Connectivity - Dell Laptop with Just Two Ports
In order to not leave users scratching their heads when trying to connect 3.5mm headphones or a USB type-A mouse, Dell includes two adapters: A tiny type-C-to-type-A converter and a type-C-to-3.5mm dongle for heaphones and headsets. The type-C Thunderbolt ports double as the charging ports via Power Delivery. As per usual, they are also capable of outputting a DisplayPort signal with audio. The card reader of the 2021 XPS is no longer included. The wallet-sized 45-watt AC adapter is used to power the XPS.
Communication
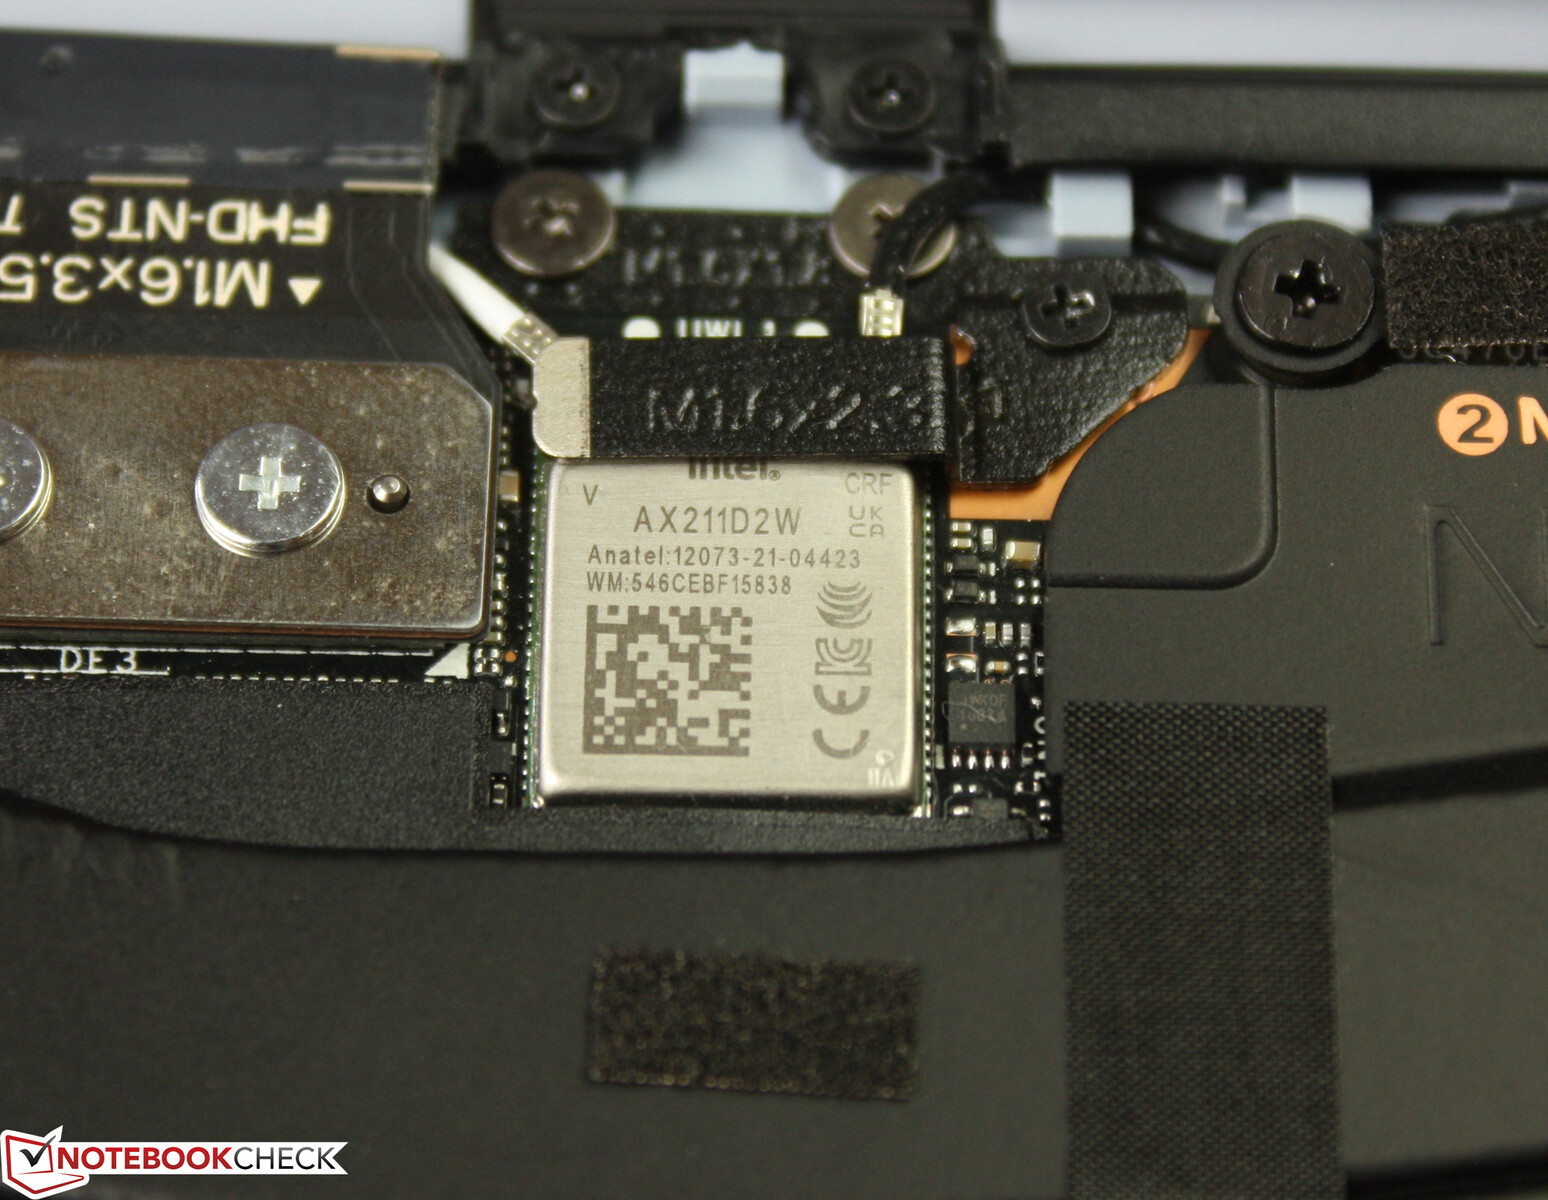
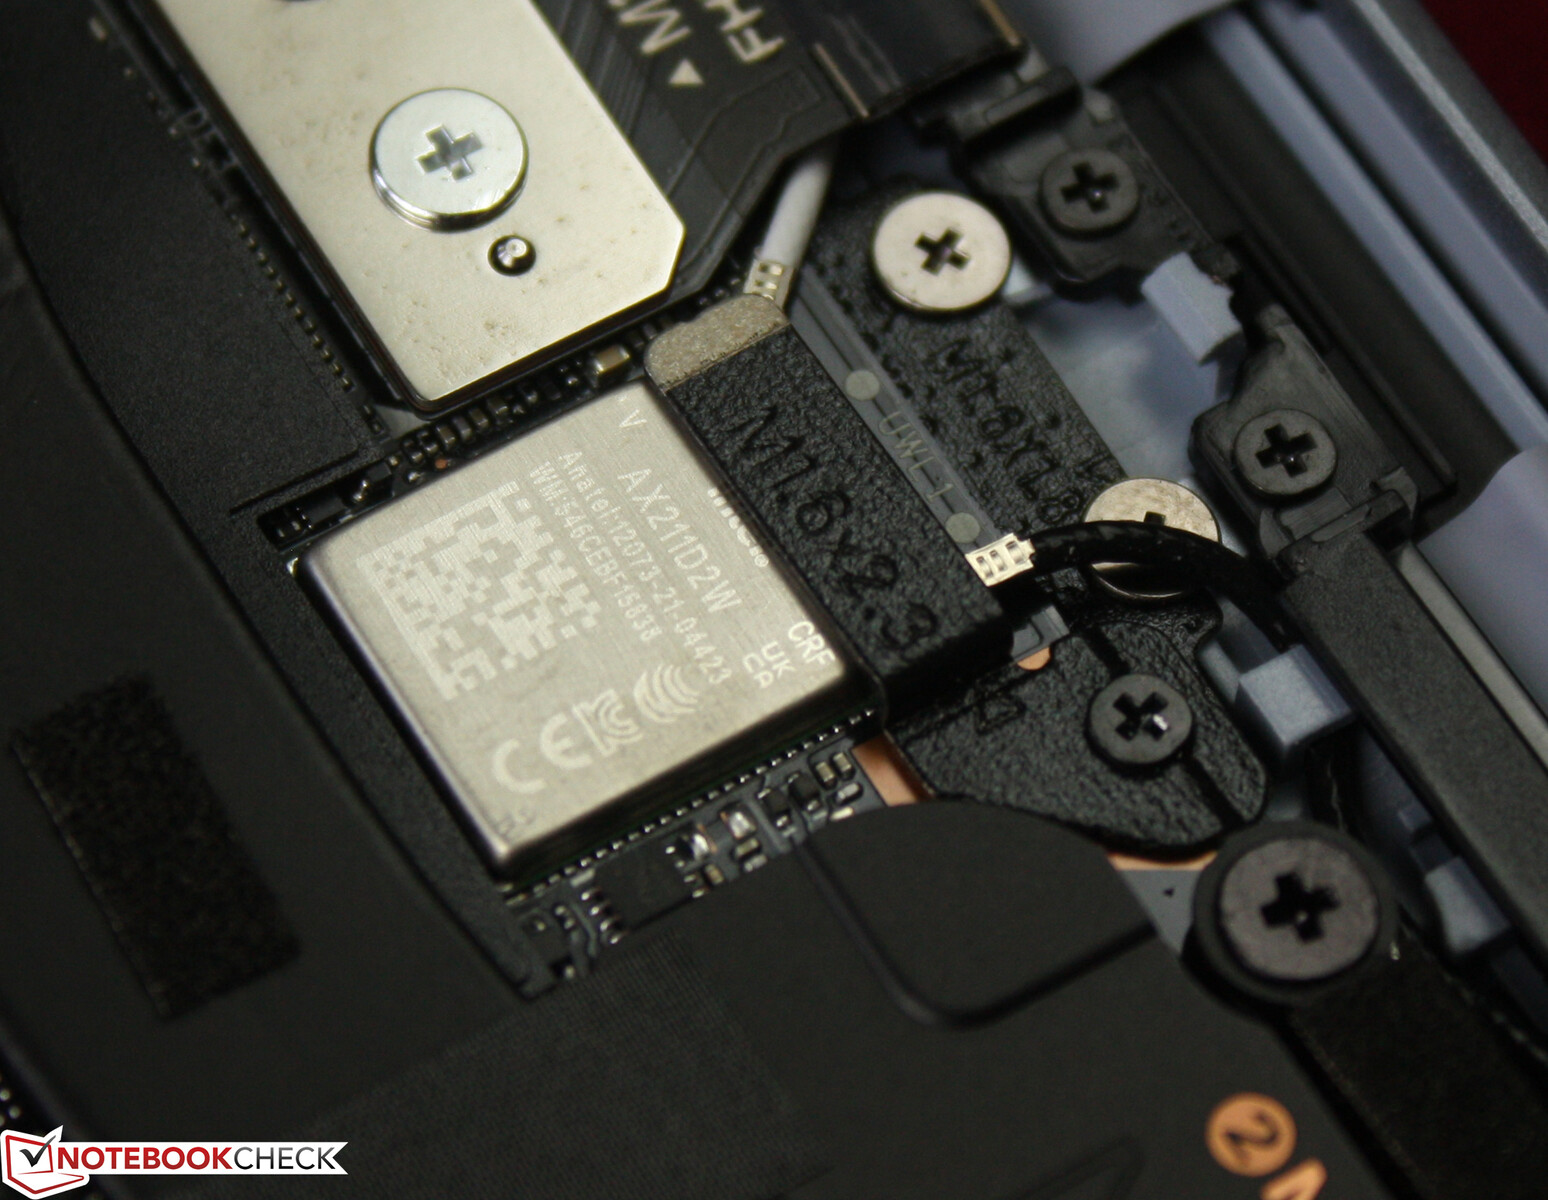
Dell equips the latest XPS 13 with a modern Intel AX211E module for Wi-Fi 6E connectivity. The Wi-Fi performance within our Wi-Fi 6E network is excellent and consistent. In a test with our Asus reference router, we did not encounter any Wi-Fi connectivity issues and data transfer rates were stable. Bluetooth 5.2 is also supported.
Webcam
The webcam neither comes with a mechanical nor an electric shutter via the Fn key. The microphone does have its own hotkey. At least, a white LED next to the cam clearly shows when it is recording. The resolution of 1280 x 720 pixels is nothing to write home about - low resolution and significant image noise even during daylight.


Security
There are two authentication methods on the XPS 13: There is a fingerprint sensor inside the power button and a dual-sensor camera with infrared capabilities. This allows users to select facial recognition from the Windows settings. If desired, the laptop can log out automatically when the current user is away. When returning from lunch, Windows Hello automatically logs back in.
Accessories
The package includes a USB-C-to-USB-A adapter, an audio dongle for 3.5mm devices, and a 45-watt AC adapter with a fixed type-C cable. The type-C cable of the 65-watt AC adapter of the Plus model is modular.
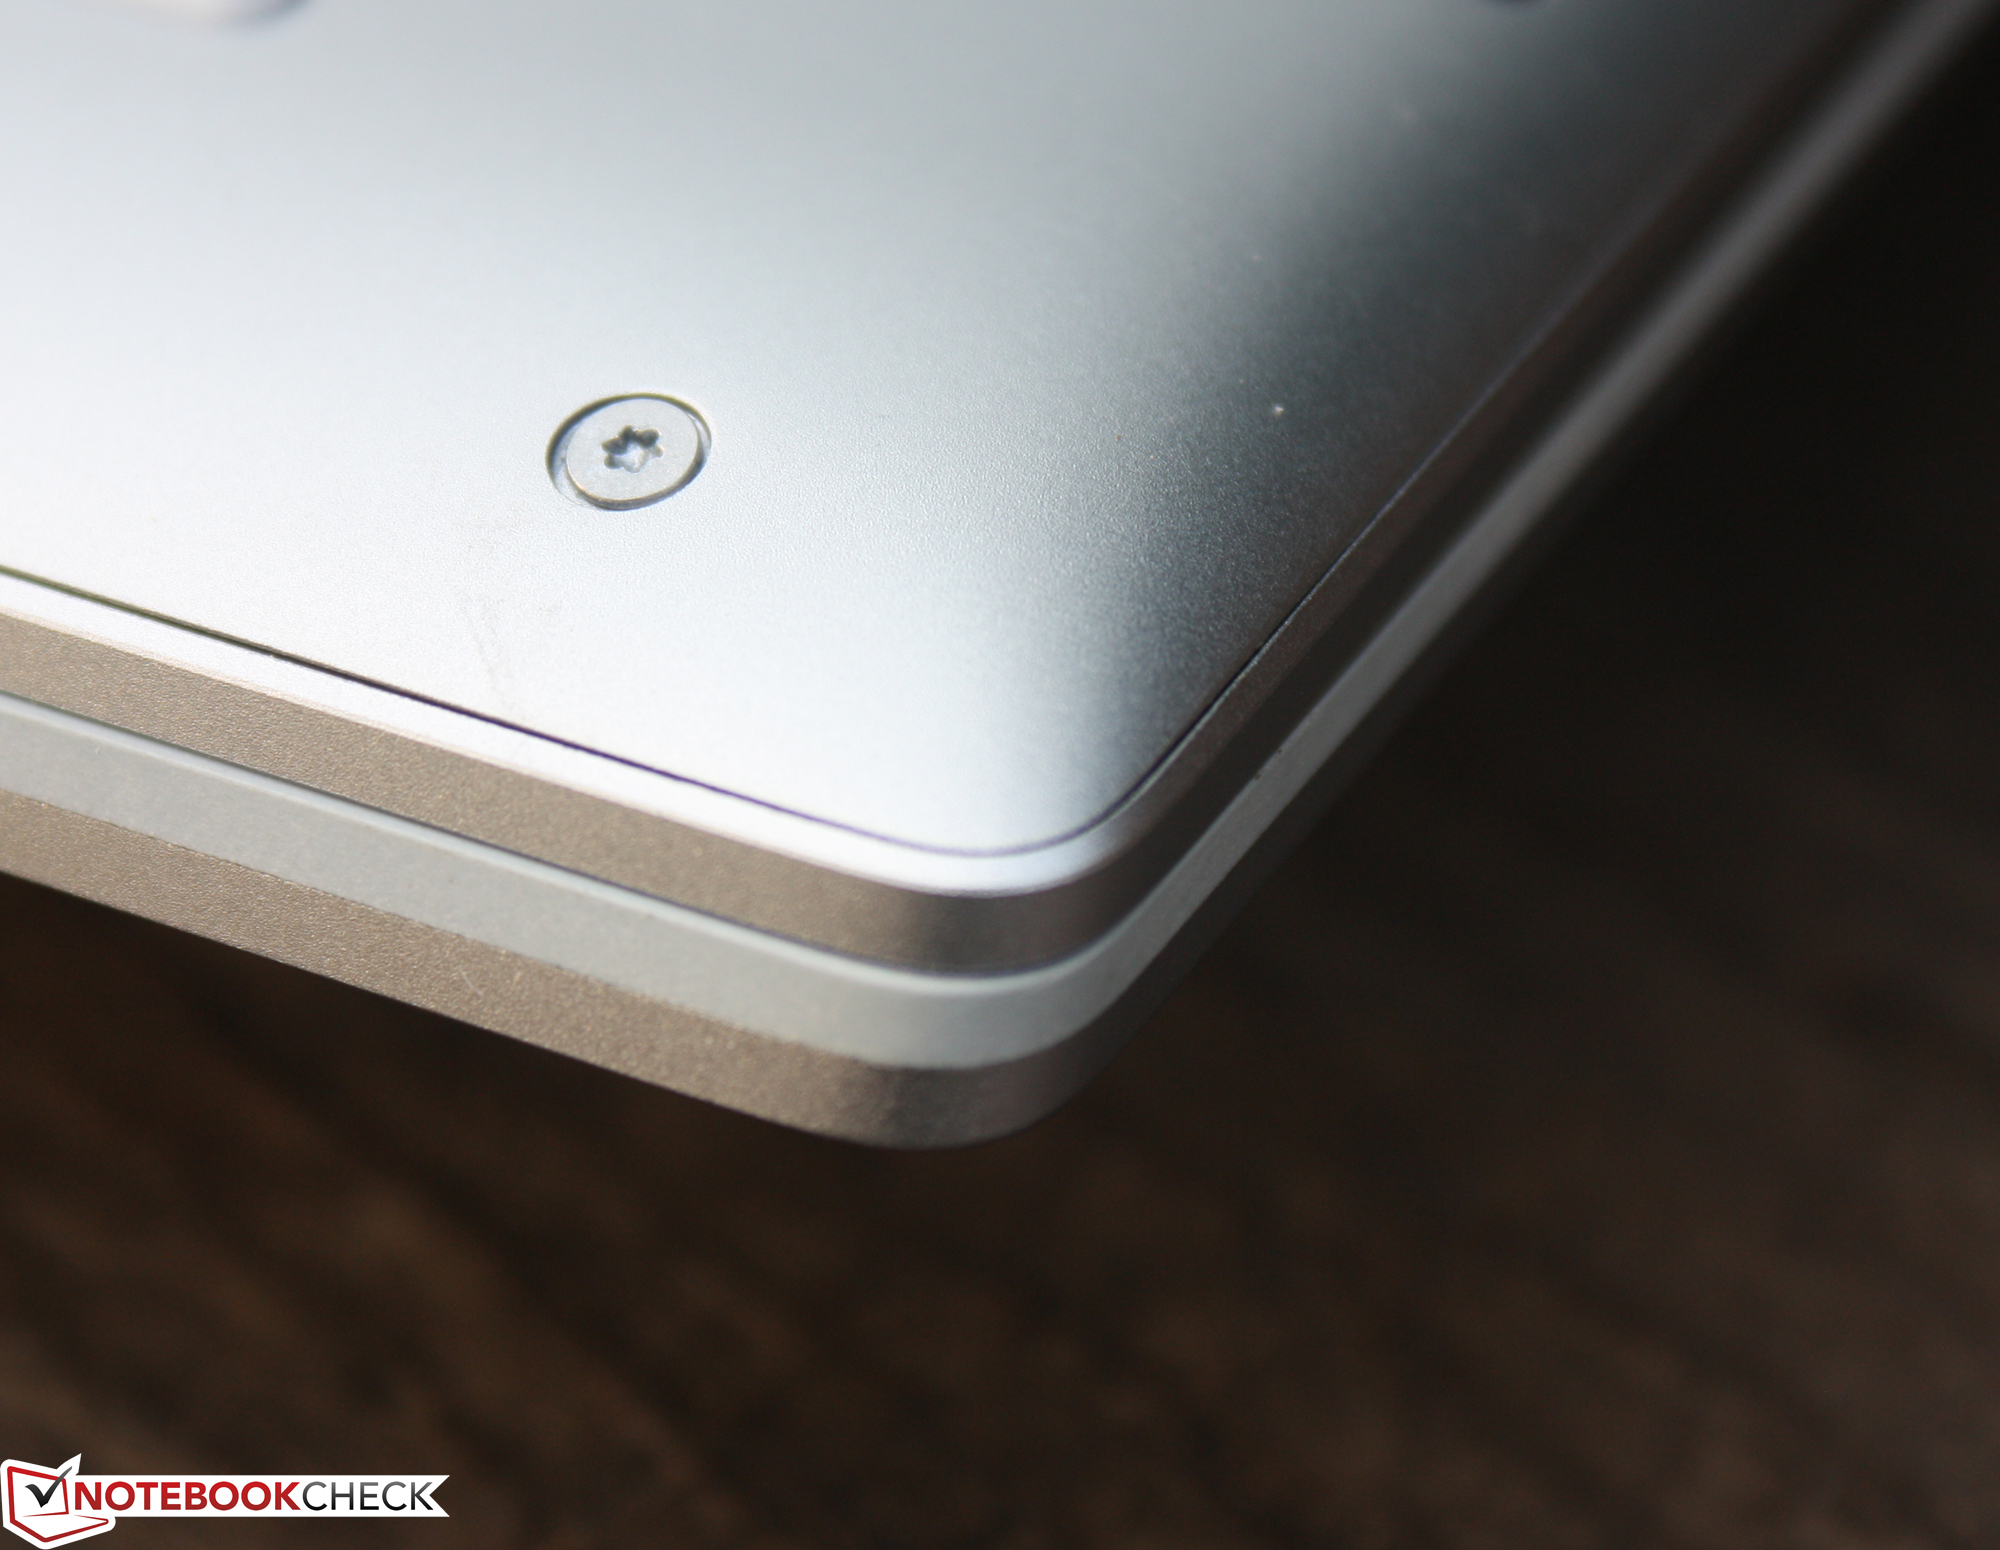
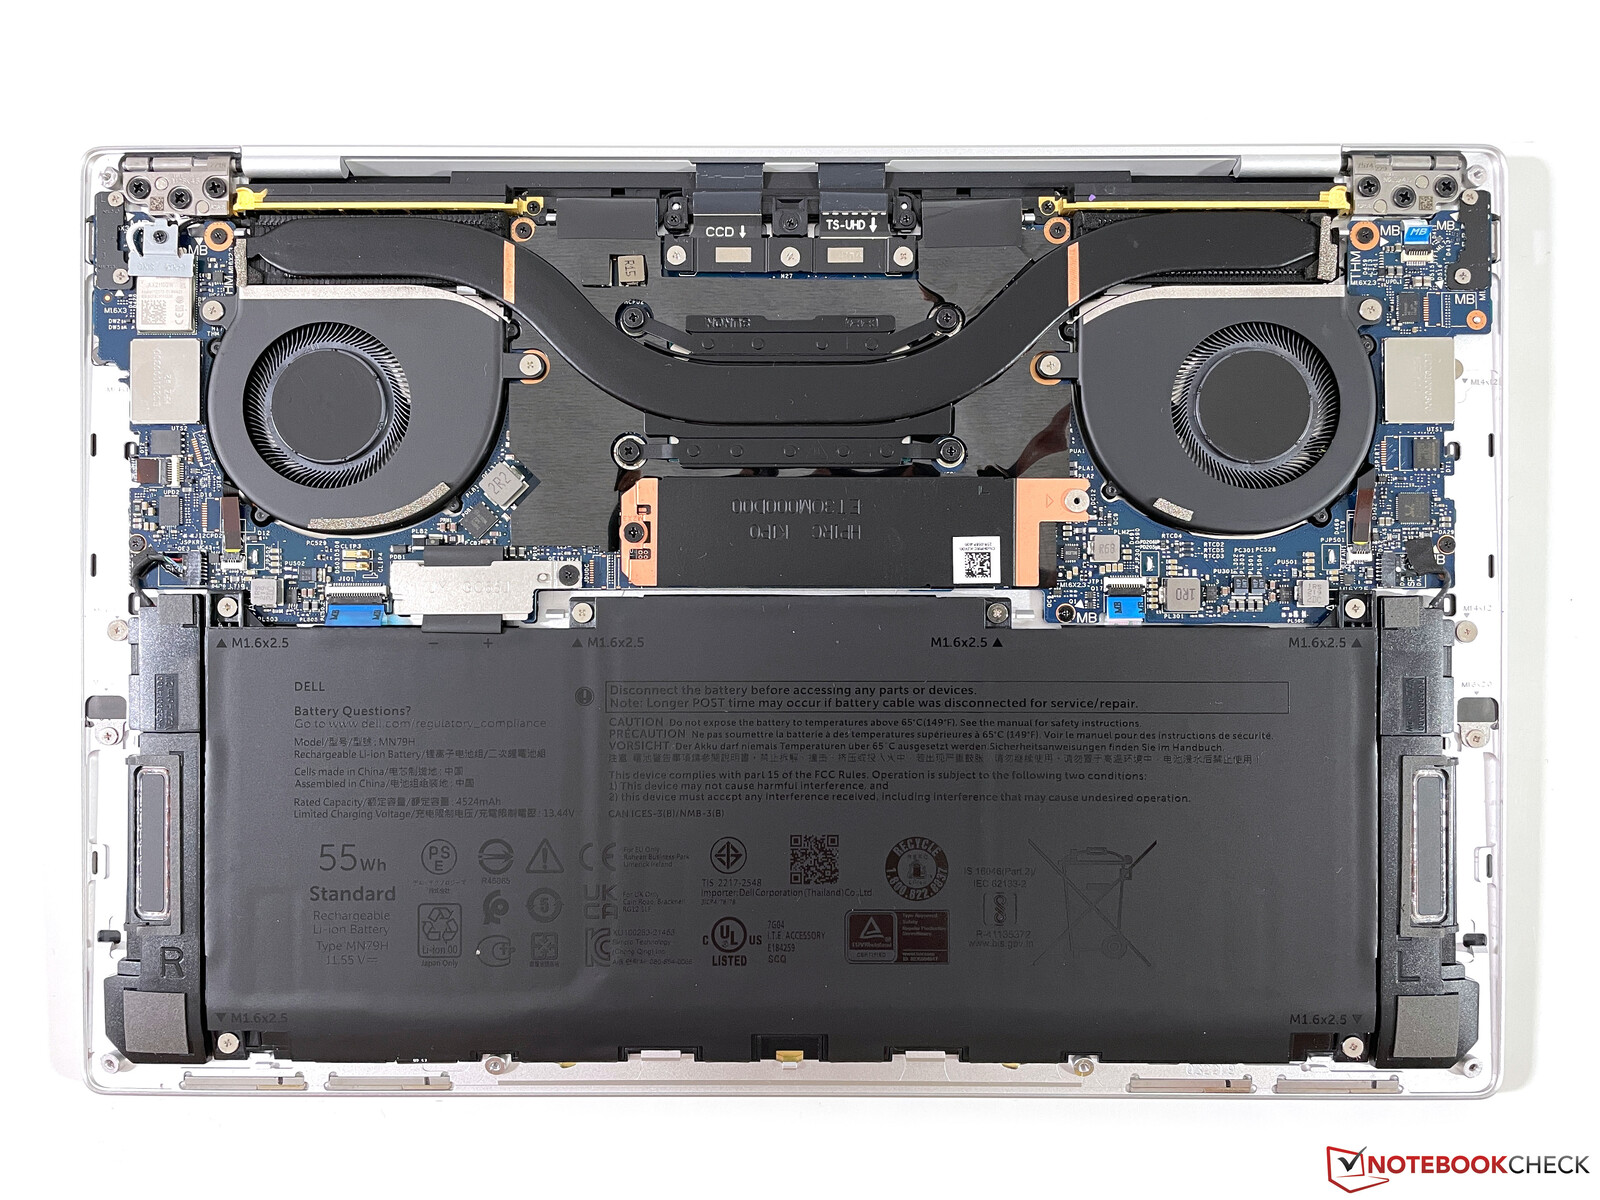
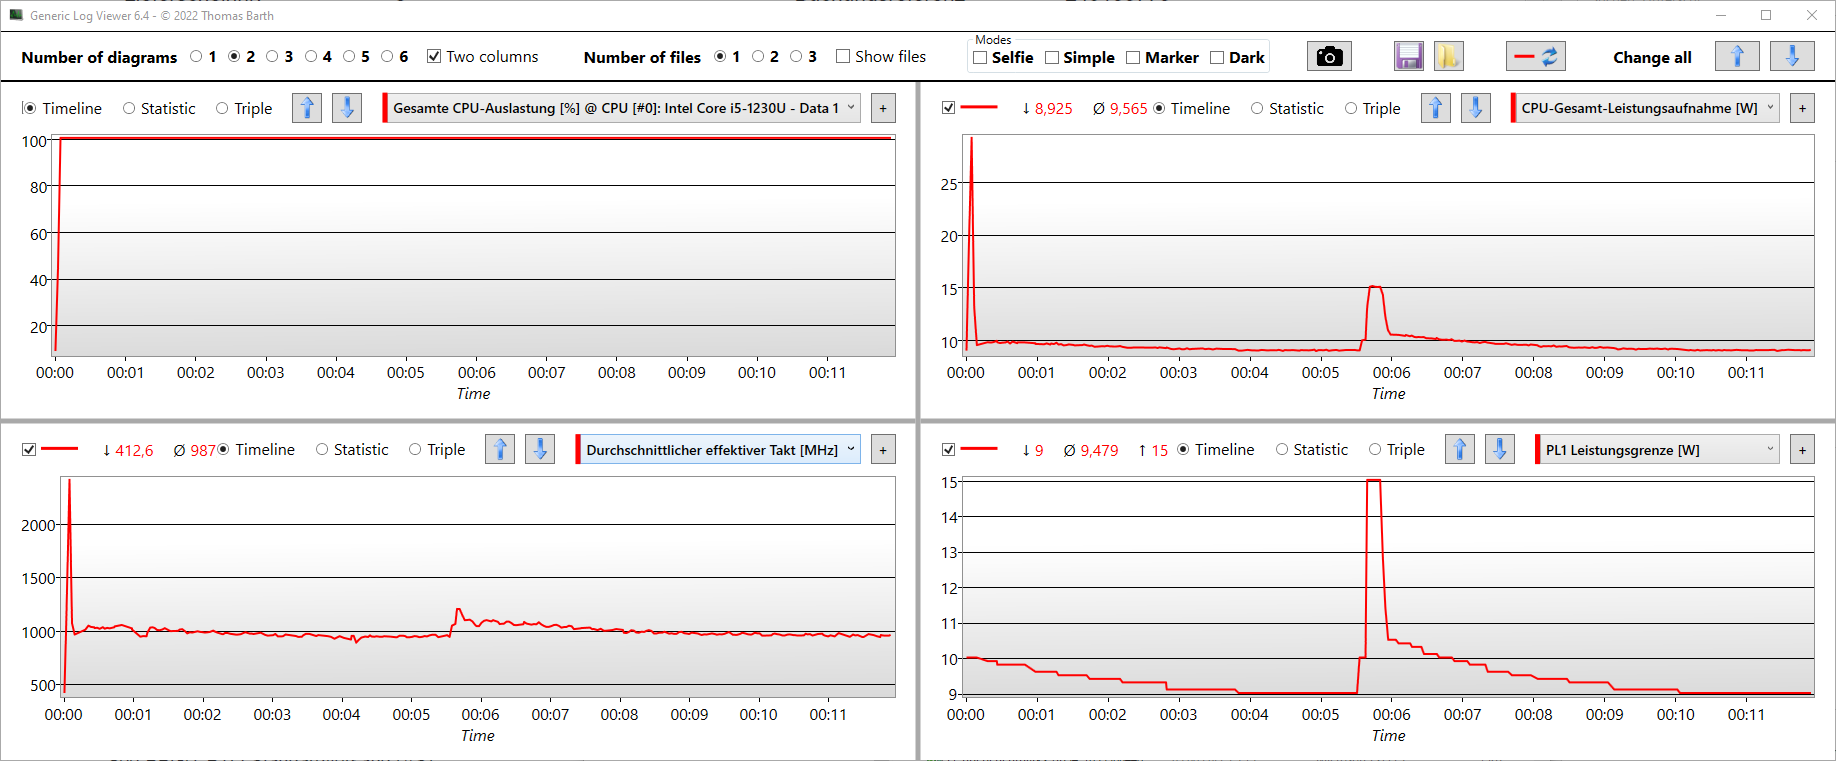
Maintenance
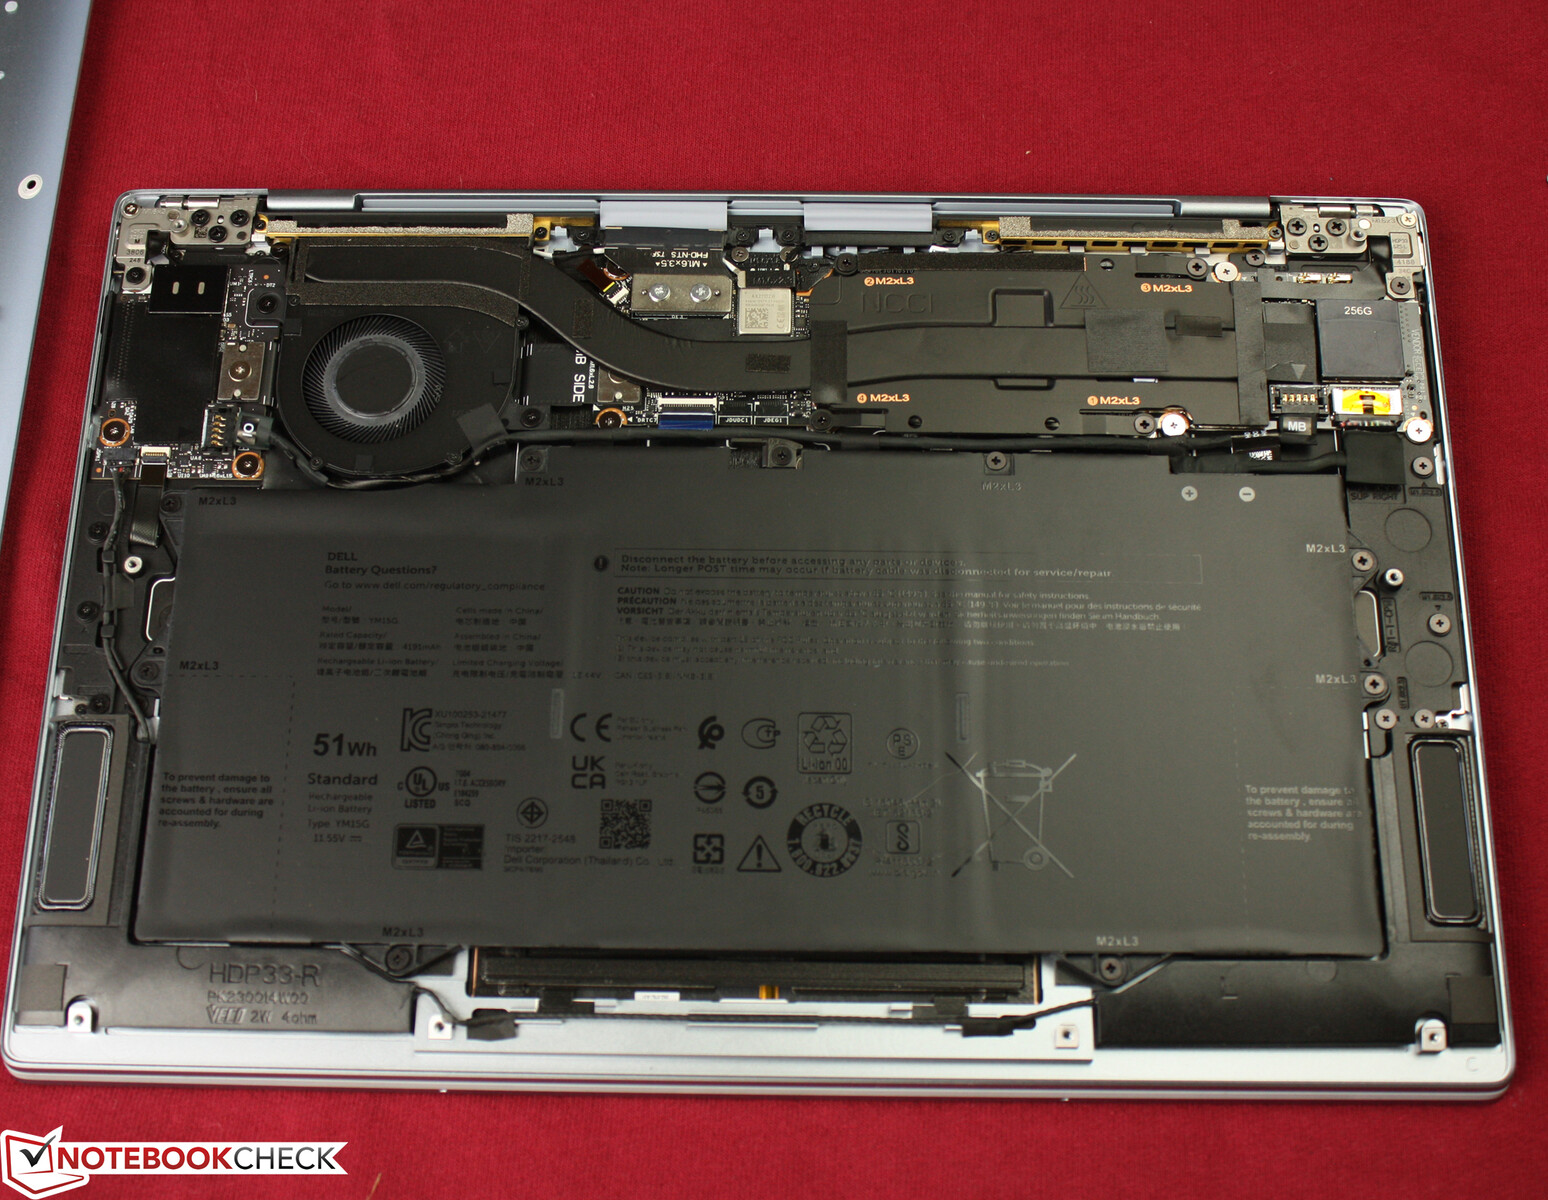
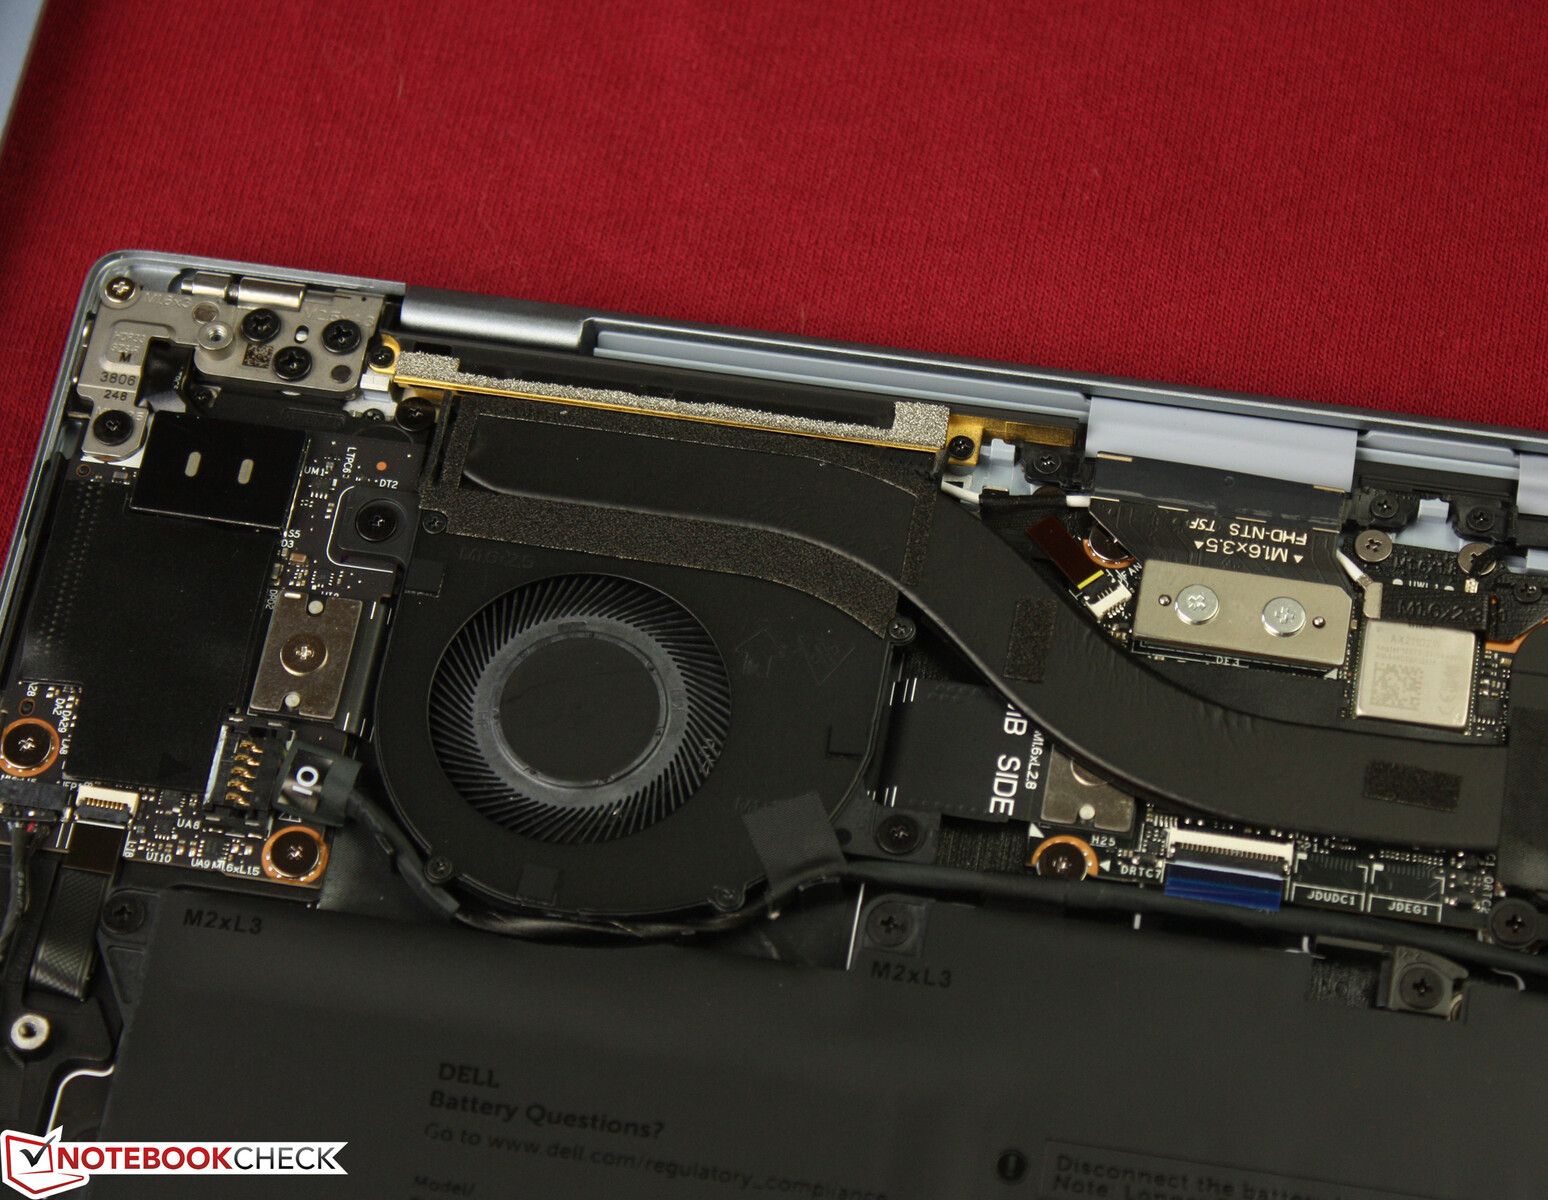
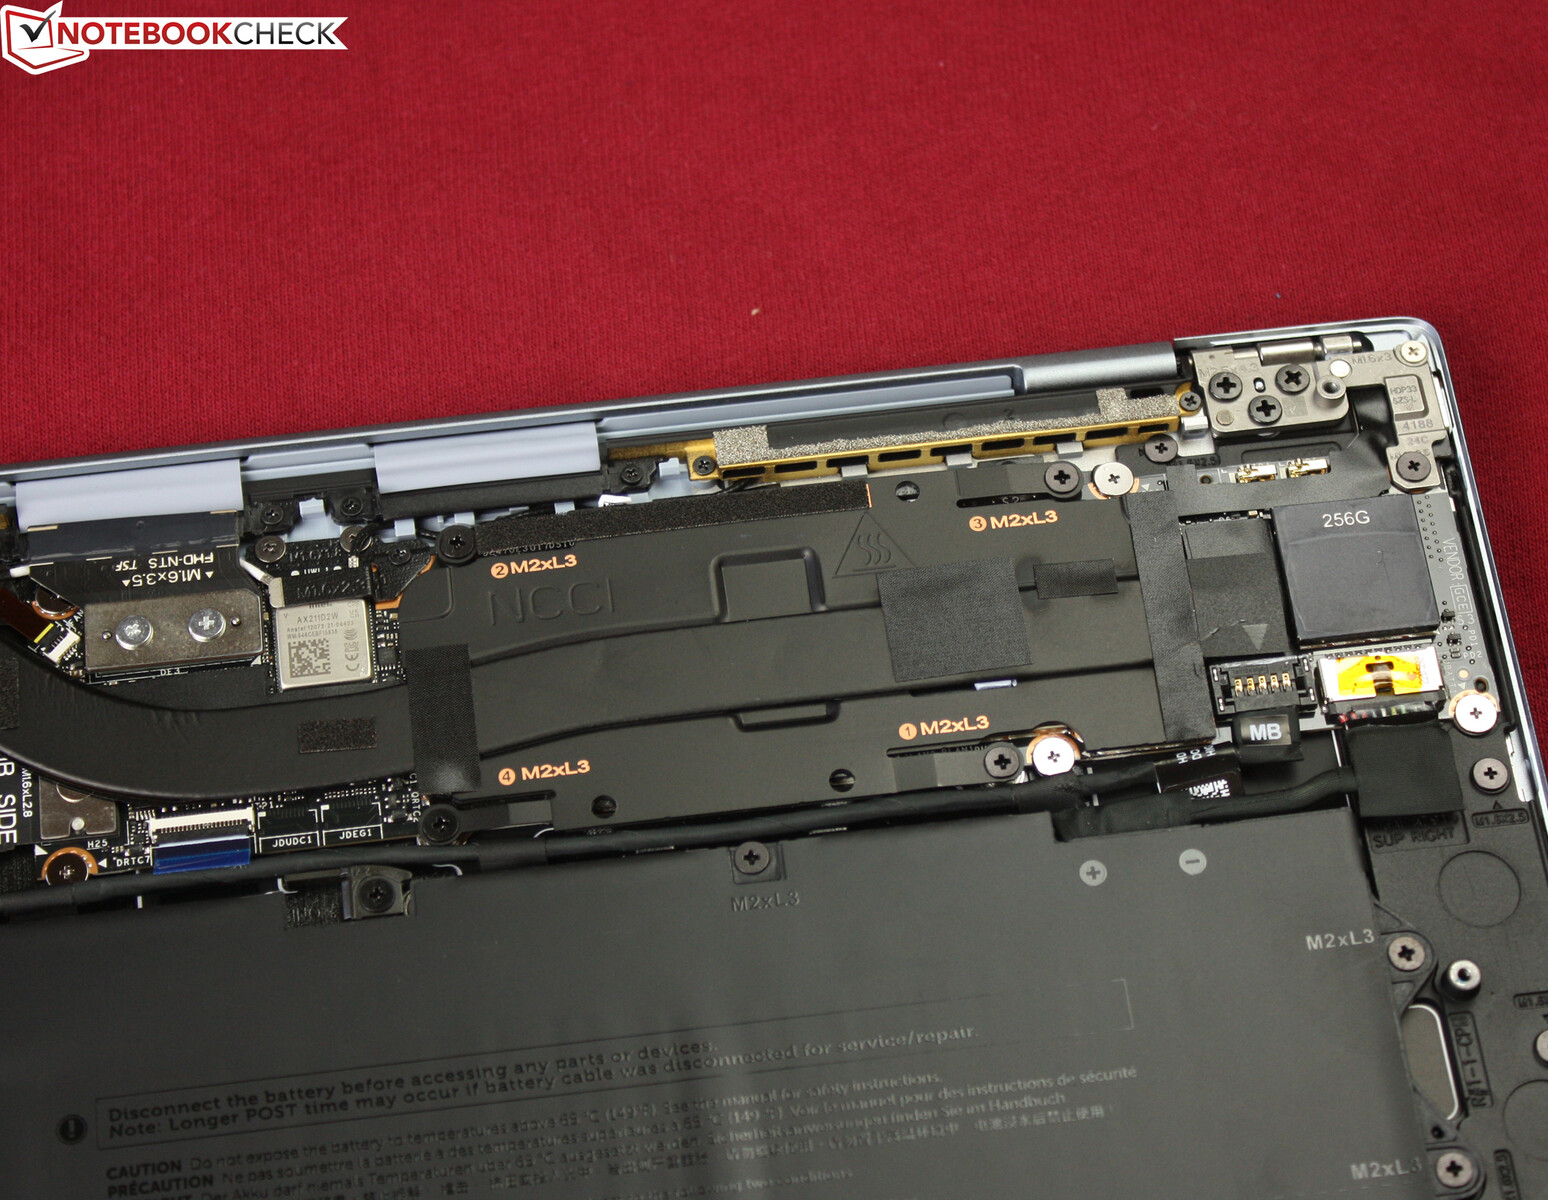
The bottom plate is secured with 6 Torx screws (T5) and easy to remove. The internals look very organized and the maintenance options are limited to cleaning the fan. The Micron SSD is soldered and cannot be swapped! This is in contrast to the XPS 13 Plus, where the M.2-2280 SSD can be swapped, although the RAM and Wi-Fi modules are still fixed.
Warranty
Dell offers a standard 12-month warranty.
Input Devices - Dell Laptop with Nonslip Typing
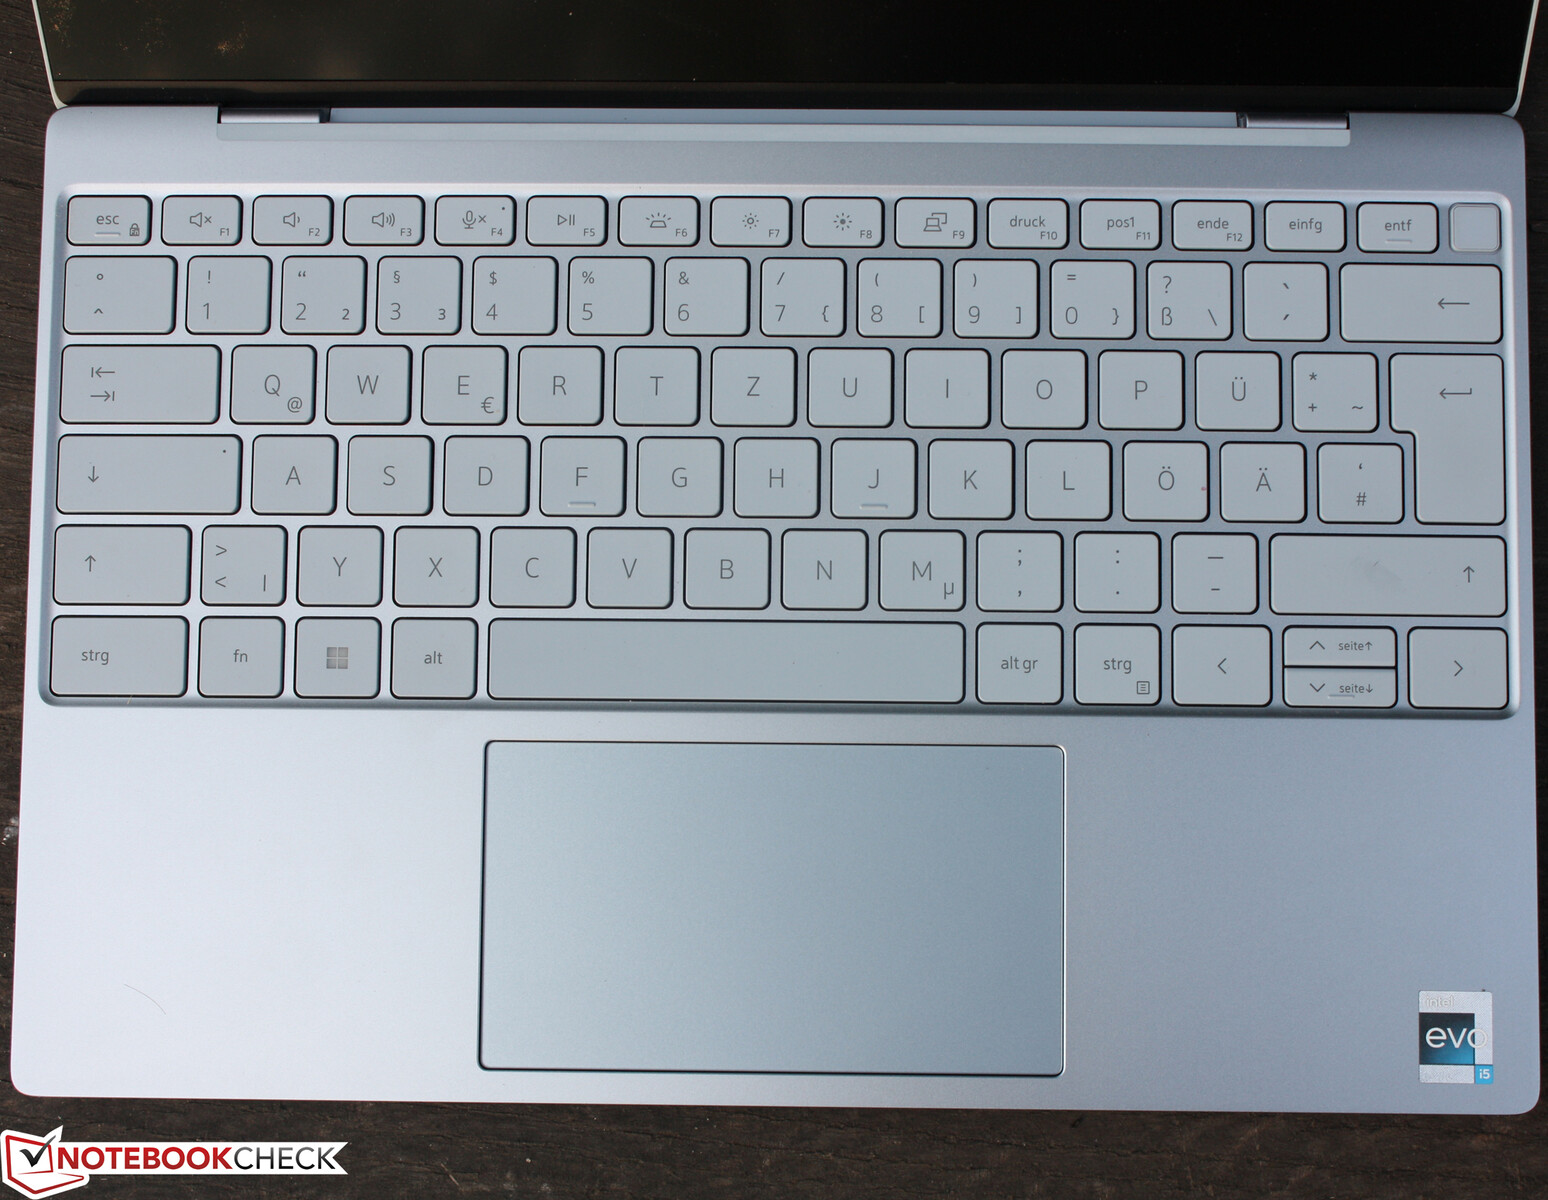
Keyboard
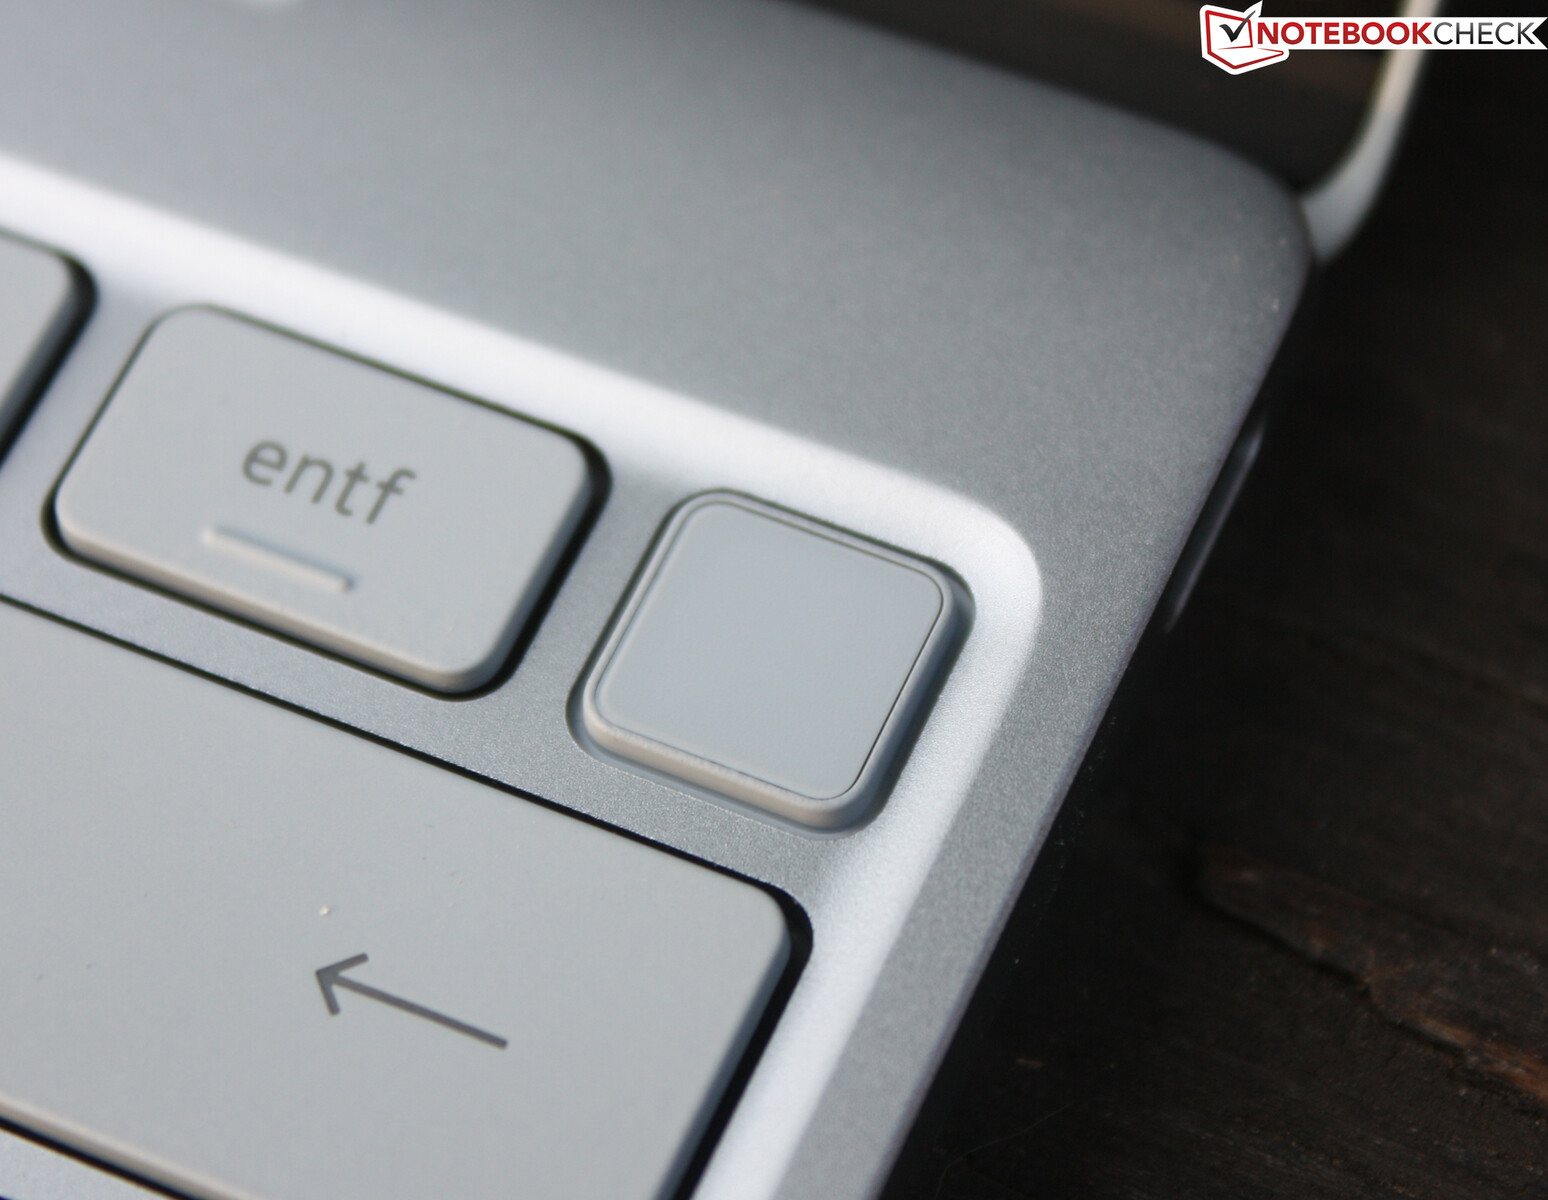
Compared to the 2021 XPS 13, the keyboard remains unchanged both in terms of the feedback and the layout. It stretches itself across the entire width of the base unit and while the up and down arrow keys are very small, there are haptic markings on them. The secondary layer of the F keys can be used for the usual purposes. It can be switched to permanently via Esc+Fn, which is convenient if you are not using the F1-F12 keys anyway. The keys offer a firm feedback that borders on being too firm. The actuation point is distinct. It may feel somewhat feeble, which partially stems from the shallow travel. The roughened nonslip rubber dome keys make for a fast, precise, and pleasant typing experience. The generous amount of space between the keys is also a plus in this regard. The keys are flat and not as glossy as the keys of other laptop keyboards due to their almost rubberized texture.
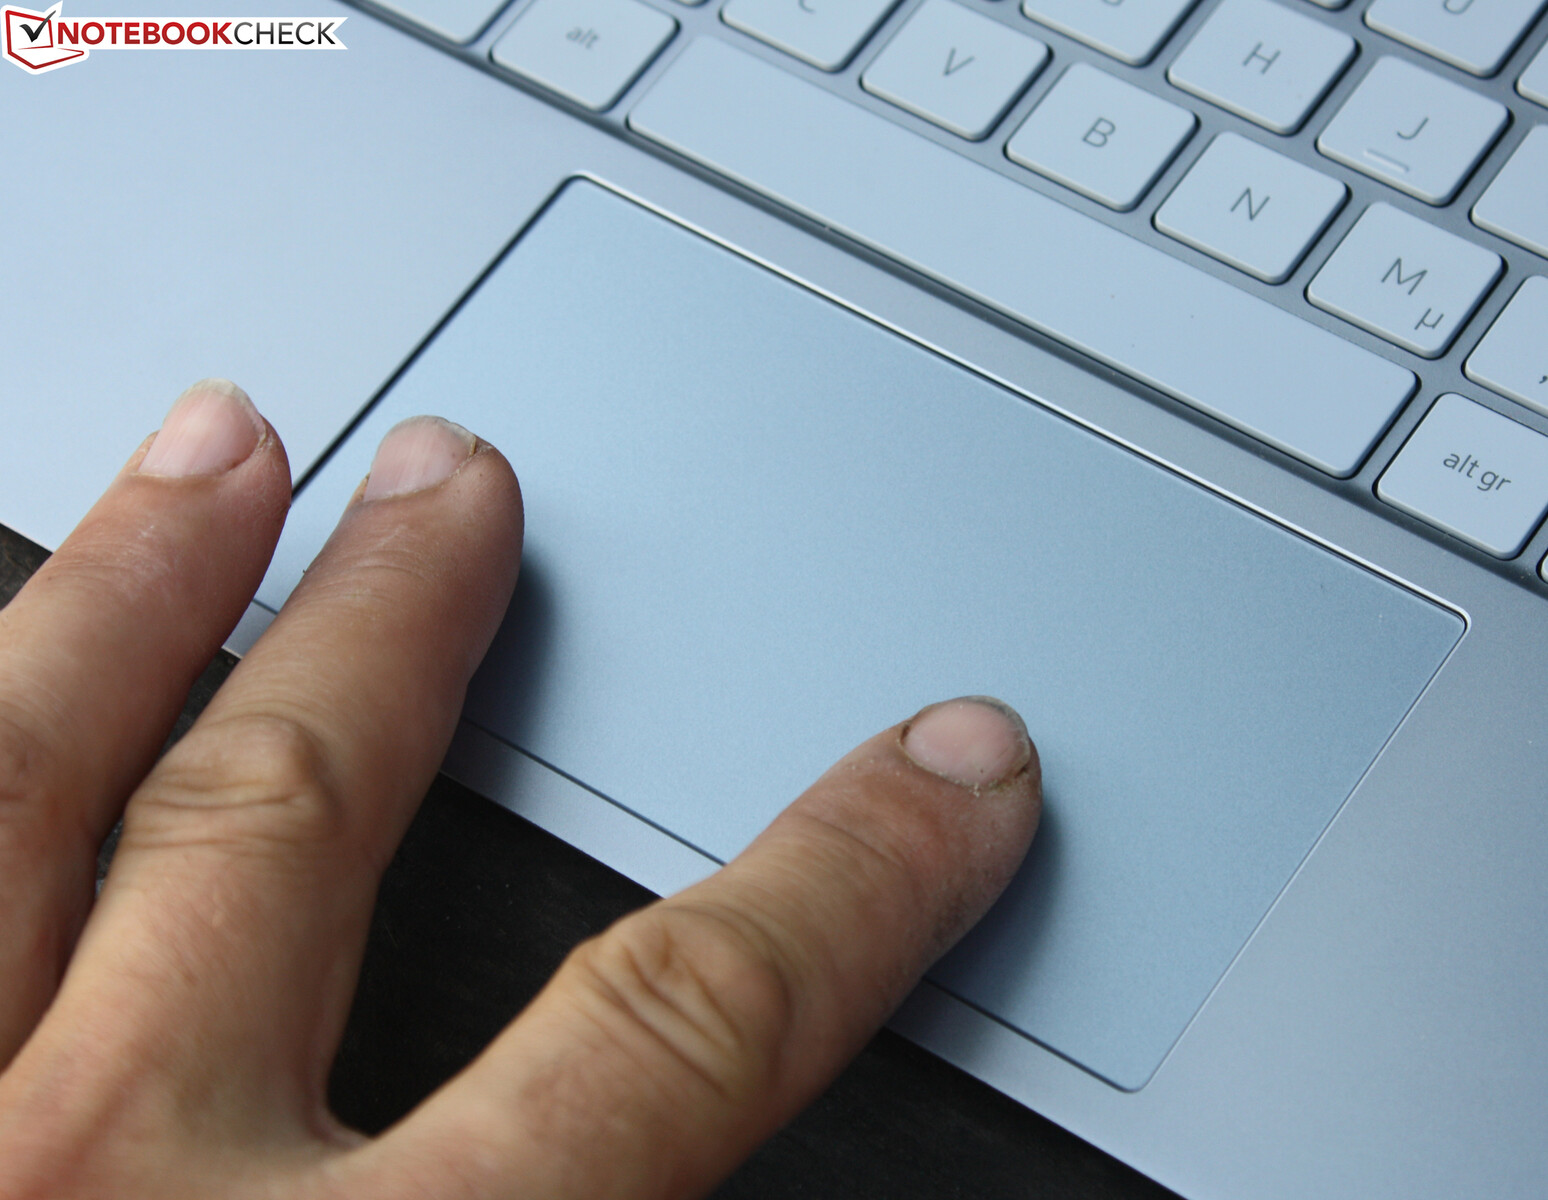
Touchpad
The smooth clickpad produces dull, quiet clicks. Travel is shallow and barely noticeable in the upper third of the touchpad. The slightly recessed pad that supports the usual two-finger gesture controls allows for a fast workflow. Although it is fairly large at 12.7 cm (5 in) diagonally, this is no longer rare nowadays. The clickpad is perfectly centered between the palm rests. There is no Fn key for disabling the mouse replacement. Thankfully, this has become almost unnecessary anyway, since the pad reliably recognizes palms resting on it and prevents accidental inputs.
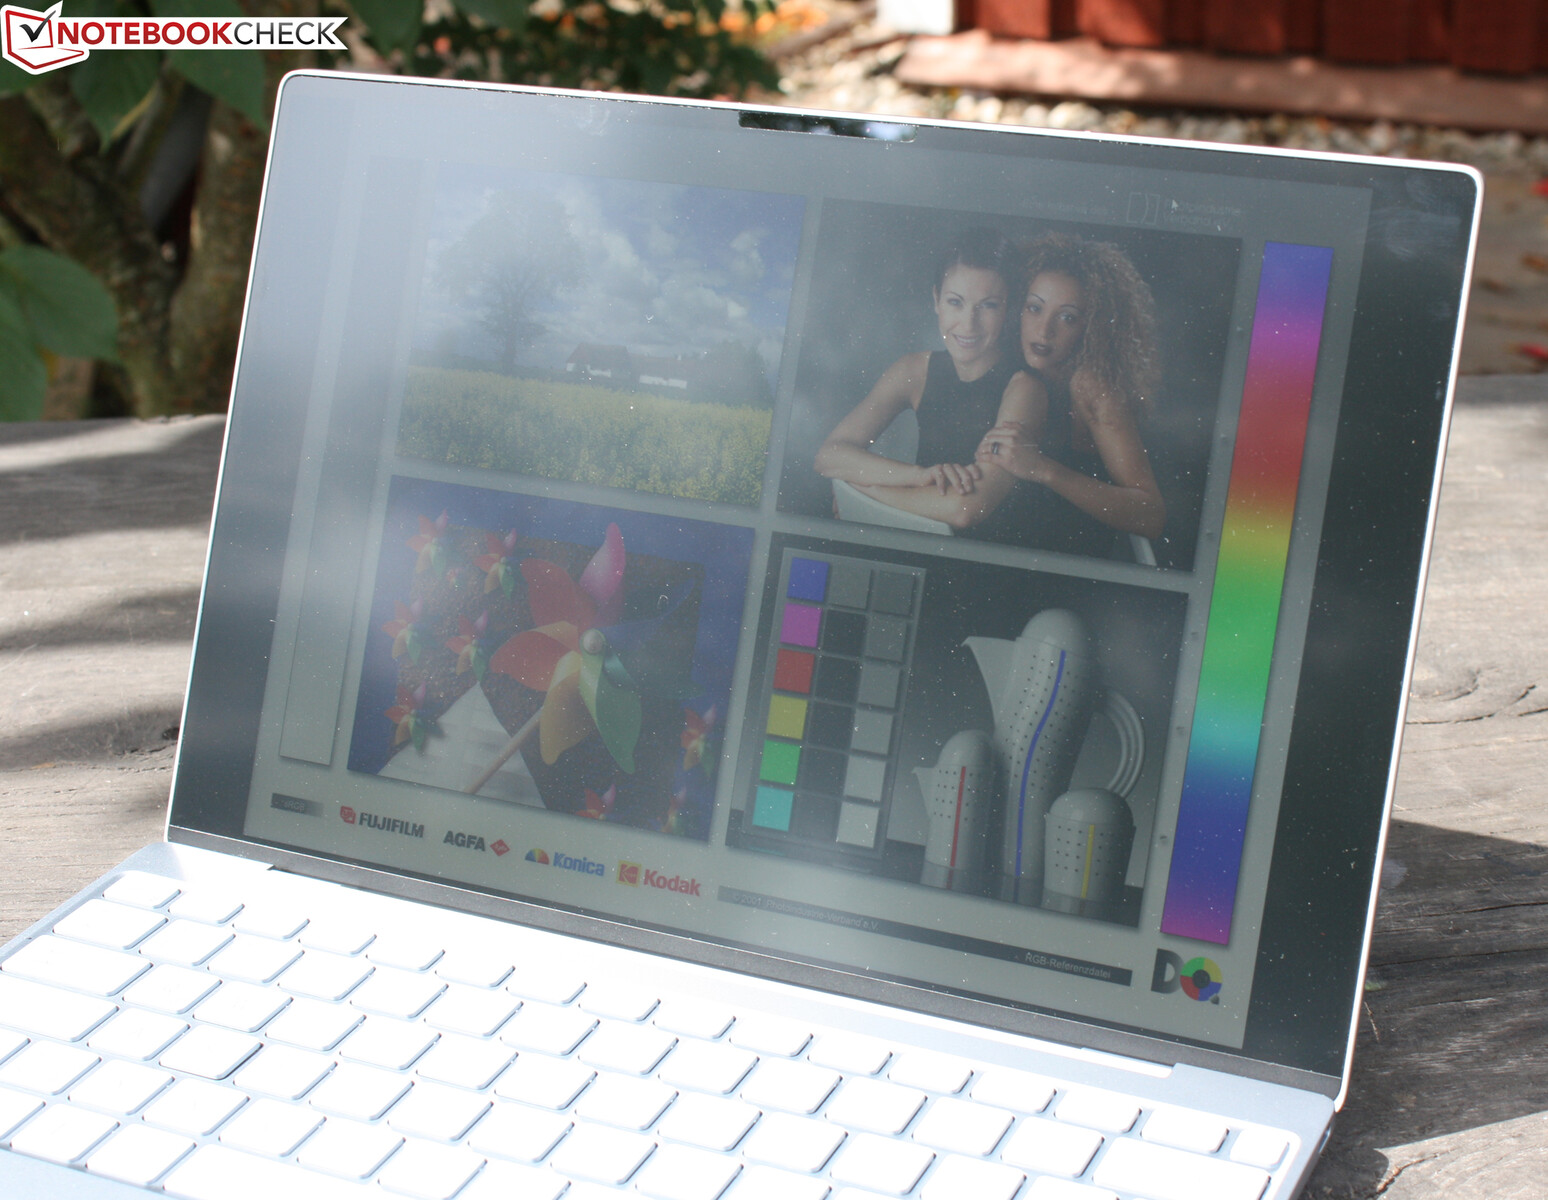
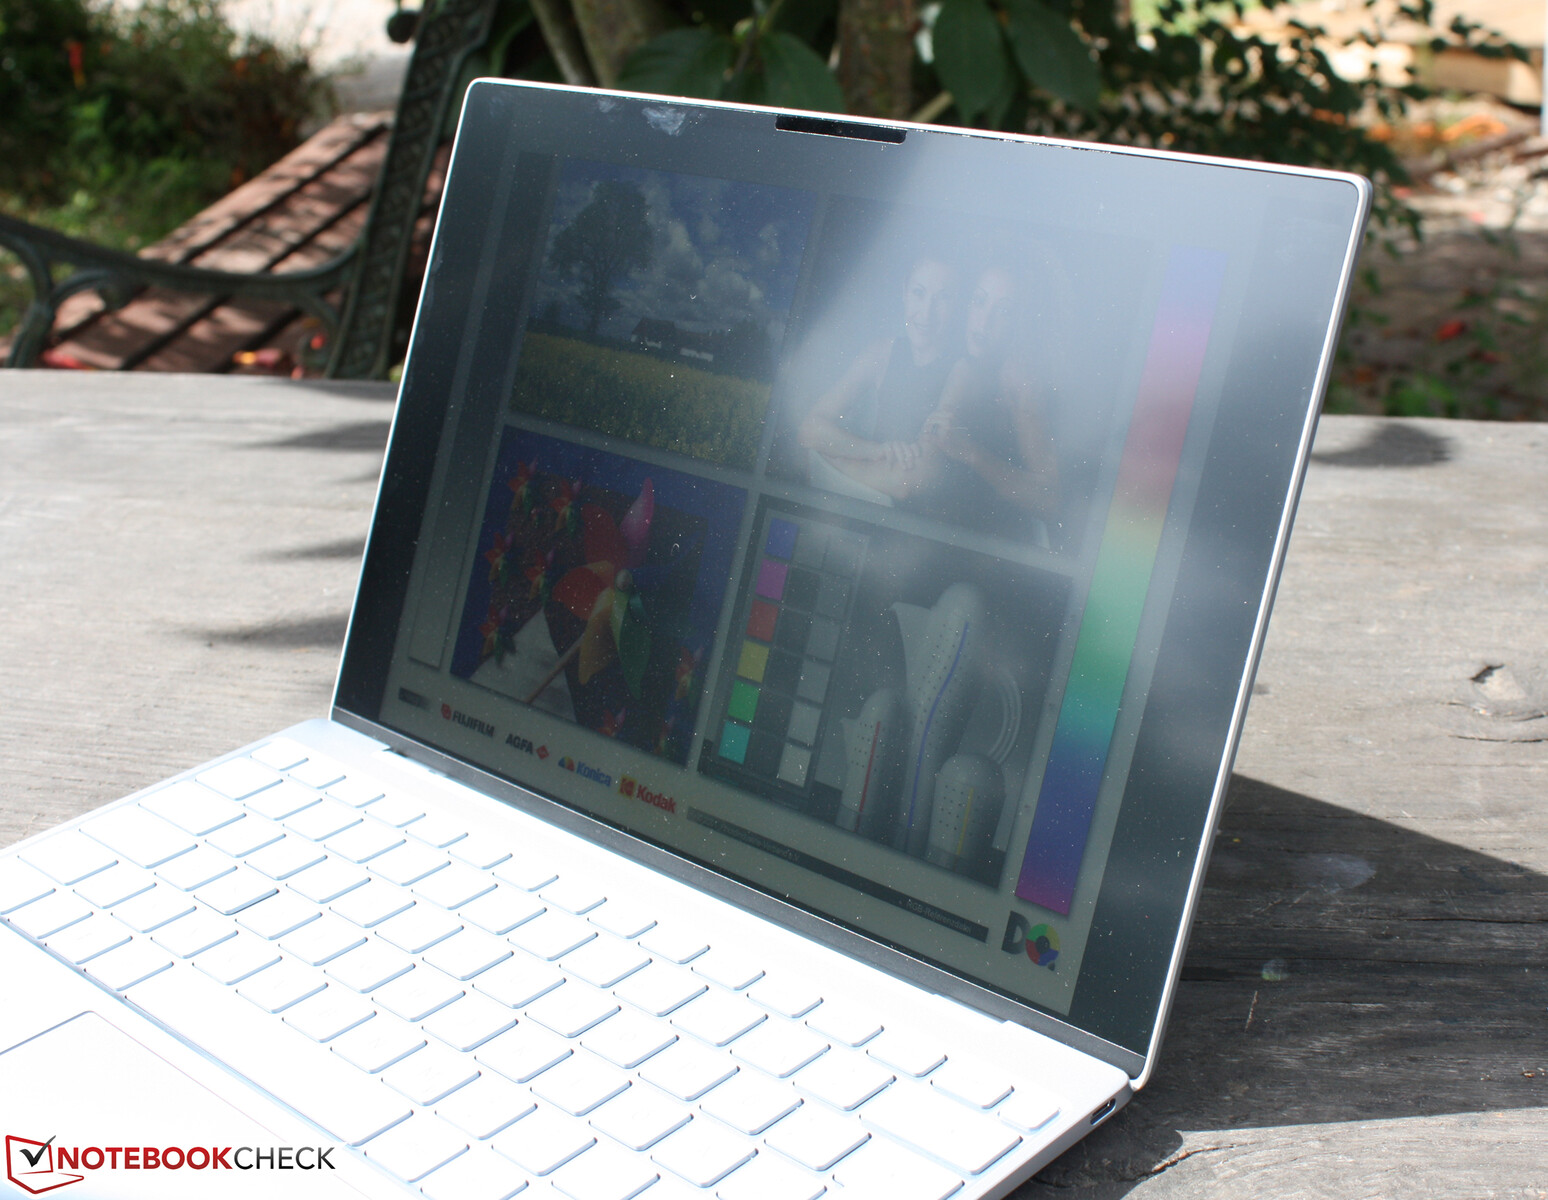
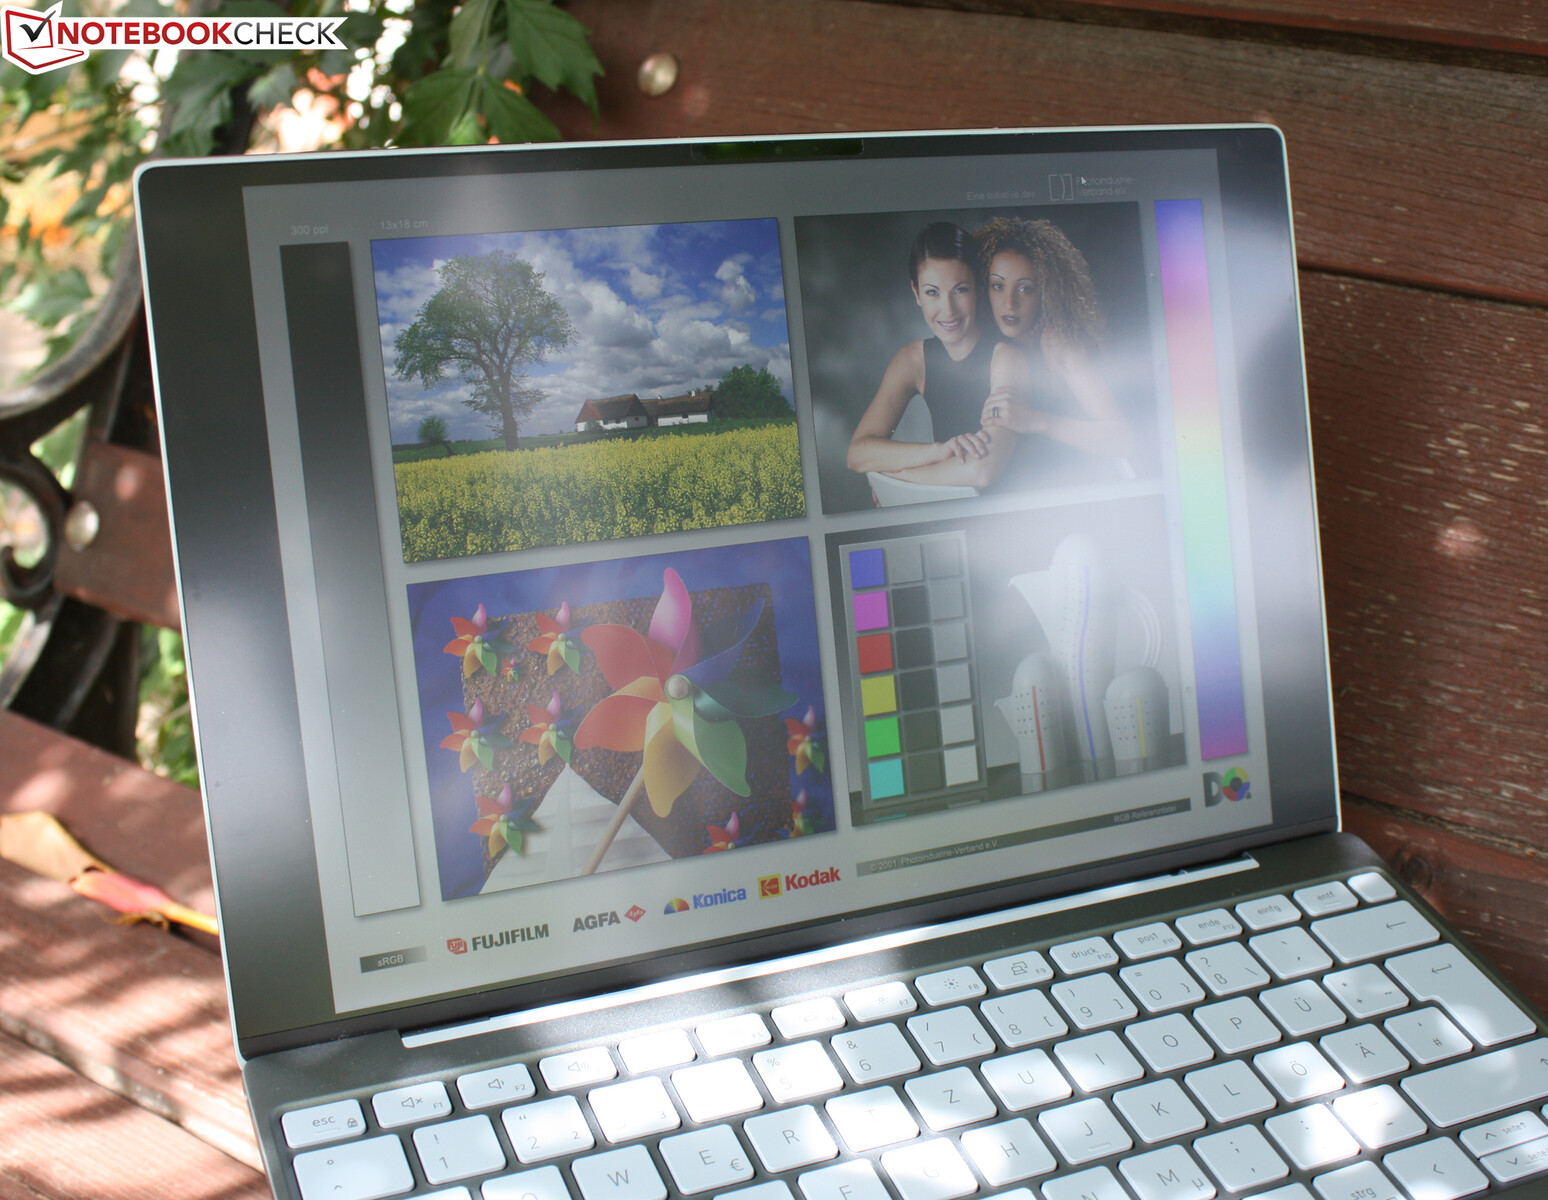
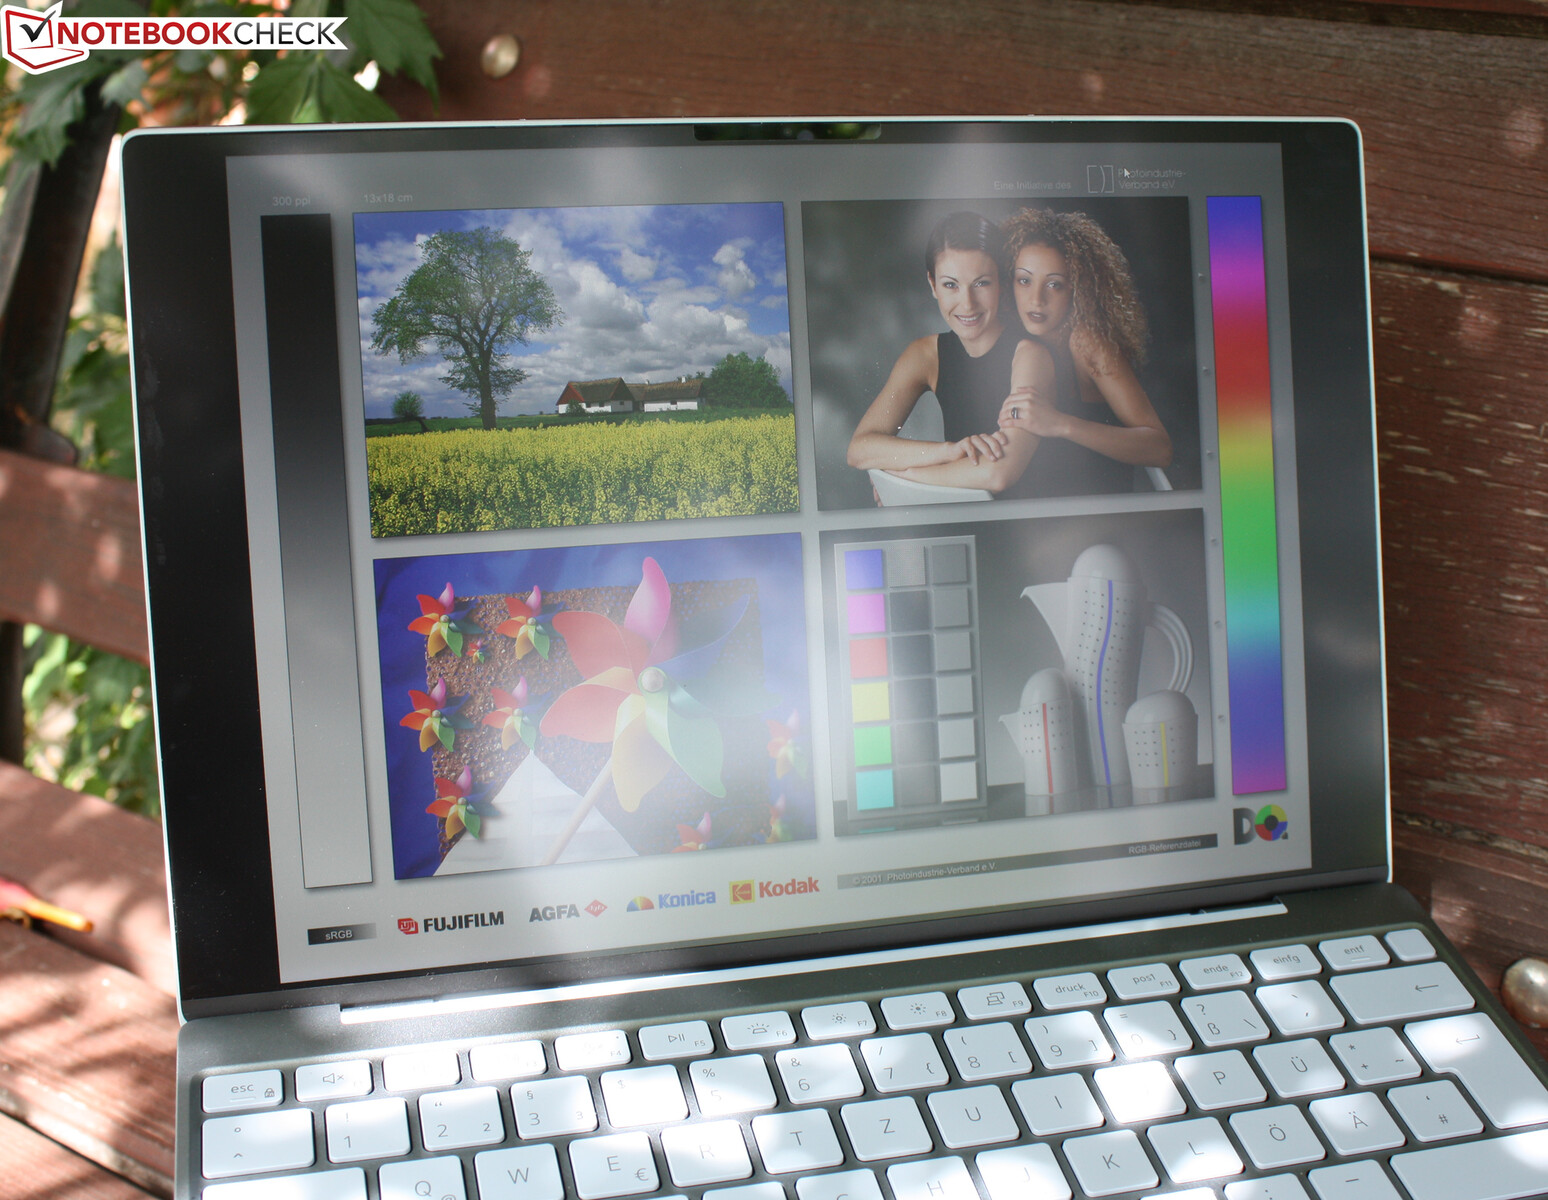
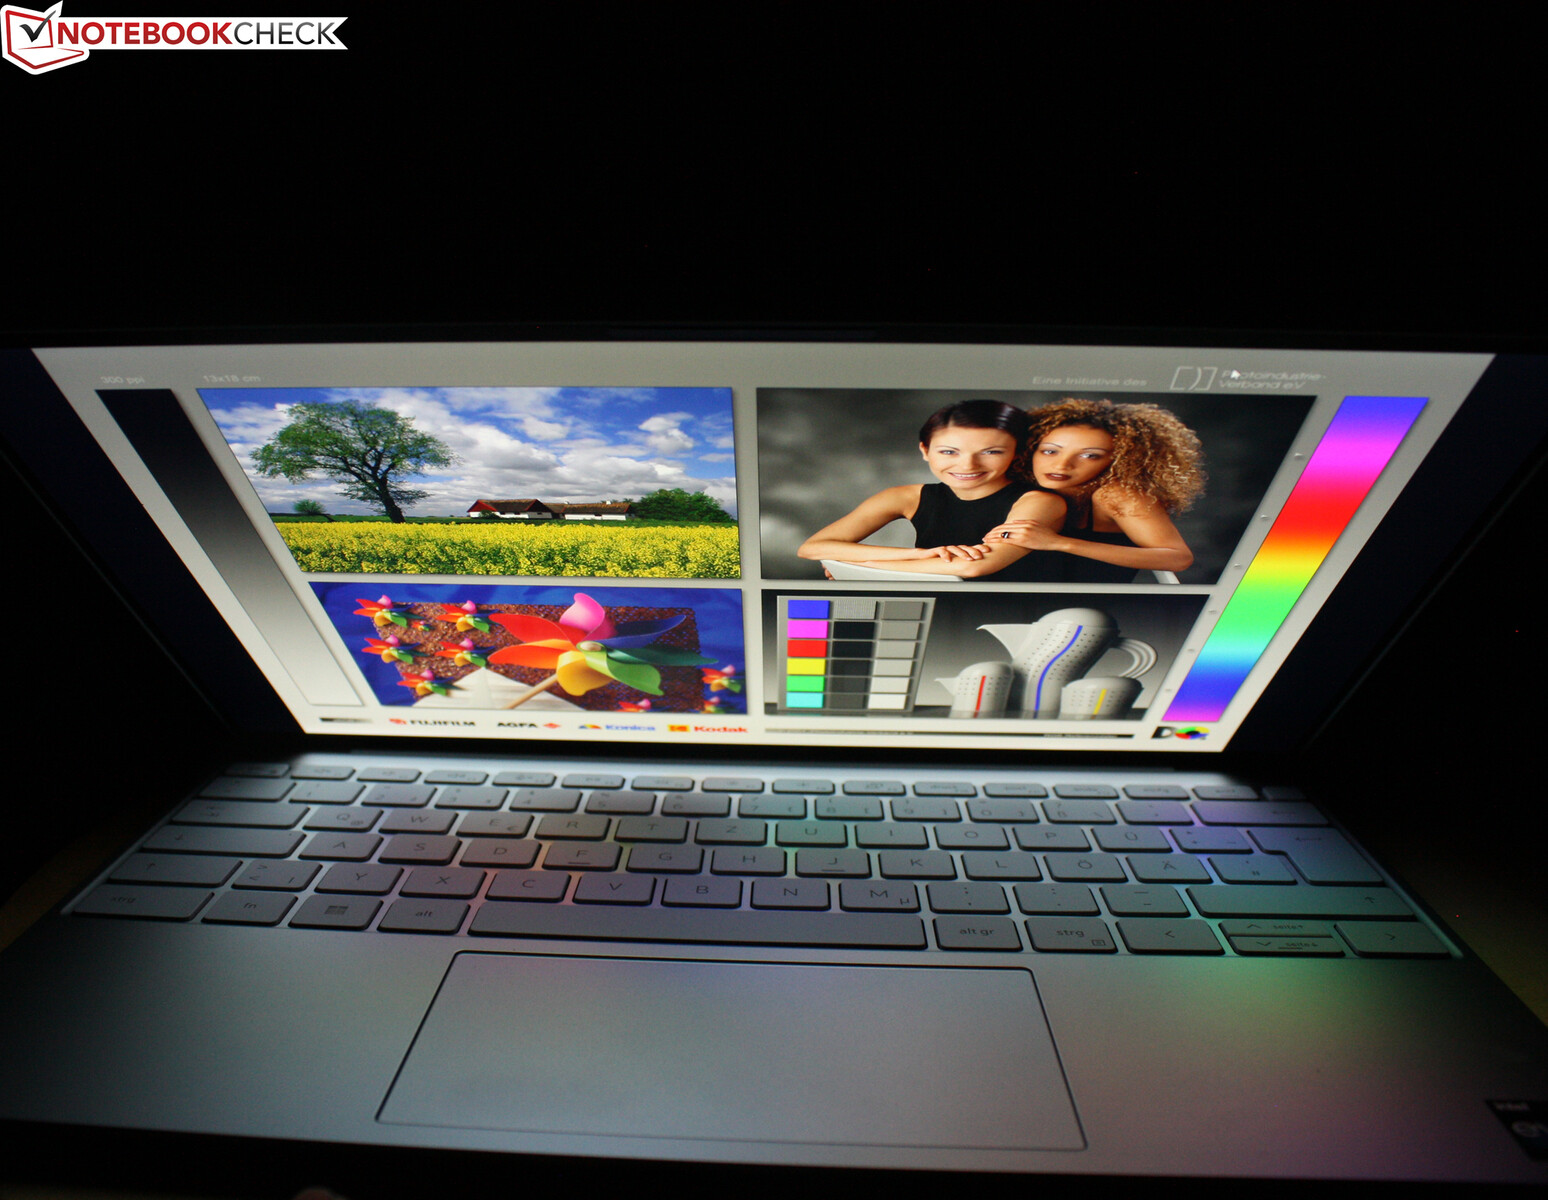
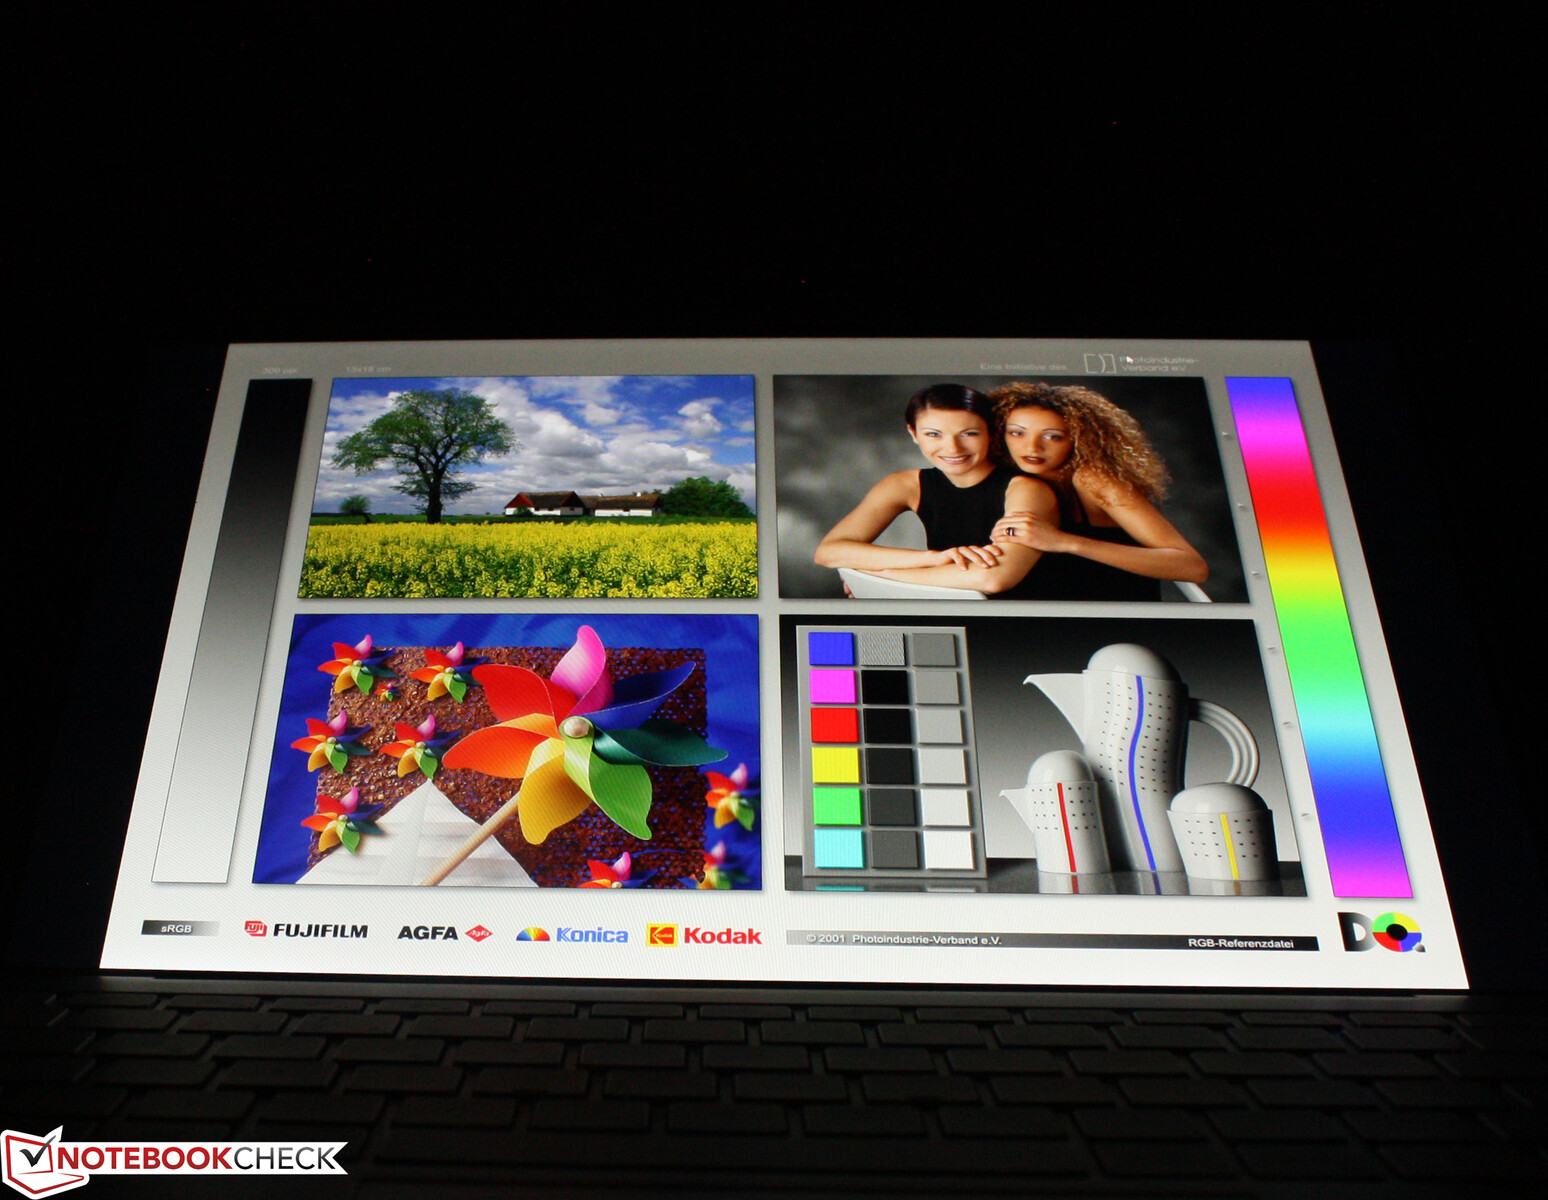
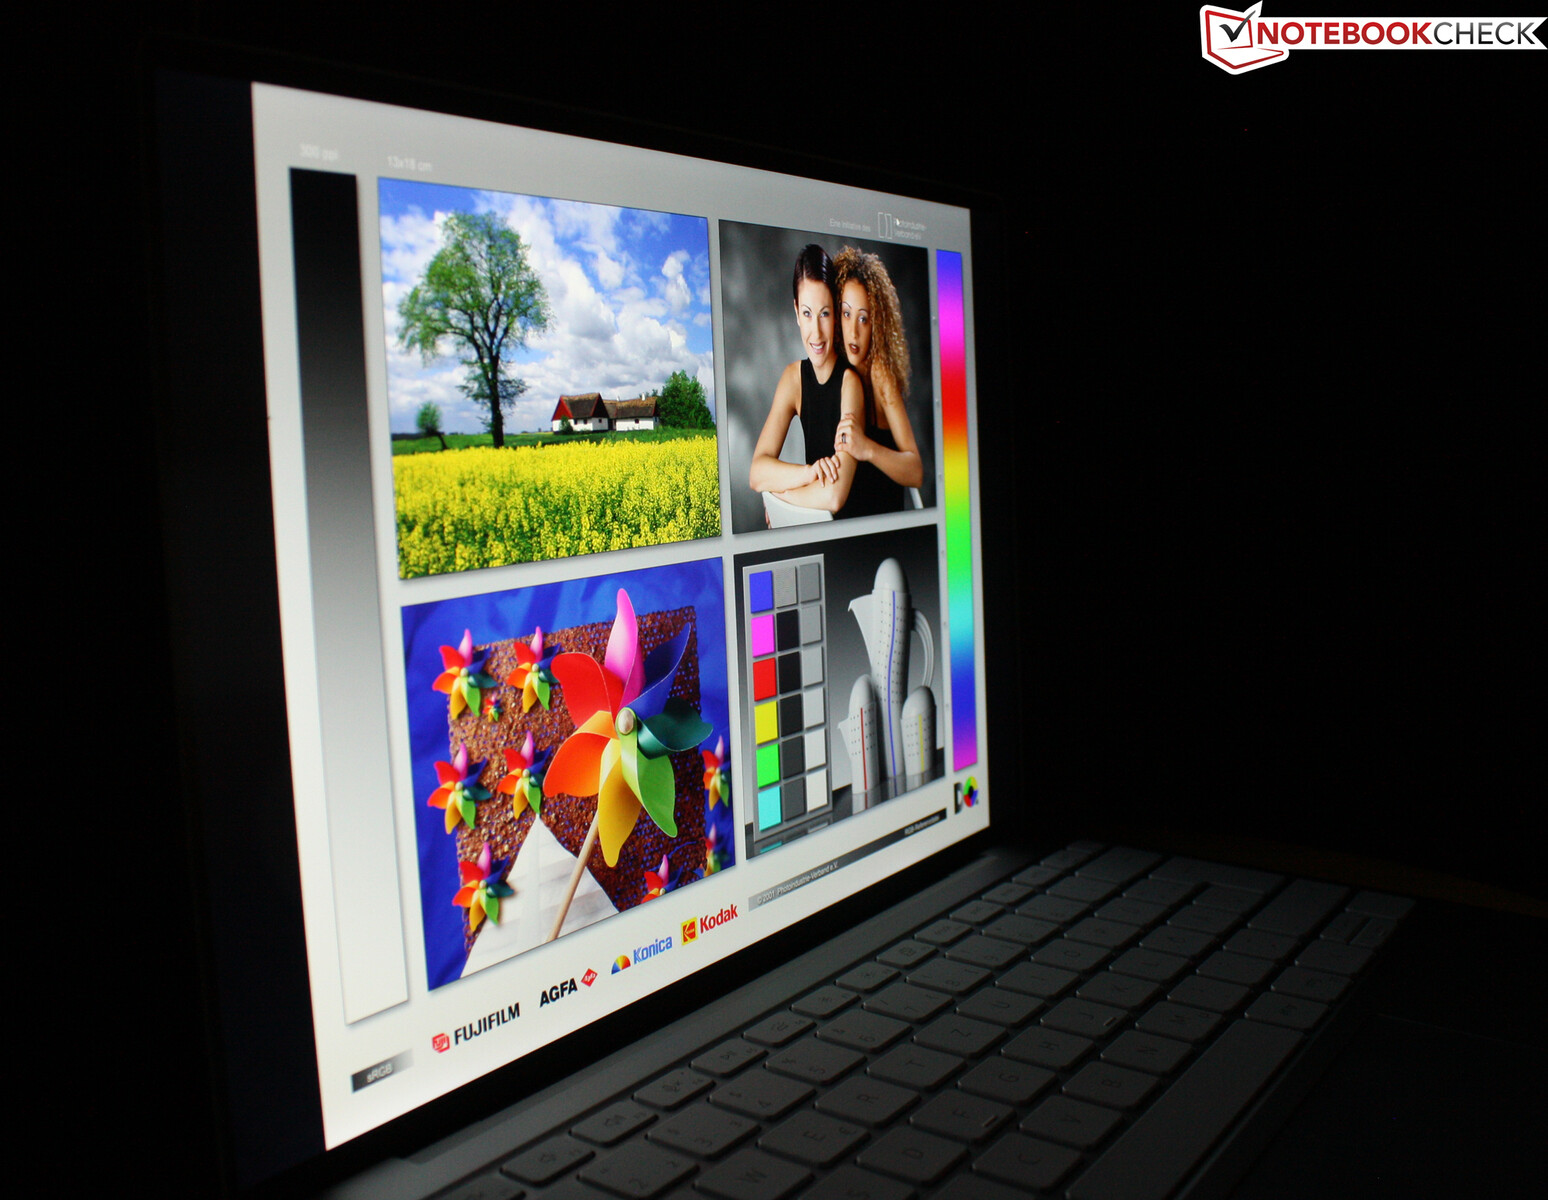
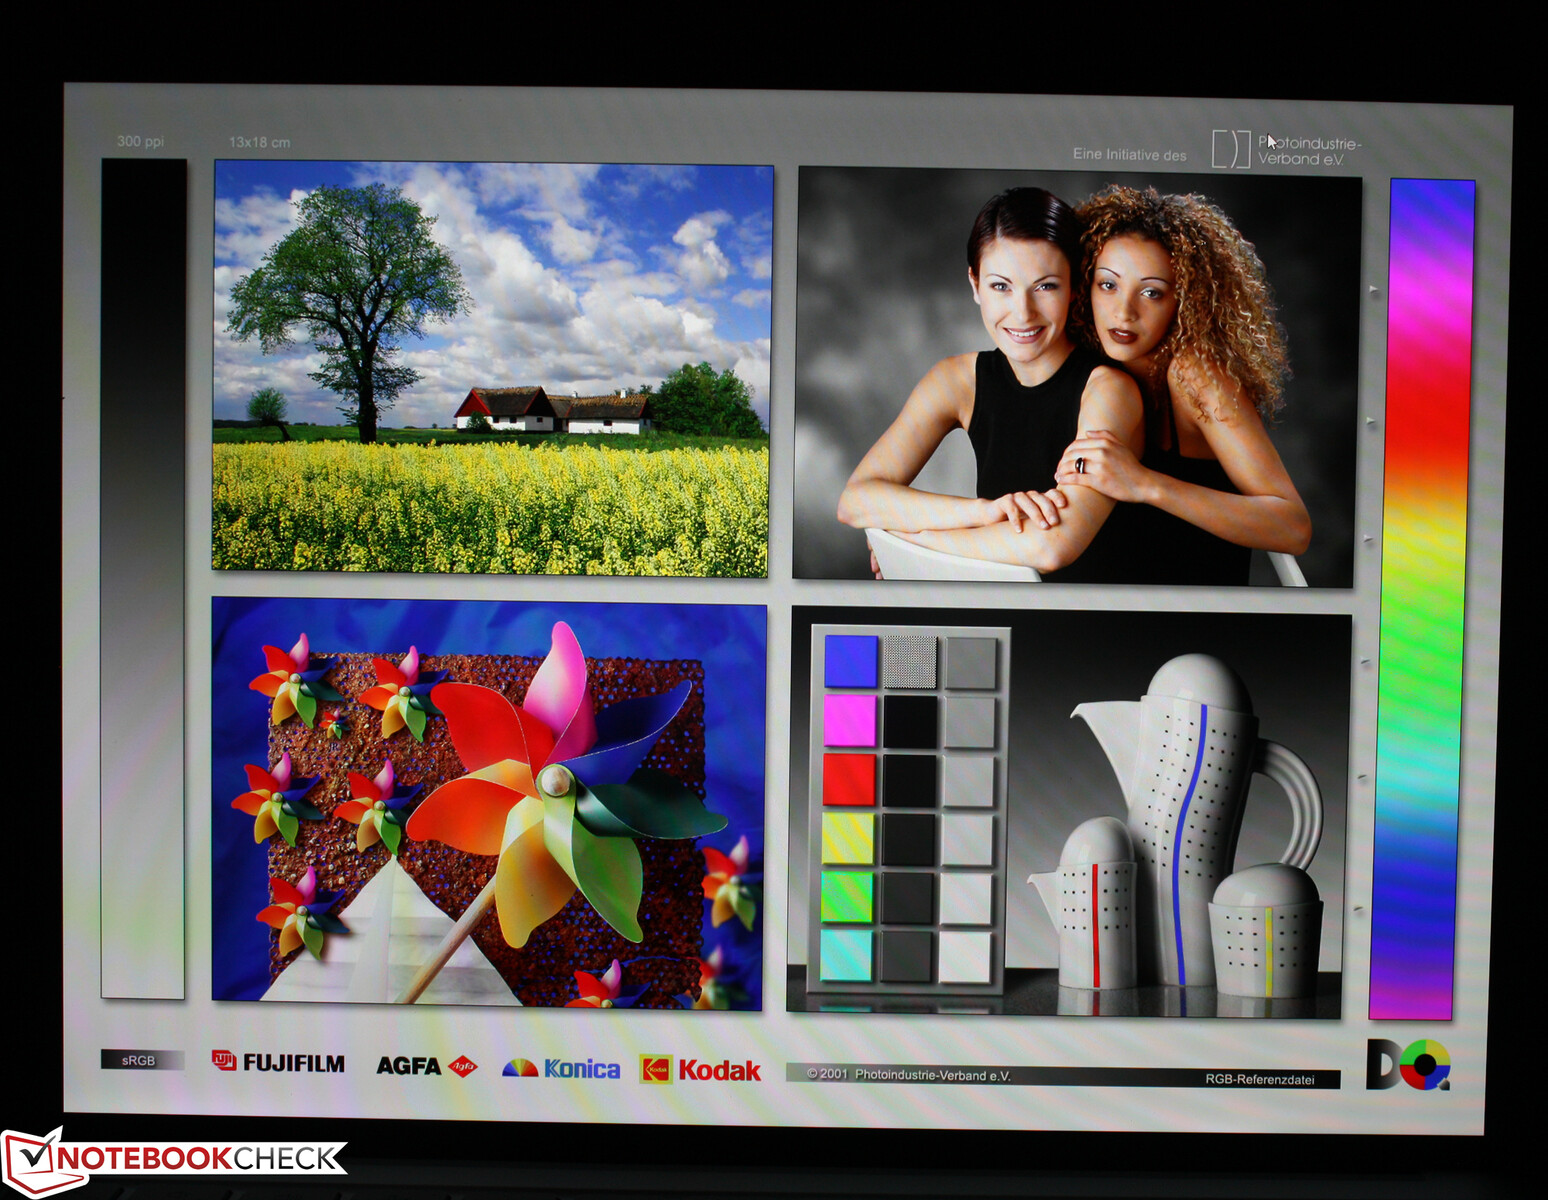
Display - Bright Laptop Display for Outdoor Use
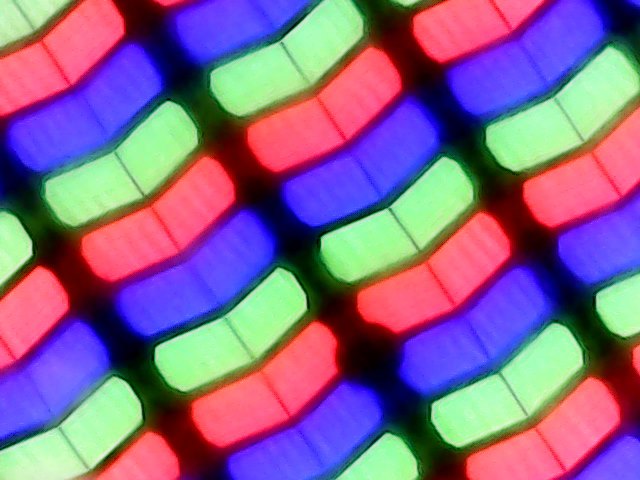
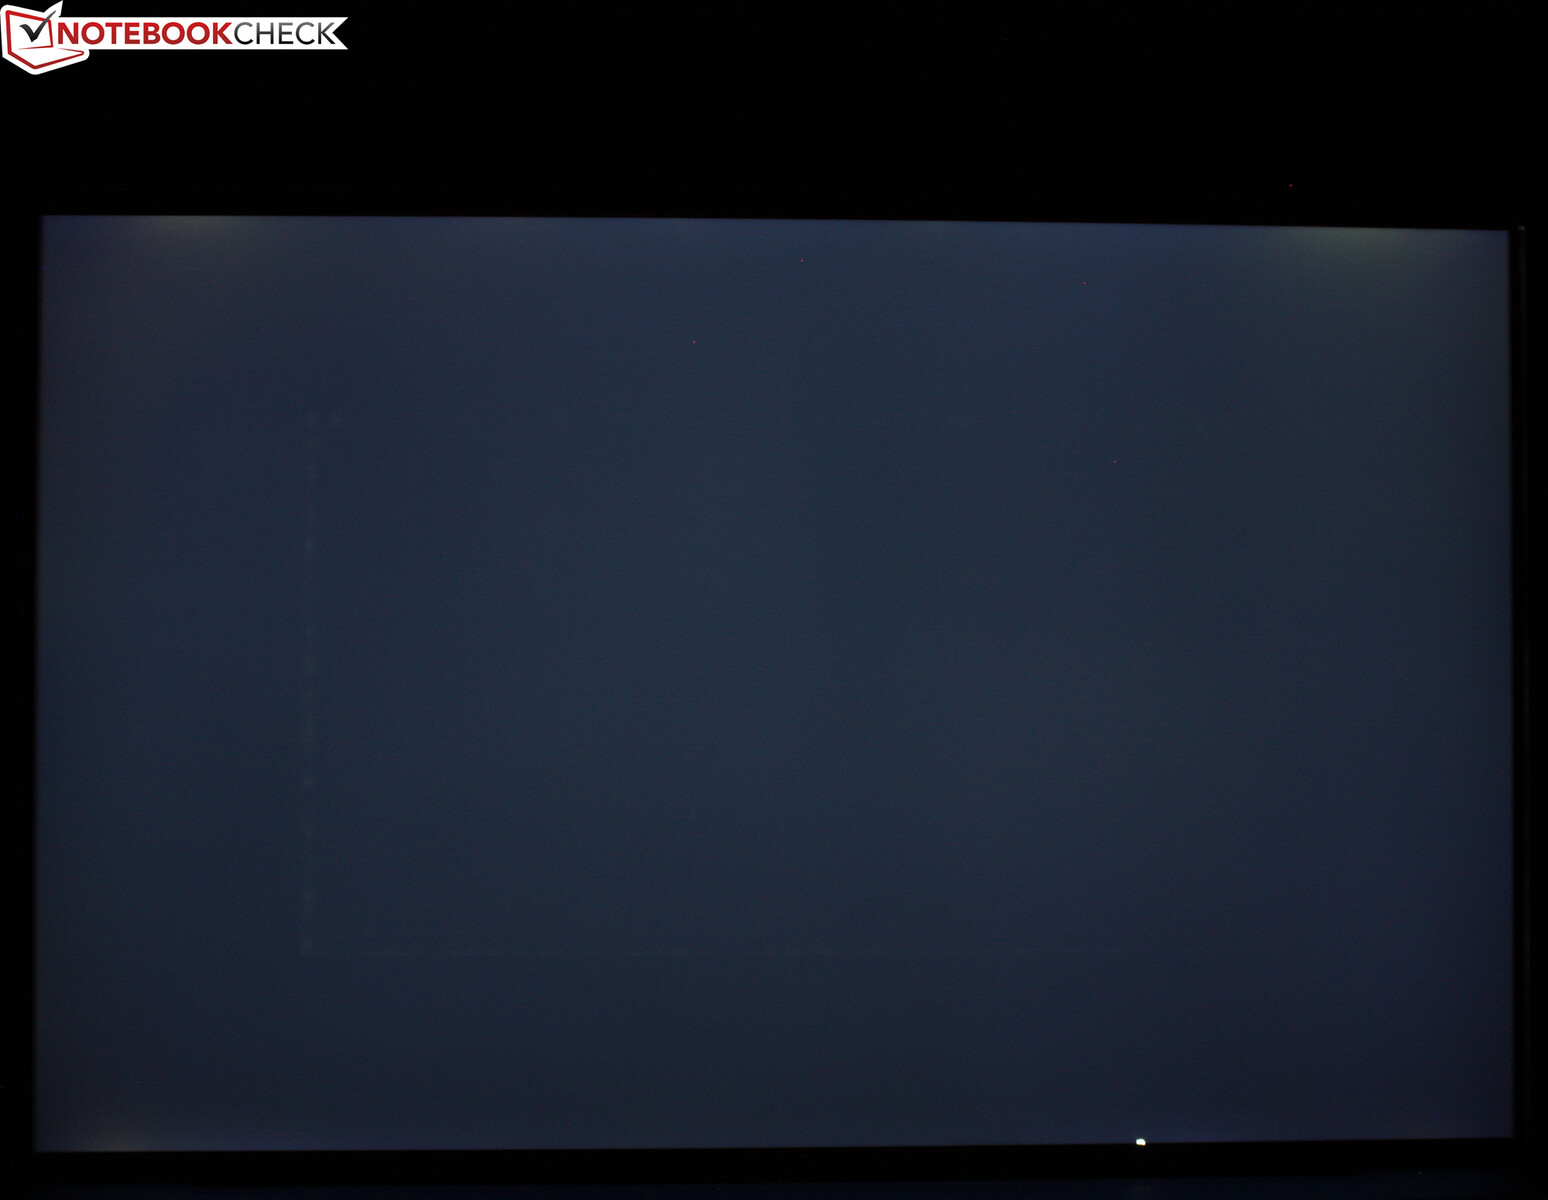
Our XPS 9315 uses the default Sharp display with a resolution of 1920 x 1200 pixels and the LQ134N1 IPS panel that exhibits slight backlight-bleeding near the top edge when displaying a fully black image at maximum brightness. Although the brightness of 442 nits (average) is high, it falls short of the manufacturer's claimed 500 nits (we measured only up to 466 nits).
The 4K panel of the Plus version (Sharp LQ134R1) is slightly brighter with 473 nits (average), but primarily offers a better contrast. 1165:1 instead of 1764:1 makes the 4K panel of the Plus the clear winner.
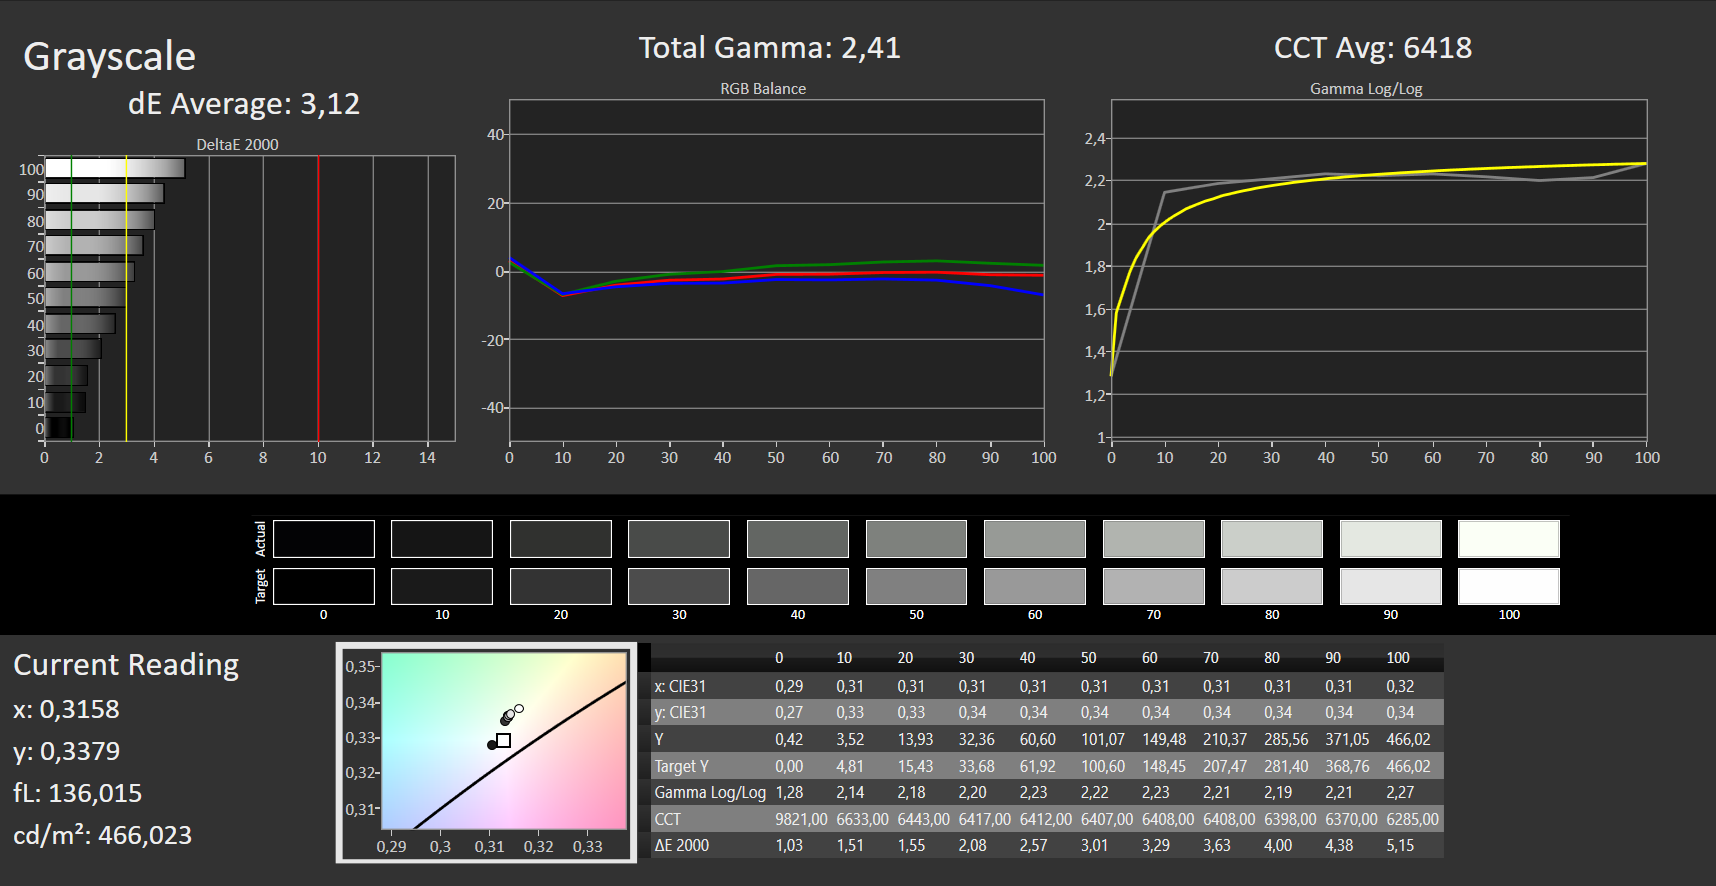
Note: The luminance slightly drops in battery mode and decreases by 60 nits (average: 406 nits). The OLED display option is only available on the Plus variant.
The XPS 13 does not use PWM to control the display's brightness. Our three screenshots show a homogenous line at 100, 50, and 0 percent brightness.
| |||||||||||||||||||||||||
Brightness Distribution: 89 %
Center on Battery: 406 cd/m²
Contrast: 1165:1 (Black: 0.4 cd/m²)
ΔE ColorChecker Calman: 3.03 | ∀{0.5-29.43 Ø4.76}
calibrated: 2.34
ΔE Greyscale Calman: 3.12 | ∀{0.09-98 Ø5}
71% AdobeRGB 1998 (Argyll 3D)
100% sRGB (Argyll 3D)
69% Display P3 (Argyll 3D)
Gamma: 2.41
CCT: 6418 K
| Dell XPS 13 9315, i5-1230U Sharp SHP1548 LQ134N1, IPS, 1920x1200, 13.4" | Apple MacBook Air 2020 M1 Entry IPS, 2560x1600, 13.3" | Asus Zenbook S 13 OLED SDC4172, OLED, 2880x1800, 13.3" | Lenovo ThinkPad X1 Nano-20UN002UGE MND007ZA1-2, IPS, 2160x1350, 13" | Huawei MateBook 13s i5 11300H TL134GDXP02-0, LTPS, 2520x1680, 13.4" | Dell XPS 13 Plus 9320 4K LQ134R1, IPS, 3840x2400, 13.4" | |
|---|---|---|---|---|---|---|
| Display | 21% | 28% | 1% | -6% | 6% | |
| Display P3 Coverage (%) | 69 | 98.6 43% | 99.8 45% | 70.4 2% | 65.2 -6% | 76.5 11% |
| sRGB Coverage (%) | 100 | 100 0% | 100 0% | 99.9 0% | 92 -8% | 100 0% |
| AdobeRGB 1998 Coverage (%) | 71 | 85.9 21% | 97.8 38% | 72 1% | 67.5 -5% | 76 7% |
| Response Times | 2% | 94% | -22% | -8% | 2% | |
| Response Time Grey 50% / Grey 80% * (ms) | 40 ? | 31 ? 22% | 2.1 ? 95% | 46.8 ? -17% | 44.8 ? -12% | 38.9 ? 3% |
| Response Time Black / White * (ms) | 22 ? | 26.1 ? -19% | 1.68 ? 92% | 28 ? -27% | 22.8 ? -4% | 21.9 ? -0% |
| PWM Frequency (Hz) | 118000 ? | 240.4 ? | 9804 ? | |||
| Screen | 23% | 175% | 31% | 25% | 18% | |
| Brightness middle (cd/m²) | 466 | 417 -11% | 336 -28% | 460 -1% | 468 0% | 494 6% |
| Brightness (cd/m²) | 442 | 395 -11% | 338 -24% | 434 -2% | 450 2% | 474 7% |
| Brightness Distribution (%) | 89 | 91 2% | 99 11% | 92 3% | 92 3% | 89 0% |
| Black Level * (cd/m²) | 0.4 | 0.39 2% | 0.02 95% | 0.27 32% | 0.23 43% | 0.28 30% |
| Contrast (:1) | 1165 | 1069 -8% | 16800 1342% | 1704 46% | 2035 75% | 1764 51% |
| Colorchecker dE 2000 * | 3.03 | 1.12 63% | 1.8 41% | 1.1 64% | 2 34% | 3.1 -2% |
| Colorchecker dE 2000 max. * | 6.68 | 2.71 59% | 3.8 43% | 4.5 33% | 5.5 18% | 4.2 37% |
| Colorchecker dE 2000 calibrated * | 2.34 | 0.77 67% | 1.8 23% | 1 57% | 1.5 36% | 1.5 36% |
| Greyscale dE 2000 * | 3.12 | 1.7 46% | 0.9 71% | 1.6 49% | 2.6 17% | 3.2 -3% |
| Gamma | 2.41 91% | 2207 0% | 2.22 99% | 2.2 100% | 2.17 101% | 2.41 91% |
| CCT | 6418 101% | 6870 95% | 6580 99% | 6475 100% | 6511 100% | 6189 105% |
| Color Space (Percent of AdobeRGB 1998) (%) | 65.7 | |||||
| Color Space (Percent of sRGB) (%) | 99.9 | |||||
| Total Average (Program / Settings) | 15% /
20% | 99% /
132% | 3% /
17% | 4% /
14% | 9% /
13% |
* ... smaller is better
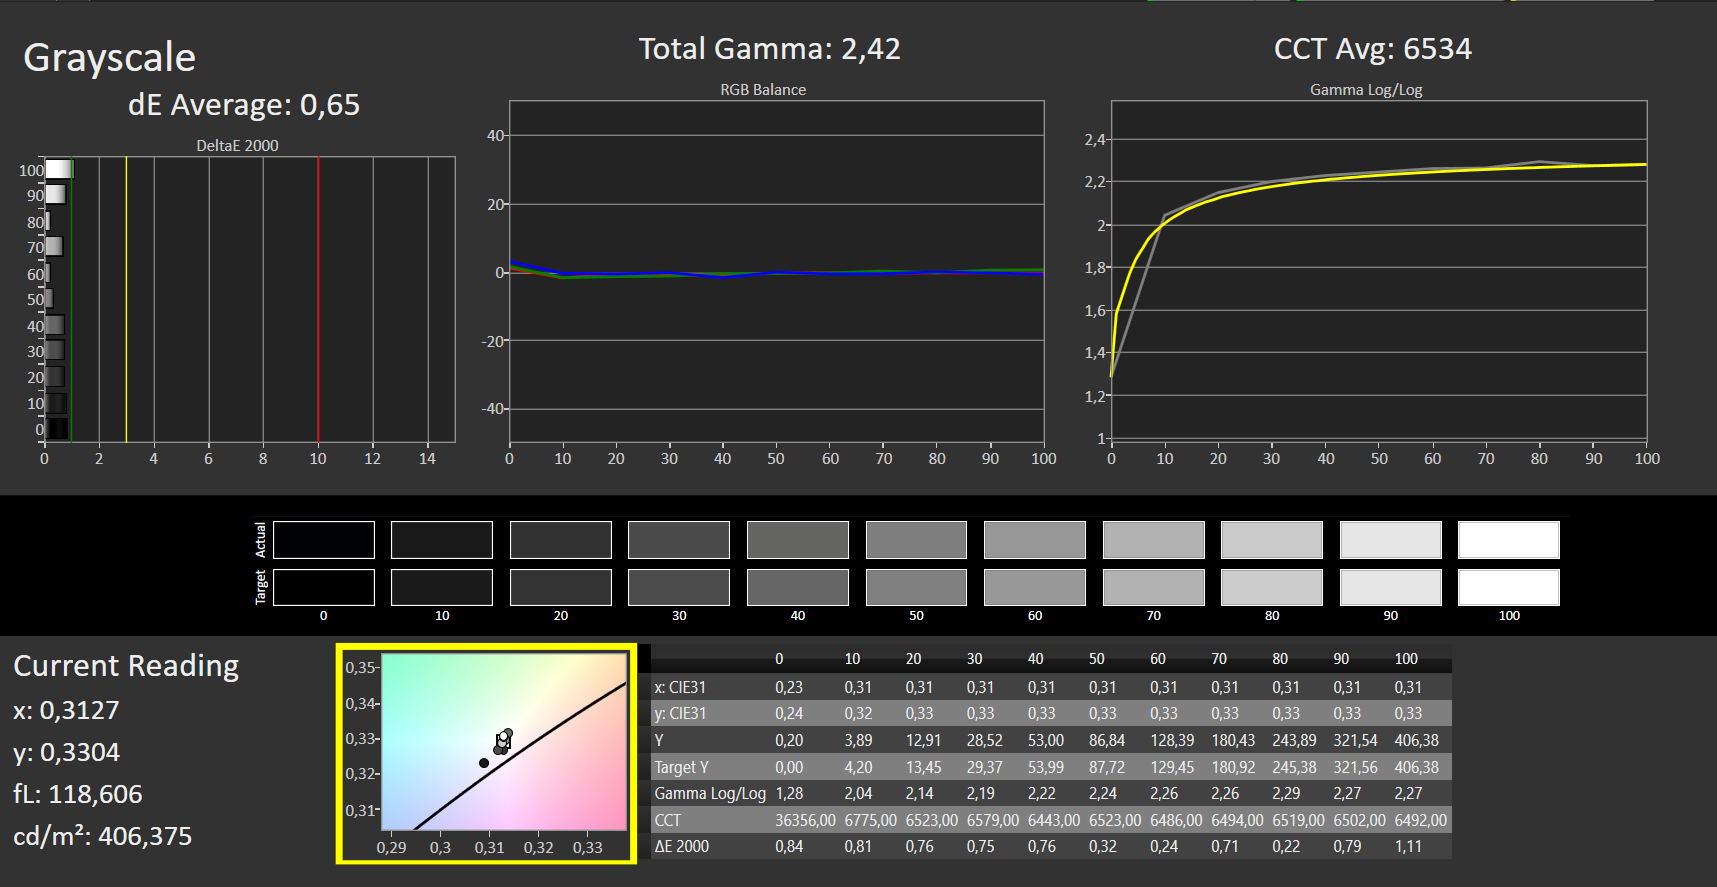
We noticed two things during our analysis with the professional CalMAN software (X-Rite i1 Pro 2): While the panel covers 100 percent of the sRGB color space, it does not come close to covering 100 percent of the P3 color space. Furthermore, we measured a deltaE of around 3.0 for the colors and grayscale. This makes a calibration unnecessary for normal use. Users who still opt to do so are rewarded with an excellent deltaE of less than 1.0. If you own a Dell XPS 13 with the same display option, your visual experience can be improved by applying our calibrated color profile (linked in the box above).


Display Response Times
| ↔ Response Time Black to White | ||
|---|---|---|
| 22 ms ... rise ↗ and fall ↘ combined | ↗ 9 ms rise |  |
| ↘ 13 ms fall | ||
| The screen shows good response rates in our tests, but may be too slow for competitive gamers. In comparison, all tested devices range from 0.1 (minimum) to 240 (maximum) ms. » 47 % of all devices are better. This means that the measured response time is similar to the average of all tested devices (20.1 ms). | ||
| ↔ Response Time 50% Grey to 80% Grey | ||
| 40 ms ... rise ↗ and fall ↘ combined | ↗ 20 ms rise |  |
| ↘ 20 ms fall | ||
| The screen shows slow response rates in our tests and will be unsatisfactory for gamers. In comparison, all tested devices range from 0.165 (minimum) to 636 (maximum) ms. » 60 % of all devices are better. This means that the measured response time is worse than the average of all tested devices (31.5 ms). | ||
Screen Flickering / PWM (Pulse-Width Modulation)
| Screen flickering / PWM not detected | ≤ 100 % brightness setting |    | |
In comparison: 53 % of all tested devices do not use PWM to dim the display. If PWM was detected, an average of 8036 (minimum: 5 - maximum: 343500) Hz was measured. | |||
While the matte FHD non-touch panel quite literally shines outdoors with its 400-nit brightness, dull reflections are almost unavoidable under sunshine.
Performance - XPS Laptop with Half the Performance
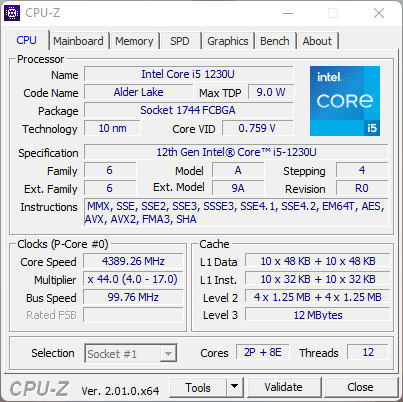
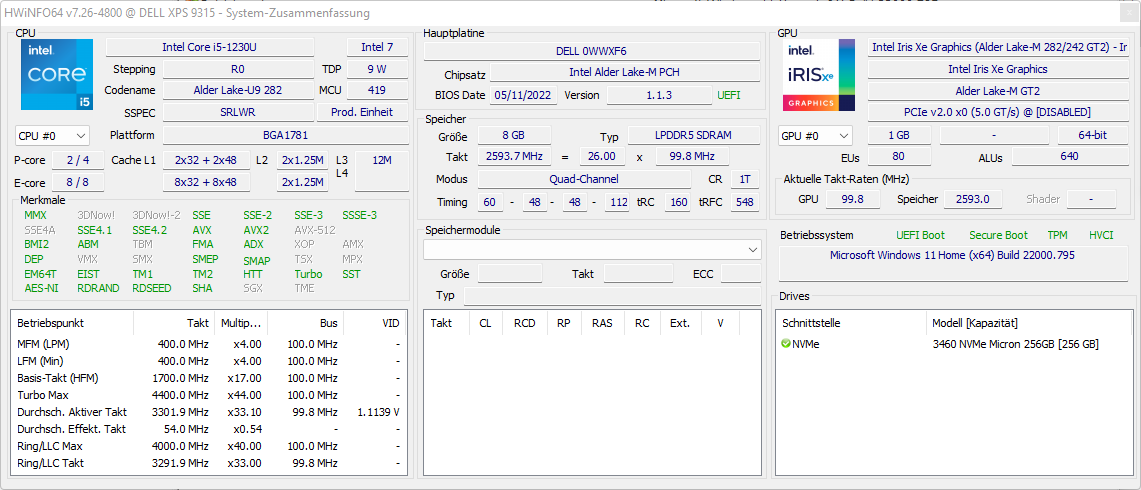
The CPU inside the XPS 13 is based on the Alder Lake-M chip (9W U series) and consists of 2 performance (P cores) and 8 efficiency cores (E cores). Since only the P cores support hyper-threading, a total of 12 threads can be processed simultaneously. The P cores are clocked at 1 to 4.4 GHz and the E cores at 0.7 to 3.3 GHz. Although there is an i7-1250U (4.7 GHz) available for the non-Plus XPS model, this does not change its low-performance characteristic. If you are looking for a new XPS with as much performance as possible, there is no way around the XPS 13 Plus, which is only comes with Alder Lake-P processor (Core i5-1240P, Core i7-1260P) with 4 performance and 8 efficiency cores each.
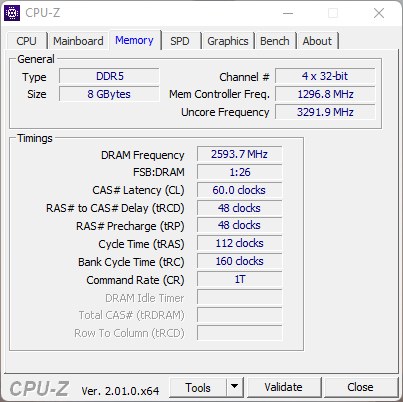
Buyers can choose between 8, 16, or 32 GB of RAM (LPDDR5-5200), with the 32-GB option only being available in combination with the i7 CPU. This allows Dell to store fewer parts, since the RAM is soldered.
Test Conditions
Since unlike the XPS 13 Plus, there is no preinstalled Power Manager on our test device, the Windows settings will have to suffice. We use the performance profile for our testing with the energy saver mode disabled.
Processor
We examine the behavior of the CPU under a realistic continuous load with the help of our Cinebench R15 loop. The Alder Lake-U CPU performs consistently, although it begins the test at a very low level. All competitors are faster in this test.
The usual 10-15s performance peak is completely missing here. This is not the case for the P-series CPUs (XPS 13 Plus i7 & i5), which are also able to maintain higher scores in the long term. In short: A XPS 13 Plus is more than twice (i5) or three times (i7) as fast as our base model.
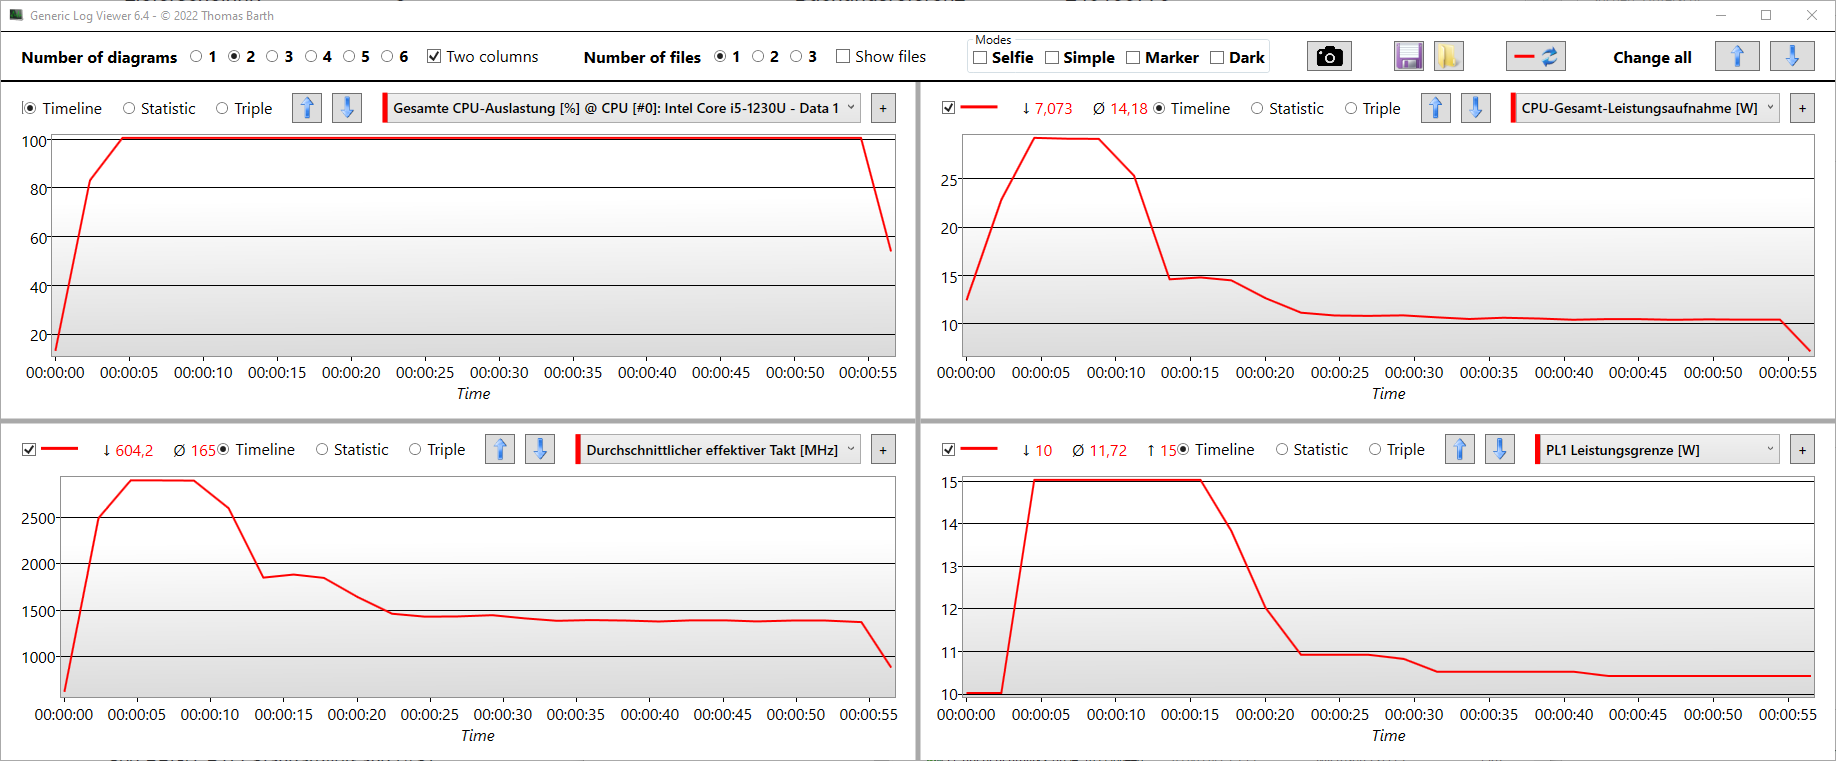
During the first loop, the clock speed and power draw decrease after just ten seconds and the PL1 drops from 15 to just 10 watts. This kind of performance will not earn our XPS any medals. While Alder Lake-U achieves an average result in our CPU performance rating, it comes in last in all multi-threaded tests and AIDA64. Alder Lake-P is a better pick for performance enthusiasts, since the 1240P and 1260P lead the charge and are even able to compete with the AMD Ryzen 7 6800U (Zenbook S 13 OLED) in multi-threaded benchmarks.
Cinebench R15 Multi Loop
Cinebench R23: Multi Core | Single Core
Cinebench R20: CPU (Multi Core) | CPU (Single Core)
Cinebench R15: CPU Multi 64Bit | CPU Single 64Bit
7-Zip 18.03: 7z b 4 | 7z b 4 -mmt1
Geekbench 5.5: Multi-Core | Single-Core
| CPU Performance rating | |
| Average of class Subnotebook | |
| Dell XPS 13 Plus 9320 4K | |
| Asus Zenbook S 13 OLED | |
| Dell XPS 13 Plus 9320 i5-1240p | |
| Apple MacBook Air 2020 M1 Entry | |
| Huawei MateBook 13s i5 11300H | |
| Average Intel Core i5-1230U | |
| Lenovo ThinkPad X1 Nano-20UN002UGE -1! | |
| Dell XPS 13 9315, i5-1230U | |
| Cinebench R23 / Multi Core | |
| Average of class Subnotebook (1555 - 21812, n=72, last 2 years) | |
| Asus Zenbook S 13 OLED | |
| Dell XPS 13 Plus 9320 4K | |
| Dell XPS 13 Plus 9320 i5-1240p | |
| Apple MacBook Air 2020 M1 Entry | |
| Lenovo ThinkPad X1 Nano-20UN002UGE | |
| Huawei MateBook 13s i5 11300H | |
| Average Intel Core i5-1230U (3066 - 7264, n=3) | |
| Dell XPS 13 9315, i5-1230U | |
| Cinebench R23 / Single Core | |
| Average of class Subnotebook (358 - 2165, n=73, last 2 years) | |
| Dell XPS 13 Plus 9320 4K | |
| Dell XPS 13 Plus 9320 i5-1240p | |
| Apple MacBook Air 2020 M1 Entry | |
| Asus Zenbook S 13 OLED | |
| Average Intel Core i5-1230U (1135 - 1512, n=3) | |
| Dell XPS 13 9315, i5-1230U | |
| Huawei MateBook 13s i5 11300H | |
| Cinebench R20 / CPU (Multi Core) | |
| Average of class Subnotebook (579 - 8541, n=67, last 2 years) | |
| Asus Zenbook S 13 OLED | |
| Dell XPS 13 Plus 9320 4K | |
| Dell XPS 13 Plus 9320 i5-1240p | |
| Huawei MateBook 13s i5 11300H | |
| Average Intel Core i5-1230U (1175 - 2802, n=3) | |
| Apple MacBook Air 2020 M1 Entry | |
| Lenovo ThinkPad X1 Nano-20UN002UGE | |
| Dell XPS 13 9315, i5-1230U | |
| Cinebench R20 / CPU (Single Core) | |
| Dell XPS 13 Plus 9320 4K | |
| Average of class Subnotebook (128 - 826, n=67, last 2 years) | |
| Dell XPS 13 Plus 9320 i5-1240p | |
| Asus Zenbook S 13 OLED | |
| Lenovo ThinkPad X1 Nano-20UN002UGE | |
| Average Intel Core i5-1230U (441 - 580, n=3) | |
| Dell XPS 13 9315, i5-1230U | |
| Huawei MateBook 13s i5 11300H | |
| Apple MacBook Air 2020 M1 Entry | |
| Cinebench R15 / CPU Multi 64Bit | |
| Average of class Subnotebook (327 - 3345, n=67, last 2 years) | |
| Asus Zenbook S 13 OLED | |
| Dell XPS 13 Plus 9320 4K | |
| Dell XPS 13 Plus 9320 4K | |
| Dell XPS 13 Plus 9320 i5-1240p | |
| Apple MacBook Air 2020 M1 Entry | |
| Huawei MateBook 13s i5 11300H | |
| Huawei MateBook 13s i5 11300H | |
| Lenovo ThinkPad X1 Nano-20UN002UGE | |
| Average Intel Core i5-1230U (433 - 1254, n=3) | |
| Dell XPS 13 9315, i5-1230U | |
| Cinebench R15 / CPU Single 64Bit | |
| Average of class Subnotebook (72.4 - 322, n=67, last 2 years) | |
| Dell XPS 13 Plus 9320 4K | |
| Asus Zenbook S 13 OLED | |
| Dell XPS 13 Plus 9320 i5-1240p | |
| Apple MacBook Air 2020 M1 Entry | |
| Lenovo ThinkPad X1 Nano-20UN002UGE | |
| Huawei MateBook 13s i5 11300H | |
| Dell XPS 13 9315, i5-1230U | |
| Average Intel Core i5-1230U (120.1 - 221, n=3) | |
| 7-Zip 18.03 / 7z b 4 | |
| Asus Zenbook S 13 OLED | |
| Average of class Subnotebook (11668 - 77867, n=67, last 2 years) | |
| Dell XPS 13 Plus 9320 4K | |
| Dell XPS 13 Plus 9320 i5-1240p | |
| Apple MacBook Air 2020 M1 Entry | |
| Huawei MateBook 13s i5 11300H | |
| Average Intel Core i5-1230U (12470 - 34505, n=3) | |
| Lenovo ThinkPad X1 Nano-20UN002UGE | |
| Dell XPS 13 9315, i5-1230U | |
| 7-Zip 18.03 / 7z b 4 -mmt1 | |
| Average of class Subnotebook (2643 - 6442, n=69, last 2 years) | |
| Apple MacBook Air 2020 M1 Entry | |
| Asus Zenbook S 13 OLED | |
| Dell XPS 13 Plus 9320 4K | |
| Huawei MateBook 13s i5 11300H | |
| Dell XPS 13 Plus 9320 i5-1240p | |
| Lenovo ThinkPad X1 Nano-20UN002UGE | |
| Average Intel Core i5-1230U (3873 - 4870, n=3) | |
| Dell XPS 13 9315, i5-1230U | |
| Geekbench 5.5 / Multi-Core | |
| Average of class Subnotebook (2557 - 17218, n=62, last 2 years) | |
| Dell XPS 13 Plus 9320 4K | |
| Asus Zenbook S 13 OLED | |
| Apple MacBook Air 2020 M1 Entry | |
| Dell XPS 13 9315, i5-1230U | |
| Average Intel Core i5-1230U (4193 - 7309, n=3) | |
| Huawei MateBook 13s i5 11300H | |
| Lenovo ThinkPad X1 Nano-20UN002UGE | |
| Dell XPS 13 Plus 9320 i5-1240p | |
| Geekbench 5.5 / Single-Core | |
| Average of class Subnotebook (726 - 2350, n=62, last 2 years) | |
| Apple MacBook Air 2020 M1 Entry | |
| Dell XPS 13 Plus 9320 4K | |
| Dell XPS 13 9315, i5-1230U | |
| Dell XPS 13 Plus 9320 i5-1240p | |
| Average Intel Core i5-1230U (1454 - 1640, n=3) | |
| Asus Zenbook S 13 OLED | |
| Huawei MateBook 13s i5 11300H | |
| Lenovo ThinkPad X1 Nano-20UN002UGE | |
AIDA64: FP32 Ray-Trace | FPU Julia | CPU SHA3 | CPU Queen | FPU SinJulia | FPU Mandel | CPU AES | CPU ZLib | FP64 Ray-Trace | CPU PhotoWorxx
| Performance rating | |
| Asus Zenbook S 13 OLED | |
| Average of class Subnotebook | |
| Huawei MateBook 13s i5 11300H | |
| Dell XPS 13 Plus 9320 4K | |
| Dell XPS 13 Plus 9320 i5-1240p | |
| Lenovo ThinkPad X1 Nano-20UN002UGE | |
| Average Intel Core i5-1230U | |
| Dell XPS 13 9315, i5-1230U | |
| AIDA64 / FP32 Ray-Trace | |
| Average of class Subnotebook (1135 - 32888, n=68, last 2 years) | |
| Asus Zenbook S 13 OLED | |
| Huawei MateBook 13s i5 11300H | |
| Lenovo ThinkPad X1 Nano-20UN002UGE | |
| Dell XPS 13 Plus 9320 4K | |
| Dell XPS 13 Plus 9320 i5-1240p | |
| Average Intel Core i5-1230U (2344 - 6360, n=3) | |
| Dell XPS 13 9315, i5-1230U | |
| AIDA64 / FPU Julia | |
| Asus Zenbook S 13 OLED | |
| Average of class Subnotebook (5218 - 123315, n=68, last 2 years) | |
| Huawei MateBook 13s i5 11300H | |
| Lenovo ThinkPad X1 Nano-20UN002UGE | |
| Dell XPS 13 Plus 9320 4K | |
| Dell XPS 13 Plus 9320 i5-1240p | |
| Average Intel Core i5-1230U (11867 - 31714, n=3) | |
| Dell XPS 13 9315, i5-1230U | |
| AIDA64 / CPU SHA3 | |
| Average of class Subnotebook (444 - 5287, n=68, last 2 years) | |
| Asus Zenbook S 13 OLED | |
| Huawei MateBook 13s i5 11300H | |
| Lenovo ThinkPad X1 Nano-20UN002UGE | |
| Dell XPS 13 Plus 9320 4K | |
| Dell XPS 13 Plus 9320 i5-1240p | |
| Average Intel Core i5-1230U (772 - 1711, n=3) | |
| Dell XPS 13 9315, i5-1230U | |
| AIDA64 / CPU Queen | |
| Asus Zenbook S 13 OLED | |
| Dell XPS 13 Plus 9320 4K | |
| Dell XPS 13 Plus 9320 i5-1240p | |
| Average of class Subnotebook (10579 - 115682, n=67, last 2 years) | |
| Dell XPS 13 9315, i5-1230U | |
| Huawei MateBook 13s i5 11300H | |
| Average Intel Core i5-1230U (30824 - 52533, n=3) | |
| Lenovo ThinkPad X1 Nano-20UN002UGE | |
| AIDA64 / FPU SinJulia | |
| Asus Zenbook S 13 OLED | |
| Average of class Subnotebook (744 - 18418, n=68, last 2 years) | |
| Dell XPS 13 Plus 9320 4K | |
| Dell XPS 13 Plus 9320 i5-1240p | |
| Huawei MateBook 13s i5 11300H | |
| Lenovo ThinkPad X1 Nano-20UN002UGE | |
| Average Intel Core i5-1230U (2269 - 3947, n=3) | |
| Dell XPS 13 9315, i5-1230U | |
| AIDA64 / FPU Mandel | |
| Asus Zenbook S 13 OLED | |
| Average of class Subnotebook (3341 - 65433, n=68, last 2 years) | |
| Huawei MateBook 13s i5 11300H | |
| Lenovo ThinkPad X1 Nano-20UN002UGE | |
| Dell XPS 13 Plus 9320 i5-1240p | |
| Dell XPS 13 Plus 9320 4K | |
| Average Intel Core i5-1230U (6379 - 15896, n=3) | |
| Dell XPS 13 9315, i5-1230U | |
| AIDA64 / CPU AES | |
| Asus Zenbook S 13 OLED | |
| Huawei MateBook 13s i5 11300H | |
| Lenovo ThinkPad X1 Nano-20UN002UGE | |
| Average of class Subnotebook (638 - 124284, n=68, last 2 years) | |
| Dell XPS 13 Plus 9320 i5-1240p | |
| Dell XPS 13 Plus 9320 4K | |
| Average Intel Core i5-1230U (18011 - 31941, n=3) | |
| Dell XPS 13 9315, i5-1230U | |
| AIDA64 / CPU ZLib | |
| Average of class Subnotebook (164.9 - 1379, n=68, last 2 years) | |
| Dell XPS 13 Plus 9320 4K | |
| Dell XPS 13 Plus 9320 i5-1240p | |
| Asus Zenbook S 13 OLED | |
| Huawei MateBook 13s i5 11300H | |
| Average Intel Core i5-1230U (229 - 495, n=3) | |
| Lenovo ThinkPad X1 Nano-20UN002UGE | |
| Dell XPS 13 9315, i5-1230U | |
| AIDA64 / FP64 Ray-Trace | |
| Average of class Subnotebook (610 - 17495, n=68, last 2 years) | |
| Asus Zenbook S 13 OLED | |
| Huawei MateBook 13s i5 11300H | |
| Lenovo ThinkPad X1 Nano-20UN002UGE | |
| Dell XPS 13 Plus 9320 4K | |
| Dell XPS 13 Plus 9320 i5-1240p | |
| Average Intel Core i5-1230U (1328 - 3305, n=3) | |
| Dell XPS 13 9315, i5-1230U | |
| AIDA64 / CPU PhotoWorxx | |
| Average of class Subnotebook (6569 - 64588, n=68, last 2 years) | |
| Dell XPS 13 Plus 9320 4K | |
| Dell XPS 13 Plus 9320 i5-1240p | |
| Lenovo ThinkPad X1 Nano-20UN002UGE | |
| Huawei MateBook 13s i5 11300H | |
| Average Intel Core i5-1230U (17516 - 37042, n=3) | |
| Asus Zenbook S 13 OLED | |
| Dell XPS 13 9315, i5-1230U | |
System Performance
Surprisingly, the application performance is not as poor as the compute performance and Alder-Lake-U instead is sometimes slightly-below and sometimes slightly-above average, depending on the category. The deficit compared to the XPS 13 Plus 9320 i5 and i7 variants is more than significant in most component scores. The Digital Content Creation score shows the influence of the SSD: With Samsung (1 TB), the XPS is at the very top, with Micron (512 GB) at the very bottom.
CrossMark: Overall | Productivity | Creativity | Responsiveness
| PCMark 10 / Score | |
| Average of class Subnotebook (4920 - 8424, n=54, last 2 years) | |
| Asus Zenbook S 13 OLED | |
| Dell XPS 13 Plus 9320 4K | |
| Huawei MateBook 13s i5 11300H | |
| Dell XPS 13 Plus 9320 i5-1240p | |
| Dell XPS 13 9315, i5-1230U | |
| Lenovo ThinkPad X1 Nano-20UN002UGE | |
| Average Intel Core i5-1230U, Intel Iris Xe Graphics G7 80EUs (4001 - 4943, n=3) | |
| PCMark 10 / Essentials | |
| Asus Zenbook S 13 OLED | |
| Average of class Subnotebook (8552 - 11406, n=54, last 2 years) | |
| Dell XPS 13 Plus 9320 4K | |
| Dell XPS 13 9315, i5-1230U | |
| Huawei MateBook 13s i5 11300H | |
| Lenovo ThinkPad X1 Nano-20UN002UGE | |
| Average Intel Core i5-1230U, Intel Iris Xe Graphics G7 80EUs (8348 - 10139, n=3) | |
| Dell XPS 13 Plus 9320 i5-1240p | |
| PCMark 10 / Productivity | |
| Average of class Subnotebook (5435 - 16132, n=54, last 2 years) | |
| Asus Zenbook S 13 OLED | |
| Dell XPS 13 Plus 9320 4K | |
| Dell XPS 13 Plus 9320 i5-1240p | |
| Dell XPS 13 9315, i5-1230U | |
| Huawei MateBook 13s i5 11300H | |
| Average Intel Core i5-1230U, Intel Iris Xe Graphics G7 80EUs (5735 - 6692, n=3) | |
| Lenovo ThinkPad X1 Nano-20UN002UGE | |
| PCMark 10 / Digital Content Creation | |
| Average of class Subnotebook (5722 - 12442, n=54, last 2 years) | |
| Asus Zenbook S 13 OLED | |
| Dell XPS 13 Plus 9320 4K | |
| Dell XPS 13 Plus 9320 i5-1240p | |
| Huawei MateBook 13s i5 11300H | |
| Lenovo ThinkPad X1 Nano-20UN002UGE | |
| Dell XPS 13 9315, i5-1230U | |
| Average Intel Core i5-1230U, Intel Iris Xe Graphics G7 80EUs (3632 - 4833, n=3) | |
| CrossMark / Overall | |
| Dell XPS 13 Plus 9320 4K | |
| Average of class Subnotebook (365 - 2038, n=67, last 2 years) | |
| Asus Zenbook S 13 OLED | |
| Dell XPS 13 Plus 9320 i5-1240p | |
| Apple MacBook Air 2020 M1 Entry | |
| Huawei MateBook 13s i5 11300H | |
| Dell XPS 13 9315, i5-1230U | |
| Average Intel Core i5-1230U, Intel Iris Xe Graphics G7 80EUs (1117 - 1383, n=3) | |
| CrossMark / Productivity | |
| Dell XPS 13 Plus 9320 4K | |
| Average of class Subnotebook (364 - 1918, n=67, last 2 years) | |
| Asus Zenbook S 13 OLED | |
| Huawei MateBook 13s i5 11300H | |
| Dell XPS 13 Plus 9320 i5-1240p | |
| Dell XPS 13 9315, i5-1230U | |
| Average Intel Core i5-1230U, Intel Iris Xe Graphics G7 80EUs (1187 - 1356, n=3) | |
| Apple MacBook Air 2020 M1 Entry | |
| CrossMark / Creativity | |
| Dell XPS 13 Plus 9320 4K | |
| Average of class Subnotebook (372 - 2396, n=67, last 2 years) | |
| Dell XPS 13 Plus 9320 i5-1240p | |
| Apple MacBook Air 2020 M1 Entry | |
| Asus Zenbook S 13 OLED | |
| Dell XPS 13 9315, i5-1230U | |
| Average Intel Core i5-1230U, Intel Iris Xe Graphics G7 80EUs (1095 - 1469, n=3) | |
| Huawei MateBook 13s i5 11300H | |
| CrossMark / Responsiveness | |
| Huawei MateBook 13s i5 11300H | |
| Dell XPS 13 Plus 9320 4K | |
| Average of class Subnotebook (312 - 1889, n=67, last 2 years) | |
| Dell XPS 13 Plus 9320 i5-1240p | |
| Asus Zenbook S 13 OLED | |
| Dell XPS 13 9315, i5-1230U | |
| Average Intel Core i5-1230U, Intel Iris Xe Graphics G7 80EUs (990 - 1224, n=3) | |
| Apple MacBook Air 2020 M1 Entry | |
| PCMark 10 Score | 4633 points | |
Help | ||
| AIDA64 / Memory Copy | |
| Average of class Subnotebook (14554 - 109734, n=68, last 2 years) | |
| Dell XPS 13 Plus 9320 4K | |
| Dell XPS 13 Plus 9320 i5-1240p | |
| Huawei MateBook 13s i5 11300H | |
| Dell XPS 13 9315, i5-1230U | |
| Average Intel Core i5-1230U (32539 - 60944, n=3) | |
| Asus Zenbook S 13 OLED | |
| Lenovo ThinkPad X1 Nano-20UN002UGE | |
| AIDA64 / Memory Read | |
| Average of class Subnotebook (15948 - 127174, n=68, last 2 years) | |
| Dell XPS 13 Plus 9320 i5-1240p | |
| Dell XPS 13 Plus 9320 4K | |
| Dell XPS 13 9315, i5-1230U | |
| Huawei MateBook 13s i5 11300H | |
| Average Intel Core i5-1230U (31342 - 60435, n=3) | |
| Lenovo ThinkPad X1 Nano-20UN002UGE | |
| Asus Zenbook S 13 OLED | |
| AIDA64 / Memory Write | |
| Average of class Subnotebook (15709 - 117898, n=68, last 2 years) | |
| Dell XPS 13 Plus 9320 4K | |
| Dell XPS 13 9315, i5-1230U | |
| Dell XPS 13 Plus 9320 i5-1240p | |
| Huawei MateBook 13s i5 11300H | |
| Average Intel Core i5-1230U (33224 - 65665, n=3) | |
| Lenovo ThinkPad X1 Nano-20UN002UGE | |
| Asus Zenbook S 13 OLED | |
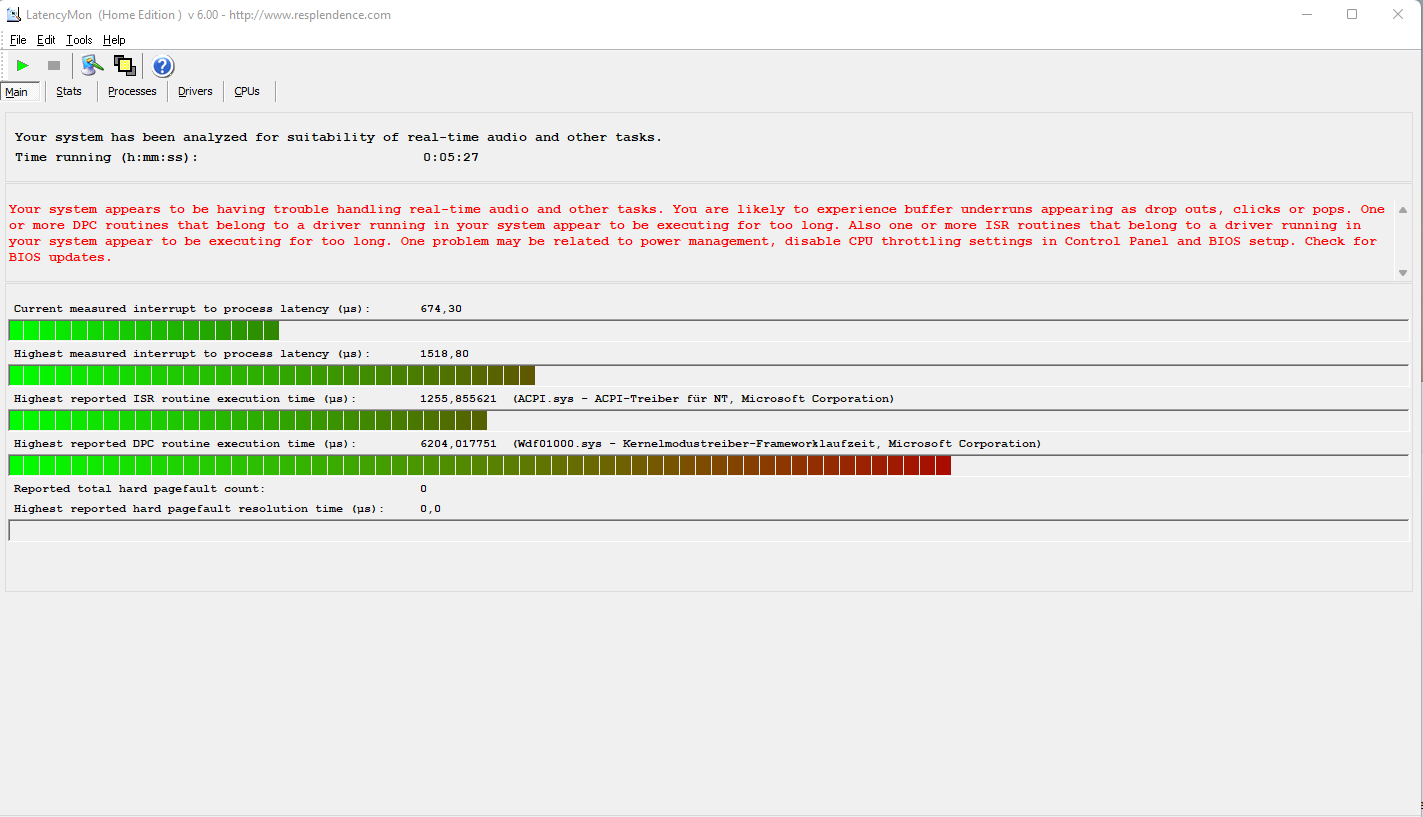
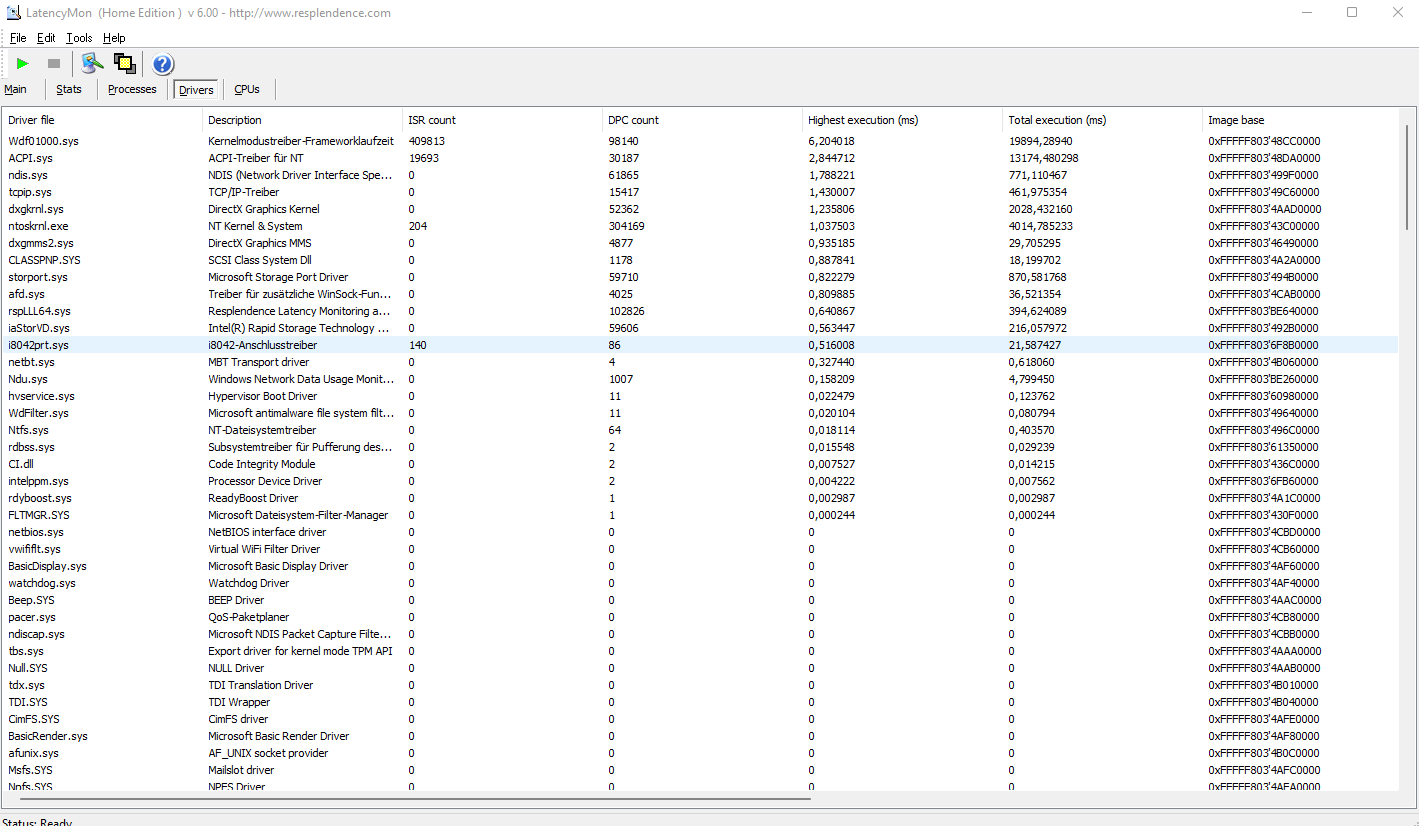
DPC Latencies
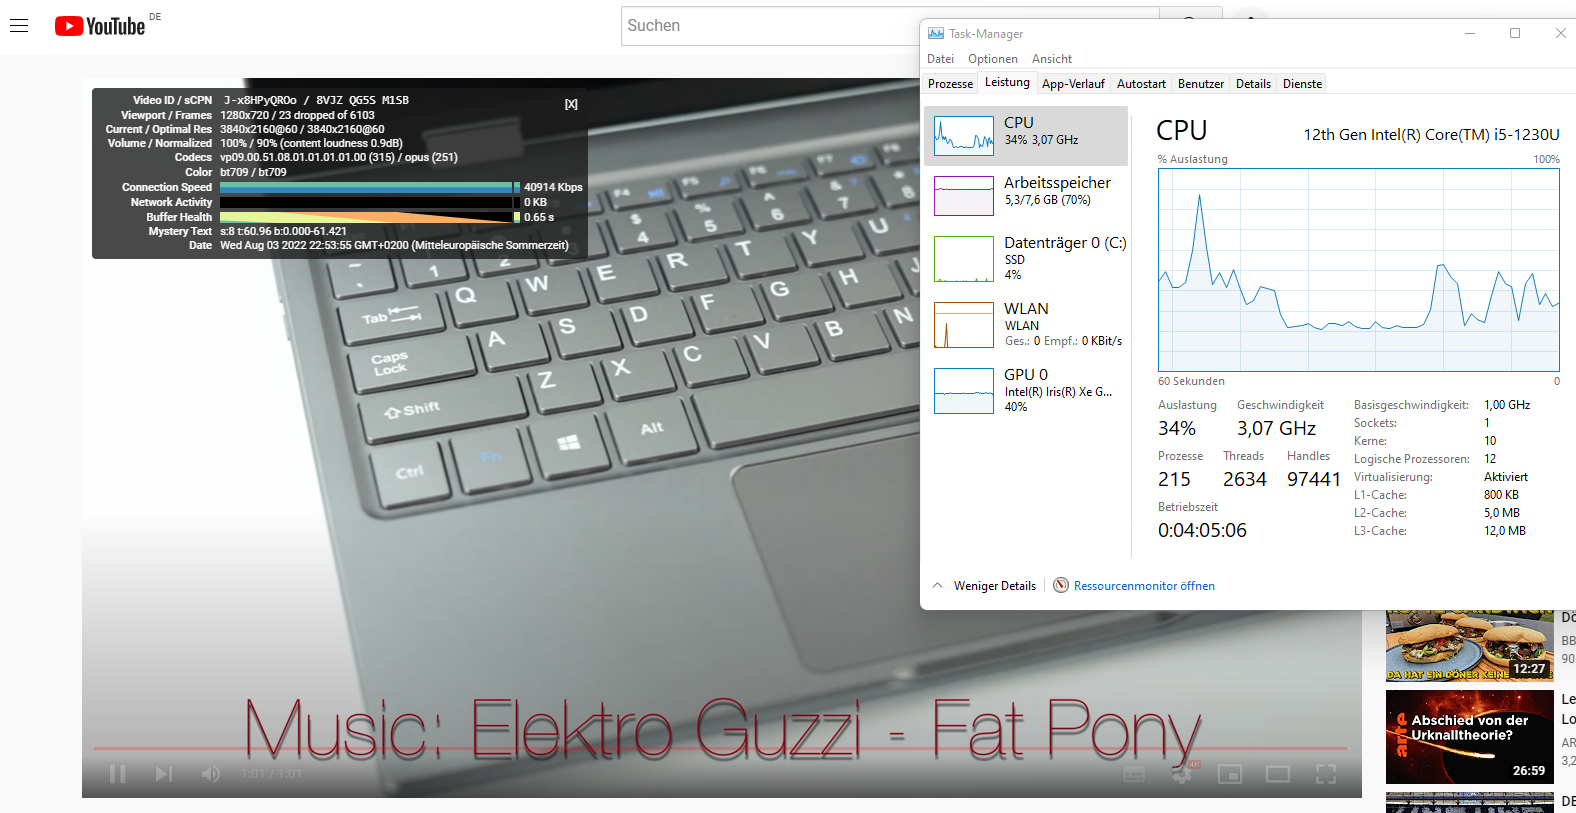
The XPS 13 does not have its DPC latencies under control and in its current driver and hardware state they exceed those of all competitors. The kernelmode driver is most notable with the ACPI being a close second. Realtime audio and video editing is thus not possible with the Alder Lake-U XPS. We experienced issues with dropped frames during the playback of 4K YouTube videos. Playing the aforementioned video results in an iGPU load of around 46 percent.
| DPC Latencies / LatencyMon - interrupt to process latency (max), Web, Youtube, Prime95 | |
| Dell XPS 13 9315, i5-1230U | |
| Dell XPS 13 Plus 9320 i5-1240p | |
| Lenovo ThinkPad X1 Nano-20UN002UGE | |
| Huawei MateBook 13s i5 11300H | |
| Dell XPS 13 Plus 9320 4K | |
| Asus Zenbook S 13 OLED | |
* ... smaller is better
Storage Solution
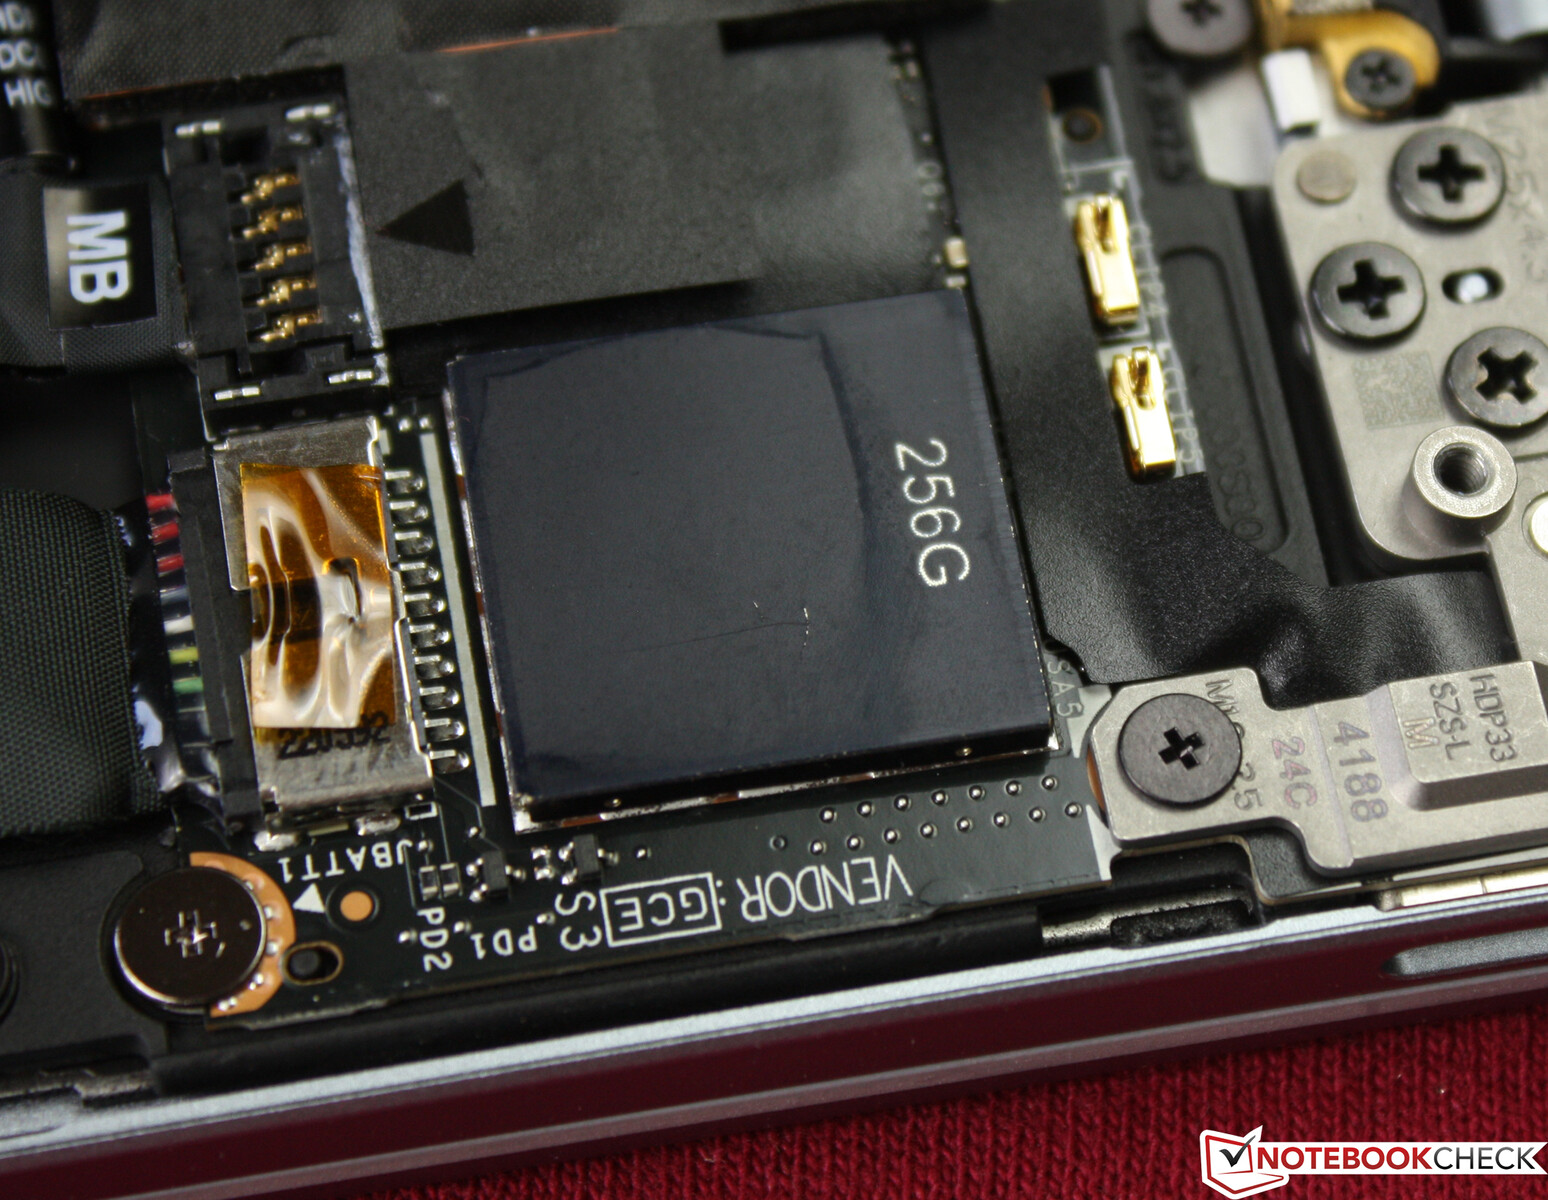
The Dell uses an SSD from Micron. The SSD does not come in the slotted M.2 form factor, but as a fixed onboard model. According to Micron, the SSD supports PCIe Gen4. The XPS 13 Plus uses M.2-2280 Samsung chips. Our test device has a storage capacity of just 256 GB, only 123 GB of which is available to users after the initial setup.
The Micron model consistently comes in last in our storage benchmarks and falls far behind what Phison Electronics and Samsung chips are able to achieve in competing laptops and Dell's own XPS 13 Plus. The distinction is once again made clear: If performance is what you are after, the XPS 13 Plus is the way to go.
More comparisons and benchmarks can be found in our comparison table.

* ... smaller is better
Disk Throttling: DiskSpd Read Loop, Queue Depth 8
GPU Performance
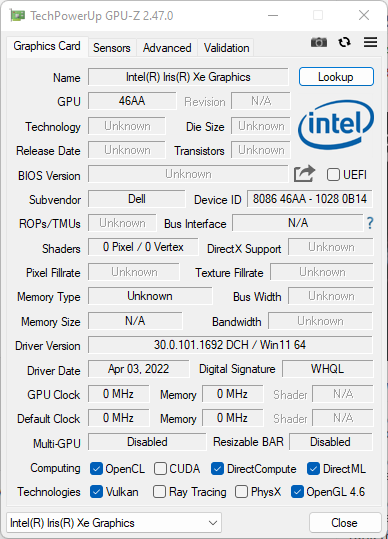
Alder Lake CPUs still rely on the well-known Iris Xe Graphics G7 first introduced with Tiger Lake processors. However, the performance here is slower and the Iris Xe in our test device comes in last in all benchmarks. The Iris Xe Graphics G7 80EUs is a popular iGPU choice with subpar performance in this case. The deficit compared to the Iris Xe Graphics G7 96EUs (Alder Lake P, XPS 13 Plus) is between 20 and 80 percent.
| 3DMark 06 Standard Score | 15617 points | |
| 3DMark 11 Performance | 4260 points | |
| 3DMark Cloud Gate Standard Score | 14350 points | |
| 3DMark Fire Strike Score | 3048 points | |
| 3DMark Time Spy Score | 1053 points | |
Help | ||
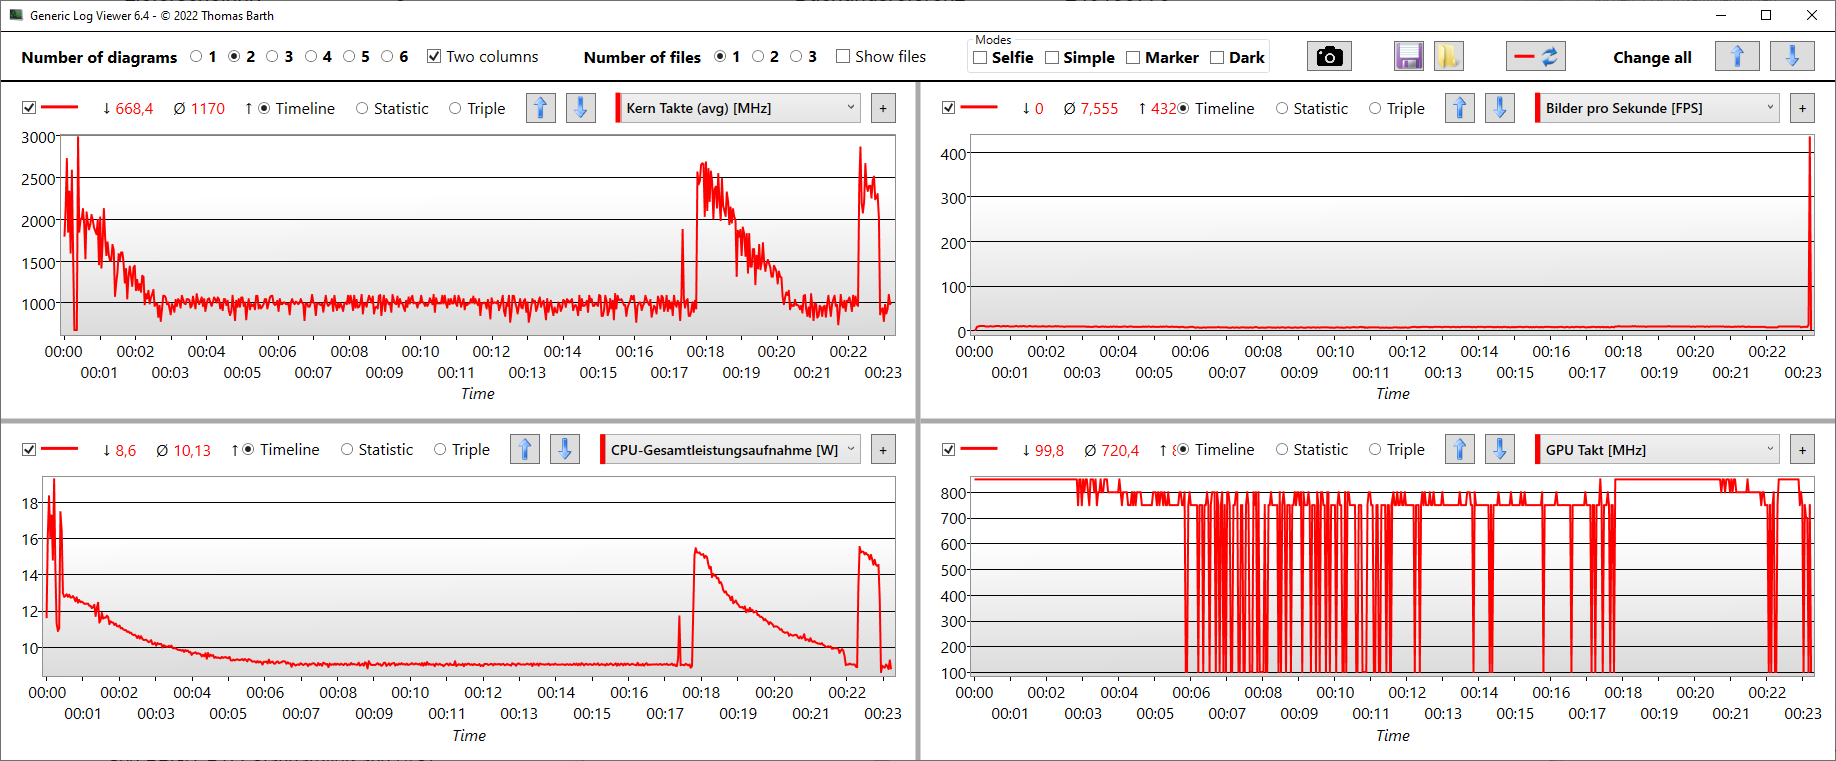
Gaming Performance
The XPS 13 is not suitable for gaming purposes and we even experienced visual glitches and crashes in 2022 titles such as Ghostwire Tokyo. As the FPS graph shows, both the FPS and the iGPU clock speeds (100-800 MHz) fluctuate wildly. Since it is more than sufficient for high-resolution videos, the Iris Xe Graphics is still suitable for day-to-day multimedia use. The GPU performance is slightly limited in battery mode. More GPU benchmarks can be found here.
| Ghostwire Tokyo - 1920x1080 Low Settings | |
| Dell XPS 13 9315, i5-1230U | |
| Average Intel Iris Xe Graphics G7 80EUs (13.5 - 25.8, n=2) | |
Witcher 3 FPS Graph
| low | med. | high | ultra | |
|---|---|---|---|---|
| GTA V (2015) | 31 | 10 | ||
| The Witcher 3 (2015) | 67 | 47 | 22 | 8 |
| Final Fantasy XV Benchmark (2018) | 18.9 | 10.8 | 5.24 | |
| Far Cry 5 (2018) | 22 | 14 | ||
| Strange Brigade (2018) | 47.5 | 6 | 17.8 | |
| Ghostwire Tokyo (2022) | 25 severe graphical problems (out of video memory) | 19 severe graphical problems (out of video memory) |
Emissions - The Most Economical Alder Lake Processor
System Noise
In undemanding scenarios, the single fan often idles and even when it is active, its shallow whirring is barely noticeable. This is the case during most daily tasks such as web browsing, One Drive picture synchronizations, or video playback. In more demanding situations, things quickly become noisy. We measured a maximum of 39.5 dB(A) during our stress test and when the CPU utilization is high. At least the very noticeable fan noise is not worsened by an annoying pitch.
Noise level
| Idle |
| 26 / 26 / 27.5 dB(A) |
| Load |
| 39.5 / 39.6 dB(A) |
 | ||
30 dB silent 40 dB(A) audible 50 dB(A) loud |
||
min: | ||
| Dell XPS 13 9315, i5-1230U Iris Xe G7 80EUs, i5-1230U, Micron 3460 256 GB Soldered | Dell XPS 13 Plus 9320 4K Iris Xe G7 96EUs, i7-1260P, Samsung PM9A1 MZVL21T0HCLR | Dell XPS 13 Plus 9320 i5-1240p Iris Xe G7 80EUs, i5-1240P, Micron 3400 MTFDKBA512TFH 512GB | Asus Zenbook S 13 OLED Radeon 680M, R7 6800U, Samsung PM9A1 MZVL21T0HCLR | Lenovo ThinkPad X1 Nano-20UN002UGE Iris Xe G7 96EUs, i7-1160G7, WDC PC SN530 SDBPNPZ-512G | Huawei MateBook 13s i5 11300H Iris Xe G7 80EUs, i5-11300H, Phison Electronics PS5012 | |
|---|---|---|---|---|---|---|
| Noise | -1% | -2% | 7% | 3% | 5% | |
| off / environment * (dB) | 26 | 24.4 6% | 26 -0% | 24 8% | 24.9 4% | 24.5 6% |
| Idle Minimum * (dB) | 26 | 24.4 6% | 26.2 -1% | 24 8% | 24.9 4% | 24.5 6% |
| Idle Average * (dB) | 26 | 24.4 6% | 26.2 -1% | 24 8% | 26.3 -1% | 24.5 6% |
| Idle Maximum * (dB) | 27.5 | 25.5 7% | 26.2 5% | 24 13% | 31.8 -16% | 28 -2% |
| Load Average * (dB) | 39.5 | 40.4 -2% | 38.4 3% | 33.1 16% | 34.3 13% | 35.9 9% |
| Witcher 3 ultra * (dB) | 39.6 | 45.5 -15% | 40.2 -2% | 34.3 13% | 35.9 9% | |
| Load Maximum * (dB) | 39.6 | 45.5 -15% | 47.1 -19% | 41.7 -5% | 37.5 5% | 38.6 3% |
* ... smaller is better
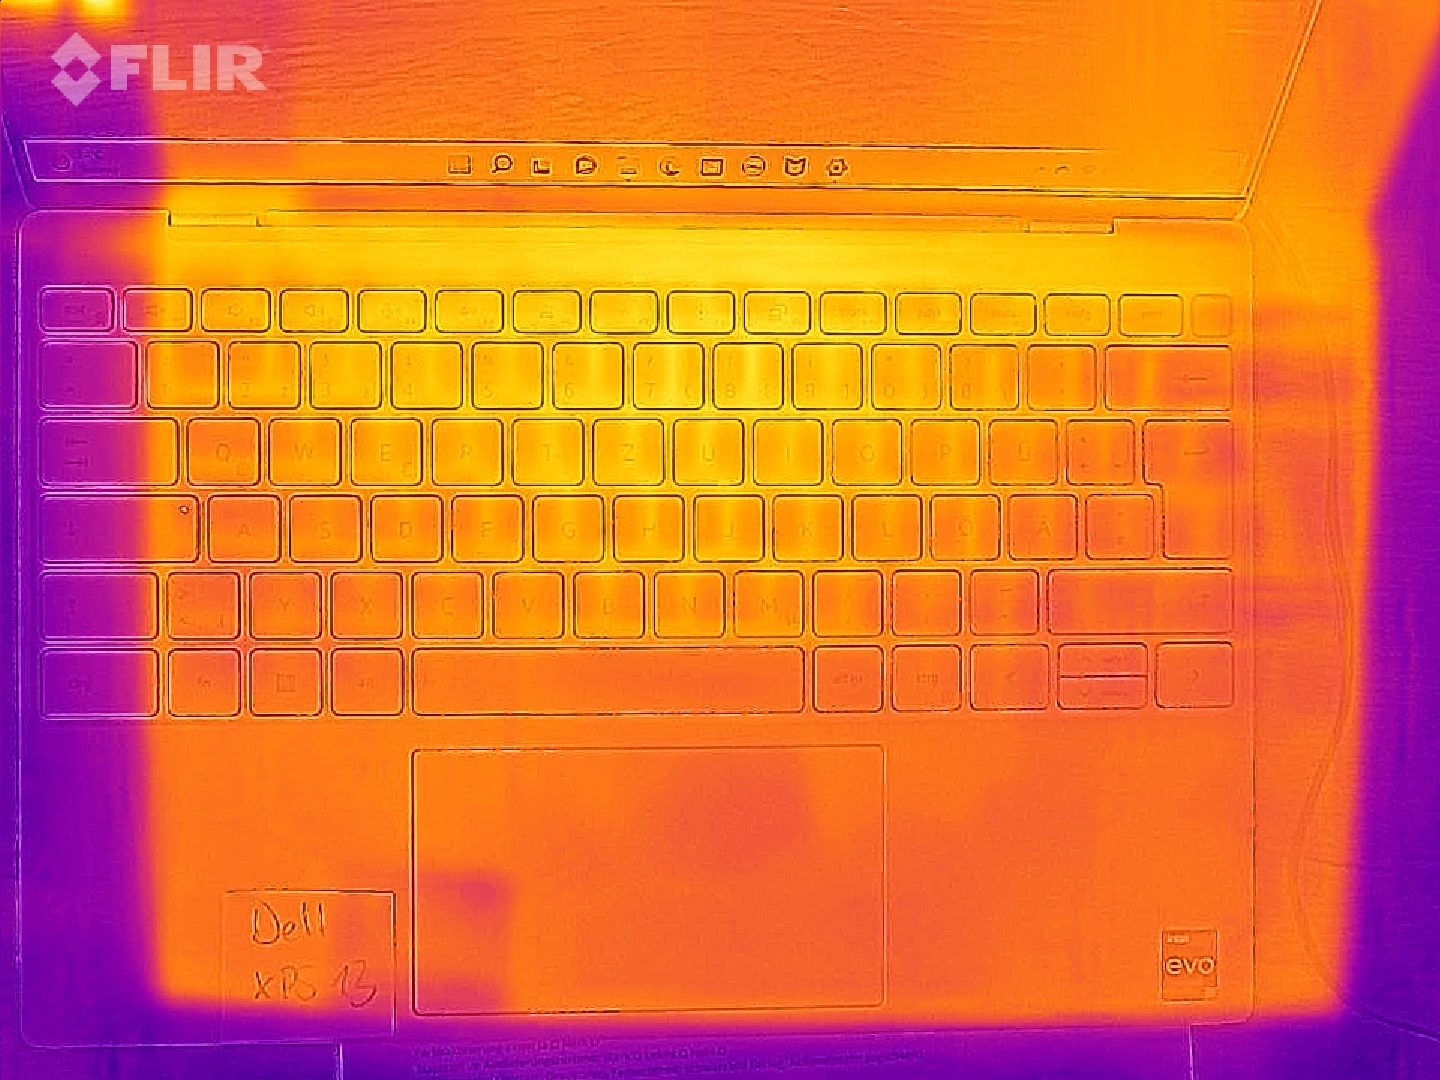
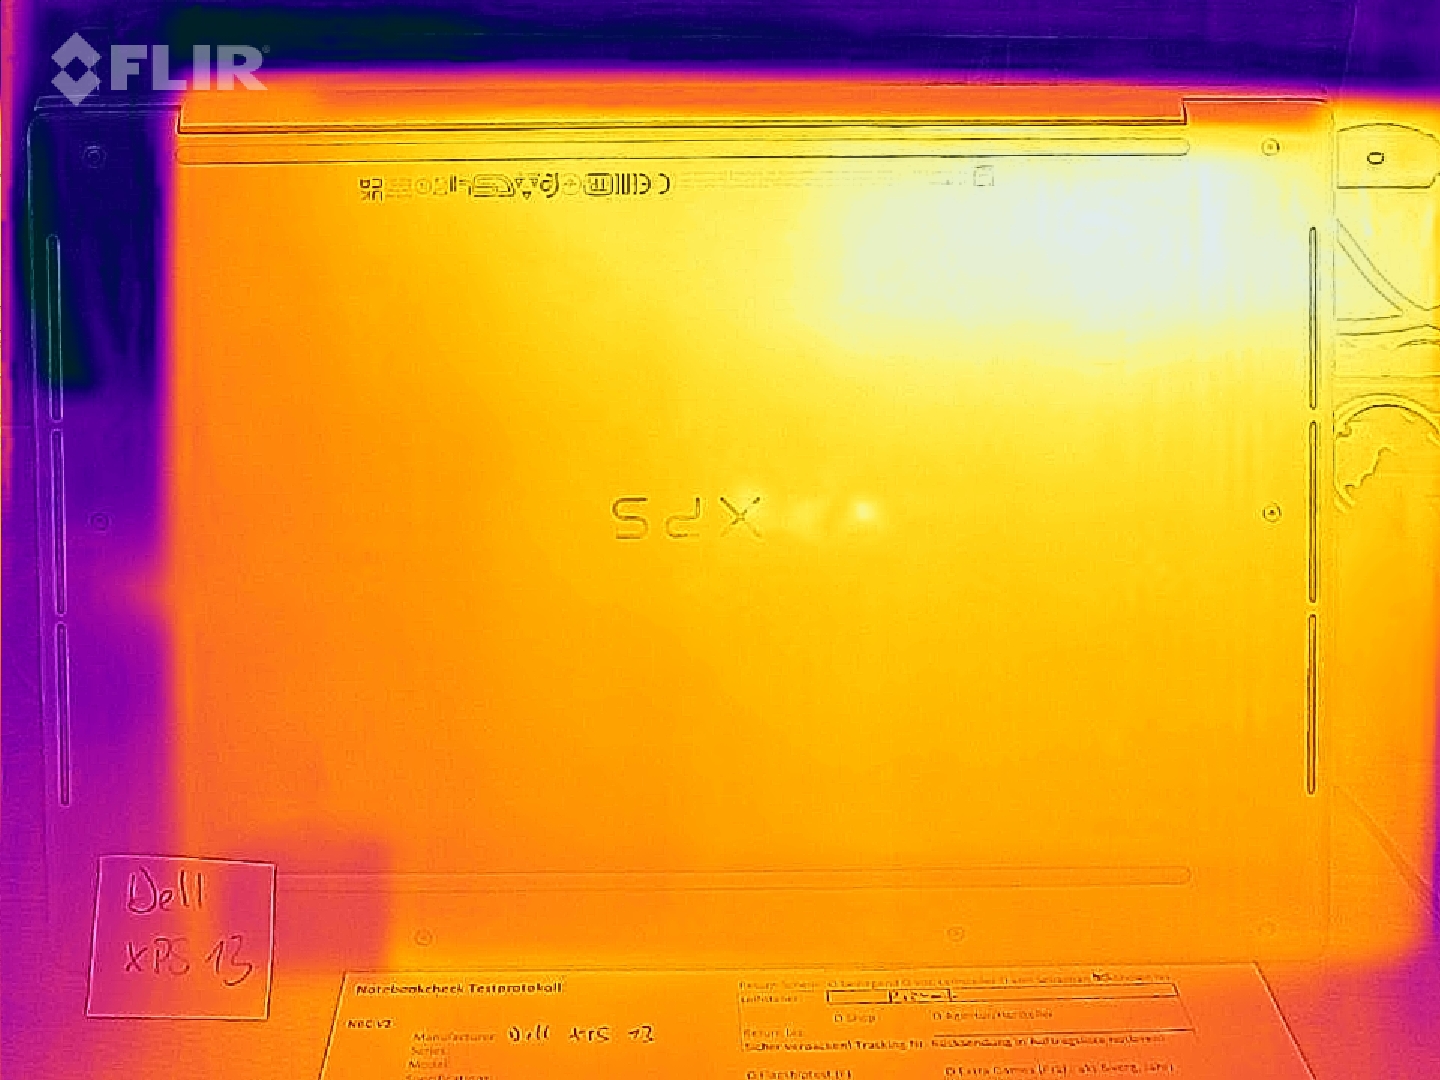
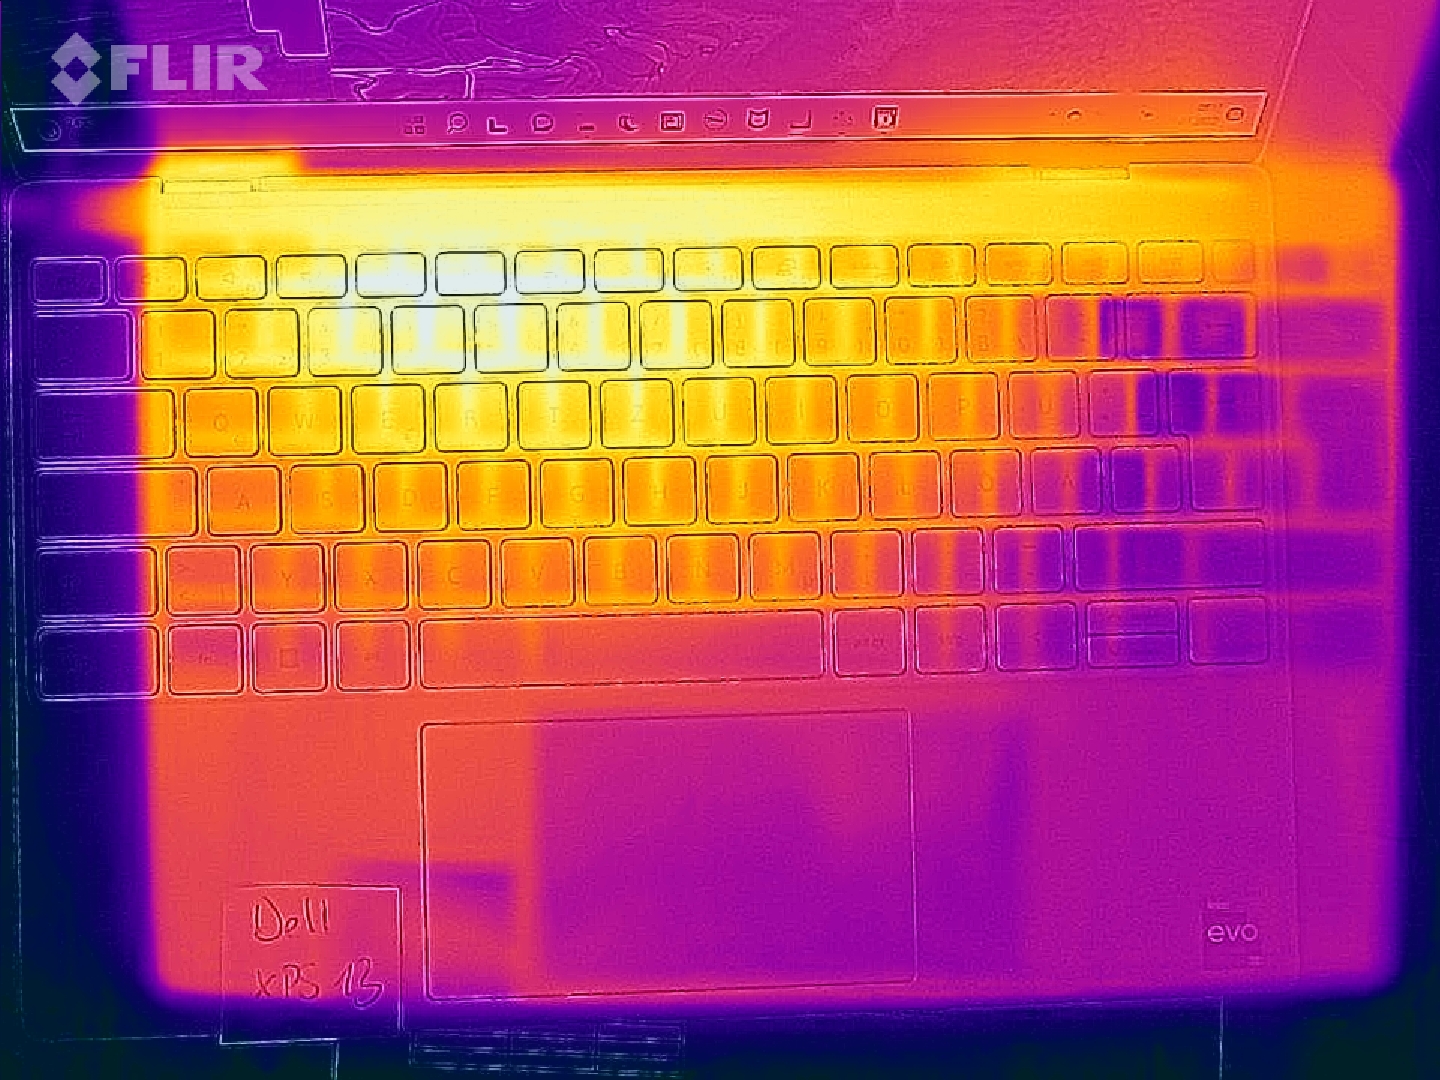
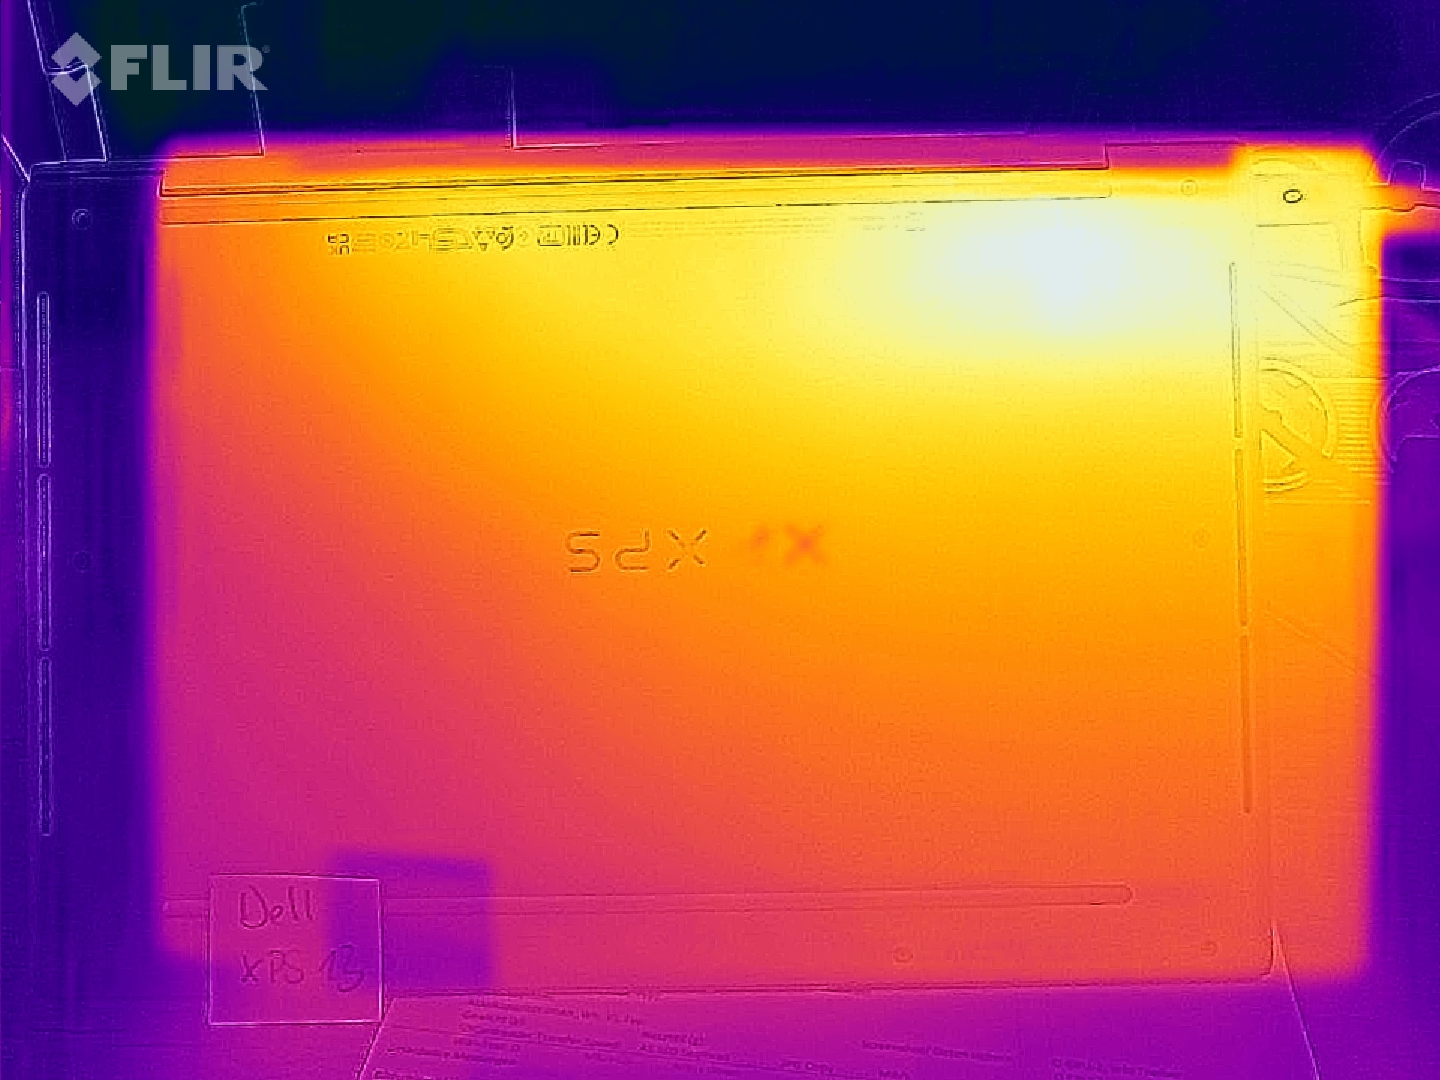
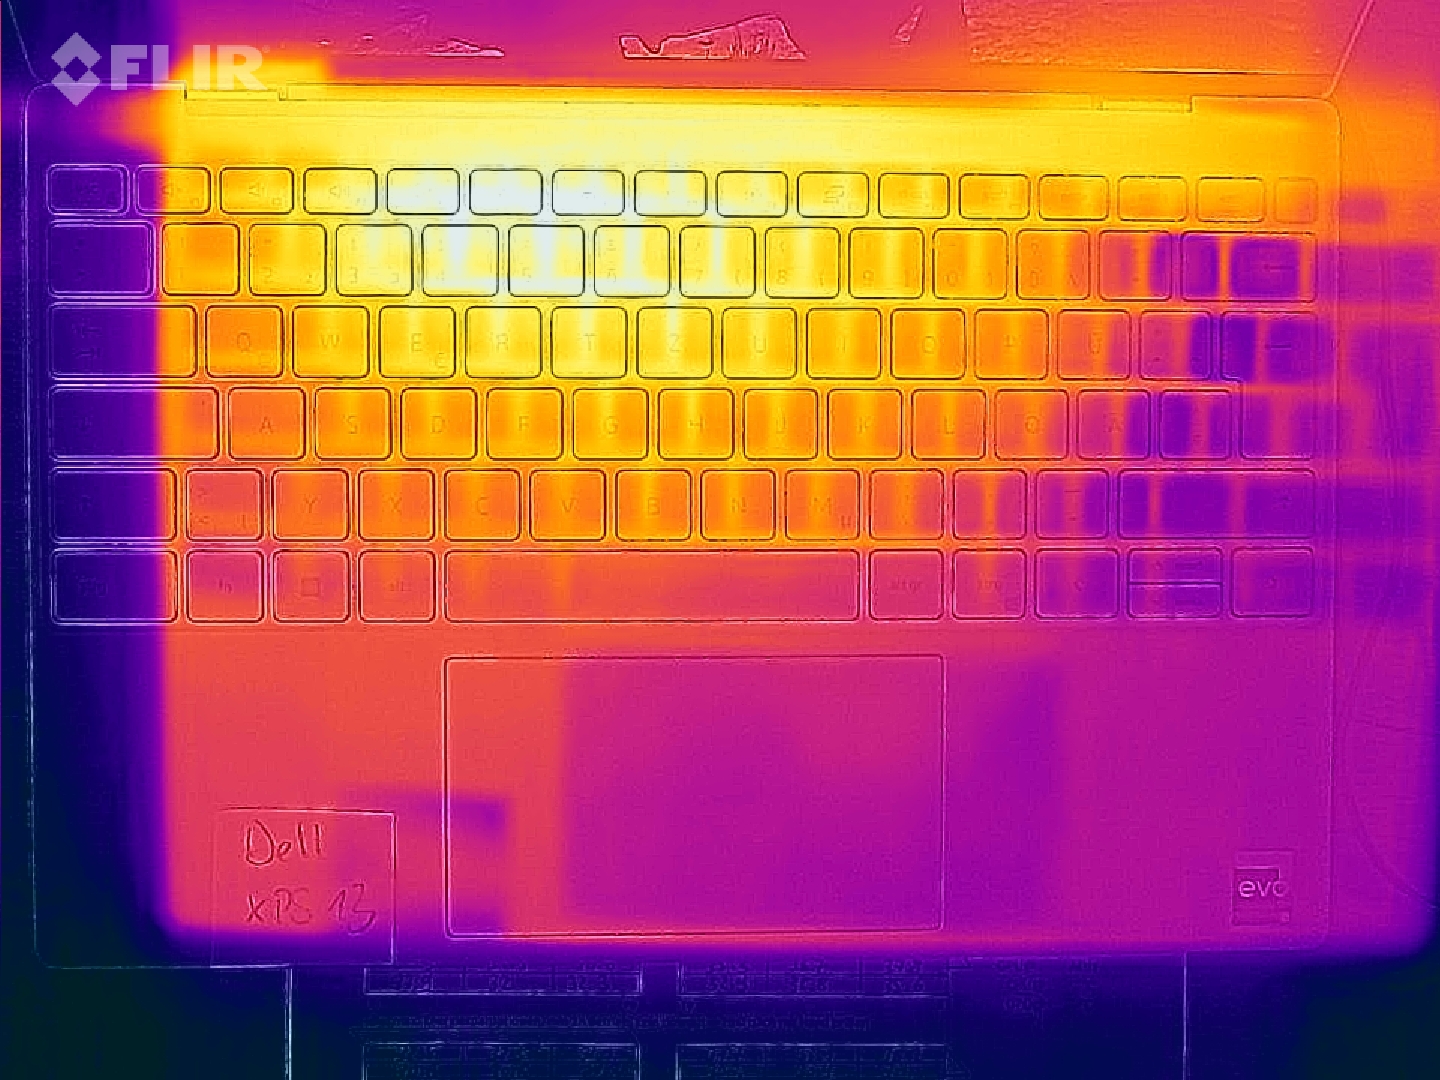
Temperature
The case of the XPS 13 remains pleasantly cool during day-to-day use and can be set down on your legs while travelling without any issues. Under a prolonged, very high load or while gaming, the bottom of the device and the upper part of the keyboard become particularly warm. Hotspots on the top and bottom reach up to 46 °C (114.8 °F) and 44 °C (111.2 °F), respectively. The compact 45-watt AC adapter only reaches 42 °C (107.6 °F).
(±) The maximum temperature on the upper side is 42.3 °C / 108 F, compared to the average of 35.9 °C / 97 F, ranging from 21.4 to 59 °C for the class Subnotebook.
(±) The bottom heats up to a maximum of 44.9 °C / 113 F, compared to the average of 39.3 °C / 103 F
(+) In idle usage, the average temperature for the upper side is 30.8 °C / 87 F, compared to the device average of 30.8 °C / 87 F.
(±) Playing The Witcher 3, the average temperature for the upper side is 36.5 °C / 98 F, compared to the device average of 30.8 °C / 87 F.
(+) The palmrests and touchpad are reaching skin temperature as a maximum (34.4 °C / 93.9 F) and are therefore not hot.
(-) The average temperature of the palmrest area of similar devices was 28.2 °C / 82.8 F (-6.2 °C / -11.1 F).
| Dell XPS 13 9315, i5-1230U Intel Core i5-1230U, Intel Iris Xe Graphics G7 80EUs | Dell XPS 13 Plus 9320 4K Intel Core i7-1260P, Intel Iris Xe Graphics G7 96EUs | Dell XPS 13 Plus 9320 i5-1240p Intel Core i5-1240P, Intel Iris Xe Graphics G7 80EUs | Apple MacBook Air 2020 M1 Entry Apple M1, Apple M1 7-Core GPU | Asus Zenbook S 13 OLED AMD Ryzen 7 6800U, AMD Radeon 680M | Lenovo ThinkPad X1 Nano-20UN002UGE Intel Core i7-1160G7, Intel Iris Xe Graphics G7 96EUs | Huawei MateBook 13s i5 11300H Intel Core i5-11300H, Intel Iris Xe Graphics G7 80EUs | |
|---|---|---|---|---|---|---|---|
| Heat | 8% | -17% | 11% | 2% | 13% | 12% | |
| Maximum Upper Side * (°C) | 42.3 | 41.1 3% | 47.6 -13% | 44 -4% | 47.9 -13% | 42.2 -0% | 42.8 -1% |
| Maximum Bottom * (°C) | 44.9 | 48.8 -9% | 57 -27% | 44 2% | 56.1 -25% | 47.5 -6% | 46.9 -4% |
| Idle Upper Side * (°C) | 32.5 | 28 14% | 38.8 -19% | 27 17% | 26.8 18% | 24.3 25% | 25.2 22% |
| Idle Bottom * (°C) | 38.2 | 29.3 23% | 41 -7% | 27 29% | 27.3 29% | 25.3 34% | 26 32% |
* ... smaller is better
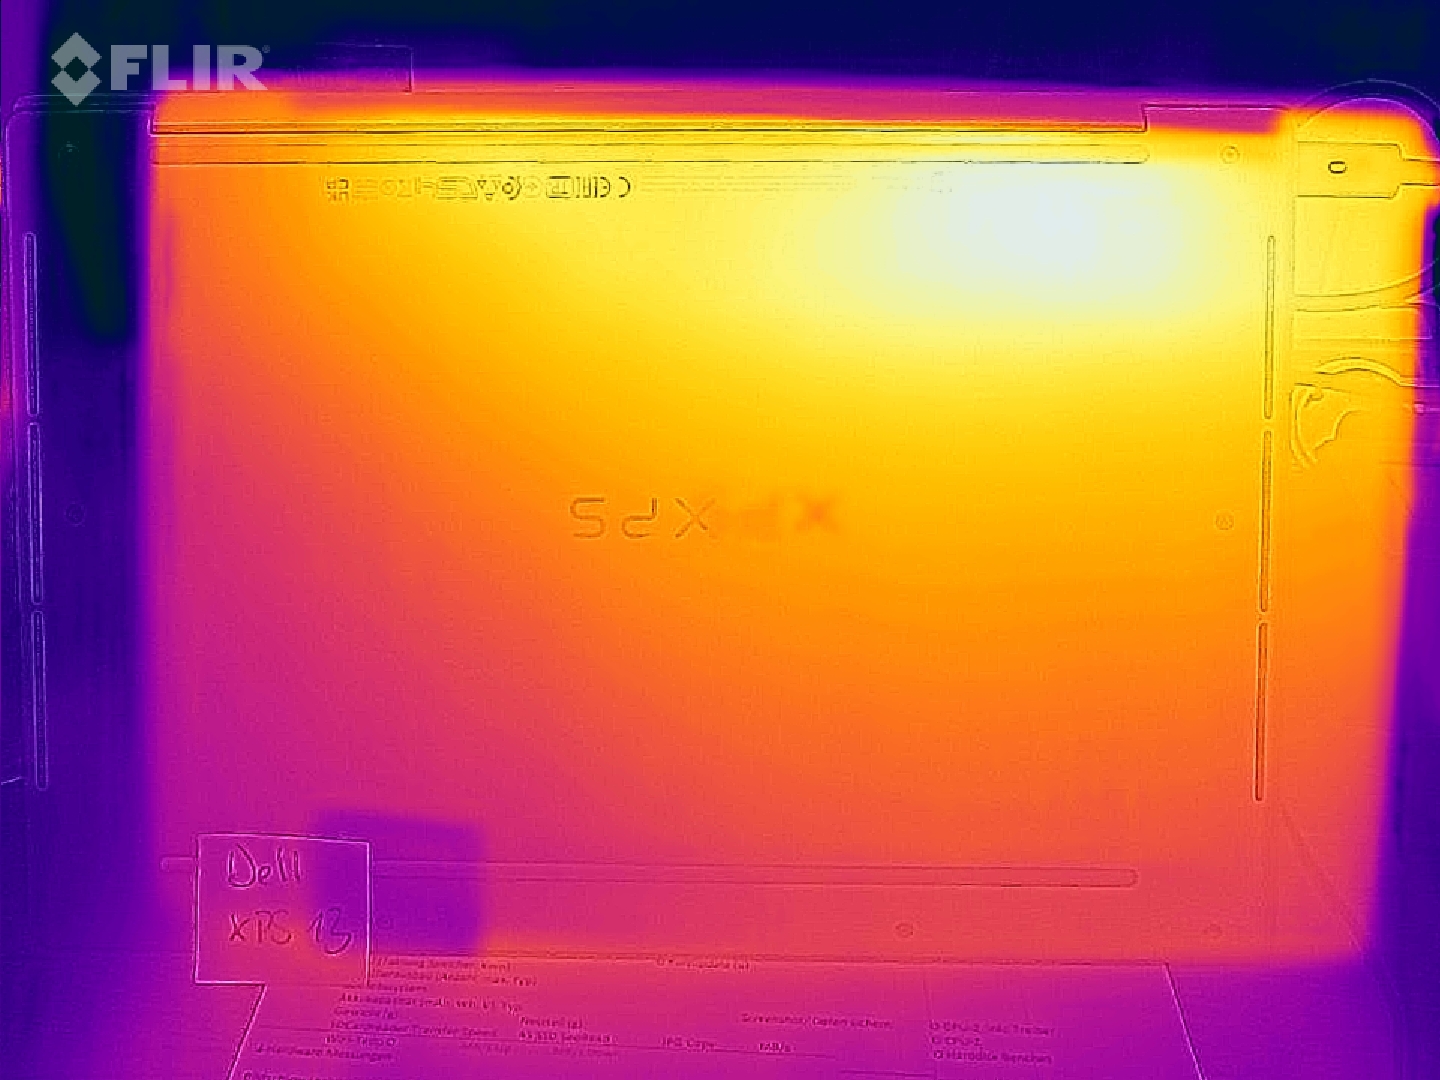
Stress Test
The clock speeds initially jump to 2.5 GHz after a few seconds for a temporary peak consumption of 29 watts (CPU). Subsequently, the consumption drops to less than 10 watts due to the clock speed throttling to around 1000 MHz. During our stress test, Prime95 and FurMark run in parallel for simultanous CPU and GPU stress. Every 5 minutes the CPU temporarily peaks at a consumption of 15 watts, although this only lasts for a few seconds and the clock speeds do not significantly increase, either.
Speakers
The speakers produce excellent sound that even holds up compared to the speakers of large gaming laptops. The woofer and tweeters are combined internally, at least for the right and left side. The bass is well-suited to games and movies. The maximum volume level is high considering the small size of the laptop. The speakers also do not distort at maximum volume.
Since our XPS 13 no longer comes with a headphone jack, the manufacturer includes a type-C-to-3.5mm dongle. With the sheer amount of Bluetooth headphones on the market, omitting the combined audio port may be justified. Still, this solution occupies one type-C port, while the other one is potentially being used for charging.
Voices captured by the two-way microphones above the webcam sound almost crystal-clear and remain homogenous even while changing the distance between the user and the microphone. This is a great solution for video calls. This microphone can be muted via an Fn shortcut.
Dell XPS 13 9315, i5-1230U audio analysis
(±) | speaker loudness is average but good (81.81 dB)
Bass 100 - 315 Hz
(±) | reduced bass - on average 11.6% lower than median
(±) | linearity of bass is average (10.7% delta to prev. frequency)
Mids 400 - 2000 Hz
(+) | balanced mids - only 1.6% away from median
(+) | mids are linear (5.8% delta to prev. frequency)
Highs 2 - 16 kHz
(+) | balanced highs - only 4.2% away from median
(±) | linearity of highs is average (7.1% delta to prev. frequency)
Overall 100 - 16.000 Hz
(+) | overall sound is linear (11.3% difference to median)
Compared to same class
» 11% of all tested devices in this class were better, 3% similar, 86% worse
» The best had a delta of 5%, average was 18%, worst was 53%
Compared to all devices tested
» 7% of all tested devices were better, 2% similar, 91% worse
» The best had a delta of 4%, average was 24%, worst was 134%
Asus Zenbook S 13 OLED audio analysis
(±) | speaker loudness is average but good (76.5 dB)
Bass 100 - 315 Hz
(±) | reduced bass - on average 12.6% lower than median
(±) | linearity of bass is average (11.1% delta to prev. frequency)
Mids 400 - 2000 Hz
(±) | higher mids - on average 5.8% higher than median
(+) | mids are linear (4.7% delta to prev. frequency)
Highs 2 - 16 kHz
(+) | balanced highs - only 2.6% away from median
(+) | highs are linear (5.3% delta to prev. frequency)
Overall 100 - 16.000 Hz
(+) | overall sound is linear (14.7% difference to median)
Compared to same class
» 30% of all tested devices in this class were better, 5% similar, 65% worse
» The best had a delta of 5%, average was 18%, worst was 53%
Compared to all devices tested
» 19% of all tested devices were better, 4% similar, 77% worse
» The best had a delta of 4%, average was 24%, worst was 134%
Dell XPS 13 9310 Core i7 FHD audio analysis
(+) | speakers can play relatively loud (84.6 dB)
Bass 100 - 315 Hz
(-) | nearly no bass - on average 16.1% lower than median
(±) | linearity of bass is average (13.1% delta to prev. frequency)
Mids 400 - 2000 Hz
(+) | balanced mids - only 2.6% away from median
(+) | mids are linear (4.6% delta to prev. frequency)
Highs 2 - 16 kHz
(+) | balanced highs - only 1.3% away from median
(+) | highs are linear (4% delta to prev. frequency)
Overall 100 - 16.000 Hz
(+) | overall sound is linear (10.7% difference to median)
Compared to same class
» 8% of all tested devices in this class were better, 3% similar, 89% worse
» The best had a delta of 5%, average was 18%, worst was 53%
Compared to all devices tested
» 5% of all tested devices were better, 2% similar, 93% worse
» The best had a delta of 4%, average was 24%, worst was 134%
Energy Management - Portable, Energy-Efficient Laptop from Dell
Energy Consumption
The slow performance compared to the Plus version suggests that our XPS is a world champion when it comes to energy efficiency. This turns out to be true and we measured a consumption of 24 watts during an average workload. In this scenario, the Plus version with the Alder Lake-P 1240P consumes 43 and the 1260P almost 49 watts. The "Consumption Witcher 3/Stress Test" shows the glaring differences between Alder Lake-U and -P, particularly when the SoCs are under continuous load.
During the stress test, the consumption stabilizes at 27 watts, and remains constant at that level. Scores from a benchmark performed directly after the stress test were not adversely affected.
| Off / Standby | |
| Idle | |
| Load |
|
Key:
min: | |
| Dell XPS 13 9315, i5-1230U i5-1230U, Iris Xe G7 80EUs, Micron 3460 256 GB Soldered, IPS, 1920x1200, 13.4" | Apple MacBook Air 2020 M1 Entry M1, M1 7-Core GPU, Apple SSD AP0256Q, IPS, 2560x1600, 13.3" | Asus Zenbook S 13 OLED R7 6800U, Radeon 680M, Samsung PM9A1 MZVL21T0HCLR, OLED, 2880x1800, 13.3" | Lenovo ThinkPad X1 Nano-20UN002UGE i7-1160G7, Iris Xe G7 96EUs, WDC PC SN530 SDBPNPZ-512G, IPS, 2160x1350, 13" | Huawei MateBook 13s i5 11300H i5-11300H, Iris Xe G7 80EUs, Phison Electronics PS5012, LTPS, 2520x1680, 13.4" | Dell XPS 13 Plus 9320 4K i7-1260P, Iris Xe G7 96EUs, Samsung PM9A1 MZVL21T0HCLR, IPS, 3840x2400, 13.4" | Dell XPS 13 Plus 9320 i5-1240p i5-1240P, Iris Xe G7 80EUs, Micron 3400 MTFDKBA512TFH 512GB, IPS, 1920x1200, 13.4" | Average Intel Iris Xe Graphics G7 80EUs | Average of class Subnotebook | |
|---|---|---|---|---|---|---|---|---|---|
| Power Consumption | 16% | -48% | -11% | -43% | -86% | -97% | -30% | -32% | |
| Idle Minimum * (Watt) | 3.6 | 1.9 47% | 4.8 -33% | 3.3 8% | 4.2 -17% | 7 -94% | 10 -178% | 4.47 ? -24% | 3.94 ? -9% |
| Idle Average * (Watt) | 6.8 | 6.4 6% | 8.7 -28% | 5.7 16% | 8.1 -19% | 11 -62% | 12.3 -81% | 7.37 ? -8% | 6.85 ? -1% |
| Idle Maximum * (Watt) | 6.8 | 7 -3% | 10.1 -49% | 9.1 -34% | 9 -32% | 11.4 -68% | 15.5 -128% | 9.24 ? -36% | 8.41 ? -24% |
| Load Average * (Watt) | 24 | 25 -4% | 45.6 -90% | 29.6 -23% | 41.7 -74% | 59.7 -149% | 43 -79% | 36.6 ? -53% | 43.8 ? -83% |
| Witcher 3 ultra * (Watt) | 23.6 | 42.4 -80% | 27.7 -17% | 40.1 -70% | 49.4 -109% | 43.1 -83% | |||
| Load Maximum * (Watt) | 47 | 30.3 36% | 49.5 -5% | 55.1 -17% | 68 -45% | 63 -34% | 62.8 -34% | 61.7 ? -31% | 66.6 ? -42% |
* ... smaller is better
Consumption Witcher 3/Stress Test
Consumption external Monitor
Battery Life
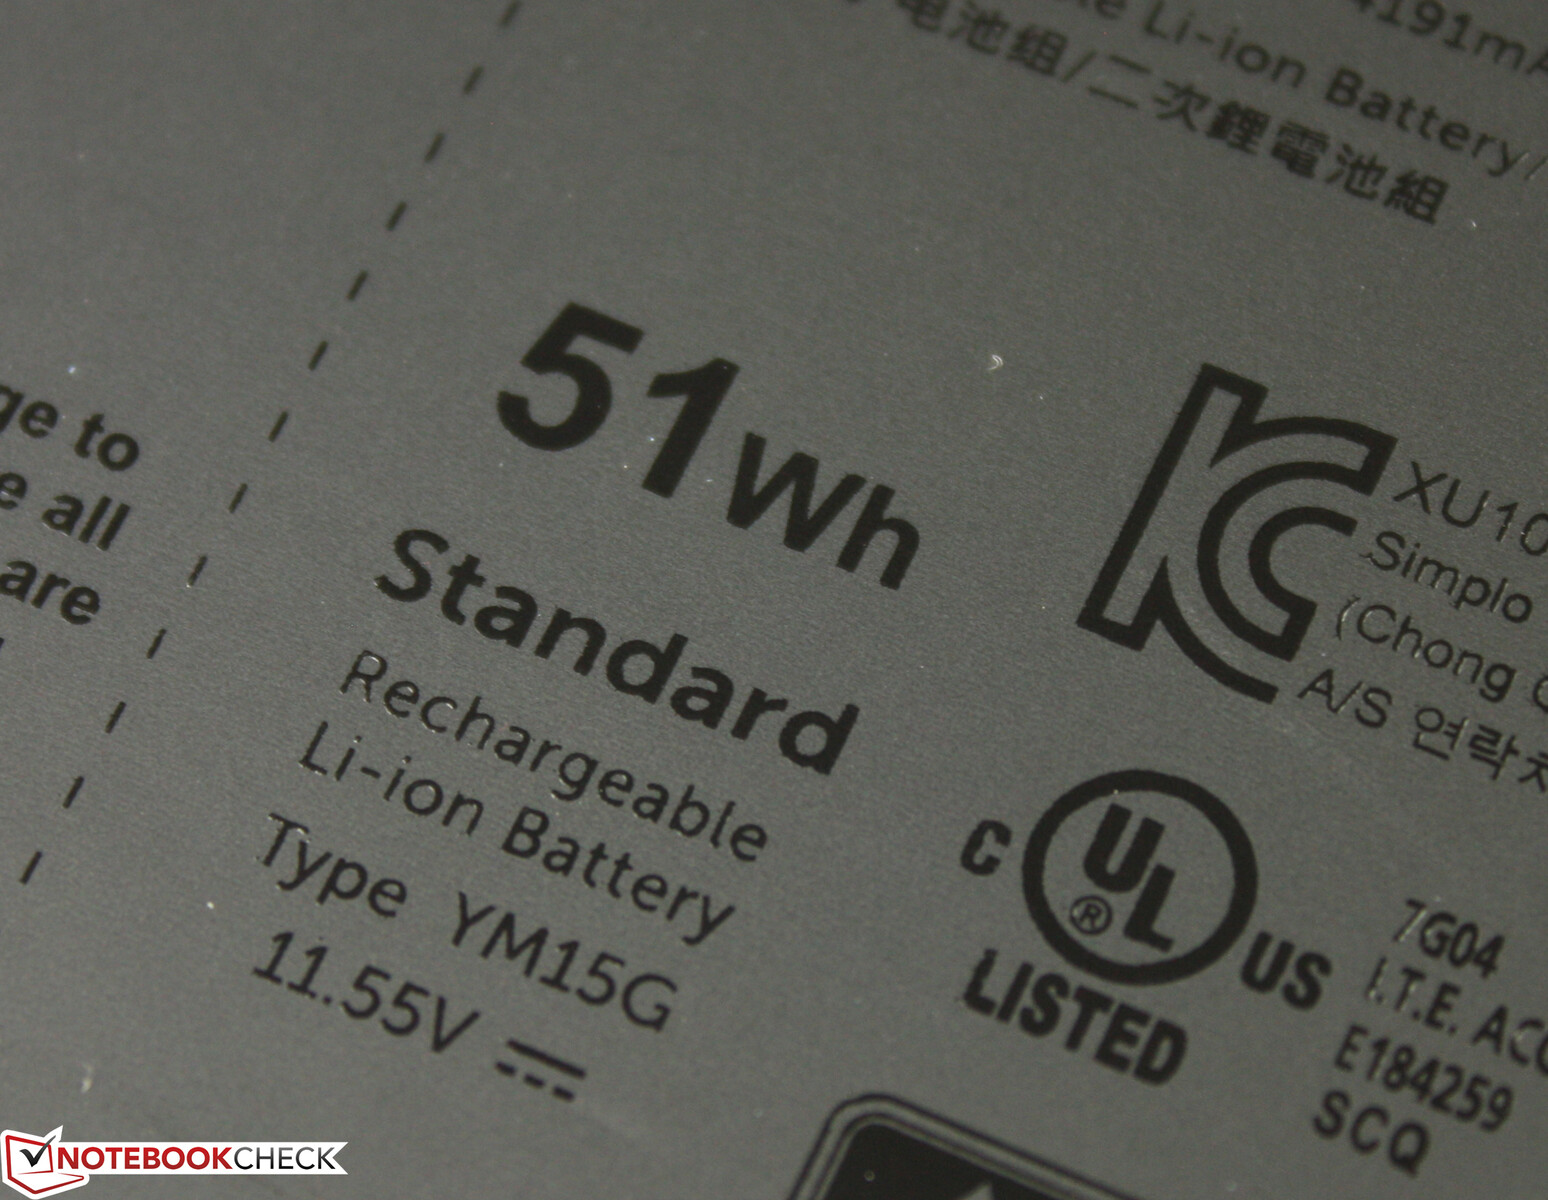
With a runtime of almost 15 hours in our Wi-Fi test at a reduced brightness (150 nits), the XPS 13 with Alder Lake-U flexes its muscles. Even at maximum brightness, it runs the test for 10:22 hours, which is even more impressive considering the XPS' very high maximum brightness (406 nits, slightly lower while on battery). Unlike the Plus, the basic XPS laptop comes with a a 51-Wh instead of a 55-Wh battery. The Battery Eater load test runs for an unusually long time at maximum brightness, which should not come as a surprise considering the slow performance of the SoC.
| Dell XPS 13 9315, i5-1230U i5-1230U, Iris Xe G7 80EUs, 51 Wh | Apple MacBook Air 2020 M1 Entry M1, M1 7-Core GPU, 49.9 Wh | Asus Zenbook S 13 OLED R7 6800U, Radeon 680M, 67 Wh | Lenovo ThinkPad X1 Nano-20UN002UGE i7-1160G7, Iris Xe G7 96EUs, 48.2 Wh | Huawei MateBook 13s i5 11300H i5-11300H, Iris Xe G7 80EUs, 60 Wh | Dell XPS 13 Plus 9320 4K i7-1260P, Iris Xe G7 96EUs, 55 Wh | Dell XPS 13 Plus 9320 i5-1240p i5-1240P, Iris Xe G7 80EUs, 55 Wh | Average of class Subnotebook | |
|---|---|---|---|---|---|---|---|---|
| Battery runtime | 8% | -23% | -36% | -37% | -52% | -42% | -17% | |
| WiFi v1.3 (h) | 14.8 | 16 8% | 9.2 -38% | 9.9 -33% | 9.4 -36% | 6.9 -53% | 8 -46% | 13.5 ? -9% |
| Load (h) | 2.6 | 2.4 -8% | 1.6 -38% | 1.6 -38% | 1.3 -50% | 1.6 -38% | 1.938 ? -25% | |
| H.264 (h) | 15.2 | 15.4 | 11 | 11 | 16.6 ? |
Pros
Cons
Verdict - Half the Performance, Twice the Battery Life
Limited performance as a tradeoff for excellent portability - the low-end 2022 XPS 13 with Alder Lake-U CPUs and an IPS FHD panel is an compelling device for light office work. With a ridiculous battery runtime of almost 15 hours, it doubles the result of its sister model XPS 13 Plus. Dell relies on a bright display suitable for daily use, there are two Thunderbolt 4 ports and speakers with a woofer and a tweeter. Thanks to this, watching a movie using the integrated speakers is an enjoyable experience.
Perhaps this is the reason for the lack of a headphone jack and a card reader? Or is it the minimalistic concept? In any case, it is possible to make a laptop setup with just two type-C ports, one of which is occupied by the AC adapter, work, provided you are prepared to do so. However, there is an invisible obstacle on the inside, since the XPS 13 cannot be upgraded in any way. The RAM, Wi-Fi module, and SSD are all fixed. This needs to be taken into consideration when opting for a low-end model with 256 GB storage.
Long battery life, a solid chassis, input devices fit for day-to-day use, and subwoofer-enhanced sound - even the entry-level XPS 13 can bring joy.
There are tradeoffs in terms of the performance and the Alder Lake-U chip does not compare favorably to other subnotebooks with the same CPU. The performance deficit compared to the Alder Lake-P CPUs inside the XPS 13 Plus is very significant. At least Dell draws a clear line: If you are after performance, the Plus is the only option. For web browsing, entertainment, and mail purposes, the basic XPS version is sufficient.
The new XPS series: Divided into two performance classes. The basic XPS focuses on portability instead of trying to squeeze the last bit of performance out of its components.
The low-end XPS 13 falls behind compared to the Zenbook S 13 with the AMD Ryzen 6000 CPU and even compared to the Apple MacBook Air M1, the XPS 13 struggles. Thus, the comparison with the new MacBook Air M2, which we are also currently reviewing, is unlikely to paint the Dell in a favorable light, even when focusing on the XPS 13 Plus.
The author is currently reviewing the XPS 13 Plus base model with an FHD display, 512 GB, and Alder Lake-P Core i5. We also reviewed the XPS 13 Plus with 4K and an i7: Das XPS 13 now has a Touch Bar.
Price and Availability
The 2022 XPS 13 9315 is now available from Dell's online store starting from 999 USD. The Plus model starts at 1299 USD.
Dell XPS 13 9315, i5-1230U
- 08/05/2022 v7 (old)
Sebastian Jentsch

