

Lenovo ThinkBook 15p 4K laptop review: Multimedia allrounder with a great 4K display but weak connections
The ThinkBooks form Lenovo's intersection between the IdeaPads for consumers and the ThinkPads for business users. The new ThinkBook 15p represents a spin-off from last year's ThinkBook 15. Lenovo now includes a Geforce 1650 Ti Max-Q, resulting in the ThinkBook offering almost the same equipment as the ThinkPad X1 Extreme Gen3, only at a lower price.
However, you should not confuse the ThinkBook 15p with the ThinkBook 15 Gen2, since their equipment characteristics are very different. The model without the "p" in the label has a ULV processor (Intel Gen 11) and better connections (Thunderbolt 4, USB 3.2 Gen2), while our "p" test unit scores with a dedicated GPU and a significantly brighter display (600 vs. 250/300 nits), but lacks the other advantages.
Possible Competitors in Comparison
Rating | Date | Model | Weight | Height | Size | Resolution | Price |
|---|---|---|---|---|---|---|---|
| 86.4 % v7 (old) | 03 / 2021 | Lenovo ThinkBook 15p Gen1 4K i7-10750H, GeForce GTX 1650 Ti Max-Q | 2 kg | 19.9 mm | 15.60" | 3840x2160 | |
| 81.8 % v7 (old) | 02 / 2020 | Lenovo ThinkBook 15 i5-10210U, UHD Graphics 620 | 1.9 kg | 18.9 mm | 15.60" | 1920x1080 | |
| 90.1 % v7 (old) | 01 / 2021 | Lenovo ThinkPad X1 Extreme Gen3-20TLS0UV00 i7-10750H, GeForce GTX 1650 Ti Max-Q | 1.7 kg | 18.7 mm | 15.60" | 1920x1080 | |
| 87 % v7 (old) | 12 / 2020 | Asus ZenBook UX535-M01440 i7-10750H, GeForce GTX 1650 Ti Max-Q | 2 kg | 20 mm | 15.60" | 3840x2160 | |
| 87.7 % v7 (old) | 12 / 2020 | Schenker Vision 15 i7-1165G7, Iris Xe G7 96EUs | 1.7 kg | 15 mm | 15.60" | 1920x1080 | |
| 78.6 % v7 (old) | 09 / 2020 | Asus VivoBook 15 K571LI-PB71 i7-10750H, GeForce GTX 1650 Ti Mobile | 2.1 kg | 21.9 mm | 15.60" | 1920x1080 |
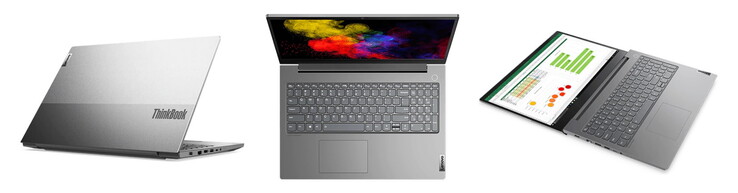
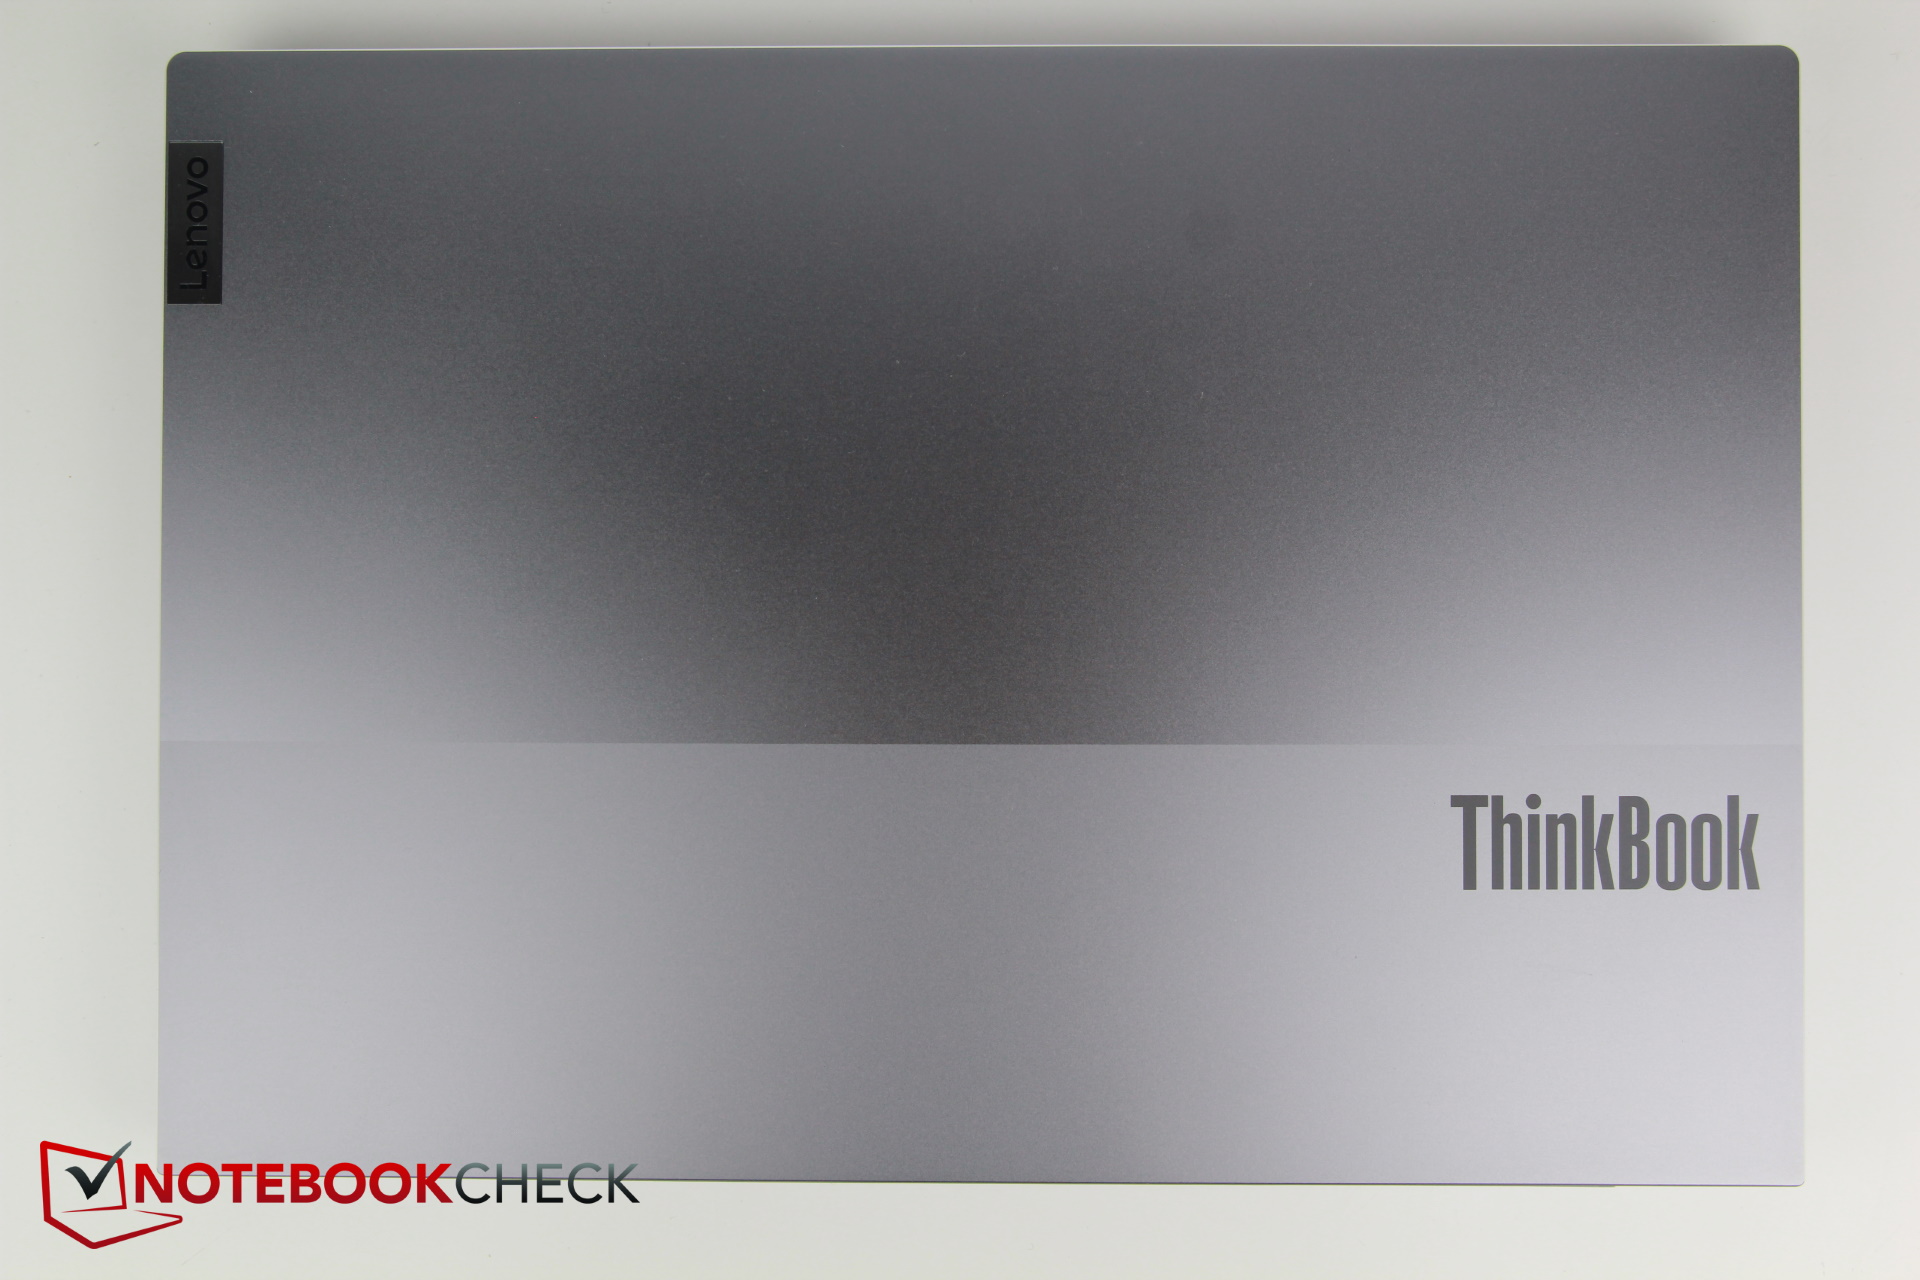
Case - Silver aluminum for the ThinkBooks
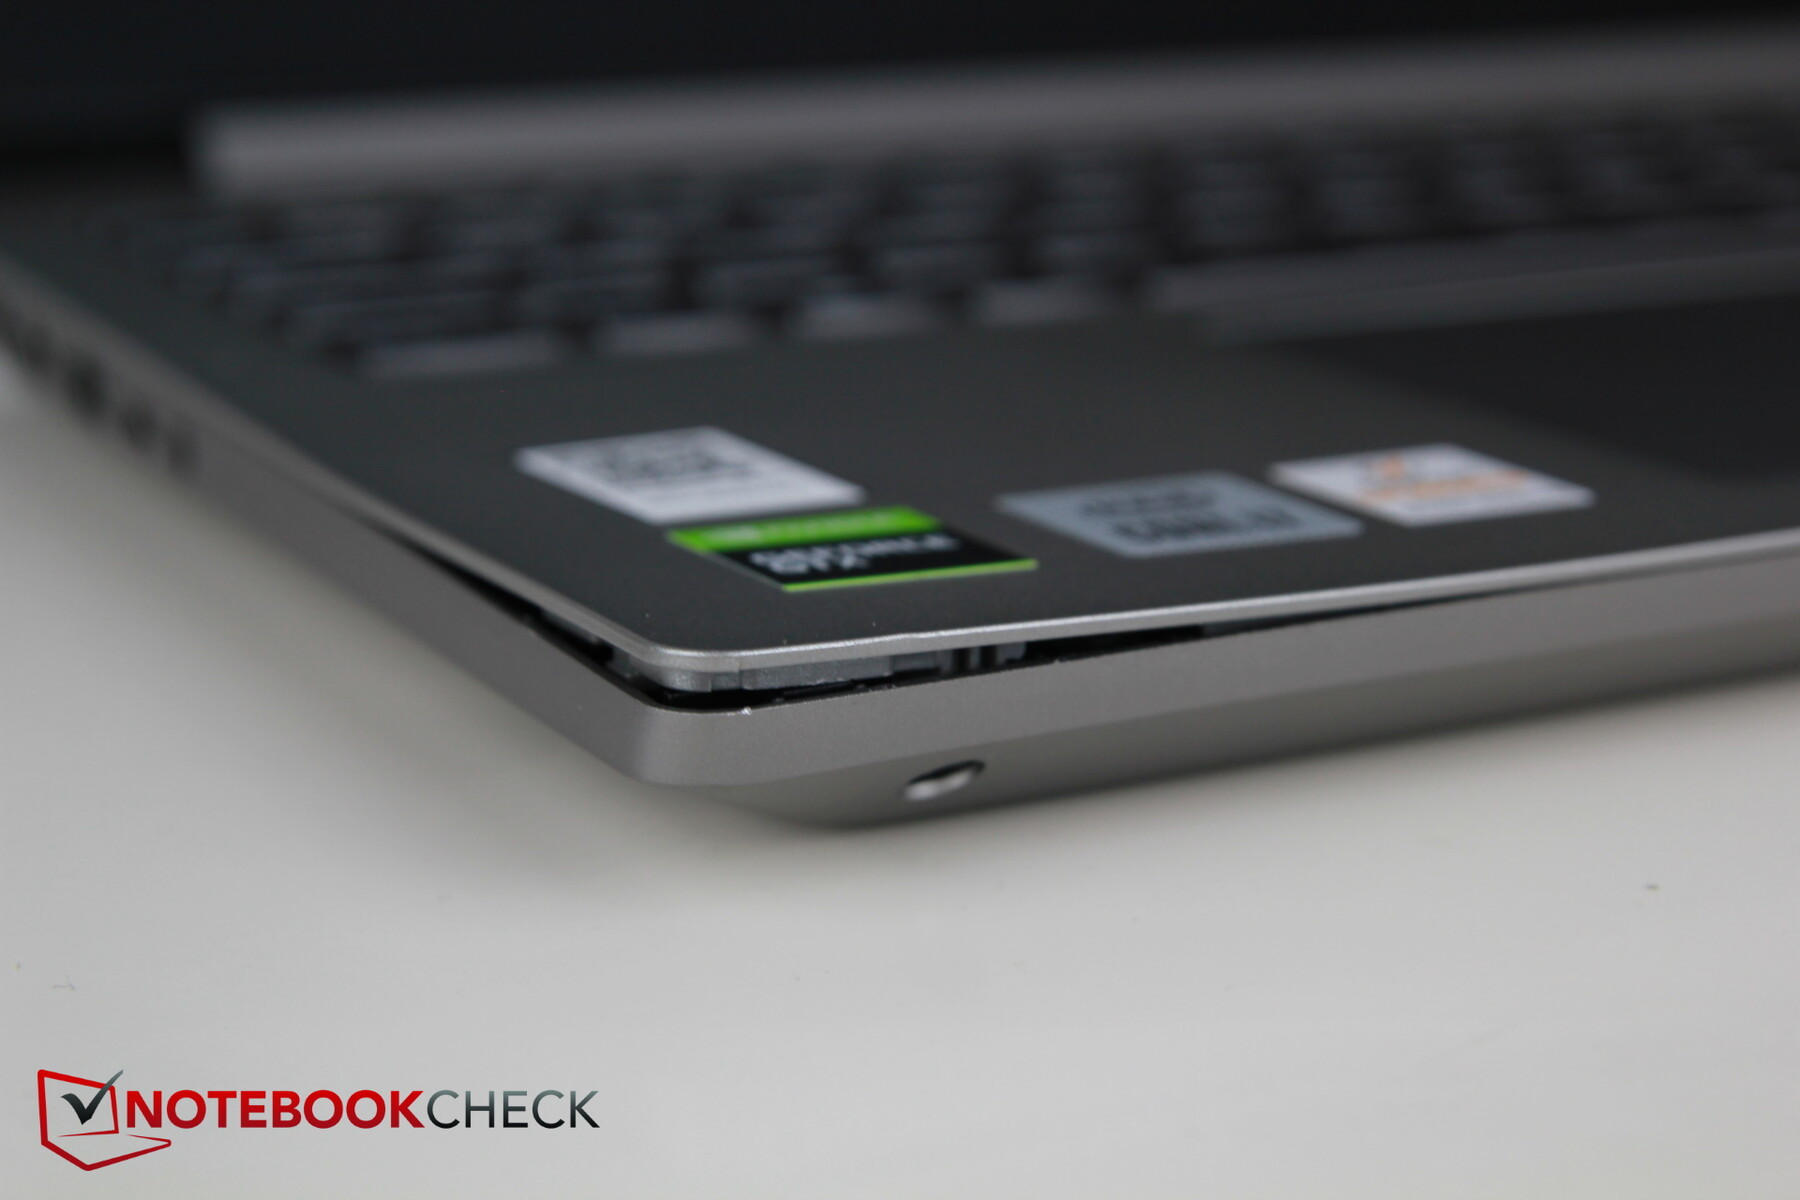
As case material, mainly silver-gray aluminum is used again. In contrast to the quasi predecessor, the ThinkBook 15 Gen1, even the bottom plate now appears to be made from thin metal. Plastic is only used around the display bezels and on the hinge. Accordingly, the overall stability is very good. Of course, the display lid can be bent slightly, but it is still relatively stable, and when it is pressed in, the display remains unaffected. The hinge is sufficiently tight, and the lid can be opened up to 180 degrees.
The workmanship appears good overall, and we did not notice any unusually large gaps.
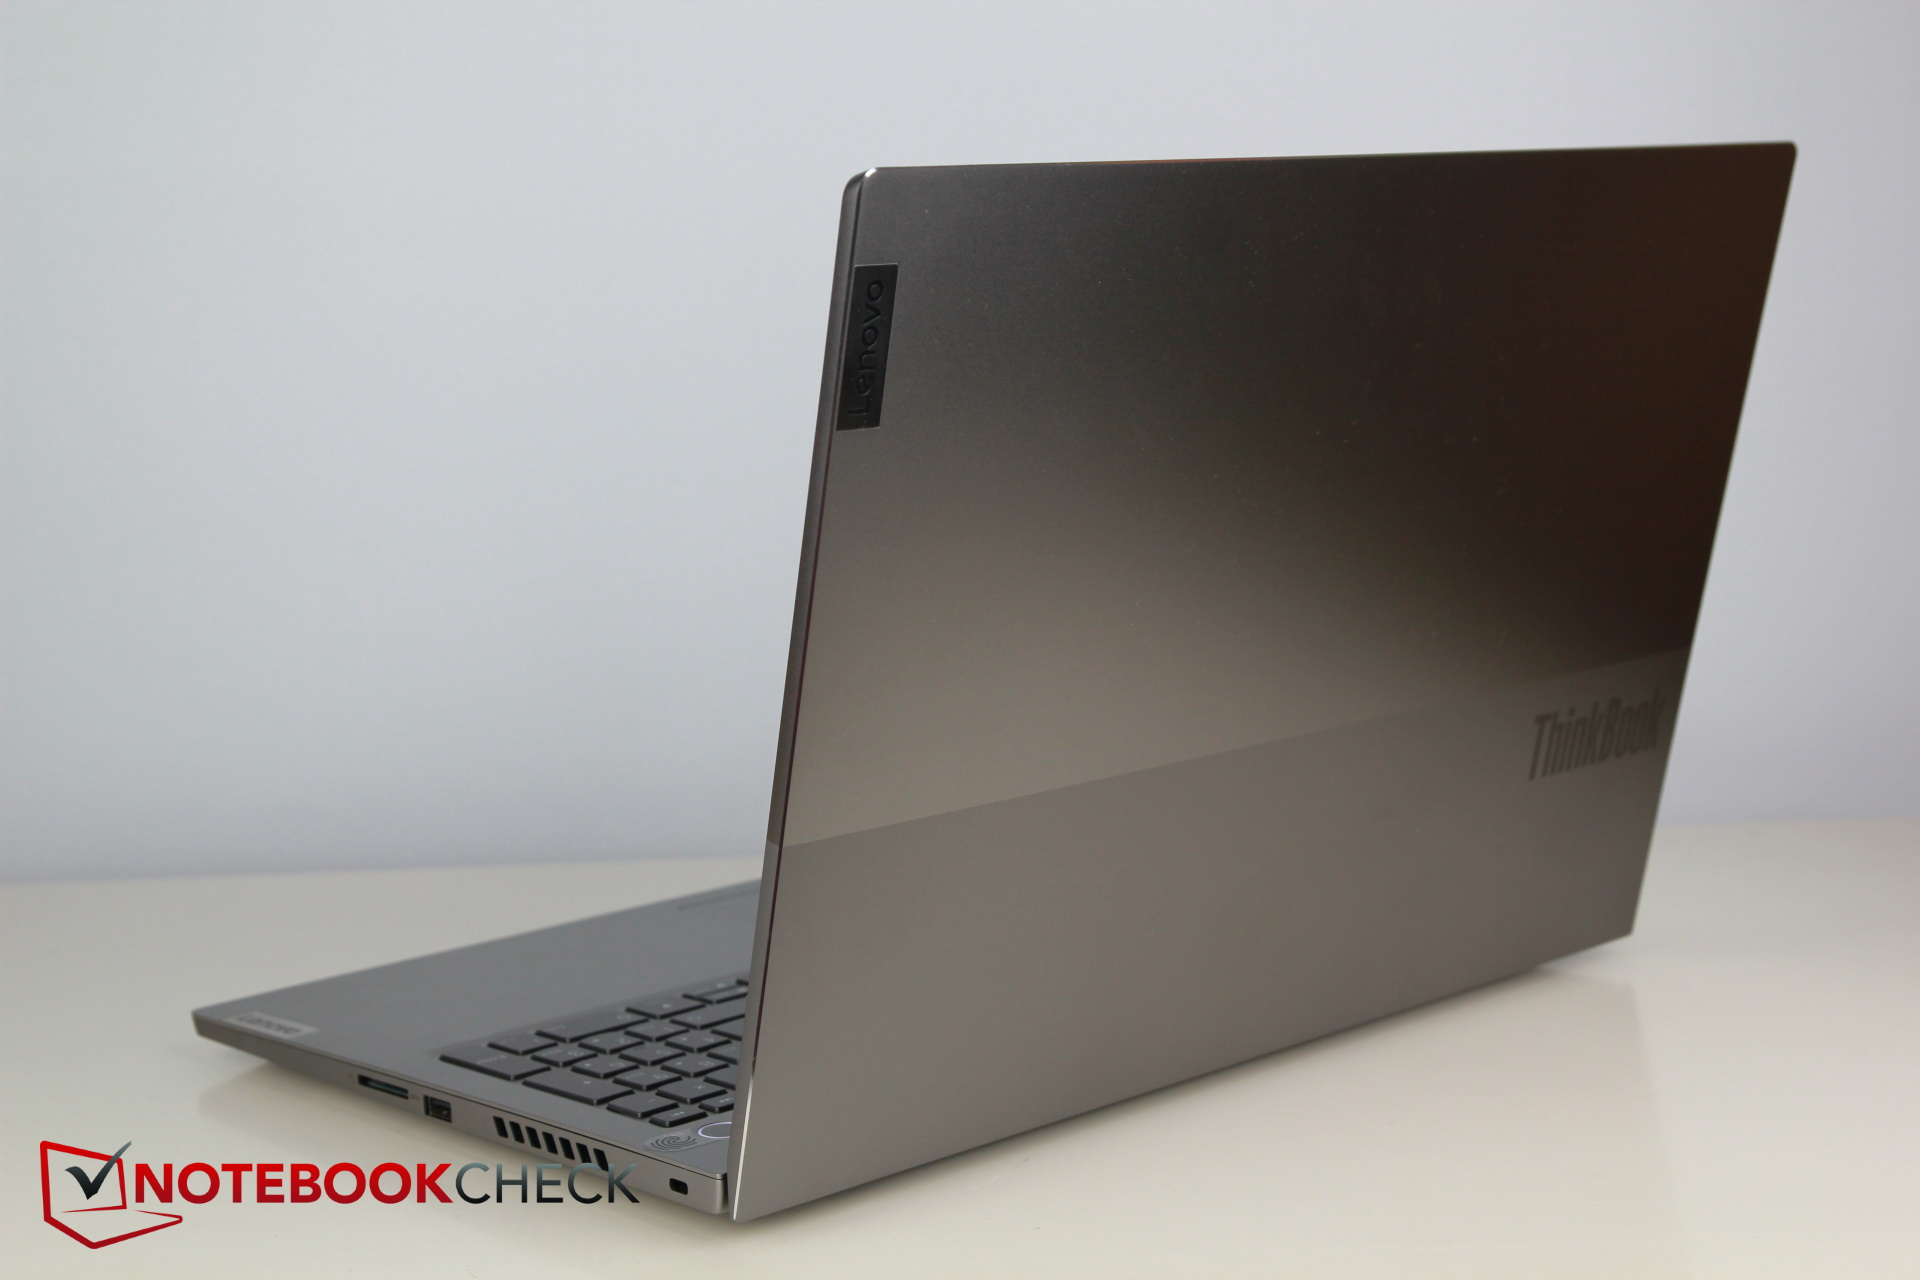
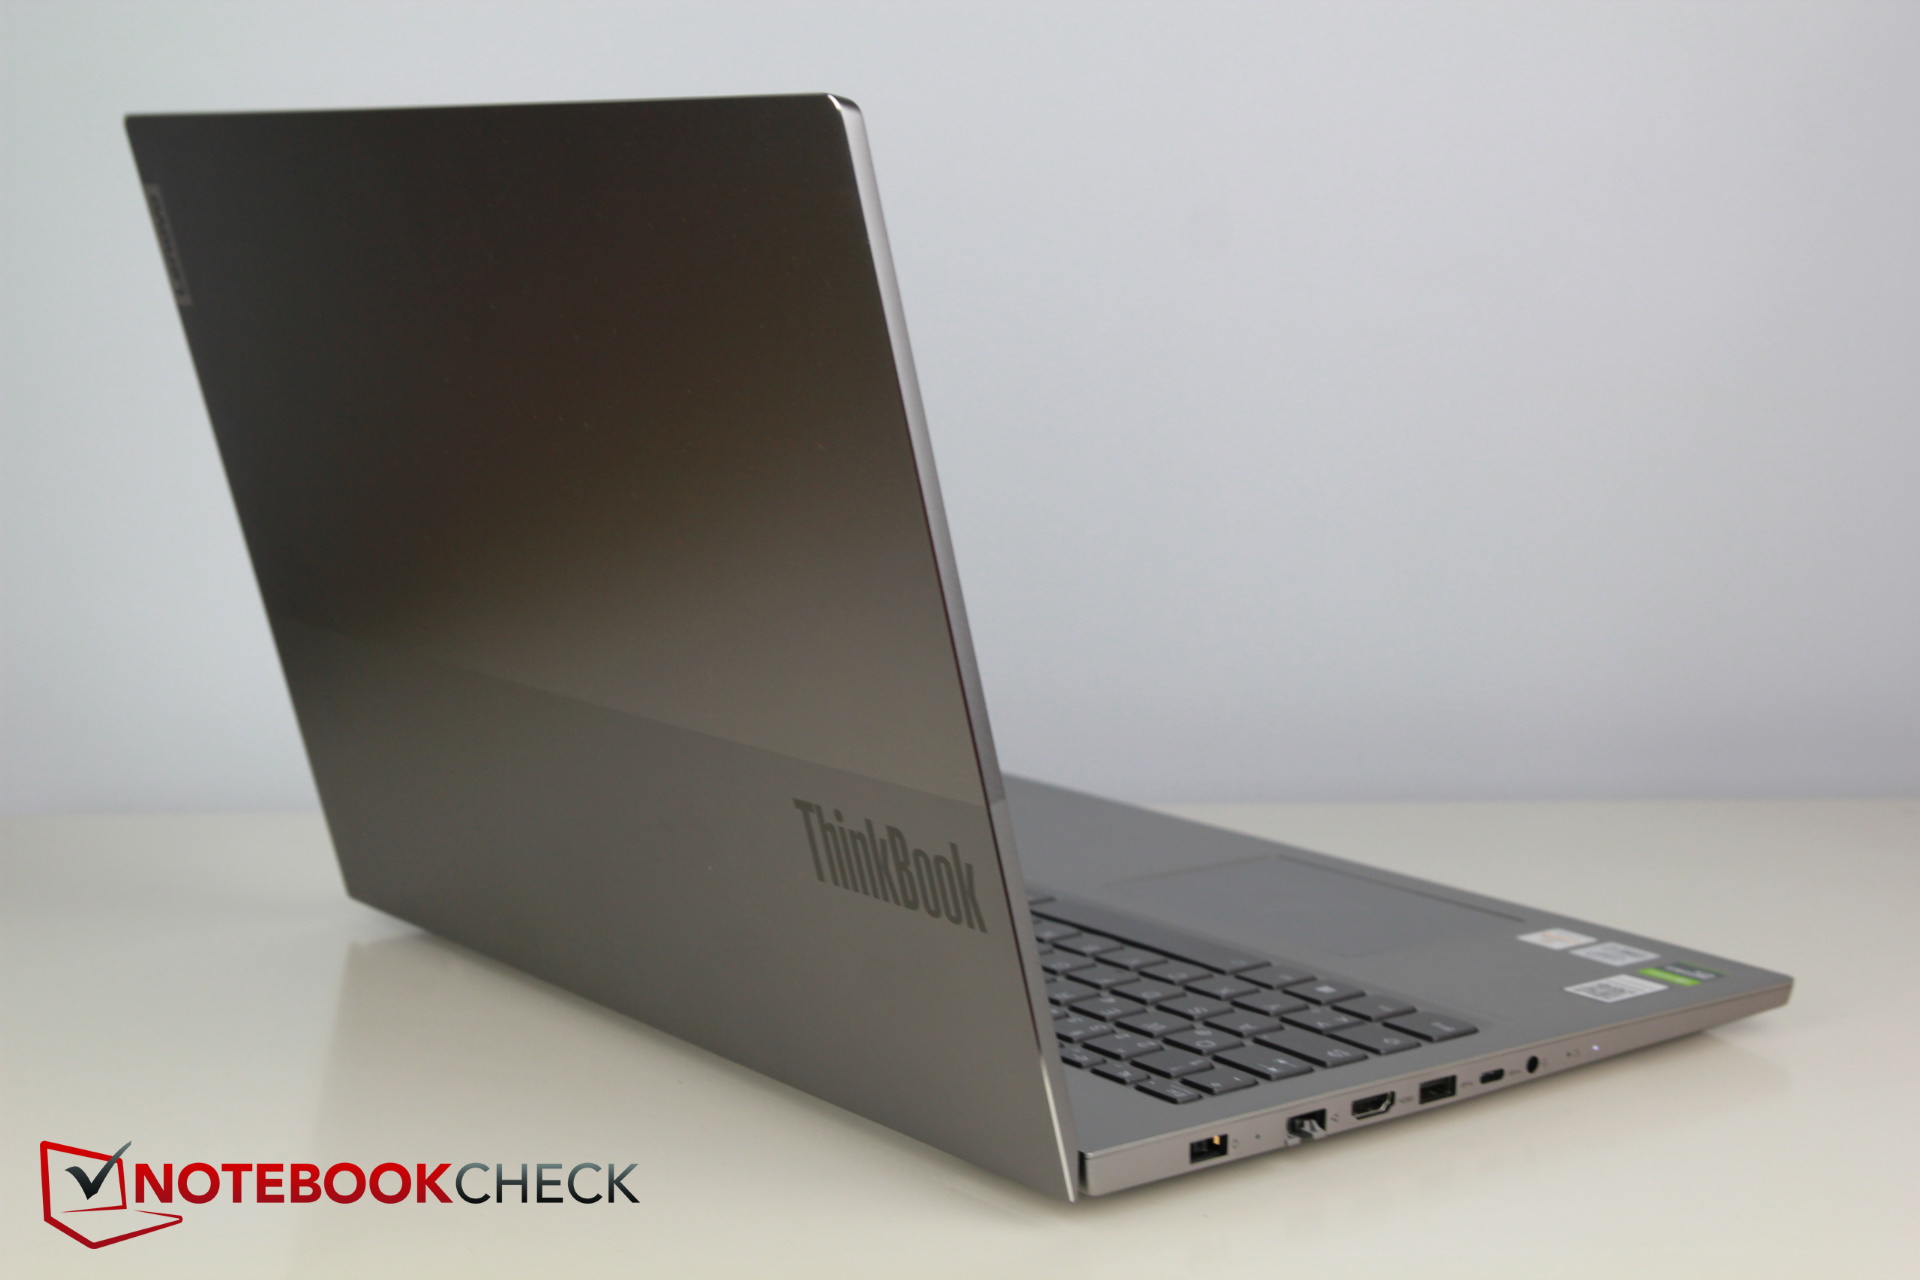
At first glance, you can hardly notice any change of the 15-inch case compared to the predecessor. The differences lie in the connections and the slightly changed size. Surprisingly, the new ThinkBook 15p is 1 mm (~0.04 in) thicker and 4.5 mm (~0.18 in) deeper, but 5 mm (~0.2 in) less wide. In addition, due to the more powerful hardware it became 100 grams (~3.5 oz) heavier.
The competitors have a similar size and weight, and only the Schenker Vision 15 with the new Intel NUC-M15 design is significantly slimmer and lighter. It probably shows the direction that 15-inch laptops will also take in the future, and the ThinkBook is less forward-looking in this regard.
Equipment - Yesterday's connections
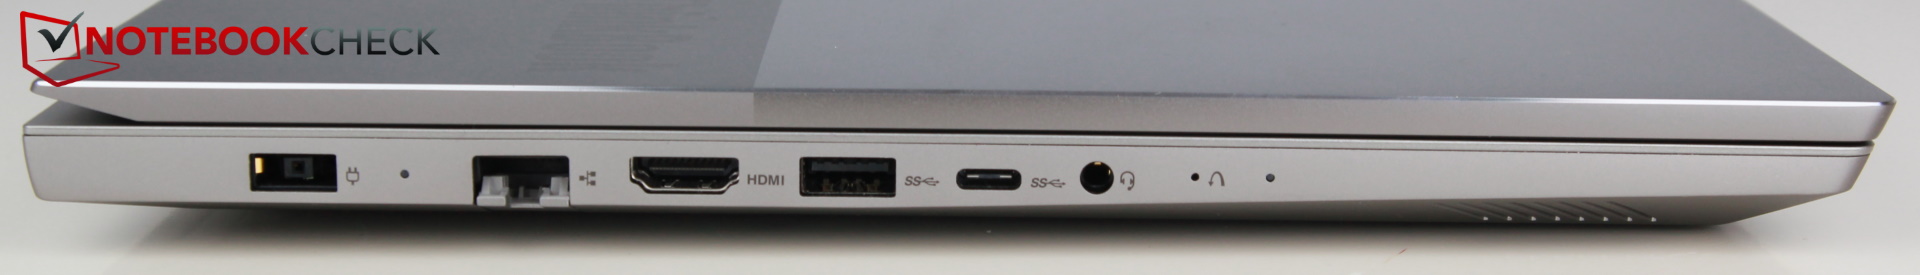
After we had complained last year about this, the power connection has now changed from the right to the left side, which means that it doesn't conflict with the Kensington lock anymore. However, one of the two USB Type-C ports that were there before has been removed instead.
Unfortunately, the manufacturer has also foregone Thunderbolt or at least faster USB ports. All the USB ports (2x Type-A, 1x Type-C) only support 3.2 Gen1, which is USB 3.0. The fact that with one USB-2.0 port as well as the second Type-C port, there are already two USB connections that have been removed becomes negatively noticeable. The USB C port also does not support charging of the laptops.
The positioning of the ports on the left side is slightly crowded, and a bulky HDMI plug and a USB stick might get in the way of each other. On the other hand, right-handed users might like the lack of connections that could otherwise hinder mouse movements on the right side.
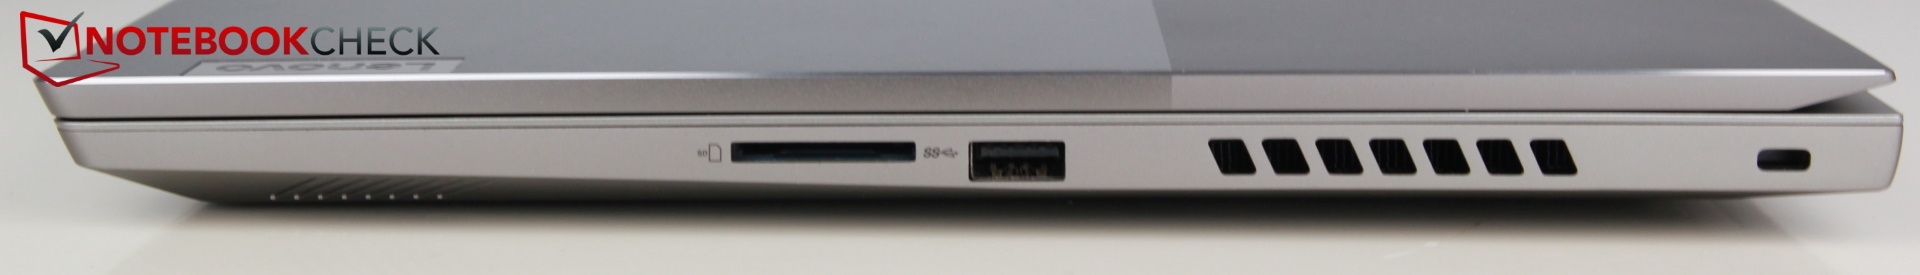
SD Card Reader
The card reader can accept full-size SD cards, even though the Lenovo website strangely speaks about microSD cards. On the other hand, the speed of the SD card reader is yesteryear's and unable to keep up with the competitors. Copying 1 GB of images from our AV Pro V60 reference storage cards to the desktop takes more than 39 seconds. The competitors and particularly the inhouse ThinkPad are three to four times faster.
| SD Card Reader | |
| average JPG Copy Test (av. of 3 runs) | |
| Lenovo ThinkPad X1 Extreme Gen3-20TLS0UV00 (Toshiba Exceria Pro SDXC 64 GB UHS-II) | |
| Average of class Multimedia (21.1 - 198, n=40, last 2 years) | |
| Lenovo ThinkBook 15 (Toshiba Exceria Pro SDXC 64 GB UHS-II) | |
| Asus ZenBook UX535-M01440 (Toshiba Exceria Pro M501 microSDXC 64GB) | |
| Lenovo ThinkBook 15p Gen1 4K (AV Pro V60) | |
| Asus VivoBook 15 K571LI-PB71 (Toshiba Exceria Pro SDXC 64 GB UHS-II) | |
| maximum AS SSD Seq Read Test (1GB) | |
| Lenovo ThinkPad X1 Extreme Gen3-20TLS0UV00 (Toshiba Exceria Pro SDXC 64 GB UHS-II) | |
| Average of class Multimedia (27.4 - 262, n=40, last 2 years) | |
| Lenovo ThinkBook 15 (Toshiba Exceria Pro SDXC 64 GB UHS-II) | |
| Asus ZenBook UX535-M01440 (Toshiba Exceria Pro M501 microSDXC 64GB) | |
| Lenovo ThinkBook 15p Gen1 4K (AV Pro V60) | |
| Asus VivoBook 15 K571LI-PB71 (Toshiba Exceria Pro SDXC 64 GB UHS-II) | |
Communication
With the Intel AX201, Lenovo uses a modern WiFi 6 modem. The transfer rates are very good and not any worse than those of the more expensive ThinkPad.
Webcam
The standard webcam is nothing to write home about, and the image sharpness is even worse than that of the ThinkPad or the Schenker Vision. But at least the color reproduction is acceptable compared to the rest of the price class. The available manual shutter is a positive feature.


Security

As entry-level into the business segment, the ThinkBook does not offer a smartcard reader or anything similar.
Instead, there is a fingerprint sensor integrated into the power button, as well as TM 2.0 and a connection for a Kensington Lock.
Accessories
Aside from a quick start manual and warranty card, there are no accessories included.
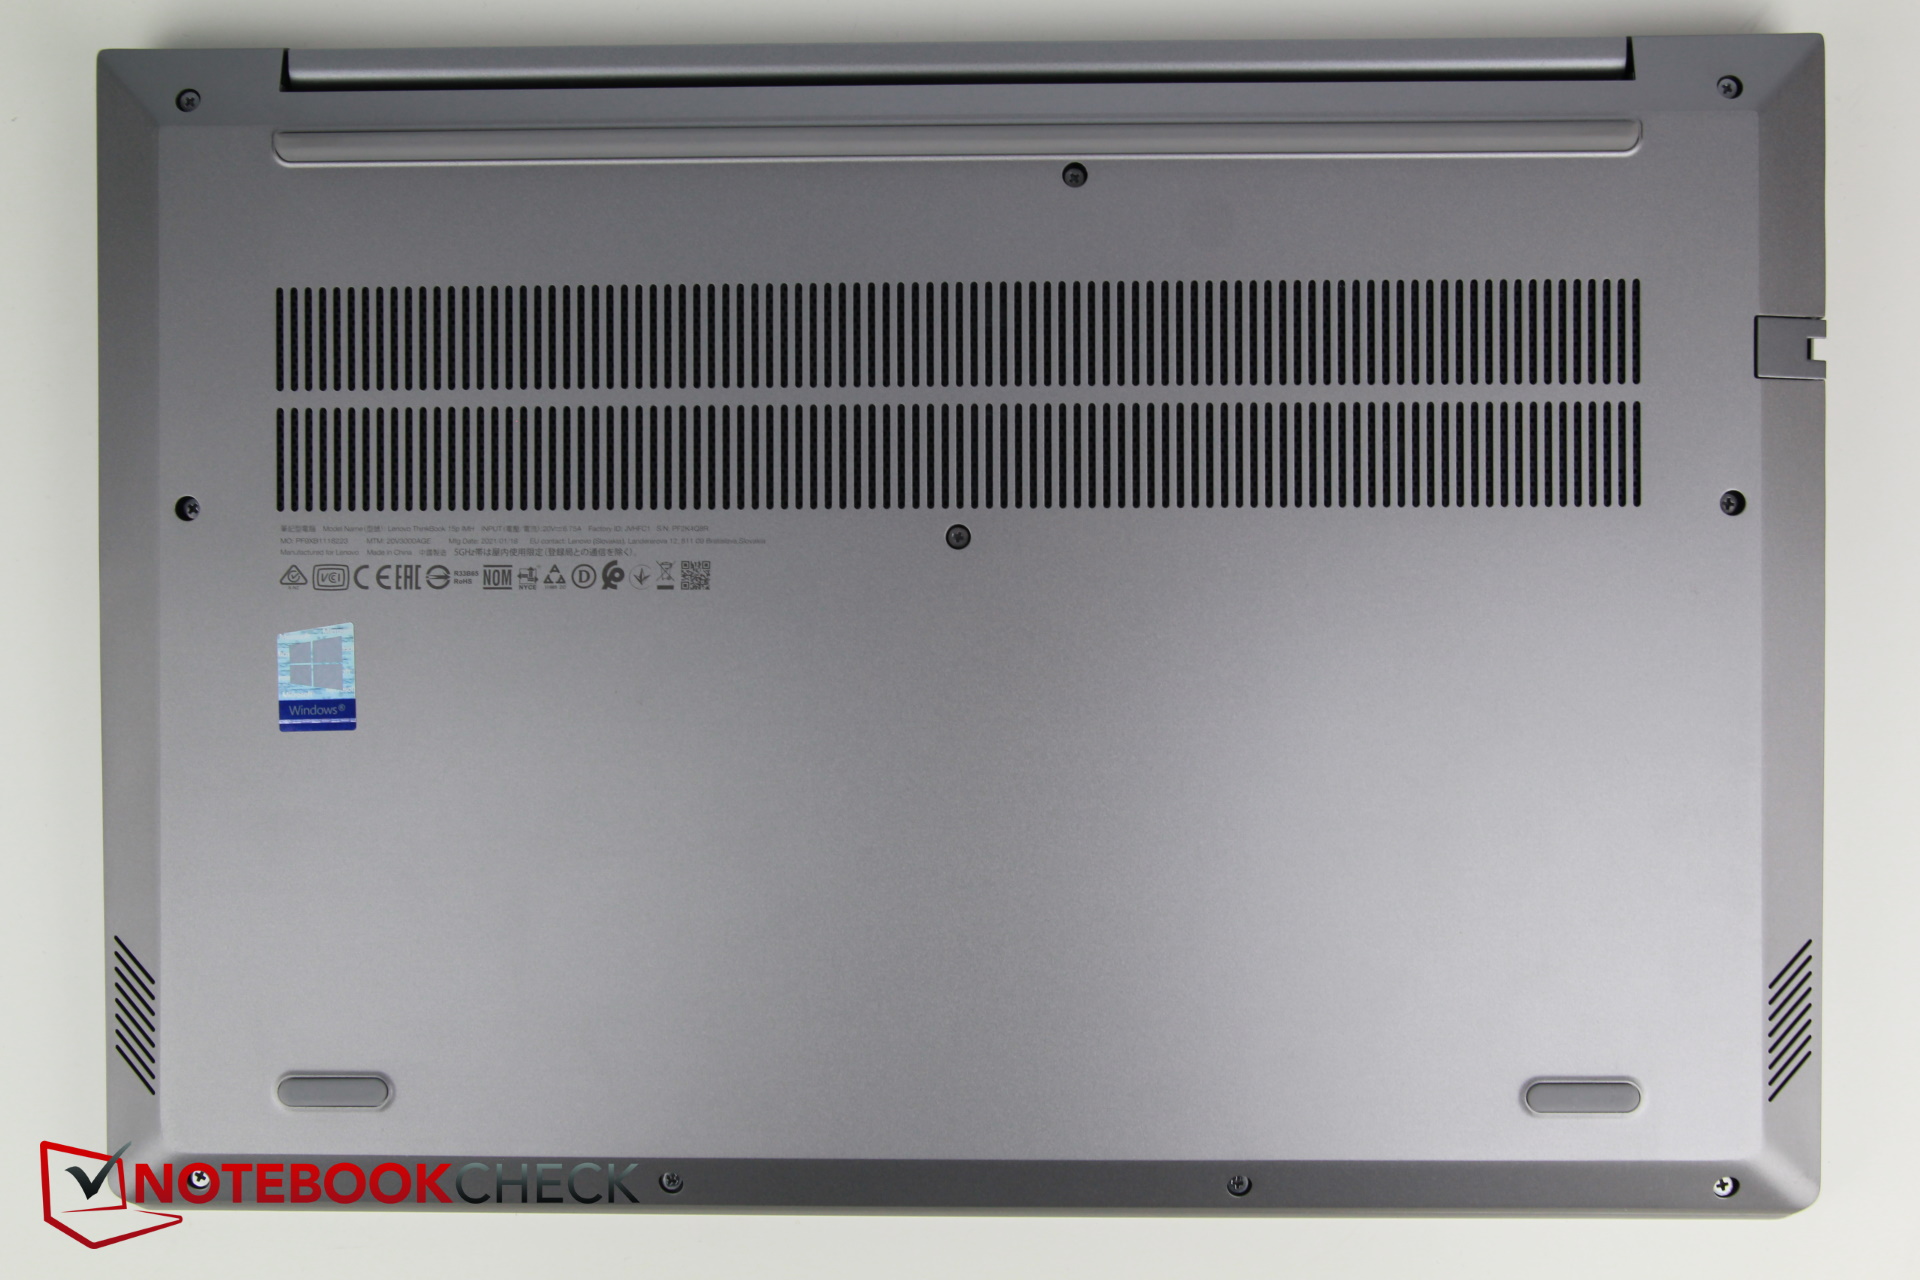
Maintenance
Removing the bottom of the case turns out to be not very easy. First we have to remove 10 Philips screws of two different sizes. After that, we can start to pry off the case, starting from the front corners. However, since there are still some clamps holding the case tightly in place, we are unable to pry it open with our bare hands. Without using some additional prying tools, it is impossible to open the ThinkBook, and even then, we are afraid to brake off the holding clamps.
Warranty
ThinkBooks only offer a one-year warranty that can be extended up to three years at an additional price.
Input Devices - Not as good as the ThinkPad's but still decent
Keyboard
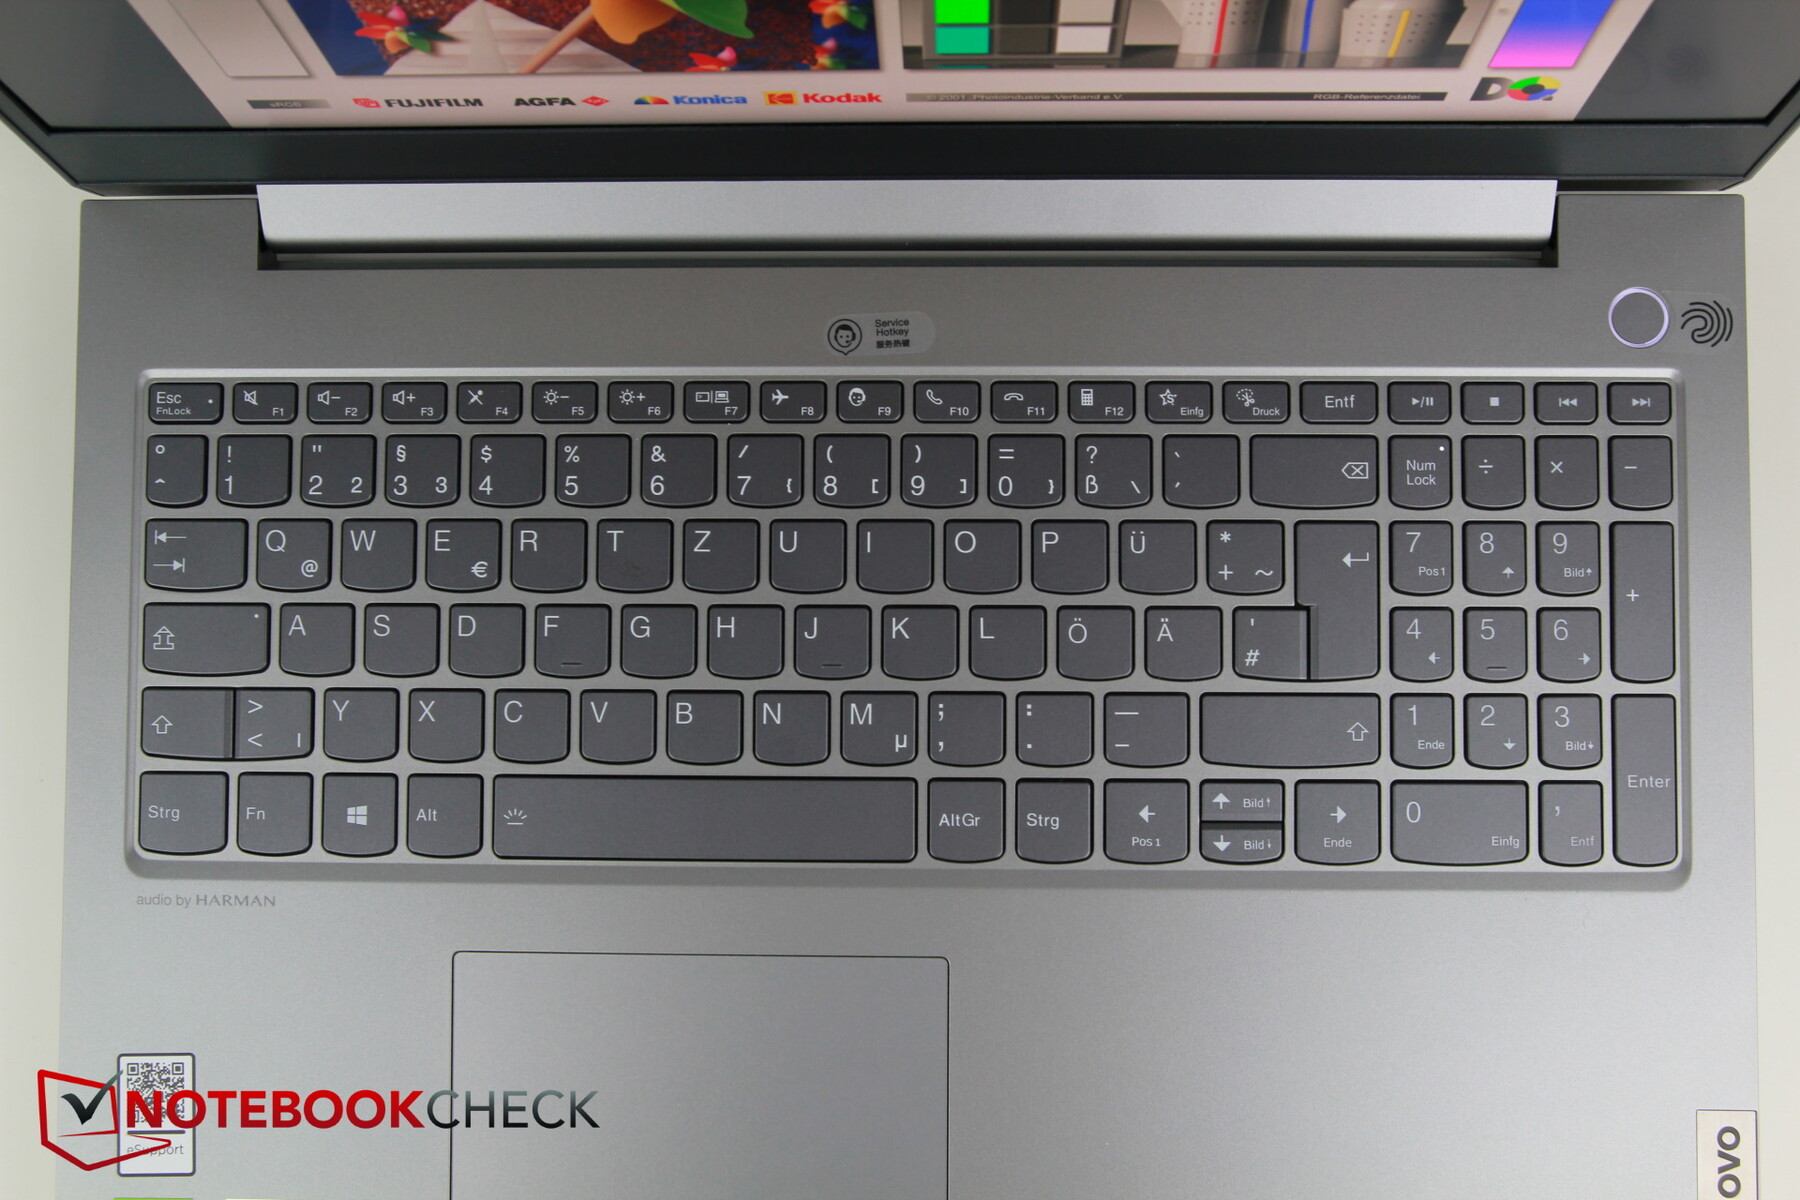
Lenovo uses a chiclet keyboard with a white, two-step background illumination. It also fits a small number block next to it. The power key is positioned separately on the right, above the rest of the keys.
The layout and lettering look clear, and the ordered impression is also amplified by the keys that are rounded on the bottom. The F9 key opens the service page of the Lenovo website in the browser, offering contact information and information on the device and remaining warranty period. The up and down arrow keys have to share the usual height, and the function keys have a smaller height and width.
The key stroke turned out quite short, reminding more of the IdeaPad than the ThinkPad series, which is usually very good in this regard. However, the feedback is still easily noticeable, and typing succeeds quickly and easily. The key stroke noises are very moderate.
Touchpad
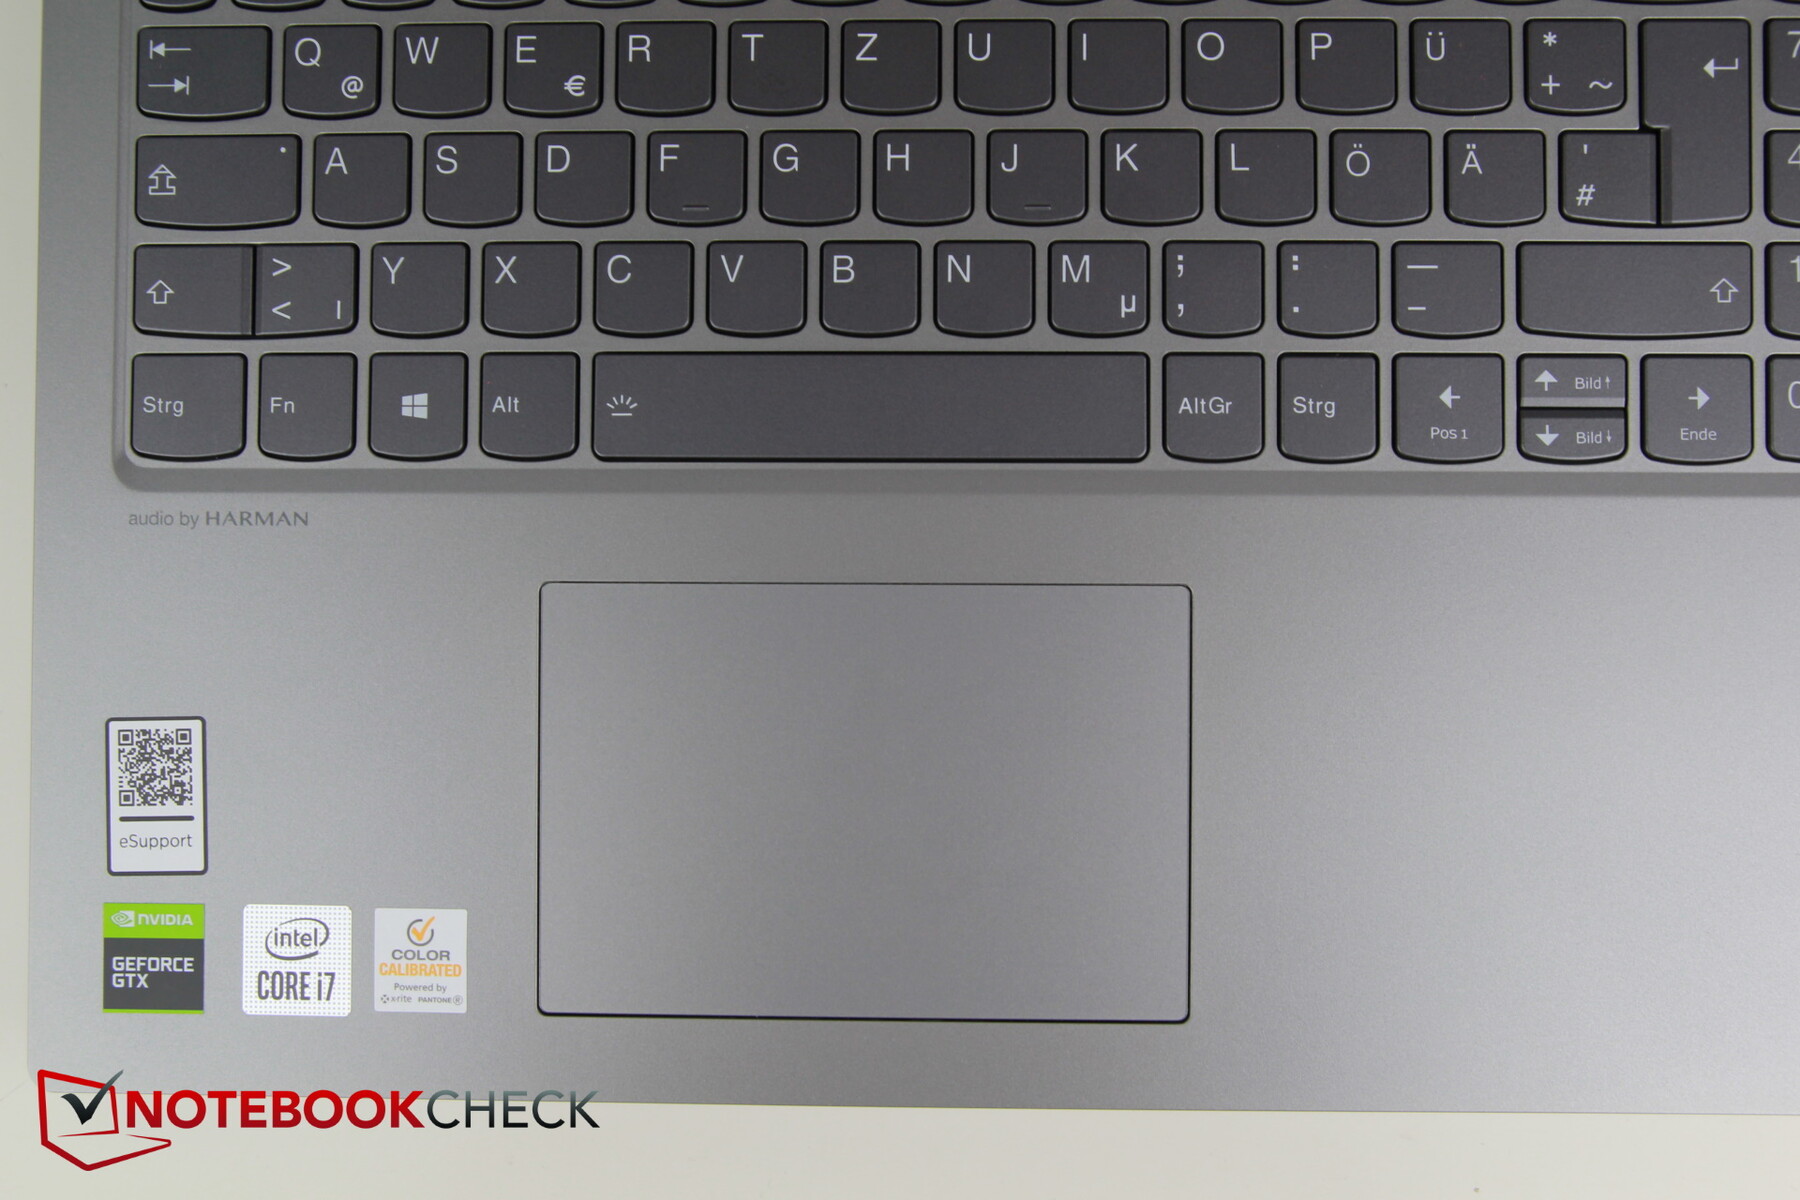
The touchpad measures about 10.5 x 7 cm (~4.1 x 2.8 in) and is moved to the left below the space bar due to the numpad. The surface offers good sliding characteristics. Only in very slow movements and if you use a lot of pressure, your finger can get stuck a bit. However, you better not have moist fingers, since otherwise you can hardly navigate.
While the integrated Click keys don't leave the highest quality impression, they reliably do what they are supposed to do, and the clicking volume is okay.
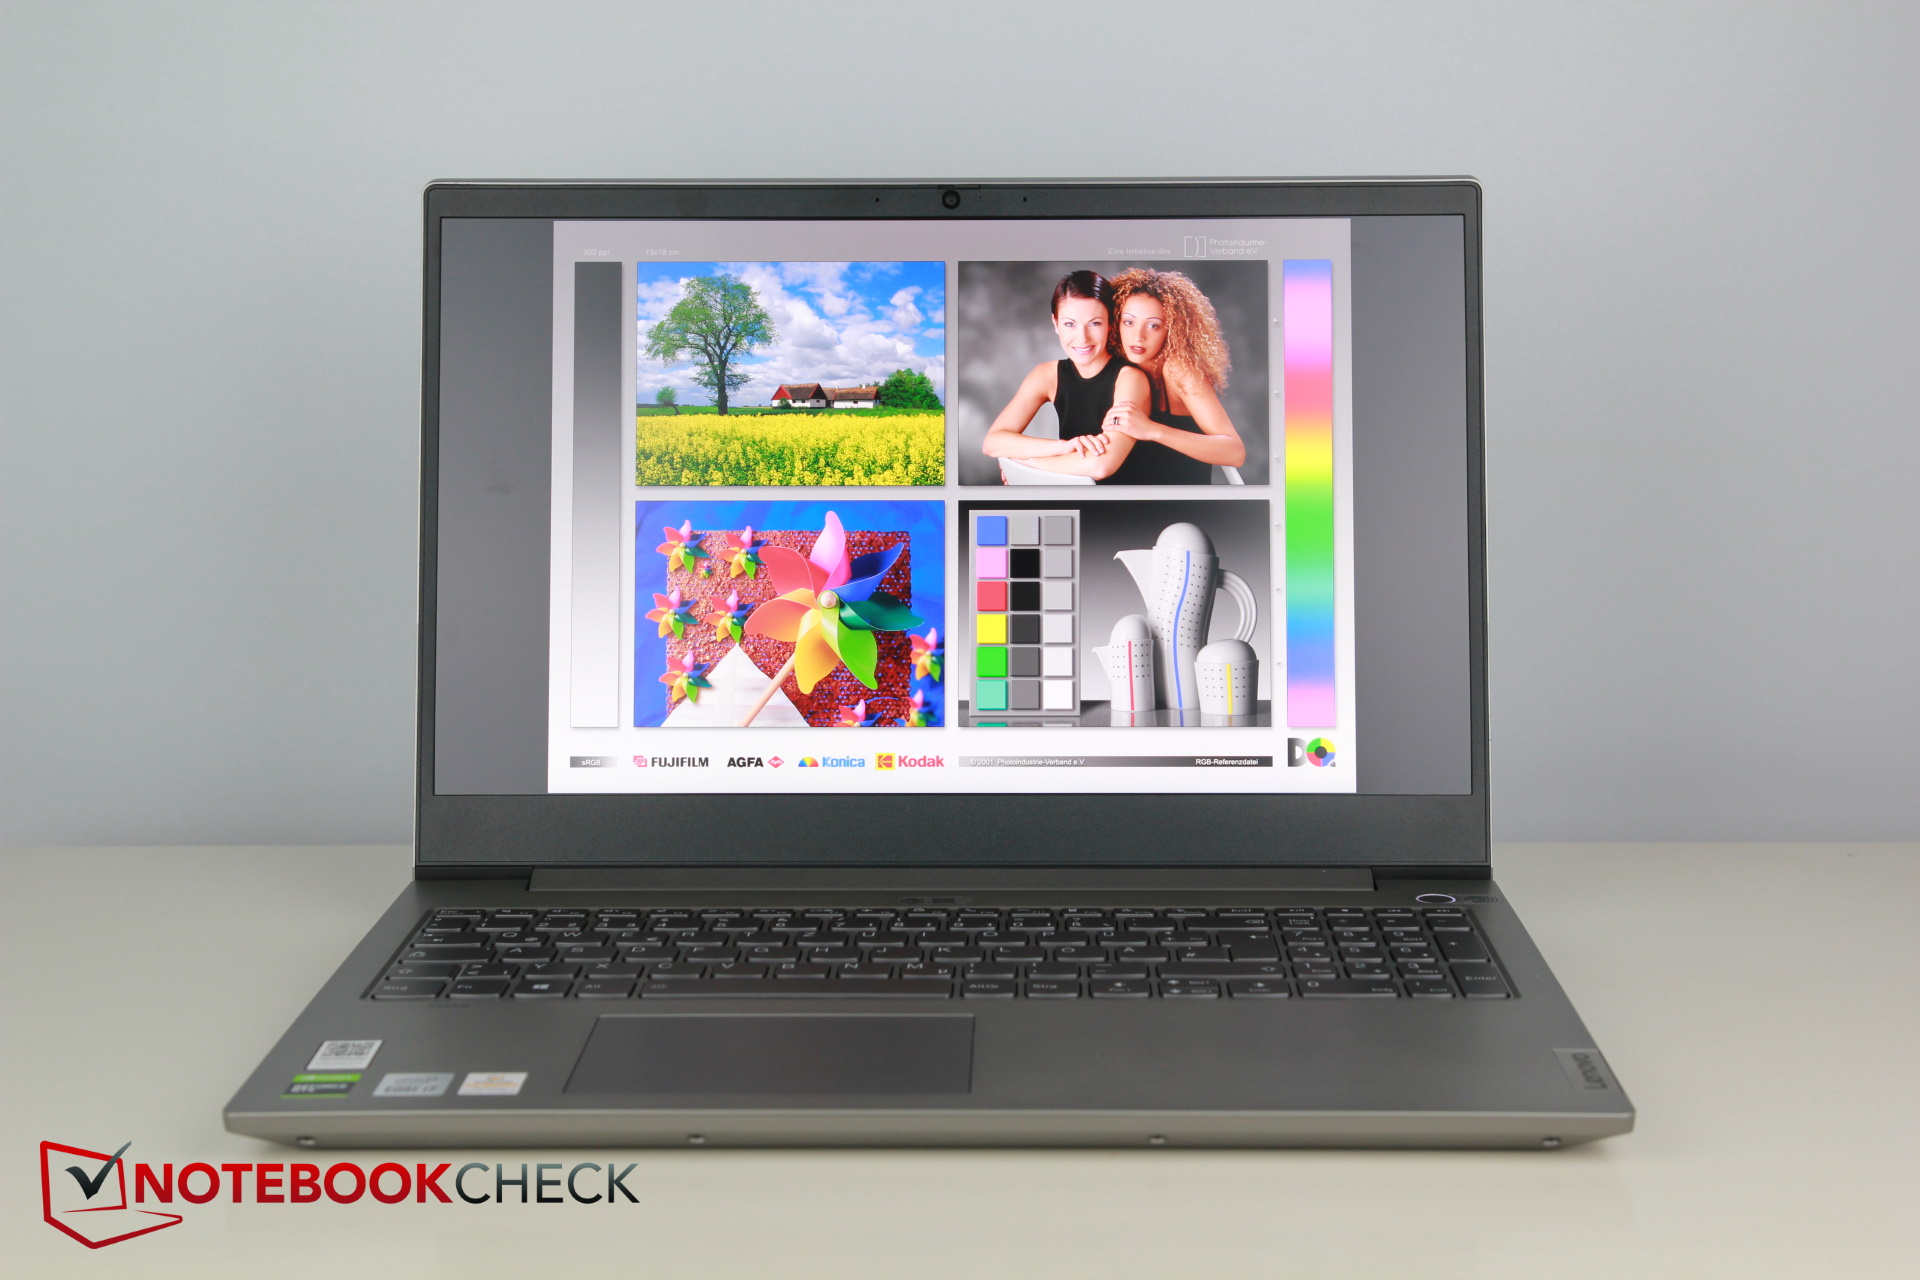
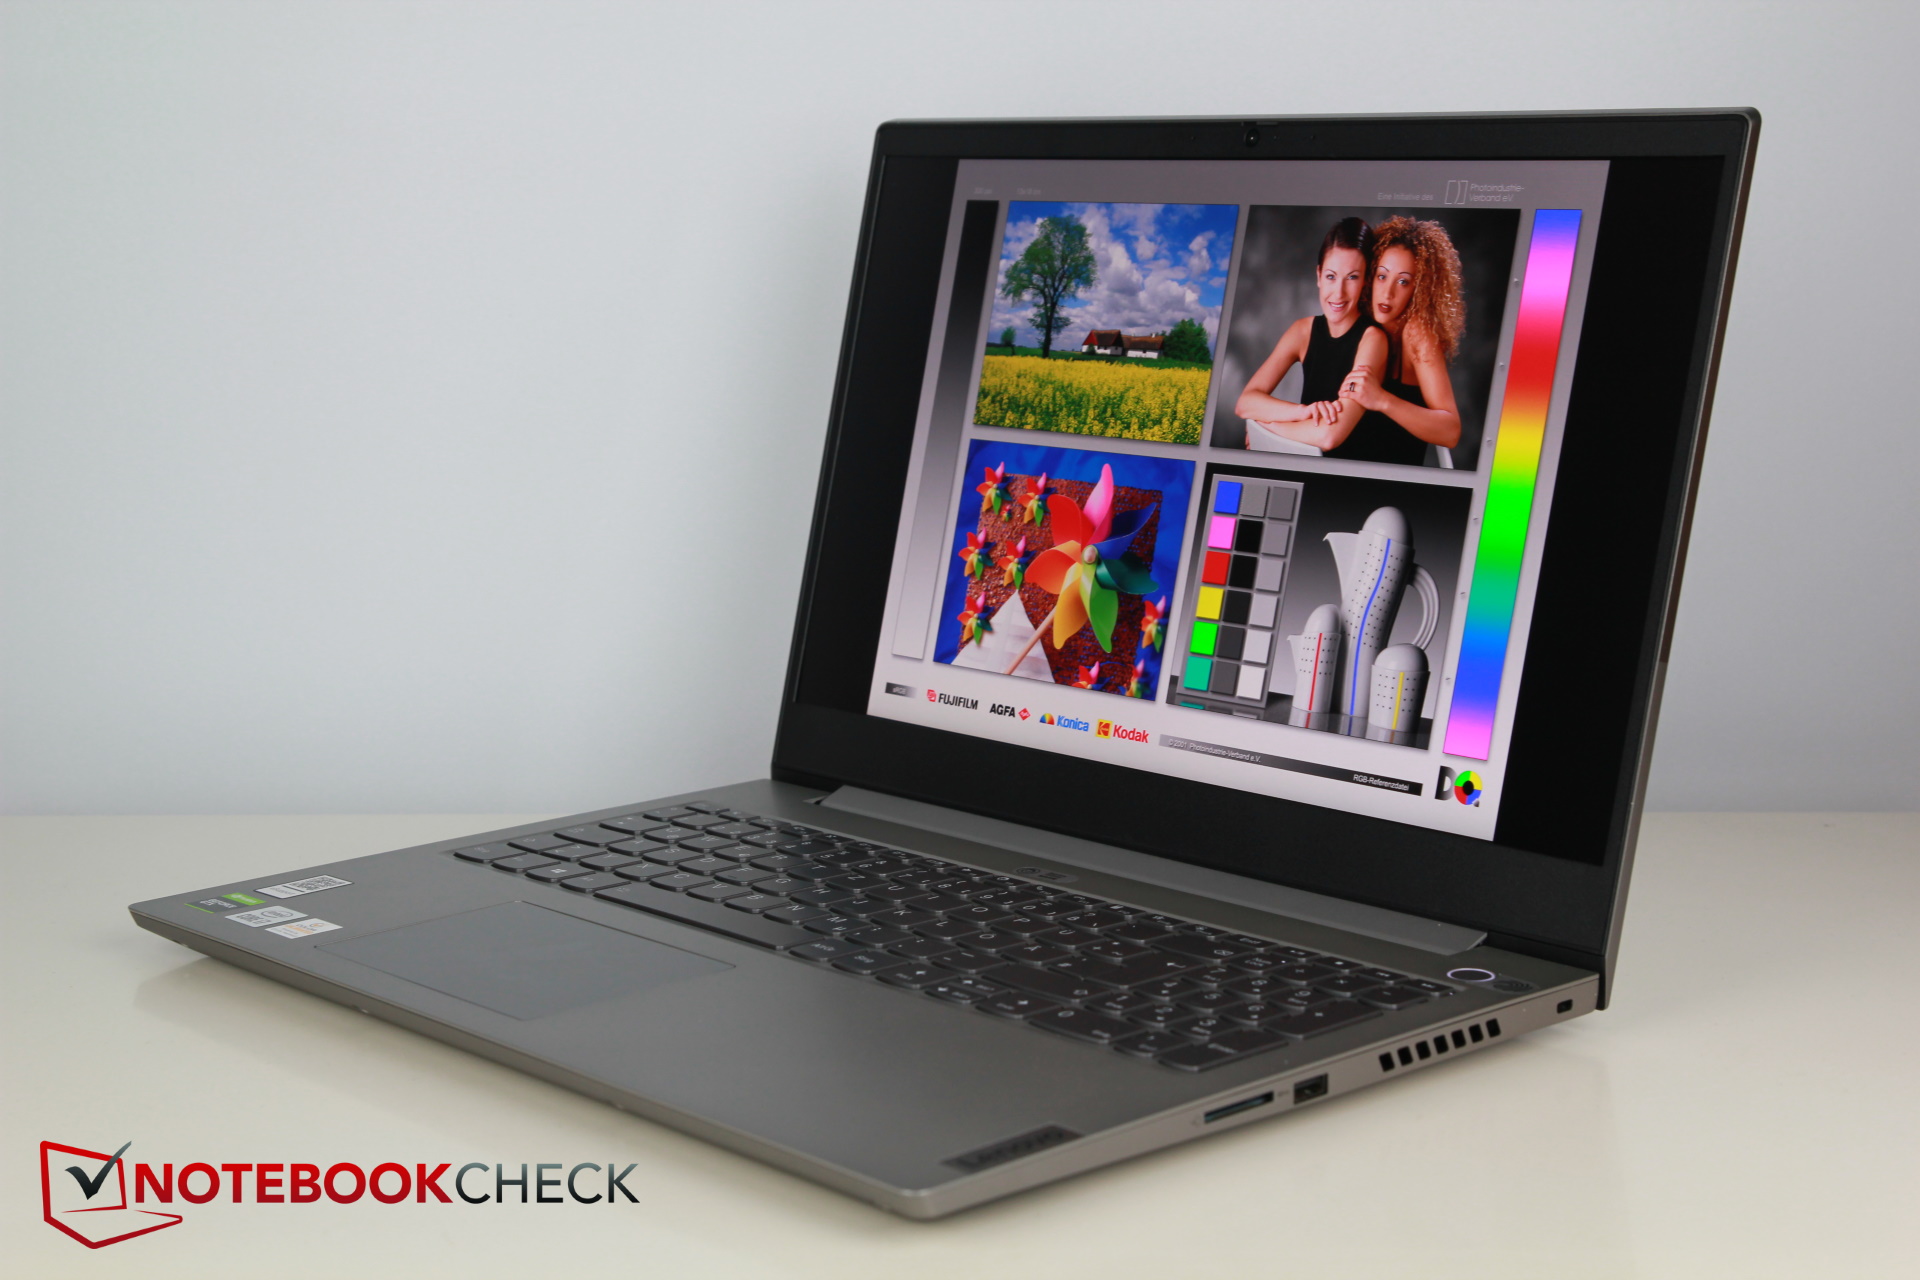
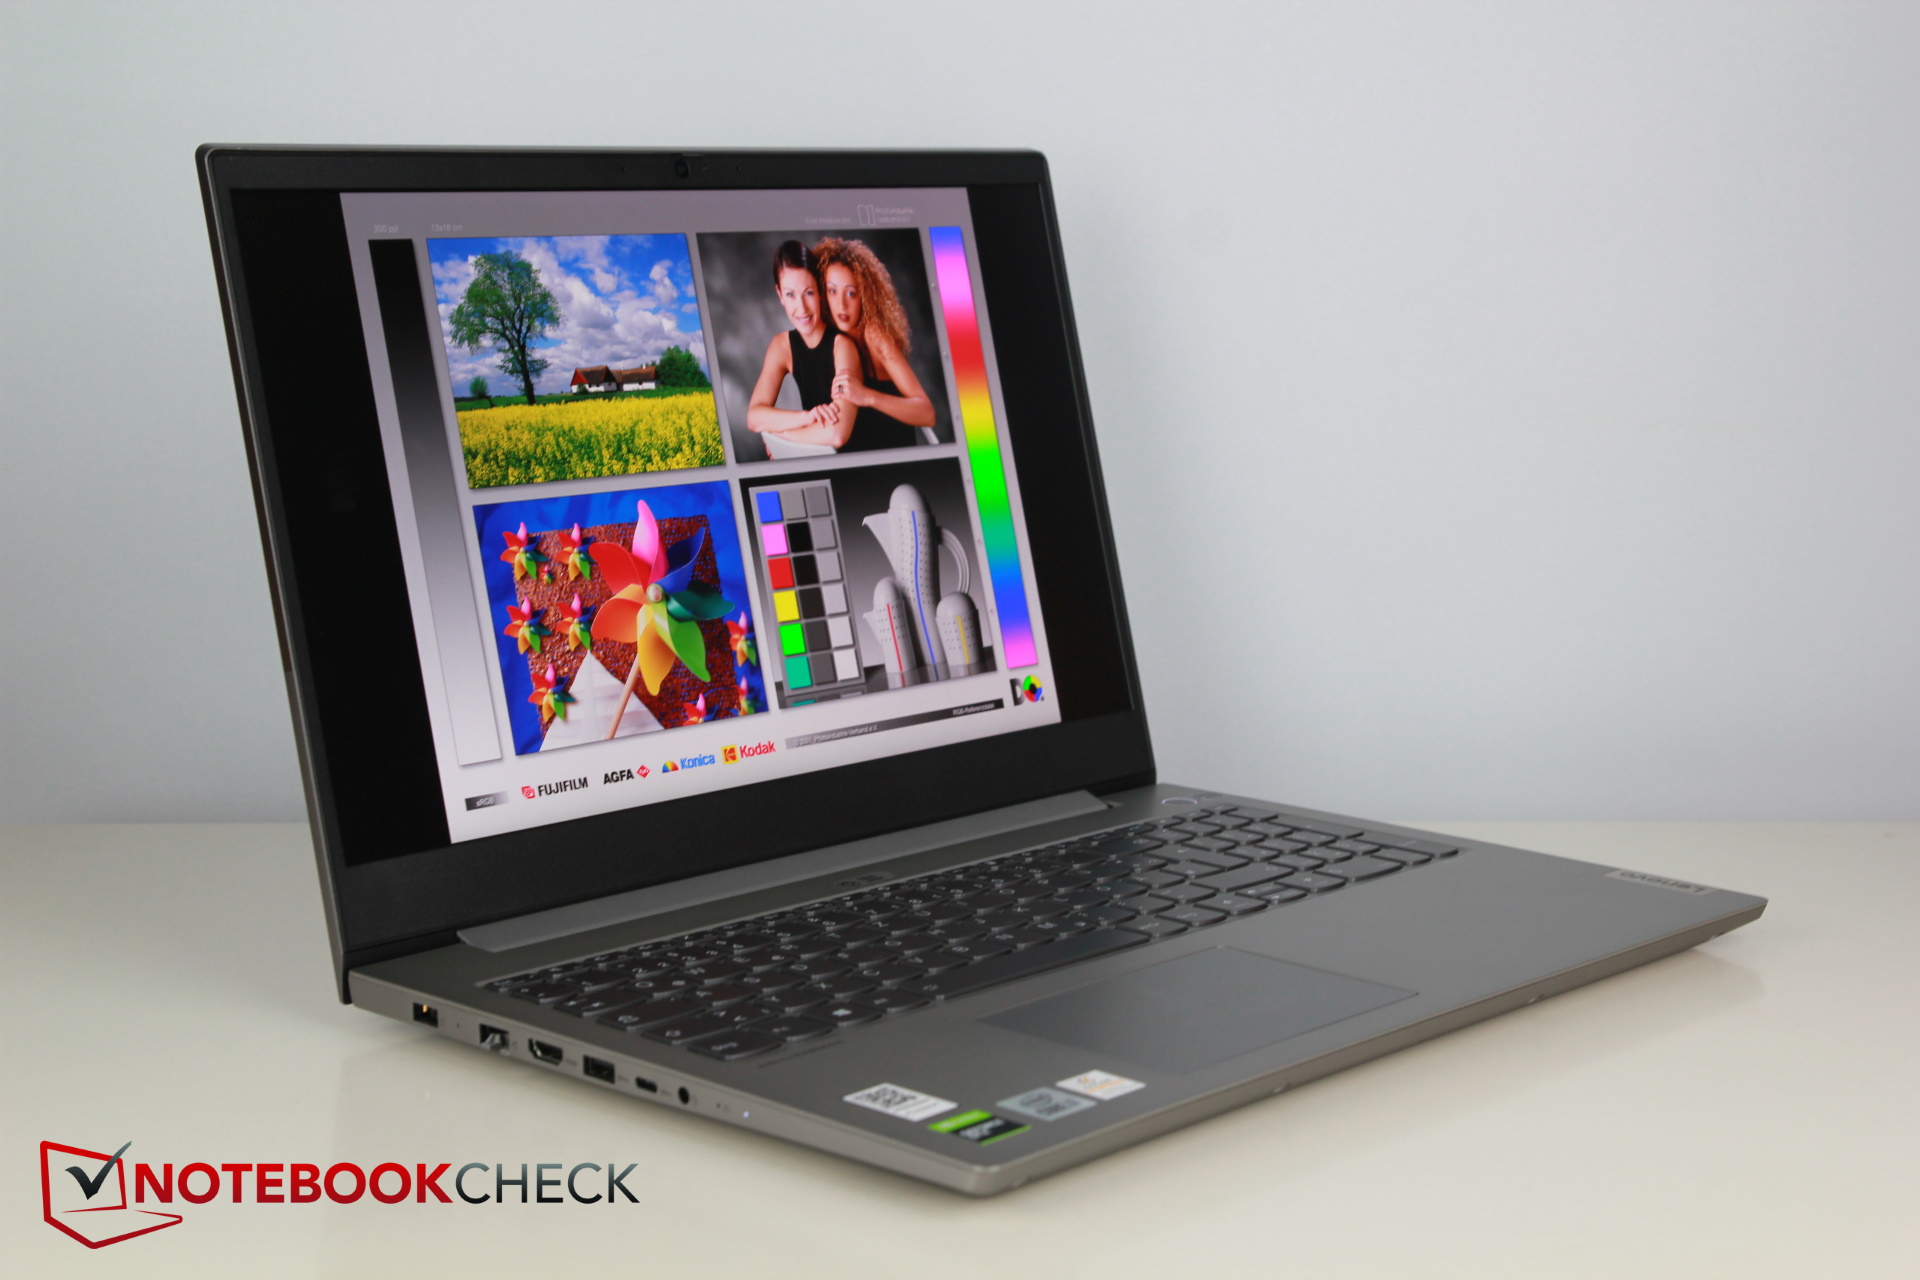
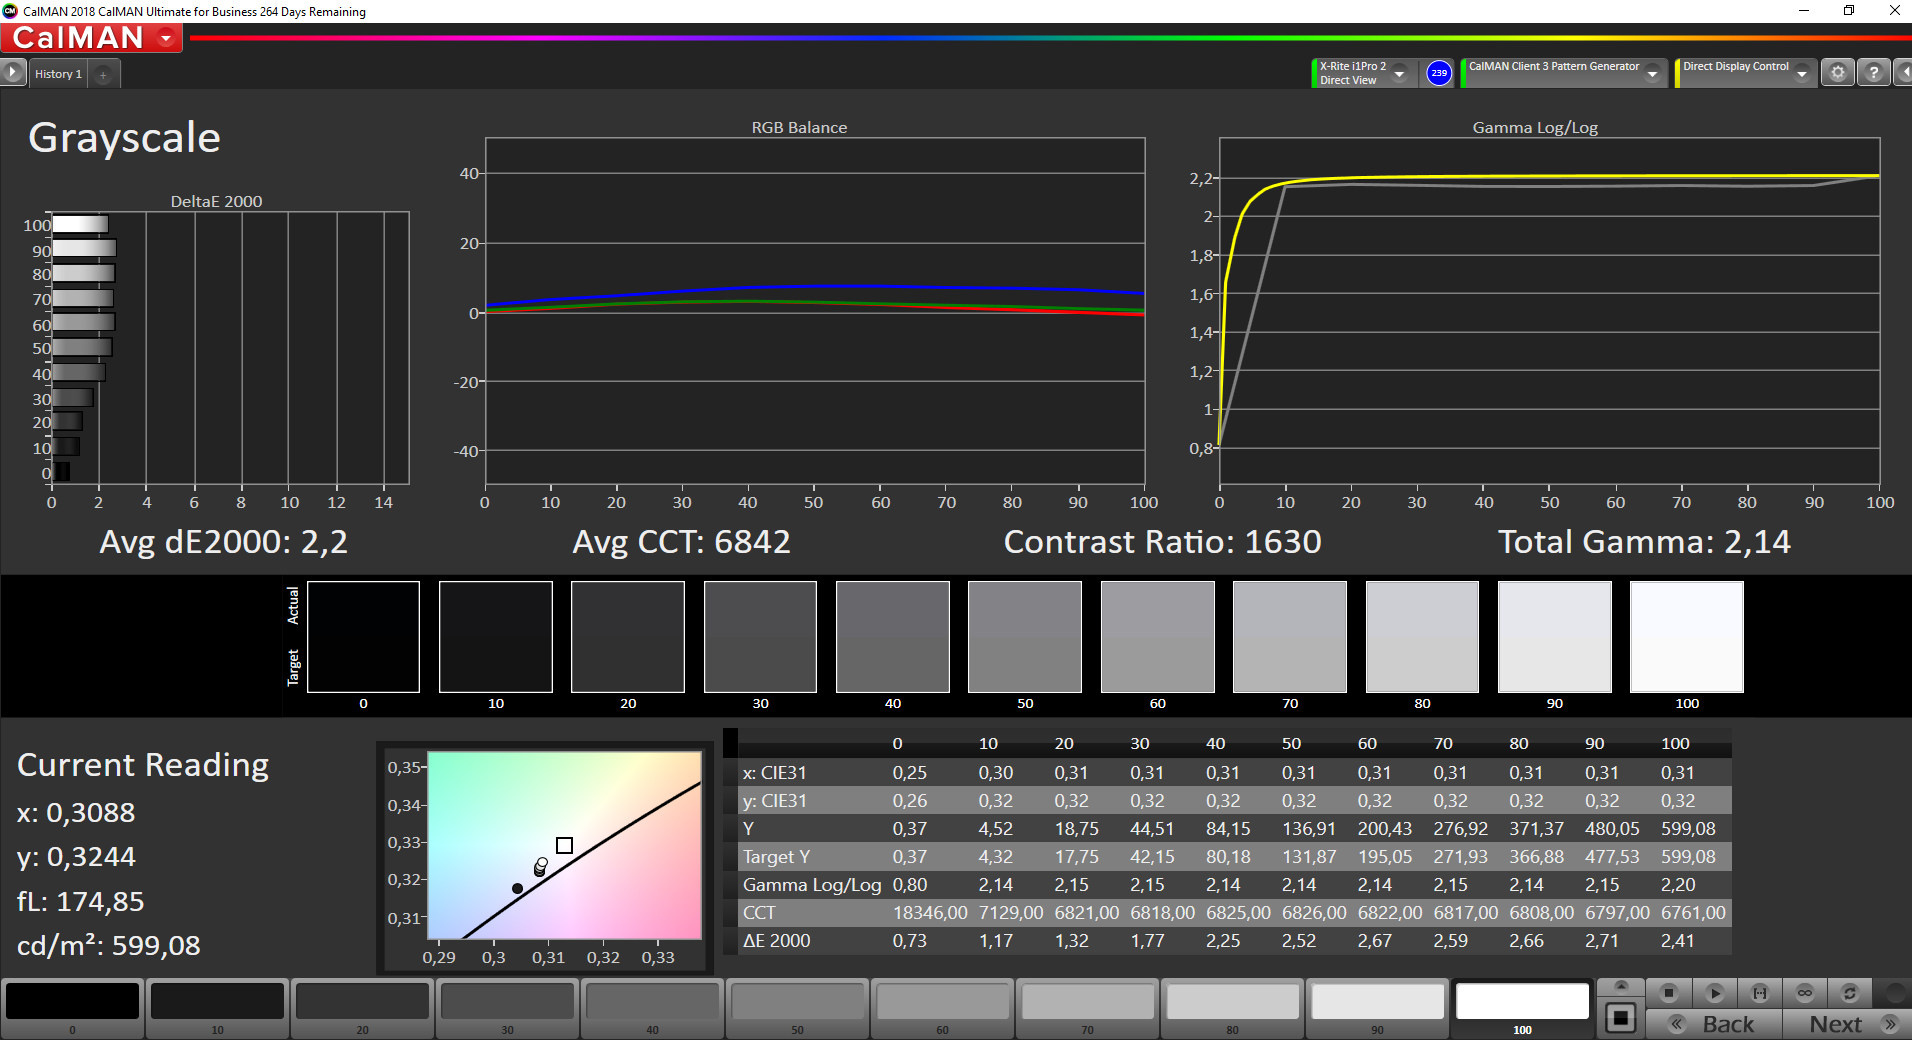
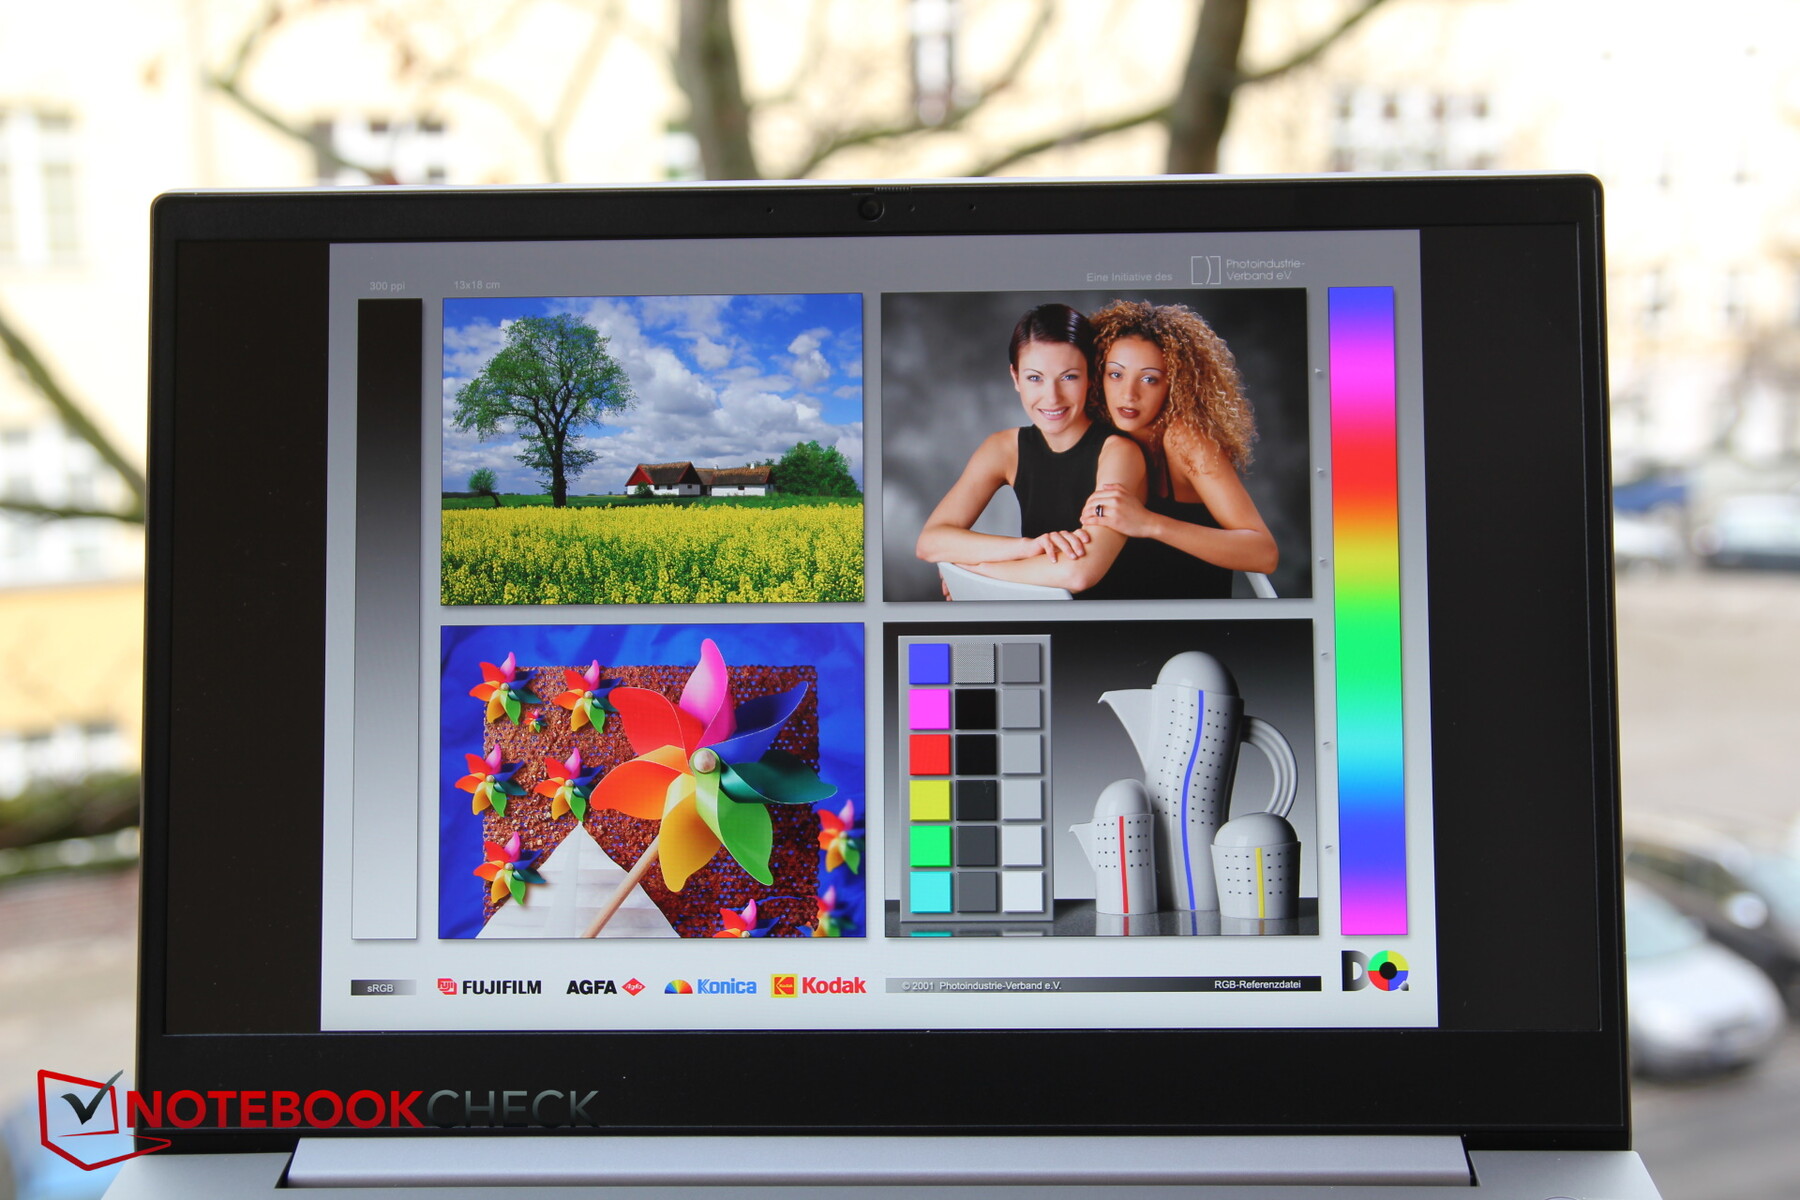
Display - 4K, bright, high in contrast, and good
Lenovo uses a matte 4K UHD IPS display from a still fairly unknown manufacturer called "China Star." However, sceptics of the "cheap" sounding name will soon be convinced. At about 600 nits, the brightness is very good. The same goes for the very even brightness distribution of 91%, and even the more expensive ThinkPad is unable to keep up here.
Alternatively, the ThinkBook 15p is also available with a Full HD display.

| |||||||||||||||||||||||||
Brightness Distribution: 91 %
Center on Battery: 591 cd/m²
Contrast: 1619:1 (Black: 0.37 cd/m²)
ΔE ColorChecker Calman: 1.4 | ∀{0.5-29.43 Ø4.78}
ΔE Greyscale Calman: 2.2 | ∀{0.09-98 Ø5}
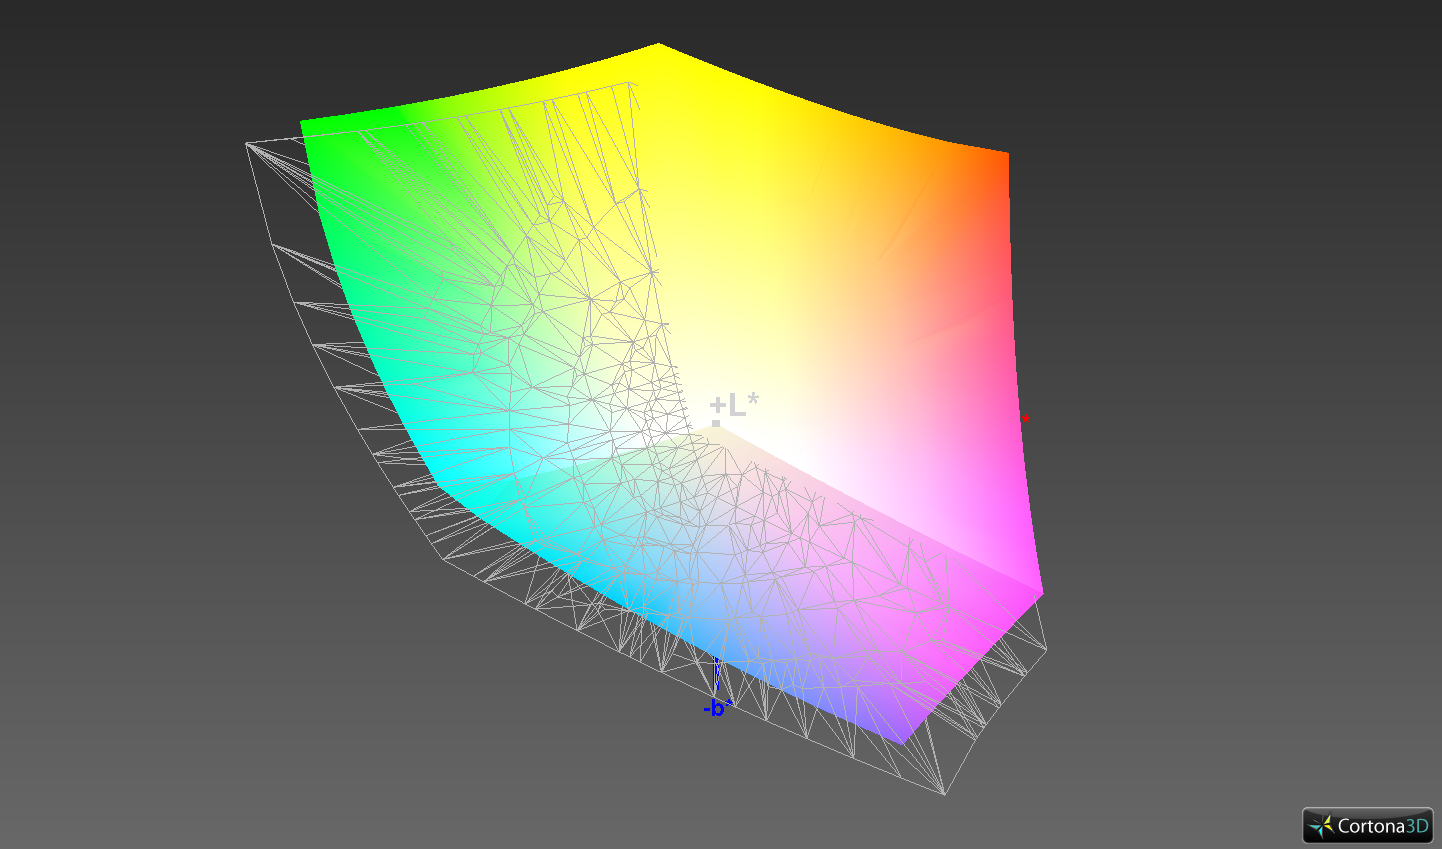
99.5% sRGB (Argyll 1.6.3 3D)
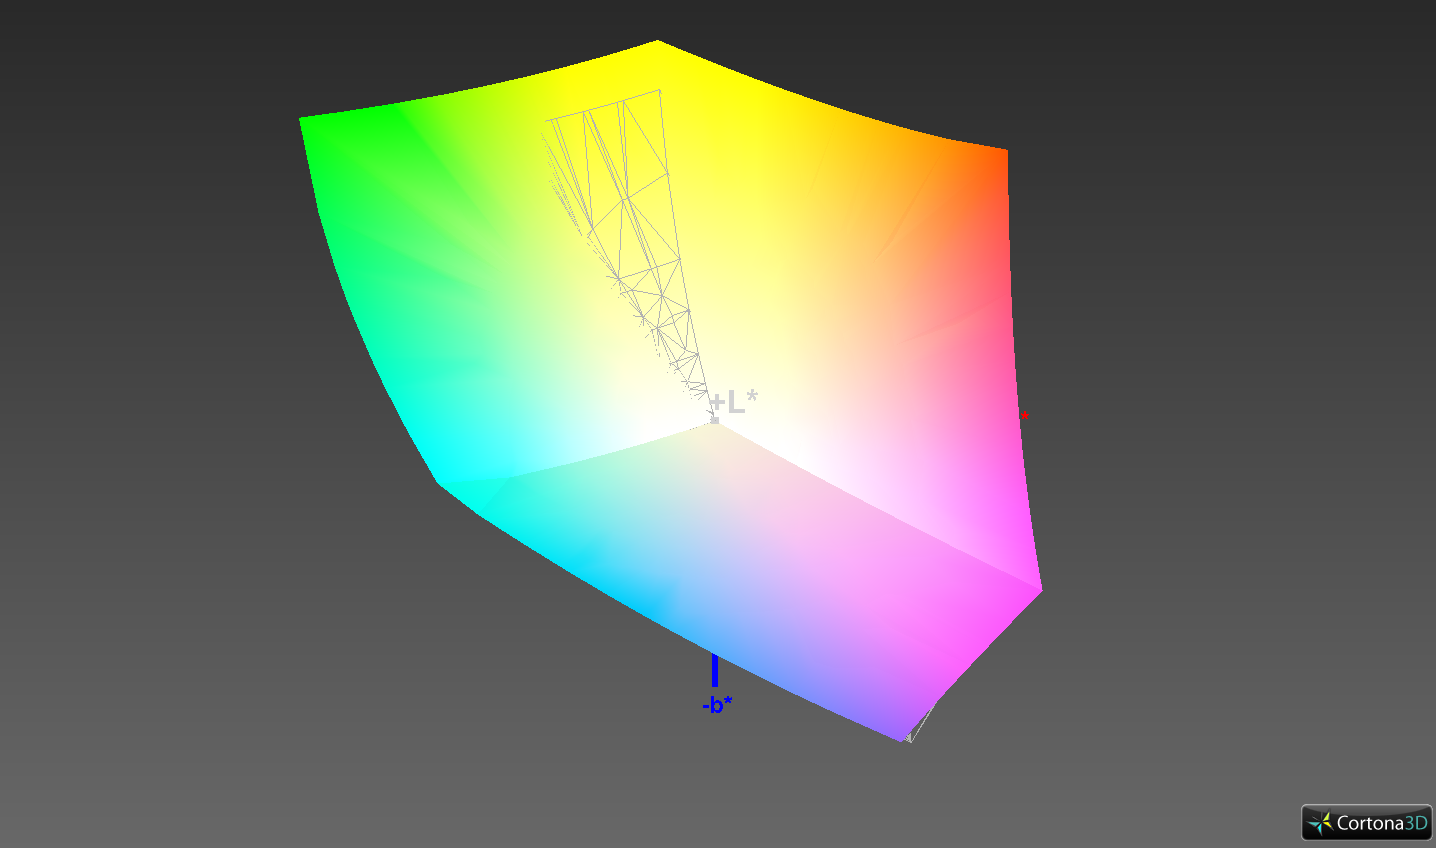
83.6% AdobeRGB 1998 (Argyll 1.6.3 3D)
96.9% AdobeRGB 1998 (Argyll 3D)
99.6% sRGB (Argyll 3D)
87.4% Display P3 (Argyll 3D)
Gamma: 2.14
CCT: 6842 K
| Lenovo ThinkBook 15p Gen1 4K CSOT T3 MNF601EA-1, IPS, 3840x2160, 15.6" | Lenovo ThinkBook 15 LP156WFC-SPD1, IPS, 1920x1080, 15.6" | Lenovo ThinkPad X1 Extreme Gen3-20TLS0UV00 N156HCE-GN1, IPS, 1920x1080, 15.6" | Asus ZenBook UX535-M01440 BOE0866, IPS, 3840x2160, 15.6" | Schenker Vision 15 BOE08F5, IPS, 1920x1080, 15.6" | Asus VivoBook 15 K571LI-PB71 Panda LM156LF-GL03, IPS, 1920x1080, 15.6" | |
|---|---|---|---|---|---|---|
| Display | -52% | -25% | -16% | -18% | -50% | |
| Display P3 Coverage (%) | 87.4 | 38.38 -56% | 61 -30% | 68.8 -21% | 69.3 -21% | 40.2 -54% |
| sRGB Coverage (%) | 99.6 | 57.7 -42% | 89.9 -10% | 99.5 0% | 94 -6% | 60.4 -39% |
| AdobeRGB 1998 Coverage (%) | 96.9 | 39.67 -59% | 62.2 -36% | 70.1 -28% | 70.8 -27% | 41.56 -57% |
| Response Times | 6% | 21% | 17% | -40% | 24% | |
| Response Time Grey 50% / Grey 80% * (ms) | 44.8 ? | 37.6 ? 16% | 33.6 ? 25% | 34 ? 24% | 60 ? -34% | 28.4 ? 37% |
| Response Time Black / White * (ms) | 26.8 ? | 28 ? -4% | 22.4 ? 16% | 24 ? 10% | 39 ? -46% | 24 ? 10% |
| PWM Frequency (Hz) | 26040 ? | |||||
| Screen | -103% | -22% | -24% | -46% | -114% | |
| Brightness middle (cd/m²) | 599 | 245 -59% | 518 -14% | 402 -33% | 478 -20% | 263.9 -56% |
| Brightness (cd/m²) | 599 | 239 -60% | 513 -14% | 375 -37% | 462 -23% | 246 -59% |
| Brightness Distribution (%) | 91 | 82 -10% | 88 -3% | 84 -8% | 94 3% | 87 -4% |
| Black Level * (cd/m²) | 0.37 | 0.25 32% | 0.38 -3% | 0.35 5% | 0.27 27% | 0.26 30% |
| Contrast (:1) | 1619 | 980 -39% | 1363 -16% | 1149 -29% | 1770 9% | 1015 -37% |
| Colorchecker dE 2000 * | 1.4 | 5.6 -300% | 2.1 -50% | 2.47 -76% | 3.2 -129% | 5.56 -297% |
| Colorchecker dE 2000 max. * | 2.9 | 15.6 -438% | 4.5 -55% | 4.32 -49% | 8.4 -190% | 16.11 -456% |
| Greyscale dE 2000 * | 2.2 | 3.4 -55% | 2.7 -23% | 2.26 -3% | 4.5 -105% | 5.8 -164% |
| Gamma | 2.14 103% | 2.3 96% | 2.35 94% | 2.49 88% | 2.16 102% | 2.16 102% |
| CCT | 6842 95% | 7156 91% | 7042 92% | 6285 103% | 6788 96% | 7828 83% |
| Color Space (Percent of AdobeRGB 1998) (%) | 83.6 | 36.5 -56% | 57.7 -31% | 99 18% | 63.1 -25% | 38.2 -54% |
| Color Space (Percent of sRGB) (%) | 99.5 | 57.5 -42% | 90.4 -9% | 93.6 -6% | 60.1 -40% | |
| Colorchecker dE 2000 calibrated * | 4.8 | 1.3 | 2.36 | 2 | 4.3 | |
| Total Average (Program / Settings) | -50% /
-78% | -9% /
-17% | -8% /
-16% | -35% /
-40% | -47% /
-83% |
* ... smaller is better
At 1619 : 1, the contrast is also more than decent and only barely surpassed by the Schenker Vision 15. As in the ThinkPad, the black value, on the other hand, leaves some room for improvement.
The display is adjusted well in the state of delivery. The color deviations are minimal and cannot be further optimized.
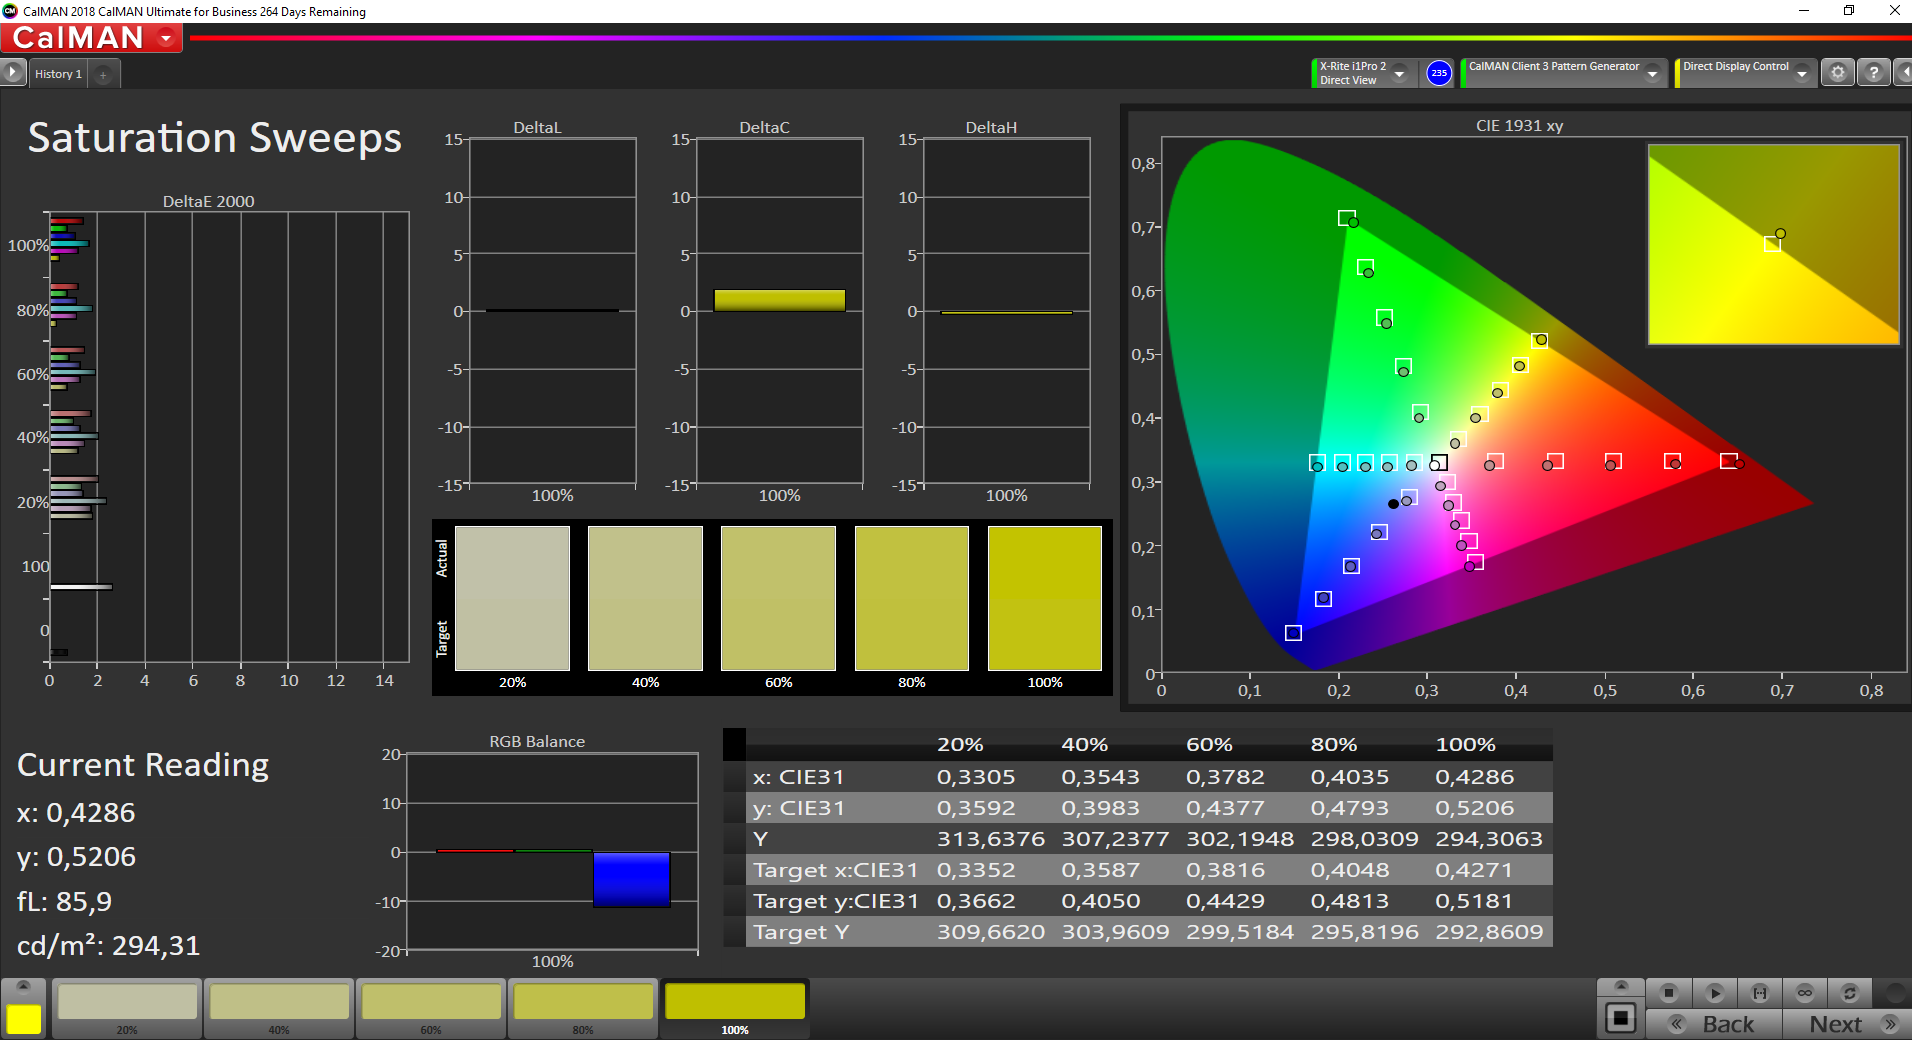
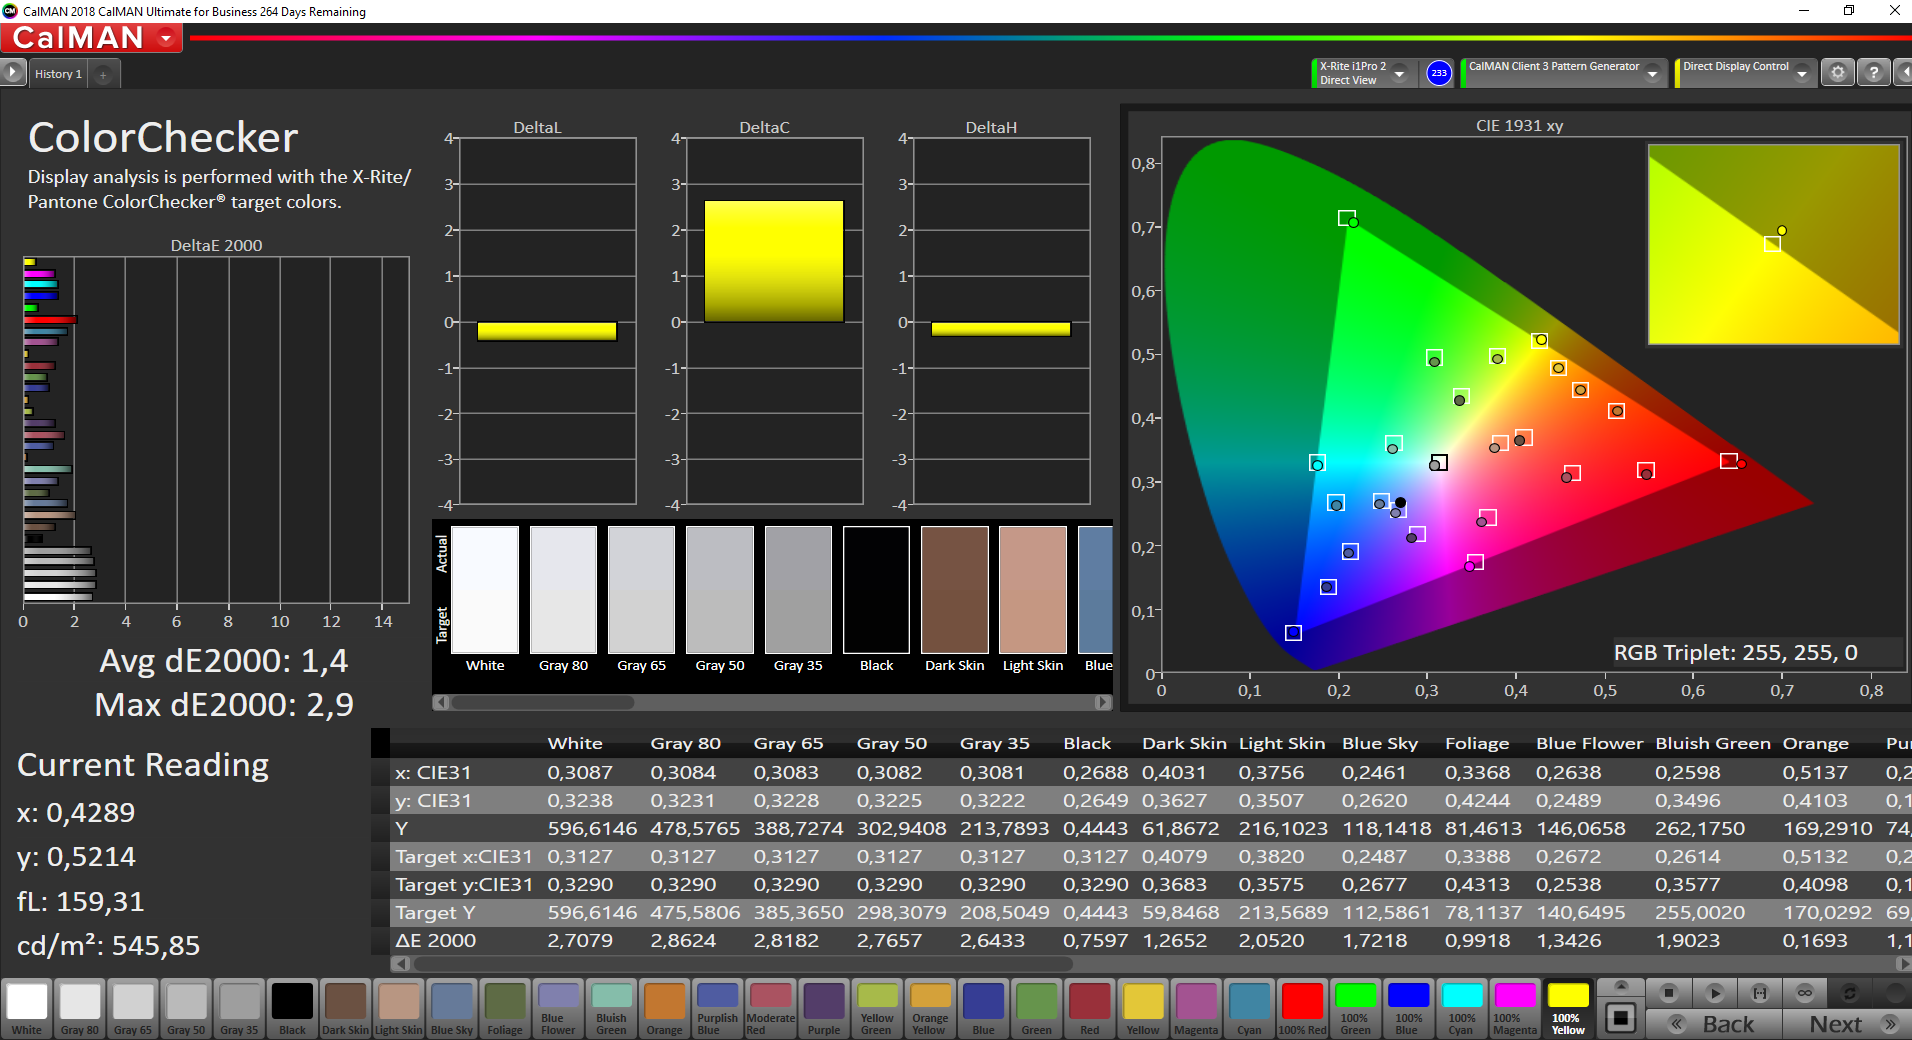
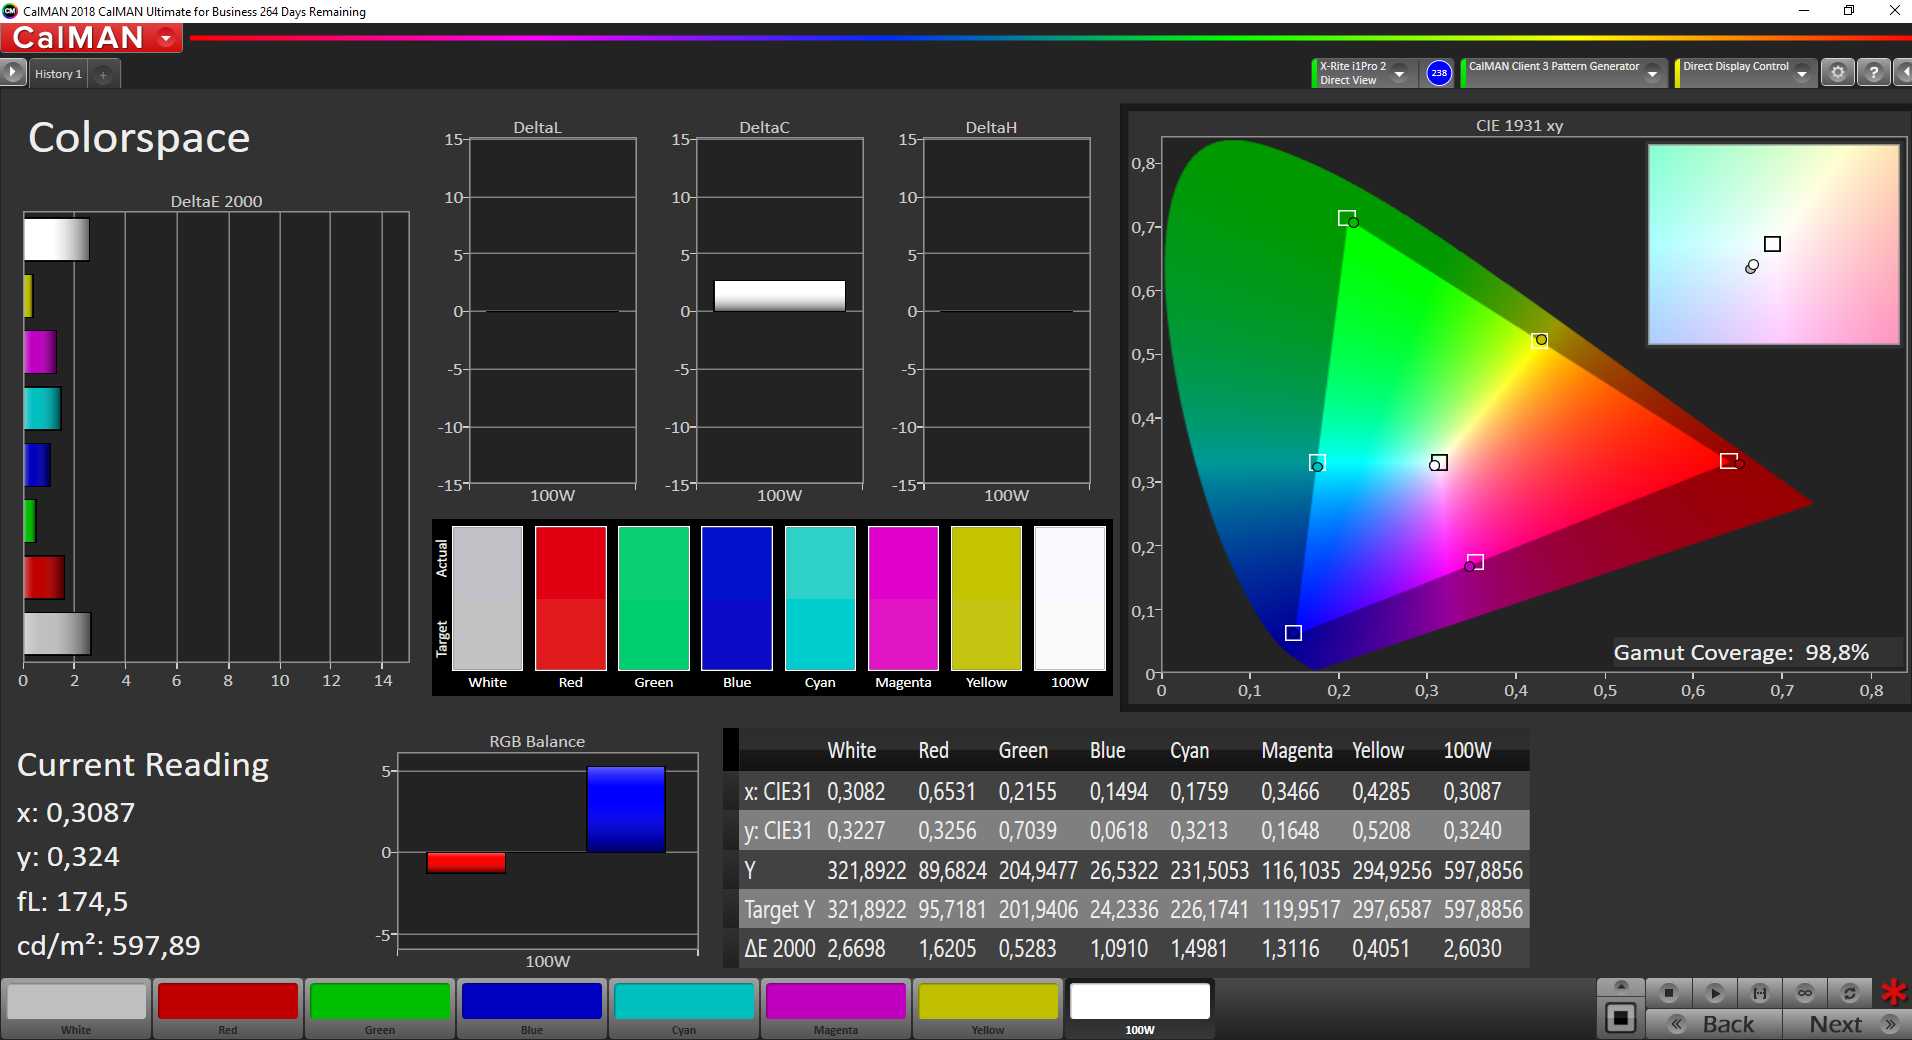
For the color space coverage, the manufacturer specifies 100% AdobeRGB (2D overlap) coverage. We measure 83.6% for the 3D overlap. Only the Asus ZenBook actually achieves almost 100% here.
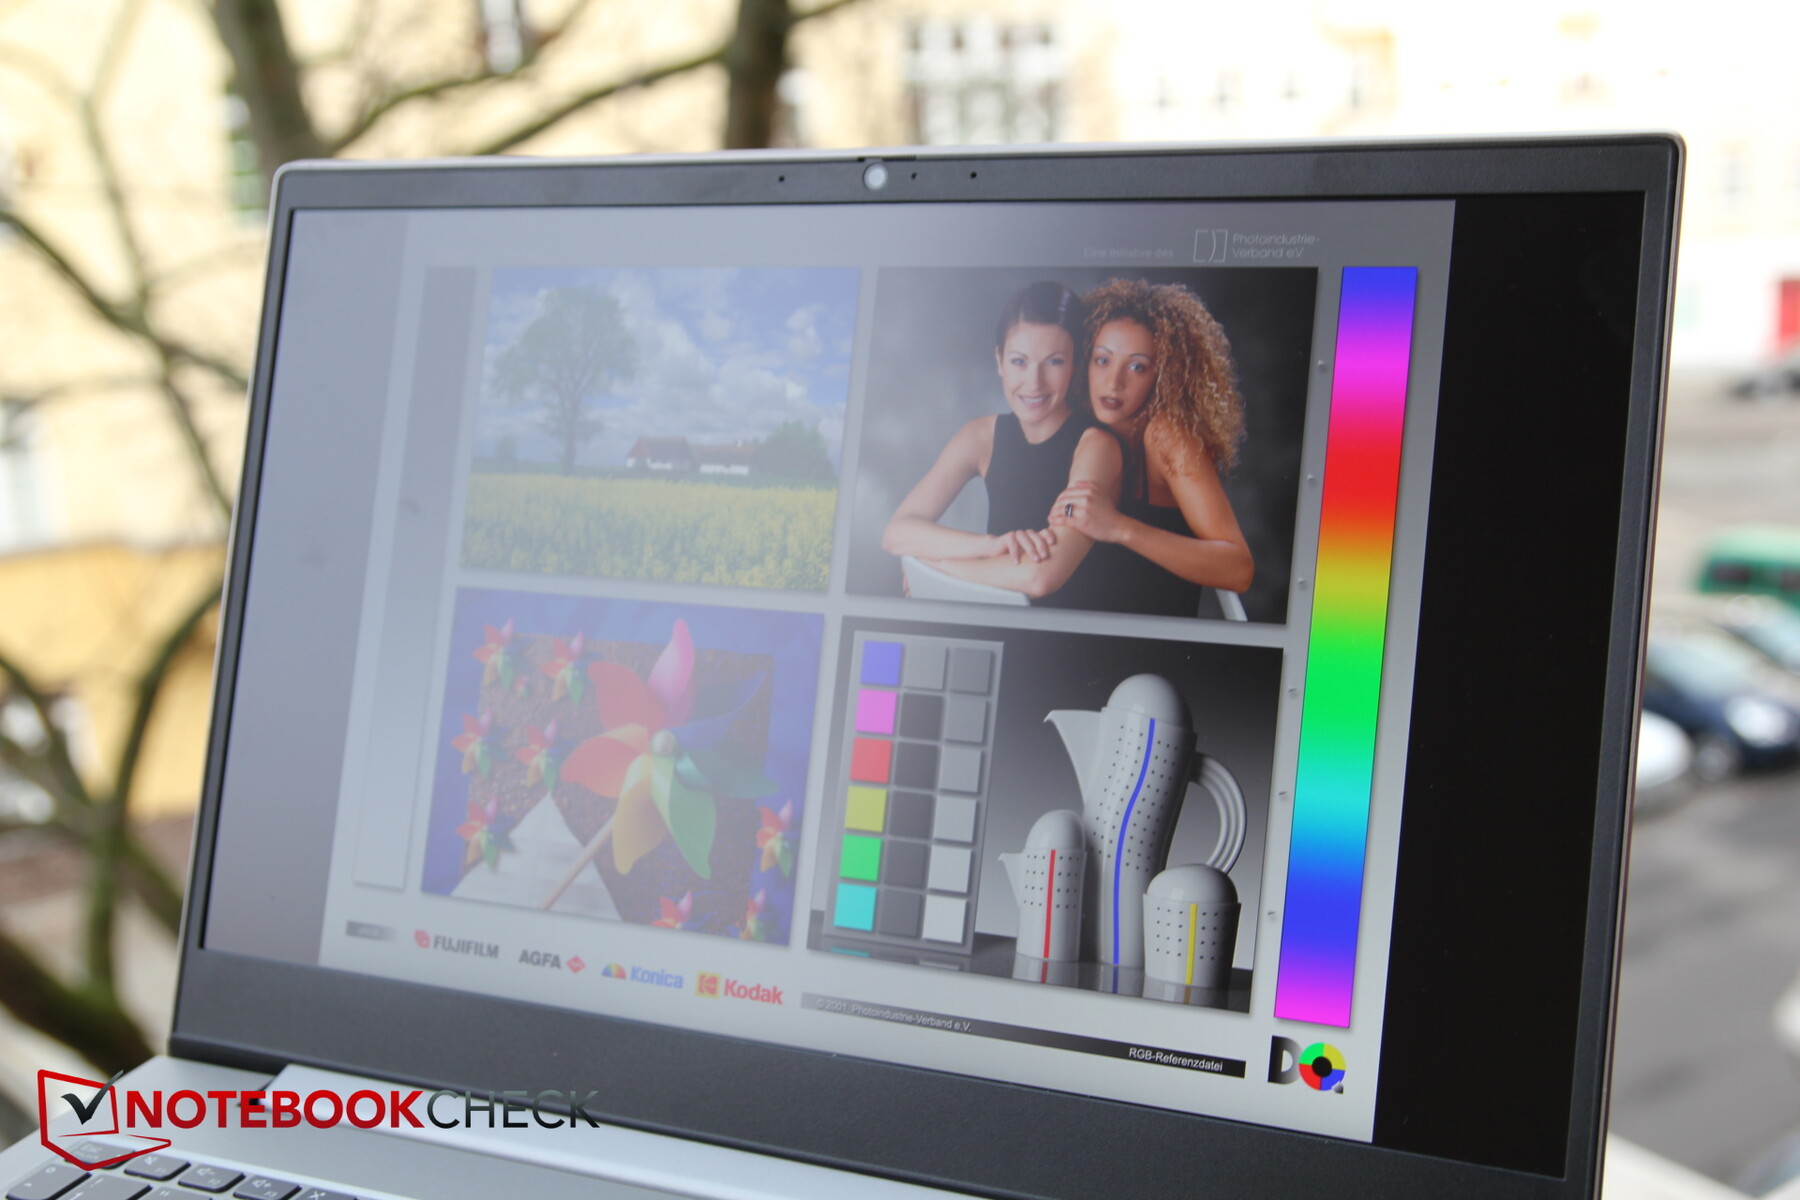
With about 600 nits of brightness, a good contrast, and a matte surface, nothing should prevent you from being able to use the display outside.
Display Response Times
| ↔ Response Time Black to White | ||
|---|---|---|
| 26.8 ms ... rise ↗ and fall ↘ combined | ↗ 12.8 ms rise | 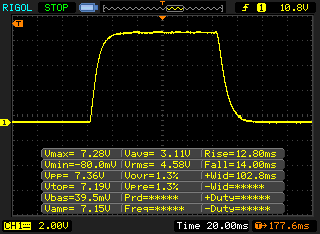 |
| ↘ 14 ms fall | ||
| The screen shows relatively slow response rates in our tests and may be too slow for gamers. In comparison, all tested devices range from 0.1 (minimum) to 240 (maximum) ms. » 66 % of all devices are better. This means that the measured response time is worse than the average of all tested devices (20.2 ms). | ||
| ↔ Response Time 50% Grey to 80% Grey | ||
| 44.8 ms ... rise ↗ and fall ↘ combined | ↗ 21.2 ms rise | 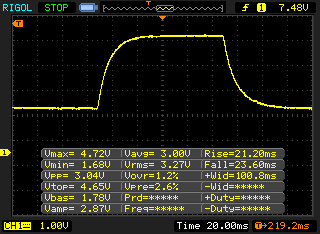 |
| ↘ 23.6 ms fall | ||
| The screen shows slow response rates in our tests and will be unsatisfactory for gamers. In comparison, all tested devices range from 0.165 (minimum) to 636 (maximum) ms. » 75 % of all devices are better. This means that the measured response time is worse than the average of all tested devices (31.6 ms). | ||
Screen Flickering / PWM (Pulse-Width Modulation)
| Screen flickering / PWM not detected |  | ||
In comparison: 53 % of all tested devices do not use PWM to dim the display. If PWM was detected, an average of 8111 (minimum: 5 - maximum: 343500) Hz was measured. | |||
Looking at the IPS display from steep viewing angles, you won't lose much image detail in terms of brightness.

Performance - Full speed ahead in the ThinkBook 15p
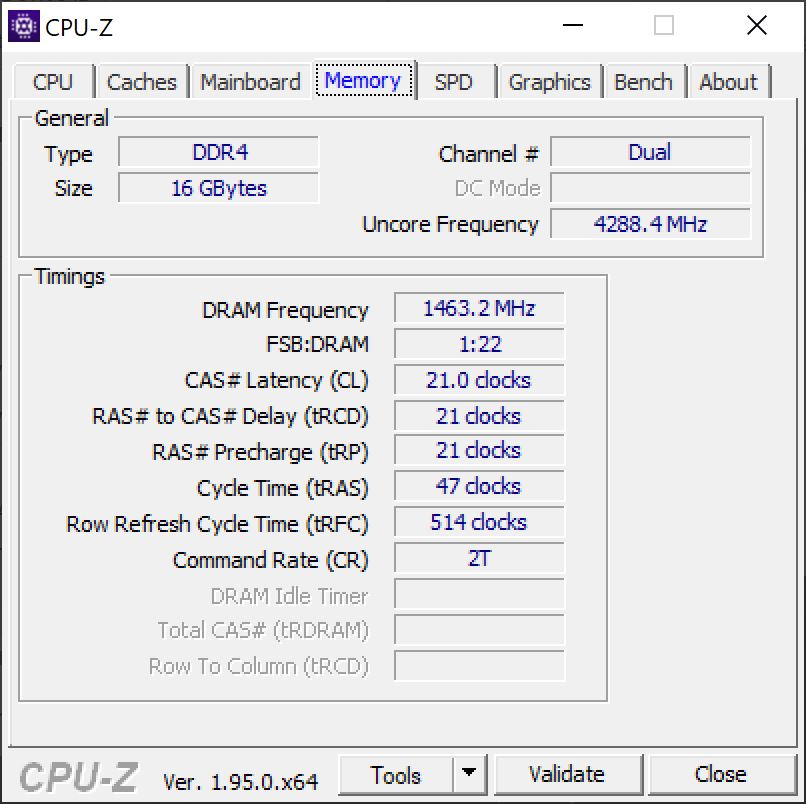
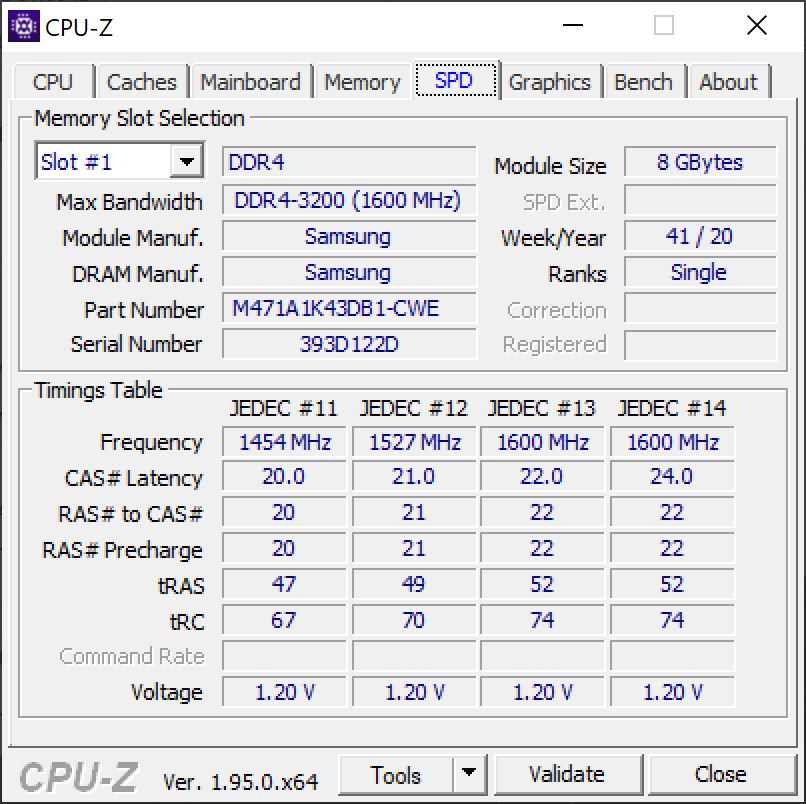
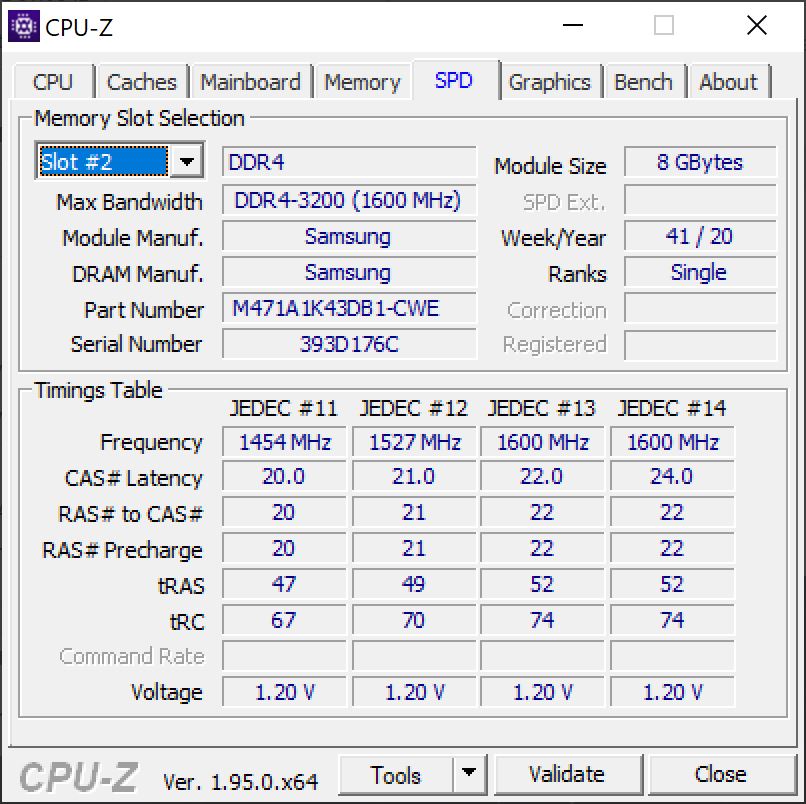
In contrast to the ThinkBook 15 (without the "p"), Lenovo does not use an efficient Tiger Lake processor but Comet Lake (Intel Gen 10), combining this with an Nvidia Geforce GTX 1650 Ti Max-Q and 16 GB RAM in dual channel mode. This qualifies the ThinkBook 15p as a multimedia allrounder, allowing you to use it in equal measure for image and video processing as well as gaming - at least on paper.
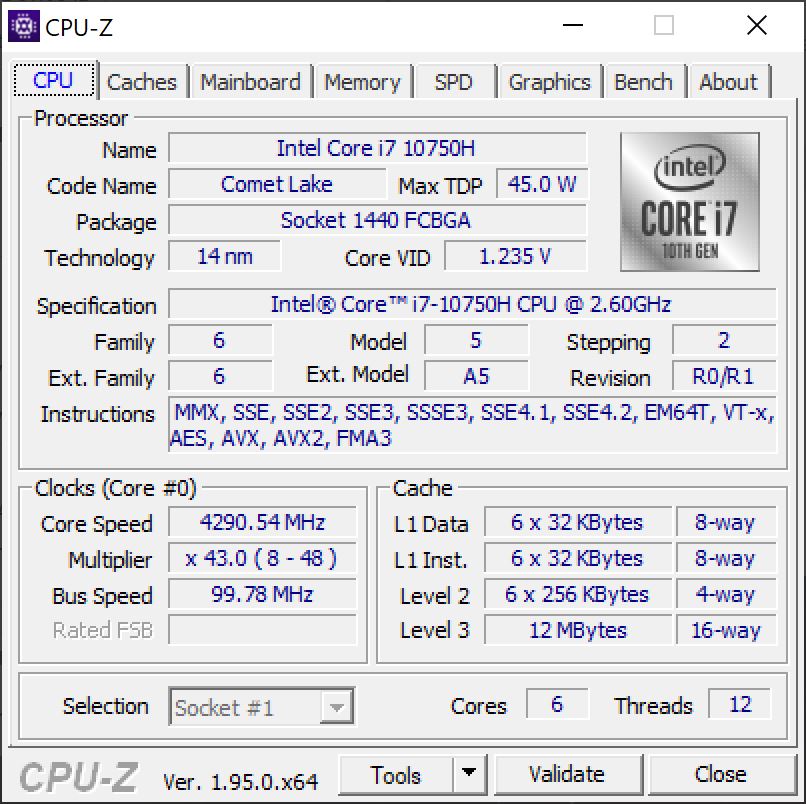
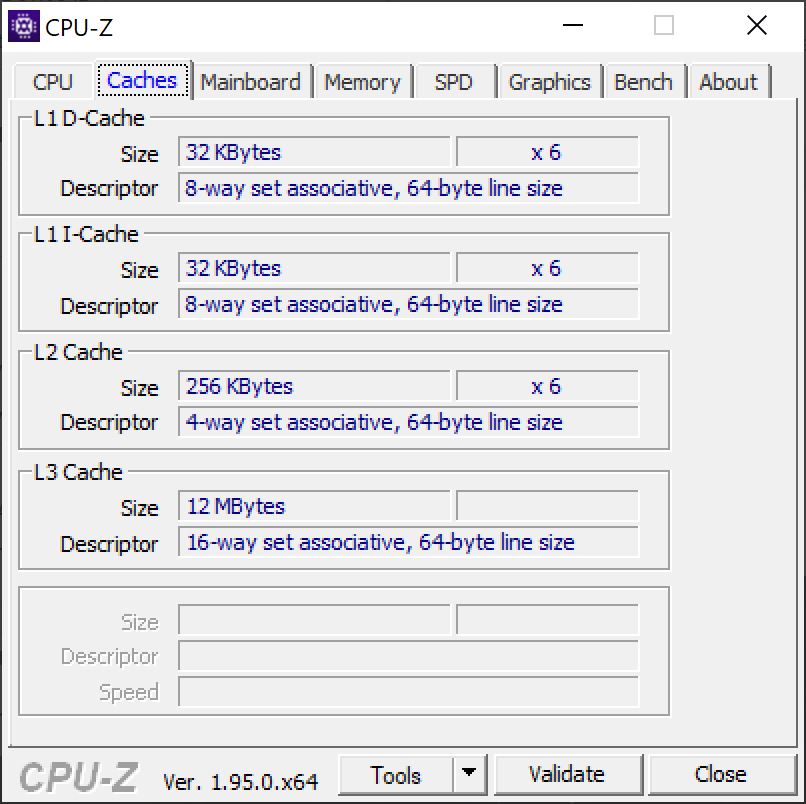
Processor
The Intel Core i7-10750H is a Comet Lake CPU from last year whose six cores have a clock speed of 2.6 to 5 GHz, and it can also achieve a Turbo speed of 4.3 GHz on all cores simultaneously. The integrated UHD Graphics 630 graphics unit is only suited for less demanding graphics tasks.
In the Cinebench loop, the CPU will briefly reach a TDP von 88 watts and then quickly drop to 50 watts for the rest of the first and subsequent loops. During the start of each new loop, the TDP briefly reaches about 75 watts before dropping to 50 watts again. After about 15 minutes, it only reaches 45 watts. This means that the first run is about 9% faster than the subsequent runs in the next 15 minutes, and after that the performance drops again by 5%.
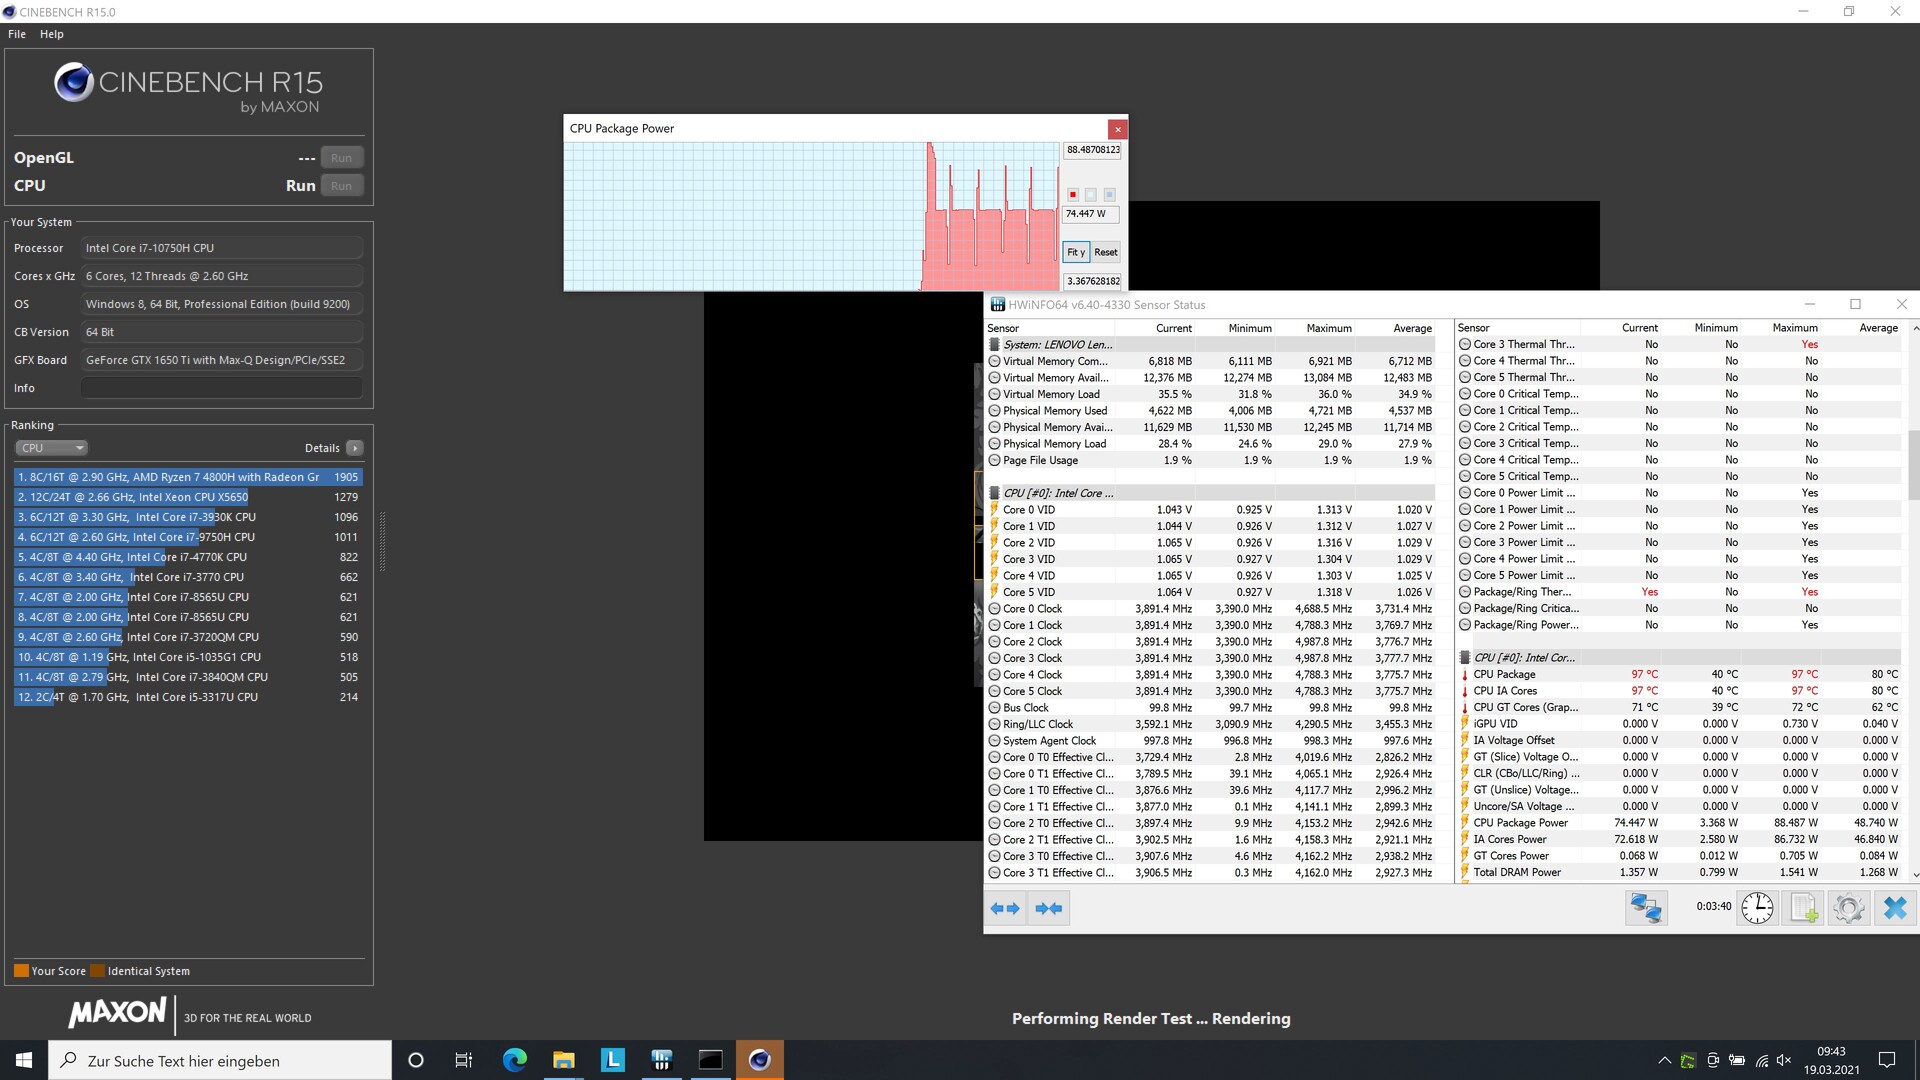
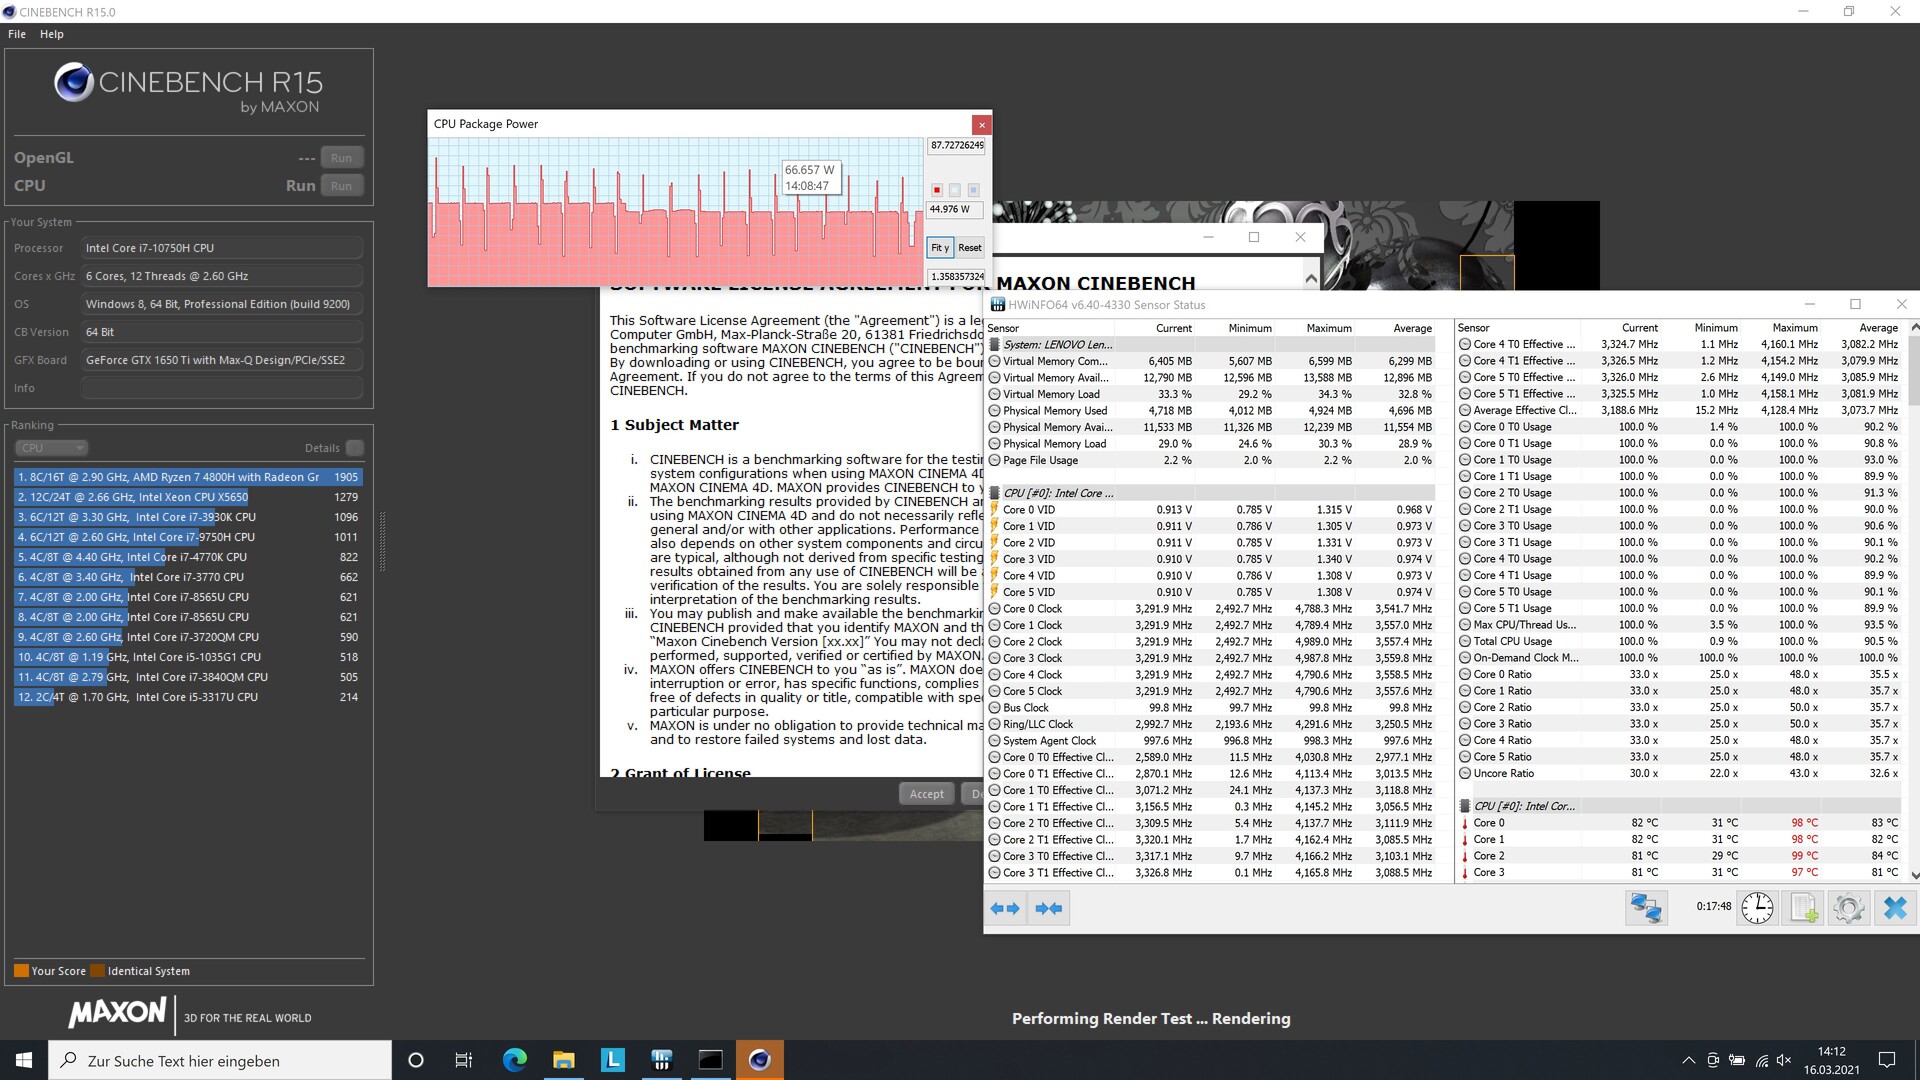
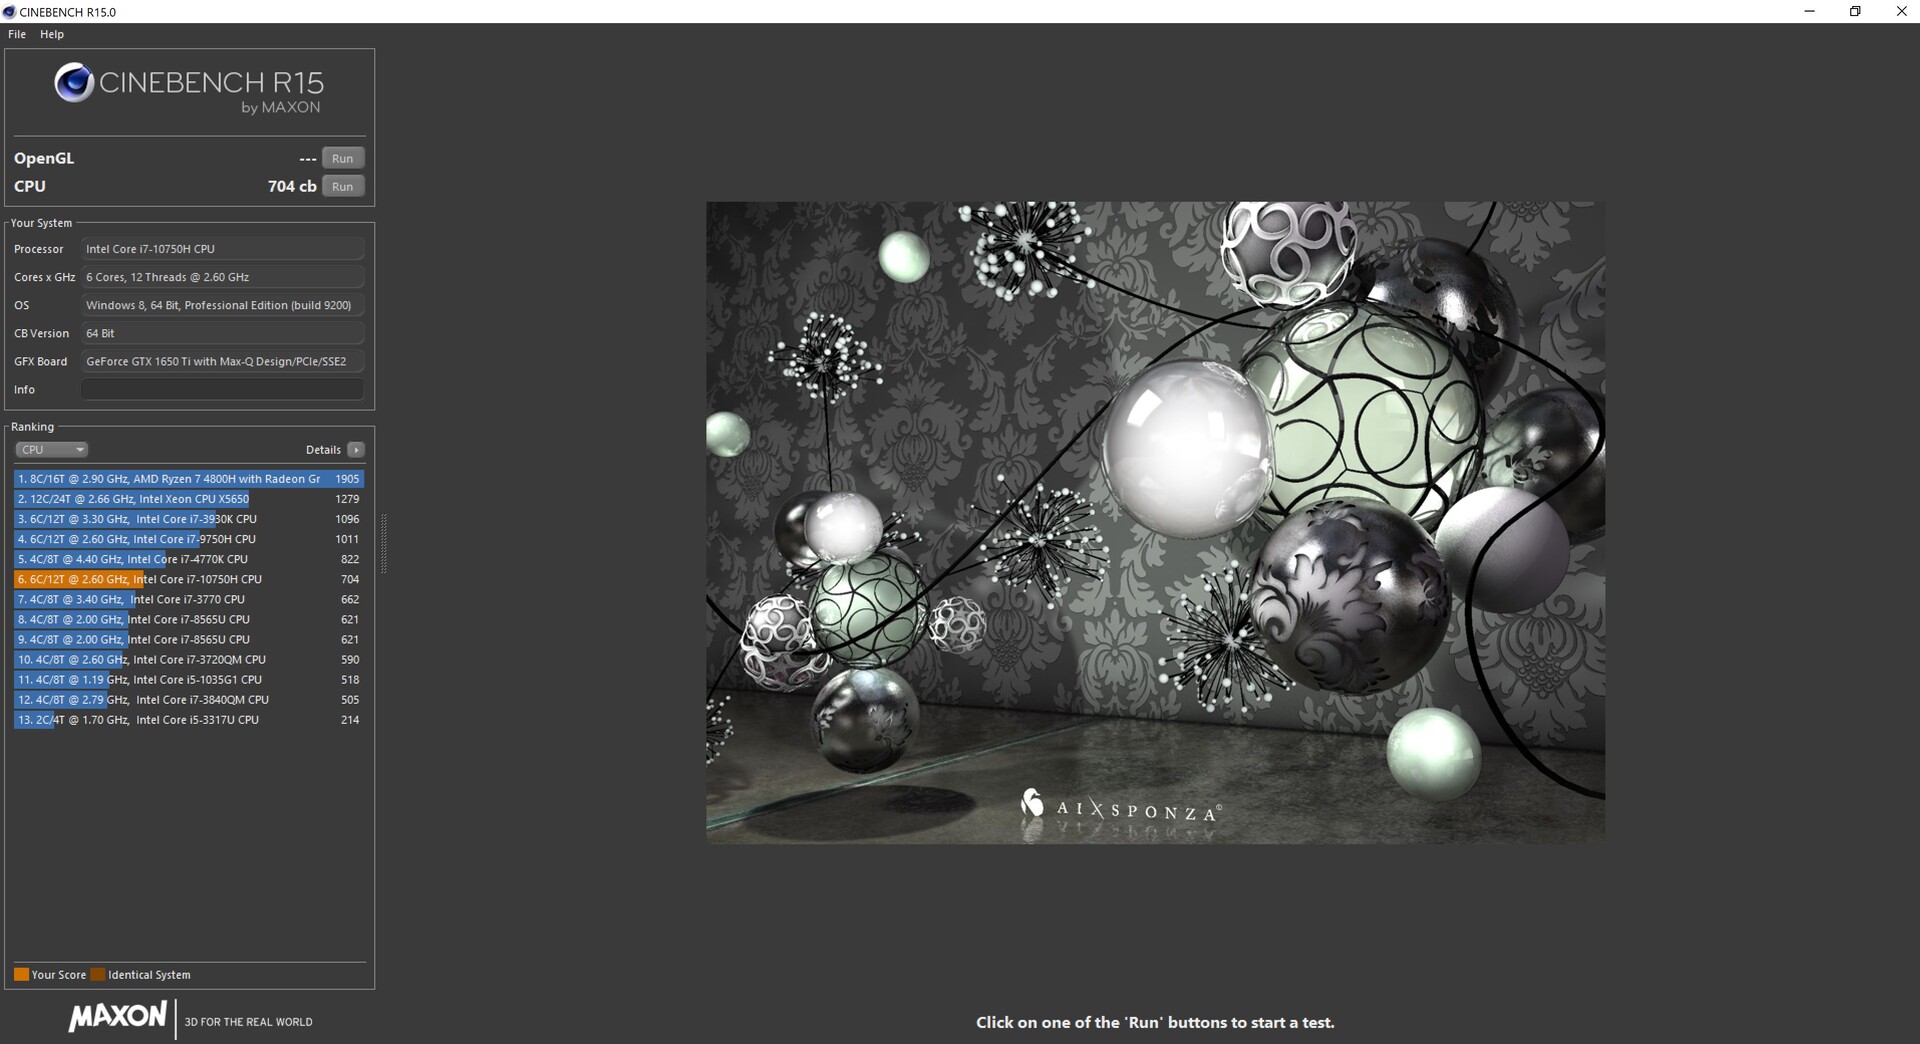
In the comparison, the ThinkPad X1 and the Asus ZenBook with the same CPU run minimally faster. The CPU in the ThinkBook 15p runs about 5 to 10% below the average of all laptops with the same processor.
In battery operation, the performance drops more significantly by a whole 42%.
Cinebench R15: CPU Single 64Bit | CPU Multi 64Bit
Blender: v2.79 BMW27 CPU
7-Zip 18.03: 7z b 4 -mmt1 | 7z b 4
Geekbench 5.5: Single-Core | Multi-Core
HWBOT x265 Benchmark v2.2: 4k Preset
LibreOffice : 20 Documents To PDF
R Benchmark 2.5: Overall mean
| Cinebench R20 / CPU (Single Core) | |
| Average of class Multimedia (420 - 853, n=60, last 2 years) | |
| Schenker Vision 15 | |
| Lenovo ThinkPad X1 Extreme Gen3-20TLS0UV00 | |
| Average Intel Core i7-10750H (431 - 504, n=43) | |
| Asus ZenBook UX535-M01440 | |
| Asus VivoBook 15 K571LI-PB71 | |
| Lenovo ThinkBook 15p Gen1 4K | |
| Lenovo ThinkBook 15 | |
| Cinebench R20 / CPU (Multi Core) | |
| Average of class Multimedia (1887 - 11924, n=60, last 2 years) | |
| Asus ZenBook UX535-M01440 | |
| Average Intel Core i7-10750H (1749 - 3325, n=43) | |
| Lenovo ThinkPad X1 Extreme Gen3-20TLS0UV00 | |
| Lenovo ThinkBook 15p Gen1 4K | |
| Asus VivoBook 15 K571LI-PB71 | |
| Schenker Vision 15 | |
| Lenovo ThinkBook 15 | |
| Cinebench R15 / CPU Single 64Bit | |
| Average of class Multimedia (99.6 - 323, n=63, last 2 years) | |
| Schenker Vision 15 | |
| Lenovo ThinkPad X1 Extreme Gen3-20TLS0UV00 | |
| Asus ZenBook UX535-M01440 | |
| Average Intel Core i7-10750H (184 - 213, n=45) | |
| Asus VivoBook 15 K571LI-PB71 | |
| Lenovo ThinkBook 15p Gen1 4K | |
| Lenovo ThinkBook 15 | |
| Cinebench R15 / CPU Multi 64Bit | |
| Average of class Multimedia (856 - 5224, n=66, last 2 years) | |
| Asus ZenBook UX535-M01440 | |
| Average Intel Core i7-10750H (804 - 1418, n=50) | |
| Lenovo ThinkPad X1 Extreme Gen3-20TLS0UV00 | |
| Lenovo ThinkBook 15p Gen1 4K | |
| Asus VivoBook 15 K571LI-PB71 | |
| Schenker Vision 15 | |
| Lenovo ThinkBook 15 | |
| Blender / v2.79 BMW27 CPU | |
| Lenovo ThinkBook 15 | |
| Schenker Vision 15 | |
| Asus VivoBook 15 K571LI-PB71 | |
| Lenovo ThinkBook 15p Gen1 4K | |
| Asus ZenBook UX535-M01440 | |
| Average Intel Core i7-10750H (322 - 587, n=43) | |
| Lenovo ThinkPad X1 Extreme Gen3-20TLS0UV00 | |
| Average of class Multimedia (100 - 557, n=61, last 2 years) | |
| 7-Zip 18.03 / 7z b 4 -mmt1 | |
| Average of class Multimedia (3666 - 7545, n=59, last 2 years) | |
| Lenovo ThinkPad X1 Extreme Gen3-20TLS0UV00 | |
| Asus ZenBook UX535-M01440 | |
| Lenovo ThinkBook 15p Gen1 4K | |
| Asus VivoBook 15 K571LI-PB71 | |
| Average Intel Core i7-10750H (4504 - 5470, n=43) | |
| Schenker Vision 15 | |
| Lenovo ThinkBook 15 | |
| 7-Zip 18.03 / 7z b 4 | |
| Average of class Multimedia (29095 - 130368, n=59, last 2 years) | |
| Lenovo ThinkPad X1 Extreme Gen3-20TLS0UV00 | |
| Average Intel Core i7-10750H (26040 - 37345, n=43) | |
| Asus ZenBook UX535-M01440 | |
| Lenovo ThinkBook 15p Gen1 4K | |
| Asus VivoBook 15 K571LI-PB71 | |
| Schenker Vision 15 | |
| Lenovo ThinkBook 15 | |
| Geekbench 5.5 / Single-Core | |
| Average of class Multimedia (805 - 2974, n=60, last 2 years) | |
| Schenker Vision 15 | |
| Lenovo ThinkPad X1 Extreme Gen3-20TLS0UV00 | |
| Asus ZenBook UX535-M01440 | |
| Asus VivoBook 15 K571LI-PB71 | |
| Average Intel Core i7-10750H (1114 - 1333, n=43) | |
| Lenovo ThinkBook 15p Gen1 4K | |
| Geekbench 5.5 / Multi-Core | |
| Average of class Multimedia (4652 - 20422, n=60, last 2 years) | |
| Lenovo ThinkBook 15p Gen1 4K | |
| Asus VivoBook 15 K571LI-PB71 | |
| Average Intel Core i7-10750H (4443 - 6674, n=43) | |
| Schenker Vision 15 | |
| Asus ZenBook UX535-M01440 | |
| Lenovo ThinkPad X1 Extreme Gen3-20TLS0UV00 | |
| HWBOT x265 Benchmark v2.2 / 4k Preset | |
| Average of class Multimedia (5.26 - 34.3, n=59, last 2 years) | |
| Asus ZenBook UX535-M01440 | |
| Average Intel Core i7-10750H (5.54 - 11.6, n=43) | |
| Lenovo ThinkPad X1 Extreme Gen3-20TLS0UV00 | |
| Lenovo ThinkBook 15p Gen1 4K | |
| Asus VivoBook 15 K571LI-PB71 | |
| Schenker Vision 15 | |
| Lenovo ThinkBook 15 | |
| LibreOffice / 20 Documents To PDF | |
| Asus ZenBook UX535-M01440 | |
| Lenovo ThinkBook 15p Gen1 4K | |
| Average Intel Core i7-10750H (43.1 - 99.2, n=43) | |
| Average of class Multimedia (23.9 - 146.7, n=60, last 2 years) | |
| Lenovo ThinkPad X1 Extreme Gen3-20TLS0UV00 | |
| Asus VivoBook 15 K571LI-PB71 | |
| Schenker Vision 15 | |
| R Benchmark 2.5 / Overall mean | |
| Average Intel Core i7-10750H (0.578 - 0.708, n=42) | |
| Asus ZenBook UX535-M01440 | |
| Lenovo ThinkBook 15p Gen1 4K | |
| Asus VivoBook 15 K571LI-PB71 | |
| Lenovo ThinkPad X1 Extreme Gen3-20TLS0UV00 | |
| Schenker Vision 15 | |
| Average of class Multimedia (0.3604 - 0.947, n=59, last 2 years) | |
* ... smaller is better
System Performance
In PCMark 10, the differences between the competitors are small. The almost similarly equipped ThinkPad X1 and Asus ZenBook again tend to place ahead of the ThinkBook. However, the performance is almost at the expected level and only drops slightly in the "Essentials" subtest (-6 %).
| PCMark 10 Score | 4980 points | |
Help | ||
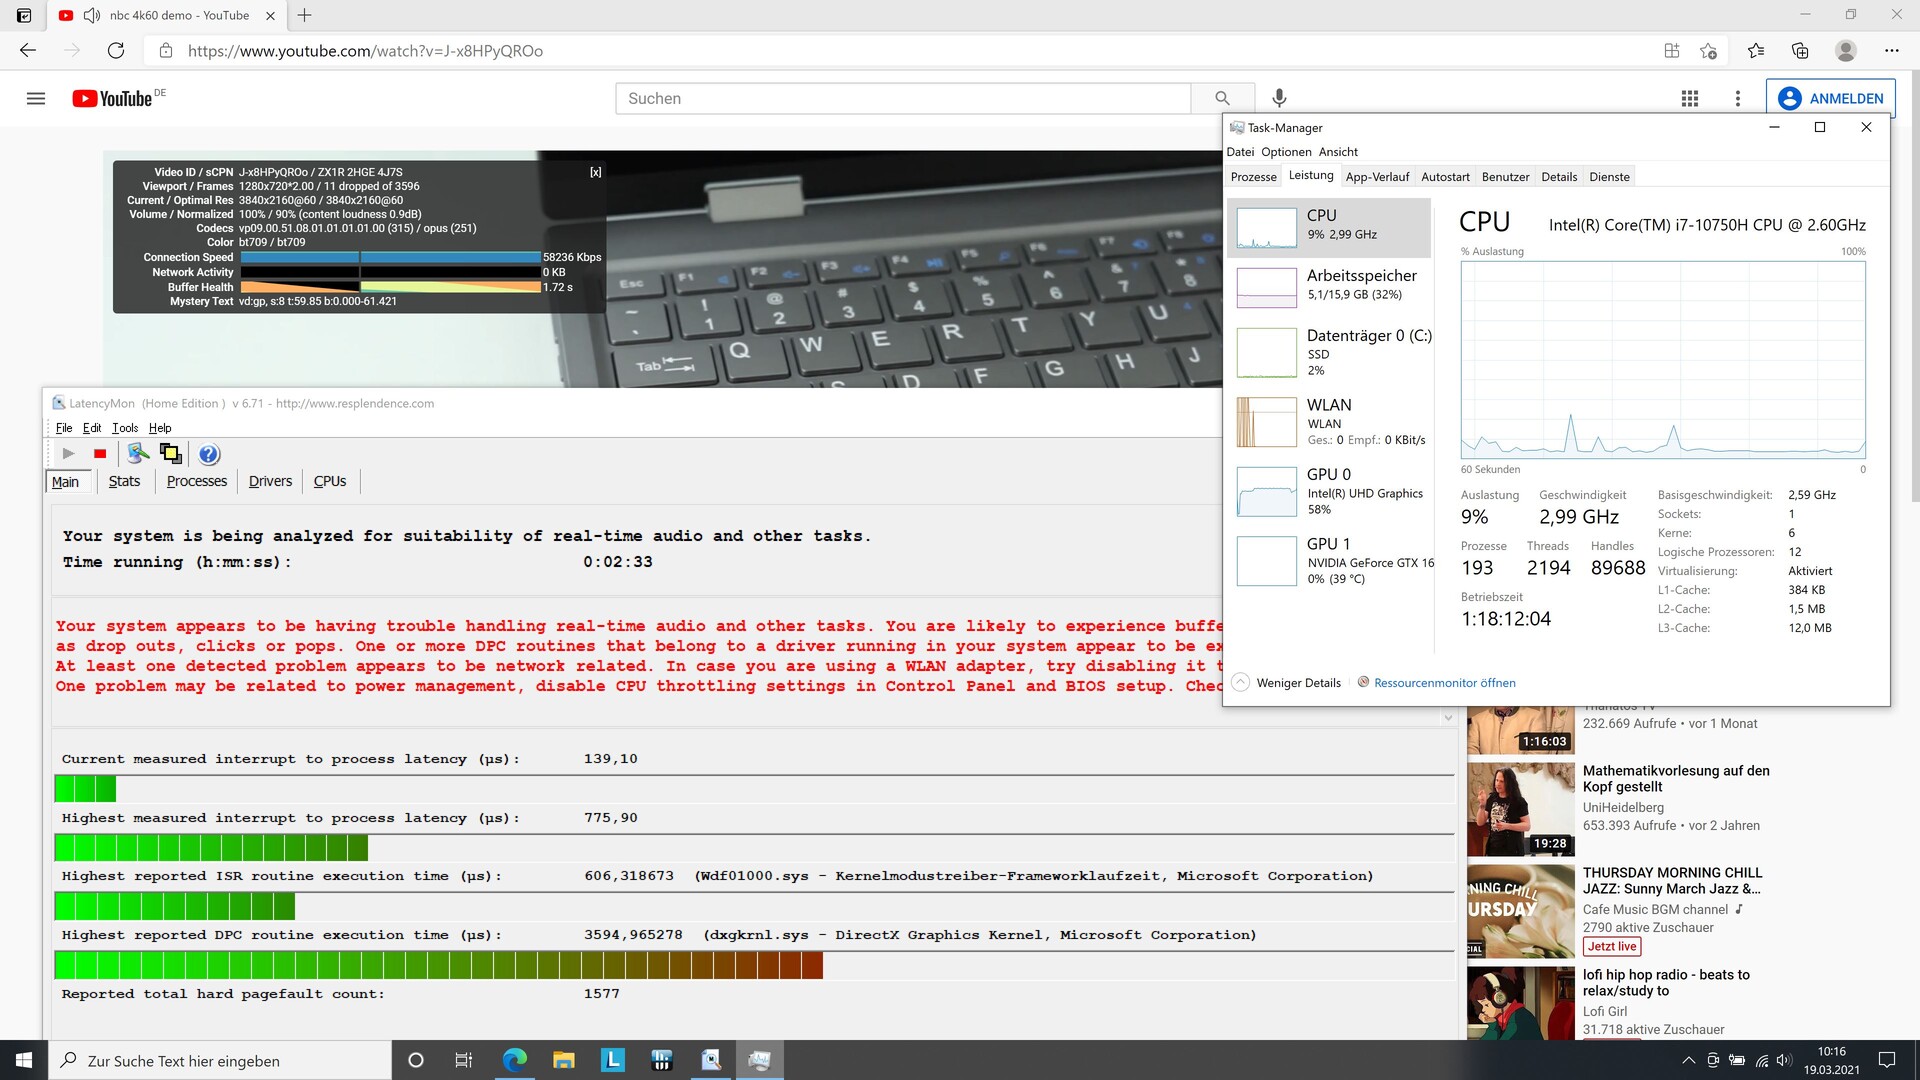
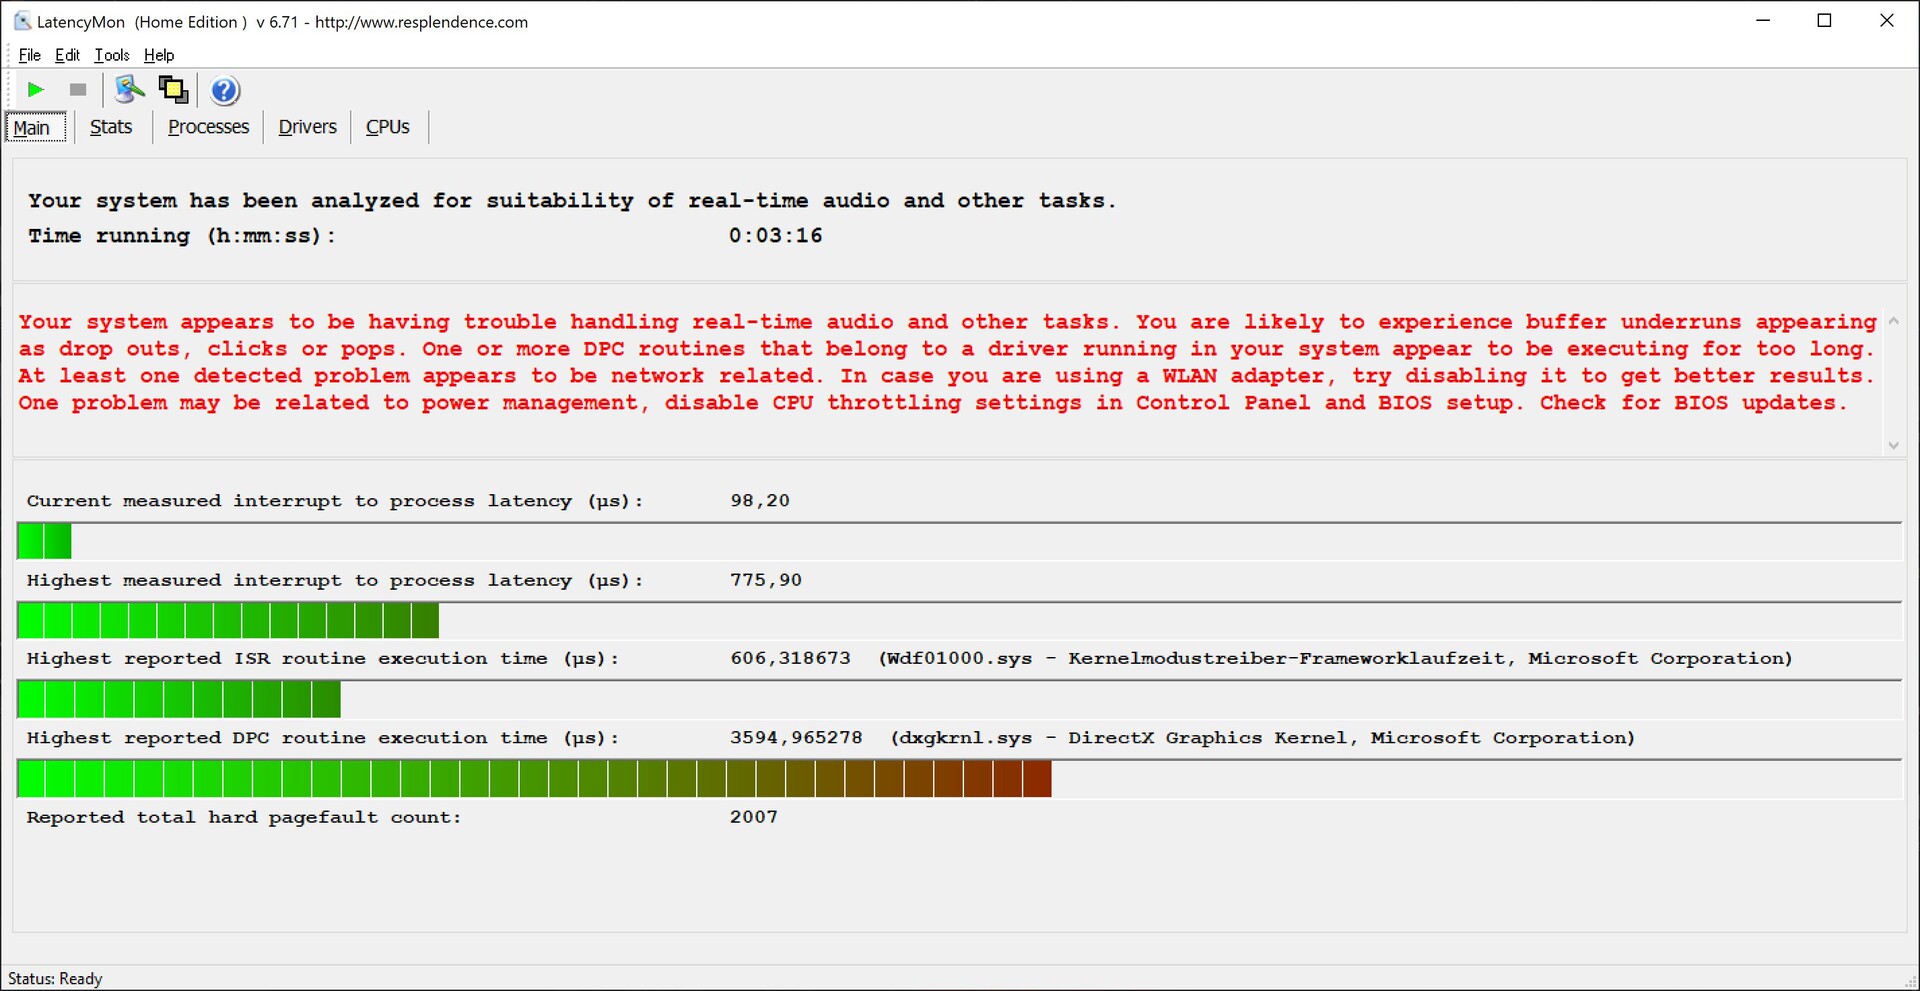
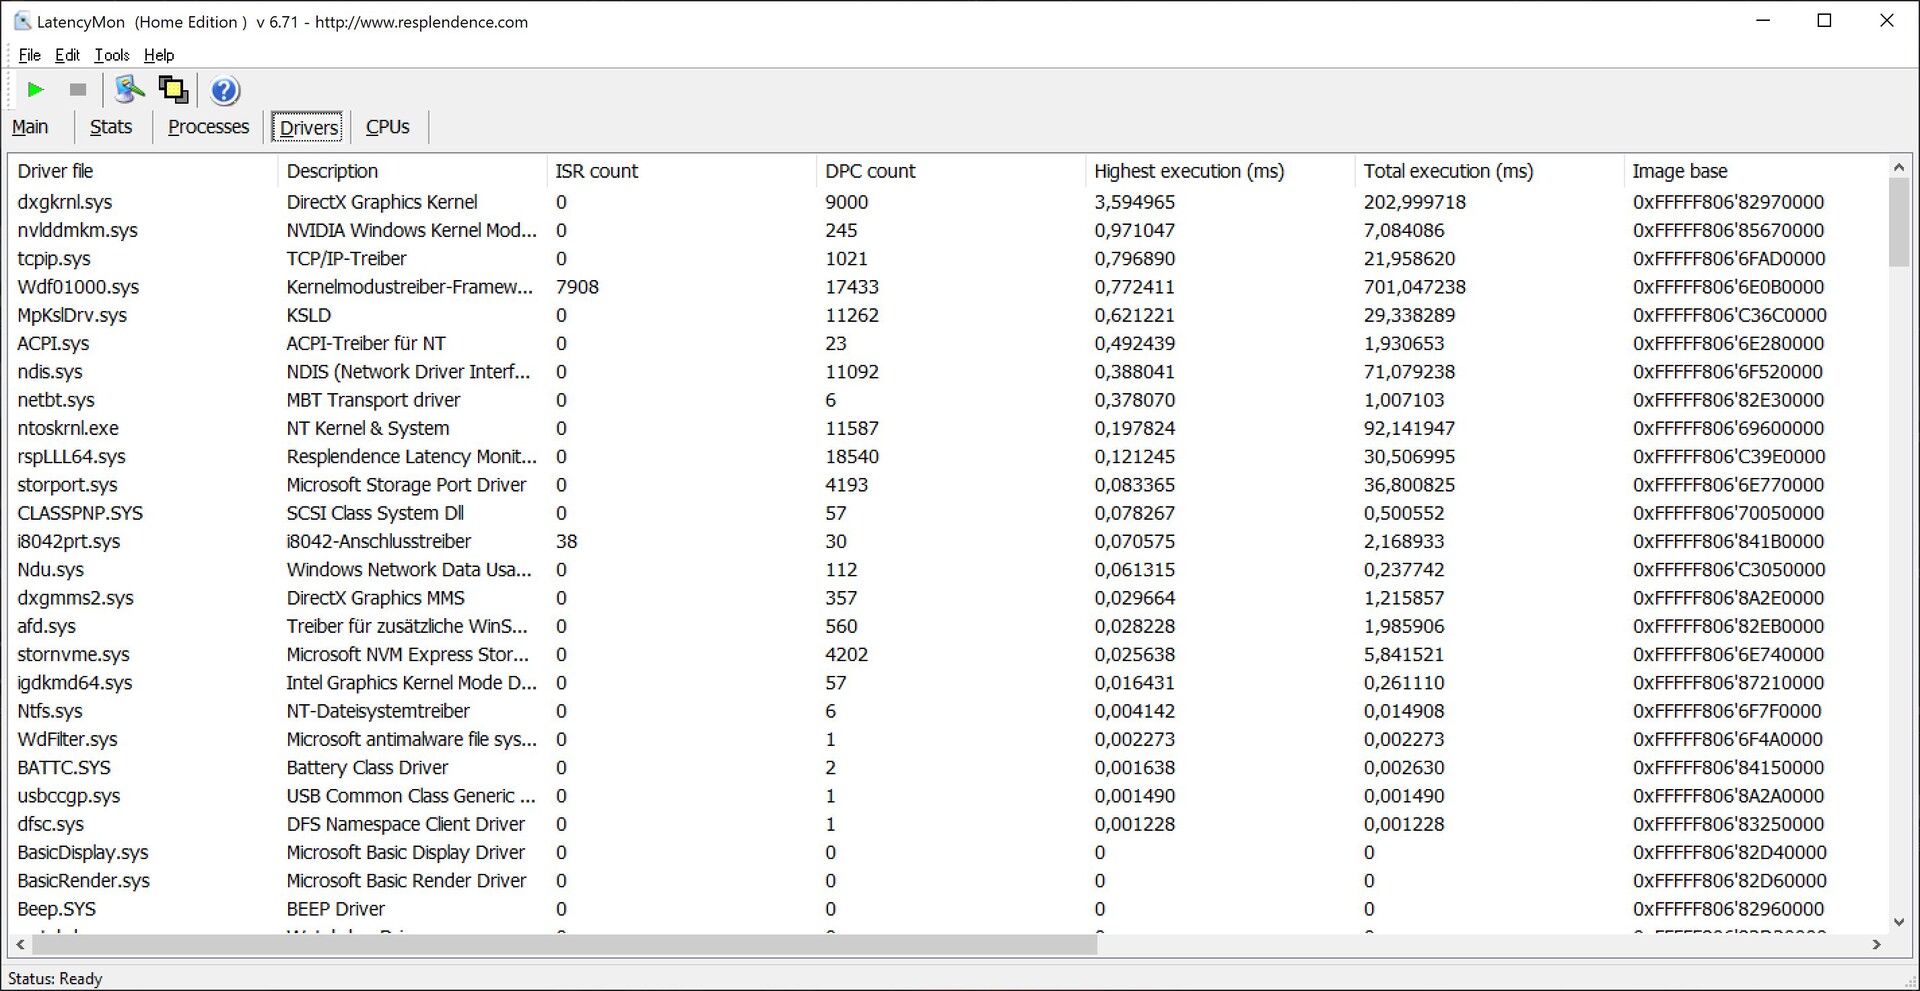
DPC Latencies
The LatencyMon tool determines that there are already some latencies when opening several browser tabs. When reproducing our 4K/60-fps test video on YouTube, there are 11 dropped frames. Those are not very good signs for a multimedia allrounder, and at least the real time audio reproduction might be problematic. Among other things, problems arise from a DirectX and an Nvidia driver as well as the well-known framework runtime kernel mode driver.
| DPC Latencies / LatencyMon - interrupt to process latency (max), Web, Youtube, Prime95 | |
| Schenker Vision 15 | |
| Asus VivoBook 15 K571LI-PB71 | |
| Lenovo ThinkBook 15p Gen1 4K | |
| Asus ZenBook UX535-M01440 | |
| Lenovo ThinkPad X1 Extreme Gen3-20TLS0UV00 | |
* ... smaller is better
Storage Solution
An M.2 NVMe SSD from Western Digital with 1 TB of storage space represents the storage solution. In our list of best SSD/HDDs, this model achieves the 16th place, so it should offer some decent transfer rates. While it does indeed deliver good rates, the Samsung SSDs in the quasi predecessor and particularly in the Schenker Vision 15 are still a bit faster.
| Lenovo ThinkBook 15p Gen1 4K WDC PC SN730 SDBPNTY-1T00 | Lenovo ThinkBook 15 Samsung SSD PM981 MZVLB512HAJQ | Lenovo ThinkPad X1 Extreme Gen3-20TLS0UV00 Toshiba XG6 KXG6AZNV1T02 | Asus ZenBook UX535-M01440 WDC PC SN730 SDBPNTY-1T00 | Schenker Vision 15 Samsung SSD 980 Pro 1TB MZ-V8P1T0BW | Asus VivoBook 15 K571LI-PB71 Mushkin Helix-L 1TB MKNSSDHL1TB-08 | Average WDC PC SN730 SDBPNTY-1T00 | |
|---|---|---|---|---|---|---|---|
| CrystalDiskMark 5.2 / 6 | 5% | 8% | -12% | 81% | -4% | 2% | |
| Write 4K (MB/s) | 150.8 | 176.3 17% | 159.5 6% | 110 -27% | 238.1 58% | 169.7 13% | 139.9 ? -7% |
| Read 4K (MB/s) | 43.01 | 48.98 14% | 53.1 23% | 43.44 1% | 79.2 84% | 53.2 24% | 44.5 ? 3% |
| Write Seq (MB/s) | 2846 | 1789 -37% | 1723 -39% | 1957 -31% | 4139 45% | 1679 -41% | 2346 ? -18% |
| Read Seq (MB/s) | 2366 | 1671 -29% | 2164 -9% | 1615 -32% | 4133 75% | 1698 -28% | 2102 ? -11% |
| Write 4K Q32T1 (MB/s) | 450 | 433.5 -4% | 469.2 4% | 341.6 -24% | 697 55% | 450.7 0% | 442 ? -2% |
| Read 4K Q32T1 (MB/s) | 295.5 | 526 78% | 543 84% | 364.3 23% | 758 157% | 577 95% | 460 ? 56% |
| Write Seq Q32T1 (MB/s) | 3079 | 2983 -3% | 3055 -1% | 3081 0% | 5187 68% | 1657 -46% | 3049 ? -1% |
| Read Seq Q32T1 (MB/s) | 3433 | 3555 4% | 3296 -4% | 3251 -5% | 7117 107% | 1851 -46% | 3285 ? -4% |
| Write 4K Q8T8 (MB/s) | 1688 | 1012 ? | |||||
| Read 4K Q8T8 (MB/s) | 1036 | 1300 ? | |||||
| AS SSD | 6% | -1% | -20% | 55% | -97% | -8% | |
| Seq Read (MB/s) | 2852 | 2564 -10% | 2553 -10% | 1886 -34% | 5427 90% | 1323 -54% | 2606 ? -9% |
| Seq Write (MB/s) | 2344 | 2268 -3% | 974 -58% | 1221 -48% | 3886 66% | 1572 -33% | 1935 ? -17% |
| 4K Read (MB/s) | 37.3 | 57 53% | 49.69 33% | 41.16 10% | 72.9 95% | 38.09 2% | 42.9 ? 15% |
| 4K Write (MB/s) | 79.6 | 141.4 78% | 139.5 75% | 101.2 27% | 219.3 176% | 127.4 60% | 129.1 ? 62% |
| 4K-64 Read (MB/s) | 1500 | 1175 -22% | 1462 -3% | 1022 -32% | 2209 47% | 812 -46% | 1361 ? -9% |
| 4K-64 Write (MB/s) | 2055 | 1665 -19% | 1474 -28% | 1618 -21% | 2265 10% | 276 -87% | 1920 ? -7% |
| Access Time Read * (ms) | 0.053 | 0.032 40% | 0.063 -19% | 0.058 -9% | 0.033 38% | 0.035 34% | 0.0689 ? -30% |
| Access Time Write * (ms) | 0.033 | 0.025 24% | 0.031 6% | 0.037 -12% | 0.02 39% | 0.411 -1145% | 0.06215 ? -88% |
| Score Read (Points) | 1822 | 1488 -18% | 1767 -3% | 1252 -31% | 2825 55% | 983 -46% | 1664 ? -9% |
| Score Write (Points) | 2369 | 2033 -14% | 1711 -28% | 1841 -22% | 2873 21% | 561 -76% | 2242 ? -5% |
| Score Total (Points) | 5095 | 4279 -16% | 4308 -15% | 3706 -27% | 7069 39% | 2066 -59% | 4726 ? -7% |
| Copy ISO MB/s (MB/s) | 2071 | 2118 2% | 2094 1% | 1611 -22% | 2775 34% | 2846 37% | 2041 ? -1% |
| Copy Program MB/s (MB/s) | 605 | 495.6 -18% | 657 9% | 509 -16% | 662 9% | 728 20% | 552 ? -9% |
| Copy Game MB/s (MB/s) | 1131 | 1174 4% | 1447 28% | 677 -40% | 1655 46% | 1610 42% | 1183 ? 5% |
| Total Average (Program / Settings) | 6% /
6% | 4% /
2% | -16% /
-17% | 68% /
64% | -51% /
-63% | -3% /
-4% |
* ... smaller is better

Constant Performance Reads: DiskSpd Read Loop, Queue Depth 8
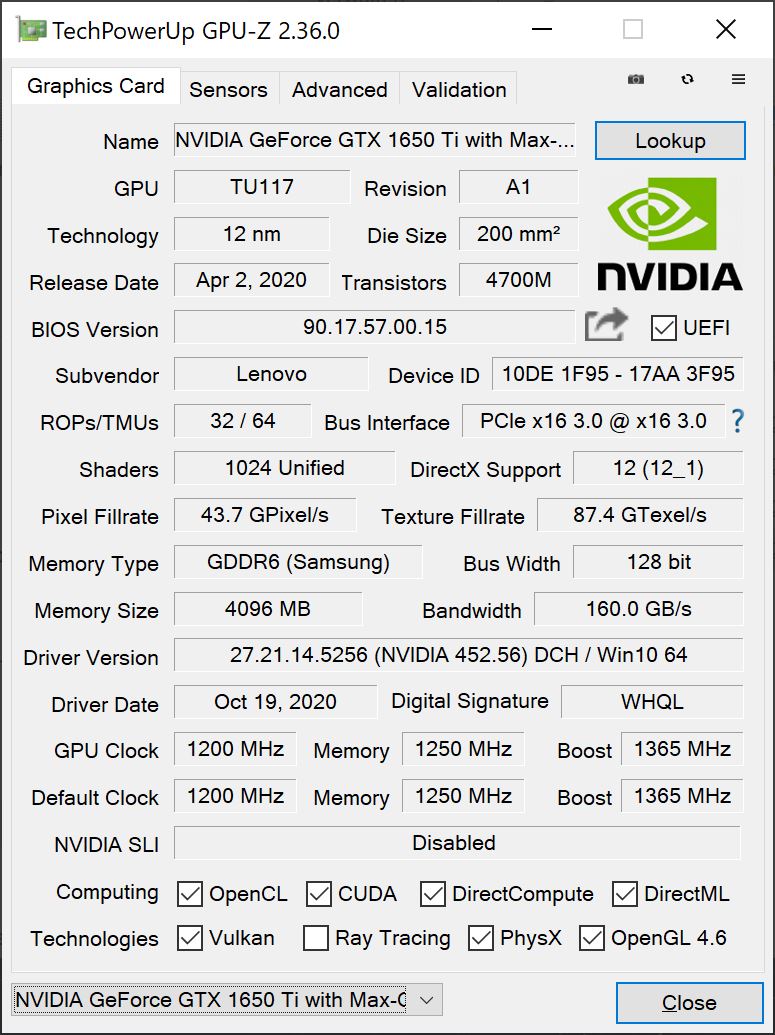
Graphics Card
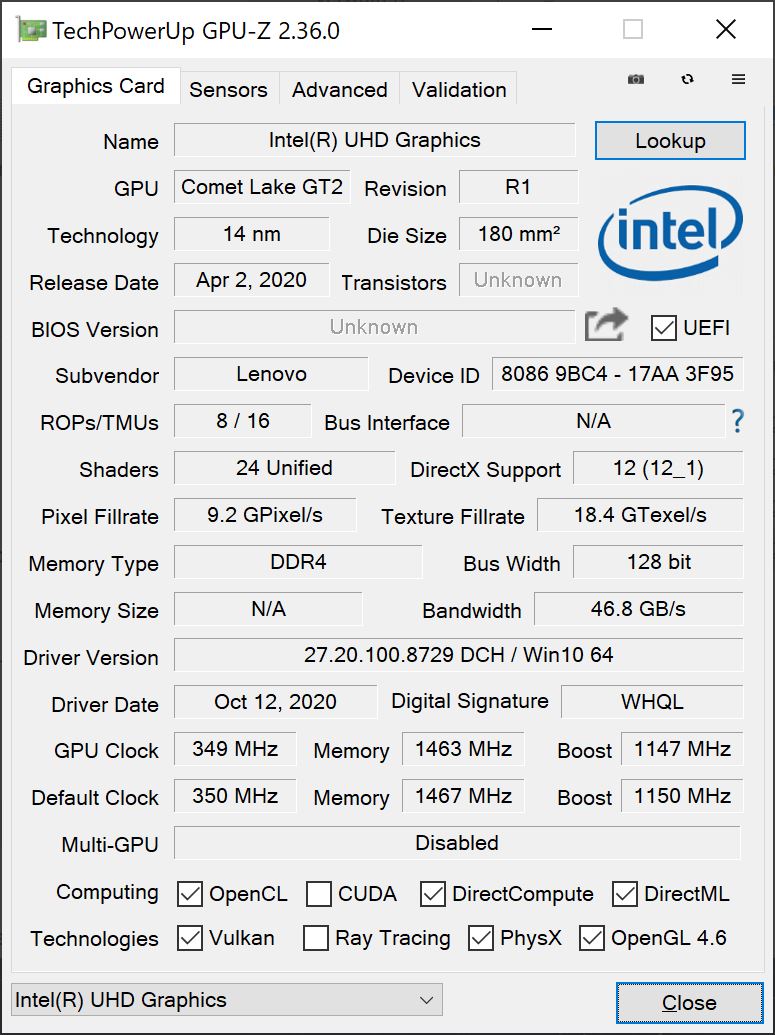
Via Optimus, the laptop automatically switches between the integrated UHD Graphics 630 and the dedicated Nvidia Geforce GTX 1650 Ti Max-Q, which is the more efficient version of the GTX 1650 Ti offering slightly less performance. Its performance depends largely on the configured TGP (35 or 40 watts). In this case, Lenovo has adjusted the TGP to 35 watts, which saves some energy but does not necessarily gain the maximum performance from the card.
However, the performance in the 3DMark benchmarks is very good and most of the time 5 to 10% above that of an average GTX 1650 Ti from our database. In the comparison, only the Asus ZenBook is able to keep up, while all the others are slower, including the ThinkPad X1 (about -5%).
In battery mode, the 3D performance drops by about 23%.
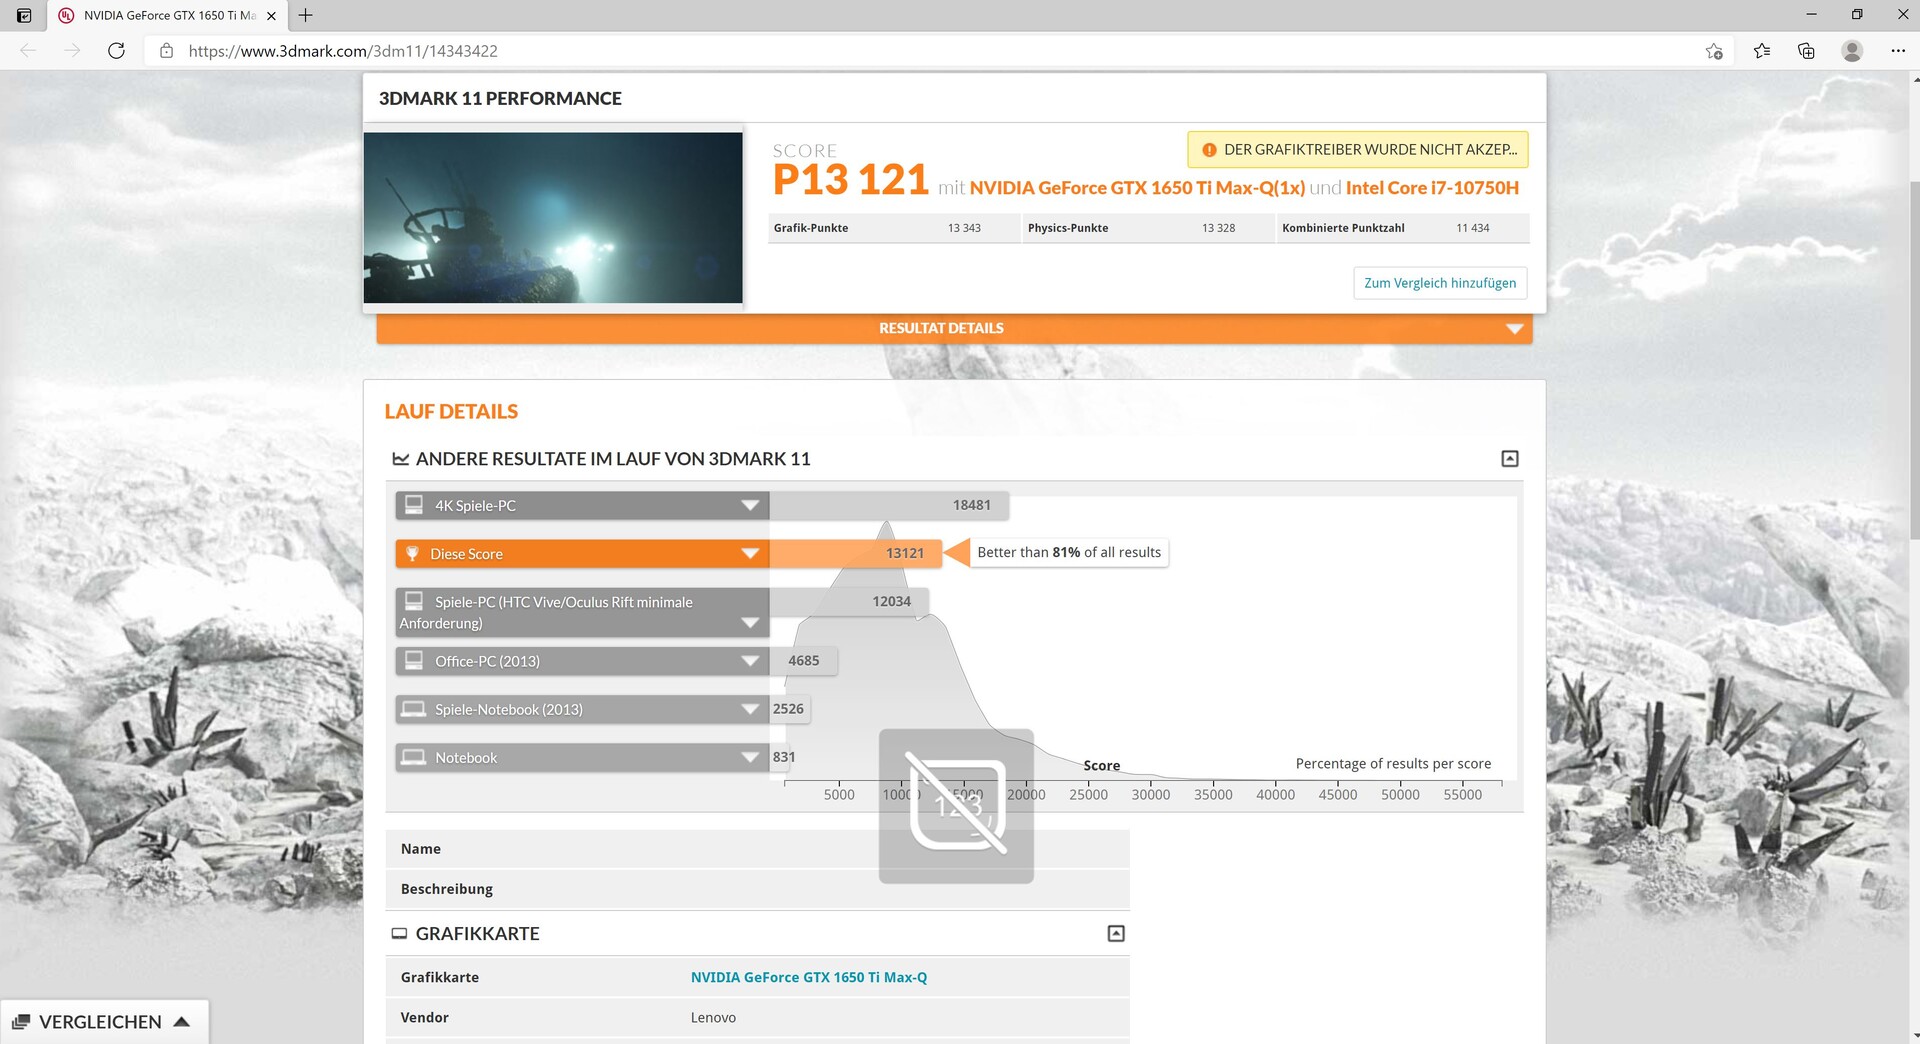
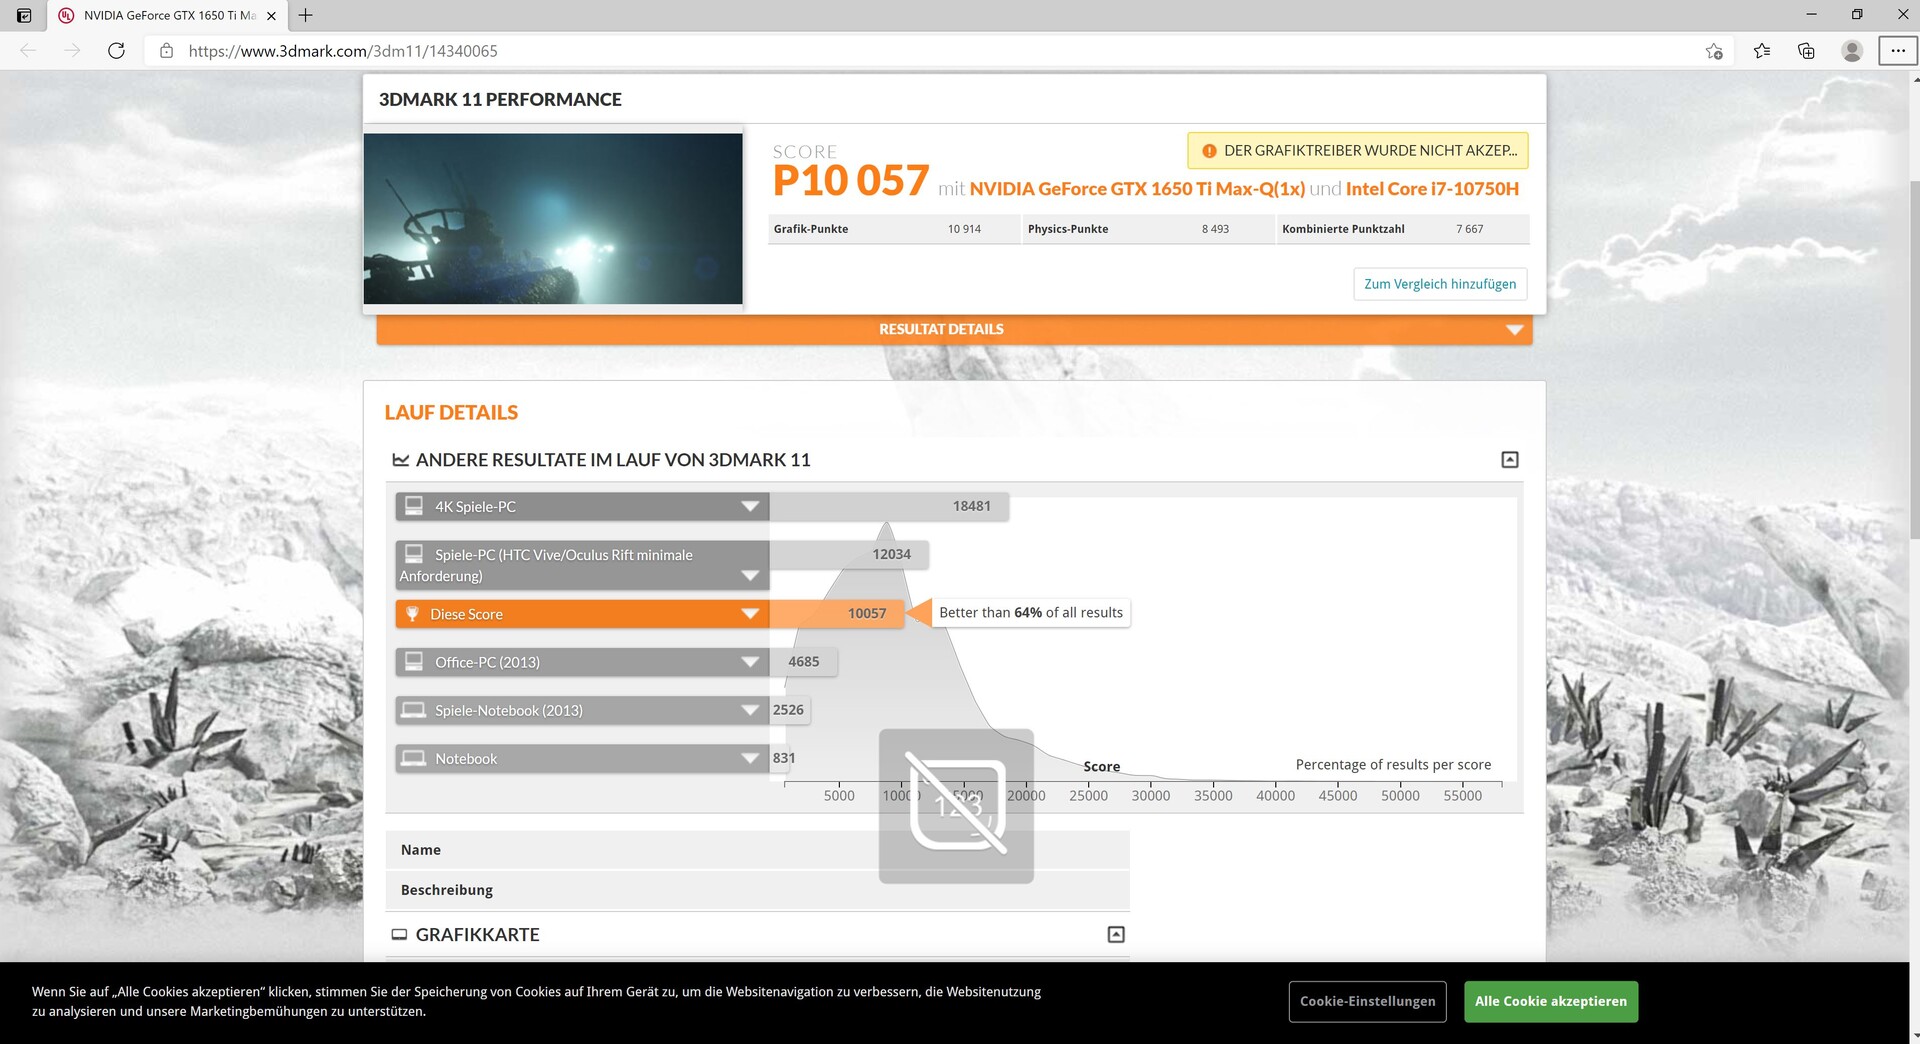
| 3DMark 11 Performance | 13121 points | |
| 3DMark Cloud Gate Standard Score | 22895 points | |
| 3DMark Fire Strike Score | 8659 points | |
| 3DMark Time Spy Score | 3709 points | |
Help | ||
Gaming Performance
Gaming also succeeds fairly well with the Lenovo laptop. Fairly current games such as "Shadow of the Tomb Raider" can often also be played in Full HD resolution at medium to high details. Here, the 1650 Ti Max-Q operates at times even slightly faster than the average of laptops with the same GPU. The Asus ZenBook is often minimally slower, and the ThinkPad X1 offers about the same speed considering all the games.
| Rise of the Tomb Raider | |
| 1024x768 Lowest Preset | |
| Asus ZenBook UX535-M01440 | |
| Average NVIDIA GeForce GTX 1650 Ti Max-Q (89.7 - 163.4, n=2) | |
| Lenovo ThinkBook 15p Gen1 4K | |
| Lenovo ThinkBook 15 | |
| 1366x768 Medium Preset AF:2x | |
| Asus ZenBook UX535-M01440 | |
| Average NVIDIA GeForce GTX 1650 Ti Max-Q (84.7 - 107.4, n=2) | |
| Lenovo ThinkBook 15p Gen1 4K | |
| Lenovo ThinkBook 15 | |
| 1920x1080 High Preset AA:FX AF:4x | |
| Asus ZenBook UX535-M01440 | |
| Average NVIDIA GeForce GTX 1650 Ti Max-Q (58.1 - 60.5, n=2) | |
| Lenovo ThinkBook 15p Gen1 4K | |
| Lenovo ThinkBook 15 | |
The frame rate in our Witcher 3 constant load test is relatively stable, so you should not have to expect any larger performance drops during longer gaming sessions.
| low | med. | high | ultra | 4K | |
|---|---|---|---|---|---|
| The Witcher 3 (2015) | 198.6 | 127 | 56.4 | 34.8 | 21.3 |
| Dota 2 Reborn (2015) | 140 | 121 | 115 | 109 | 58.2 |
| Rise of the Tomb Raider (2016) | 89.7 | 84.7 | 58.1 | 49.1 | 22.9 |
| X-Plane 11.11 (2018) | 85.9 | 78.2 | 66.4 | 52.8 | |
| Shadow of the Tomb Raider (2018) | 112 | 64 | 55 | 48 | 15 |
Emissions - An inconspicuous Lenovo ThinkBook
Noise Emissions
The fan characteristics are not particularly conspicuous in the ThinkBook. During idle operation, the fans often remain silent, and under load, they can get minimally louder than those of the competitors, but the differences are small.
Noise level
| Idle |
| 28.7 / 28.7 / 28.7 dB(A) |
| Load |
| 34.8 / 45.6 dB(A) |
 | ||
30 dB silent 40 dB(A) audible 50 dB(A) loud |
||
min: | ||
| Lenovo ThinkBook 15p Gen1 4K GeForce GTX 1650 Ti Max-Q, i7-10750H, WDC PC SN730 SDBPNTY-1T00 | Lenovo ThinkBook 15 UHD Graphics 620, i5-10210U, Samsung SSD PM981 MZVLB512HAJQ | Lenovo ThinkPad X1 Extreme Gen3-20TLS0UV00 GeForce GTX 1650 Ti Max-Q, i7-10750H, Toshiba XG6 KXG6AZNV1T02 | Asus ZenBook UX535-M01440 GeForce GTX 1650 Ti Max-Q, i7-10750H, WDC PC SN730 SDBPNTY-1T00 | Schenker Vision 15 Iris Xe G7 96EUs, i7-1165G7, Samsung SSD 980 Pro 1TB MZ-V8P1T0BW | Asus VivoBook 15 K571LI-PB71 GeForce GTX 1650 Ti Mobile, i7-10750H, Mushkin Helix-L 1TB MKNSSDHL1TB-08 | |
|---|---|---|---|---|---|---|
| Noise | 5% | -3% | 7% | -3% | -9% | |
| off / environment * (dB) | 28.7 | 29.2 -2% | 29.5 -3% | 24.6 14% | 29.8 -4% | 25.7 10% |
| Idle Minimum * (dB) | 28.7 | 29.2 -2% | 29.5 -3% | 24.6 14% | 29.8 -4% | 31.9 -11% |
| Idle Average * (dB) | 28.7 | 29.2 -2% | 29.5 -3% | 24.6 14% | 29.8 -4% | 31.9 -11% |
| Idle Maximum * (dB) | 28.7 | 29.9 -4% | 29.9 -4% | 24.6 14% | 31.1 -8% | 31.9 -11% |
| Load Average * (dB) | 34.8 | 30.6 12% | 44.2 -27% | 41.3 -19% | 40.5 -16% | 44.2 -27% |
| Witcher 3 ultra * (dB) | 43.6 | 36.1 17% | 42 4% | 40.5 7% | 43.9 -1% | |
| Load Maximum * (dB) | 45.6 | 33.8 26% | 44.2 3% | 41.4 9% | 40.5 11% | 50.7 -11% |
* ... smaller is better
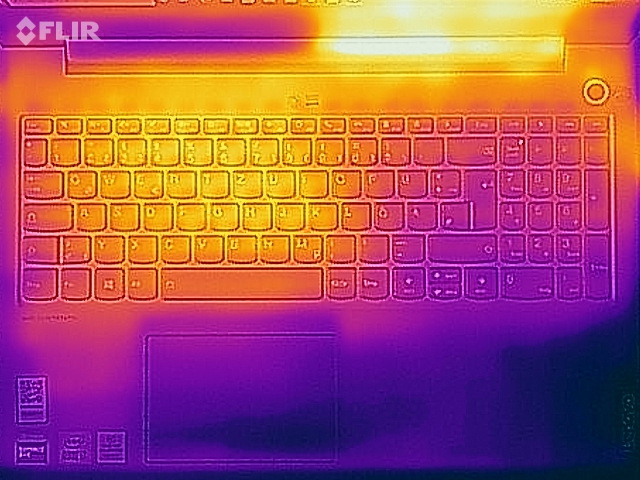
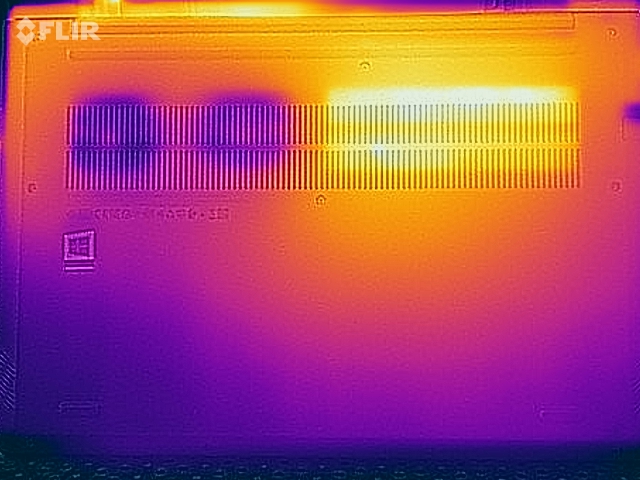
Temperature
The differences between the competitors are also small in terms of heat development. The hottest spot is on the bottom in the center and to the left toward the display, where the temperature can rise up to 47 °C (117 °F), but this is still not particularly high. During idle operation, everything remains within the green range anyways, and the palm rests also remain cool under stress.
(±) The maximum temperature on the upper side is 41.2 °C / 106 F, compared to the average of 36.9 °C / 98 F, ranging from 21.1 to 71 °C for the class Multimedia.
(-) The bottom heats up to a maximum of 47 °C / 117 F, compared to the average of 39.2 °C / 103 F
(+) In idle usage, the average temperature for the upper side is 22.3 °C / 72 F, compared to the device average of 31.3 °C / 88 F.
(±) Playing The Witcher 3, the average temperature for the upper side is 33 °C / 91 F, compared to the device average of 31.3 °C / 88 F.
(+) The palmrests and touchpad are cooler than skin temperature with a maximum of 27.3 °C / 81.1 F and are therefore cool to the touch.
(±) The average temperature of the palmrest area of similar devices was 28.7 °C / 83.7 F (+1.4 °C / 2.6 F).
| Lenovo ThinkBook 15p Gen1 4K GeForce GTX 1650 Ti Max-Q, i7-10750H, WDC PC SN730 SDBPNTY-1T00 | Lenovo ThinkBook 15 UHD Graphics 620, i5-10210U, Samsung SSD PM981 MZVLB512HAJQ | Lenovo ThinkPad X1 Extreme Gen3-20TLS0UV00 GeForce GTX 1650 Ti Max-Q, i7-10750H, Toshiba XG6 KXG6AZNV1T02 | Asus ZenBook UX535-M01440 GeForce GTX 1650 Ti Max-Q, i7-10750H, WDC PC SN730 SDBPNTY-1T00 | Schenker Vision 15 Iris Xe G7 96EUs, i7-1165G7, Samsung SSD 980 Pro 1TB MZ-V8P1T0BW | Asus VivoBook 15 K571LI-PB71 GeForce GTX 1650 Ti Mobile, i7-10750H, Mushkin Helix-L 1TB MKNSSDHL1TB-08 | |
|---|---|---|---|---|---|---|
| Heat | -1% | -8% | -8% | -5% | -56% | |
| Maximum Upper Side * (°C) | 41.2 | 38 8% | 48.8 -18% | 37.8 8% | 42.4 -3% | 53 -29% |
| Maximum Bottom * (°C) | 47 | 43.9 7% | 51.1 -9% | 44.2 6% | 46.8 -0% | 72 -53% |
| Idle Upper Side * (°C) | 22.6 | 24.5 -8% | 23.3 -3% | 28.1 -24% | 24.6 -9% | 34.2 -51% |
| Idle Bottom * (°C) | 23.1 | 25.4 -10% | 23.1 -0% | 27.7 -20% | 24.4 -6% | 44 -90% |
* ... smaller is better
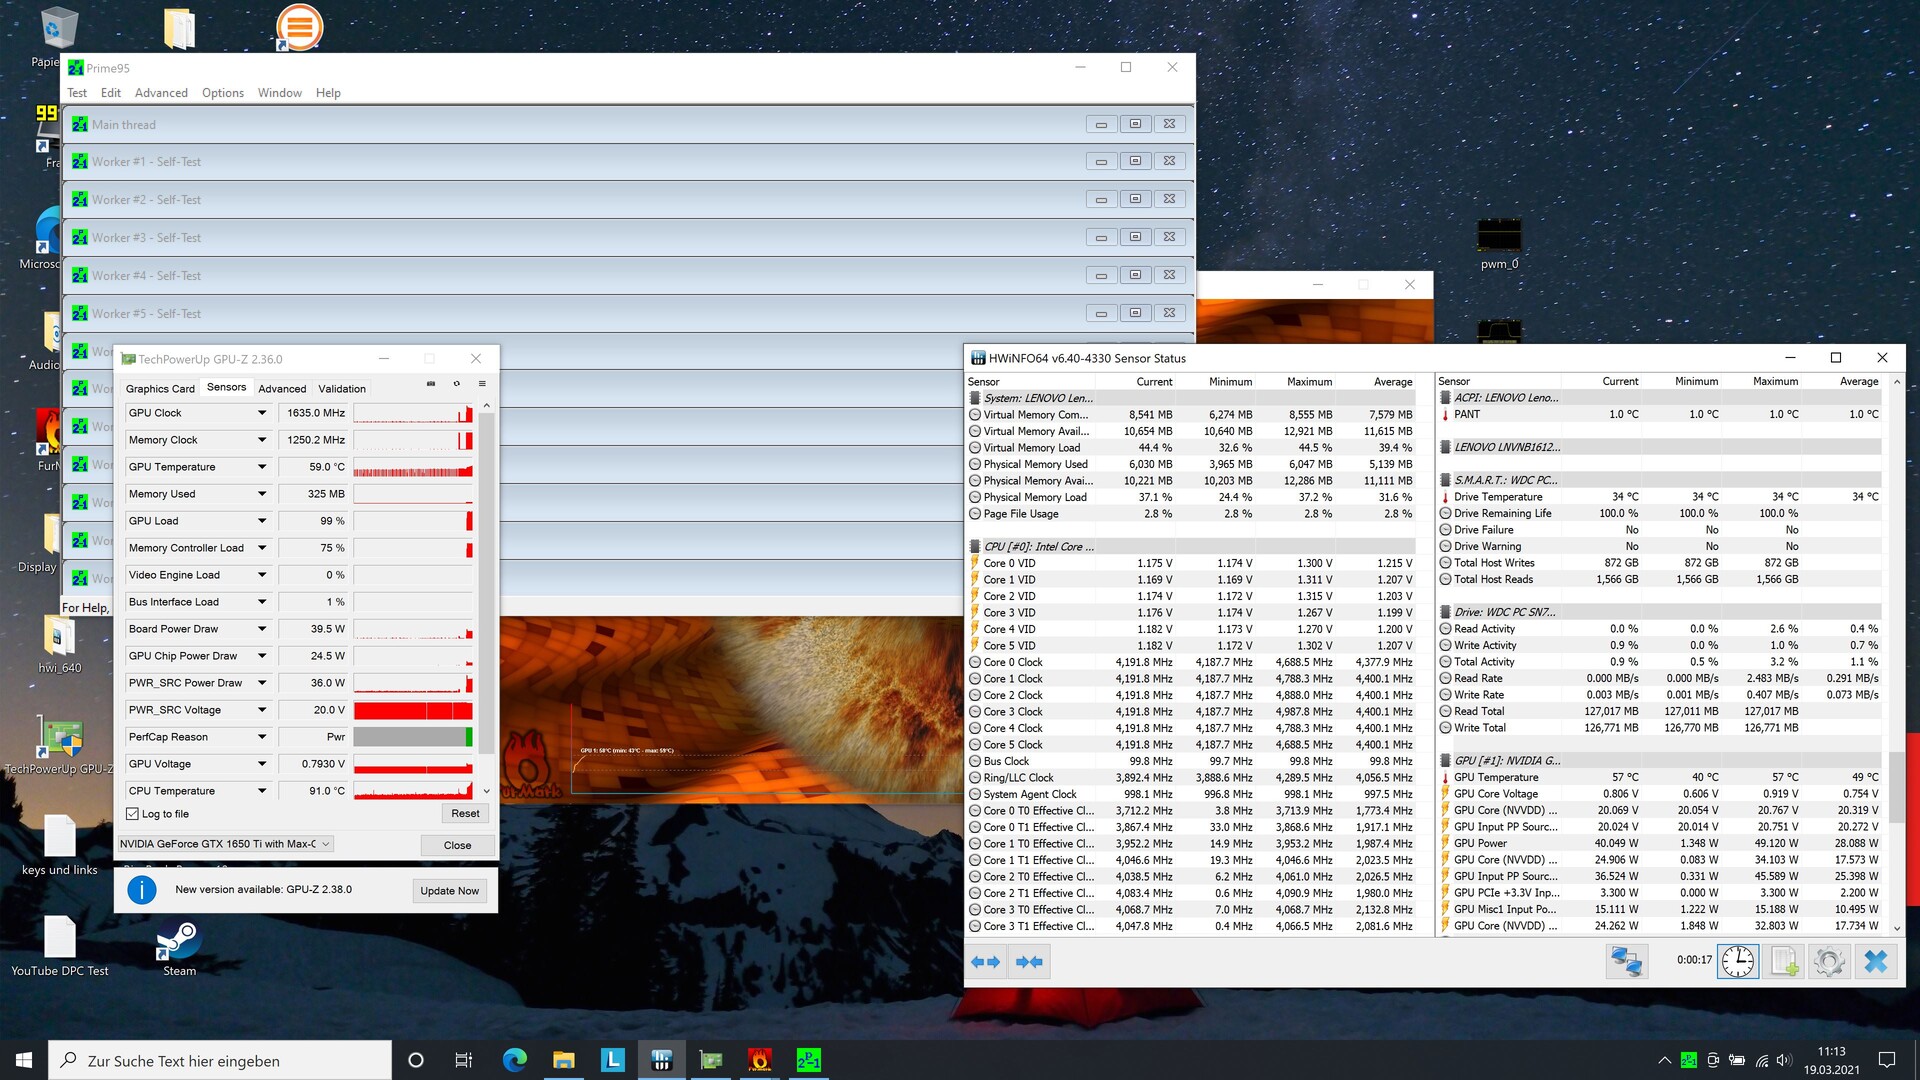
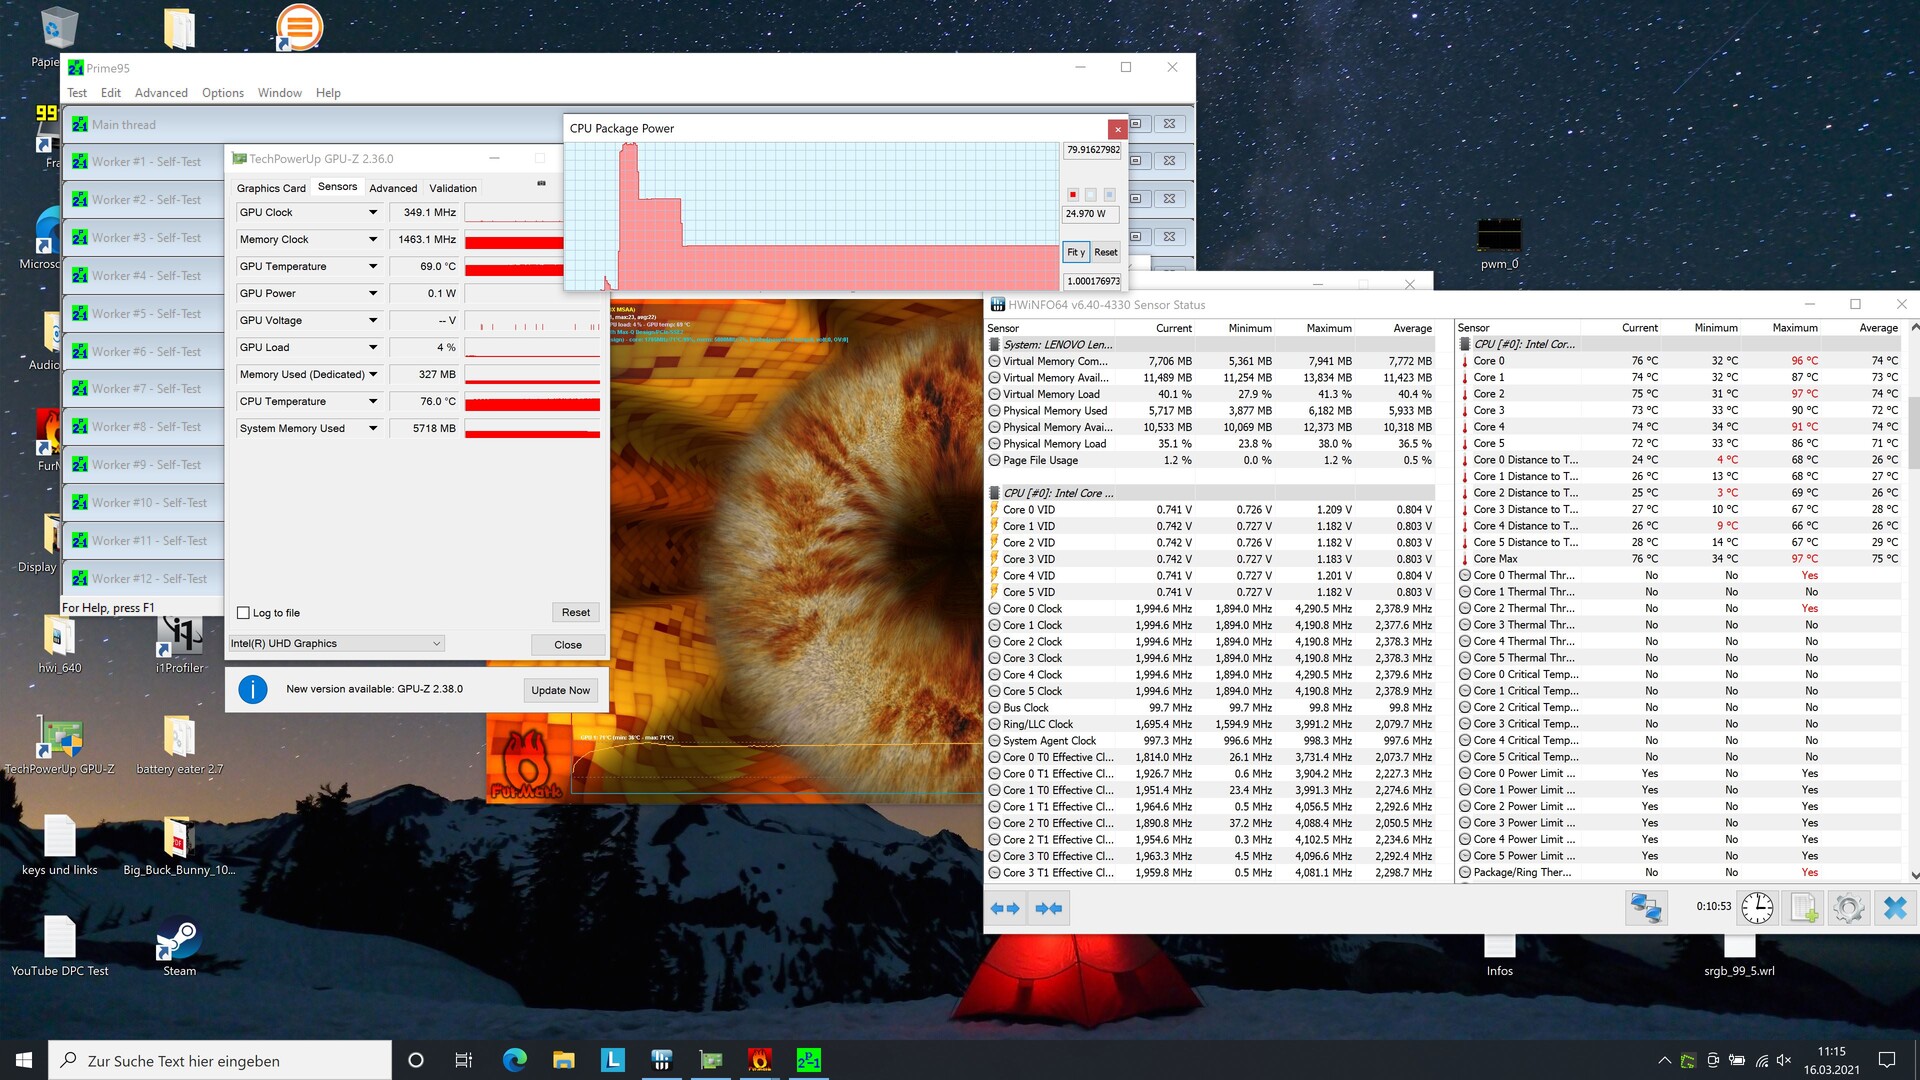
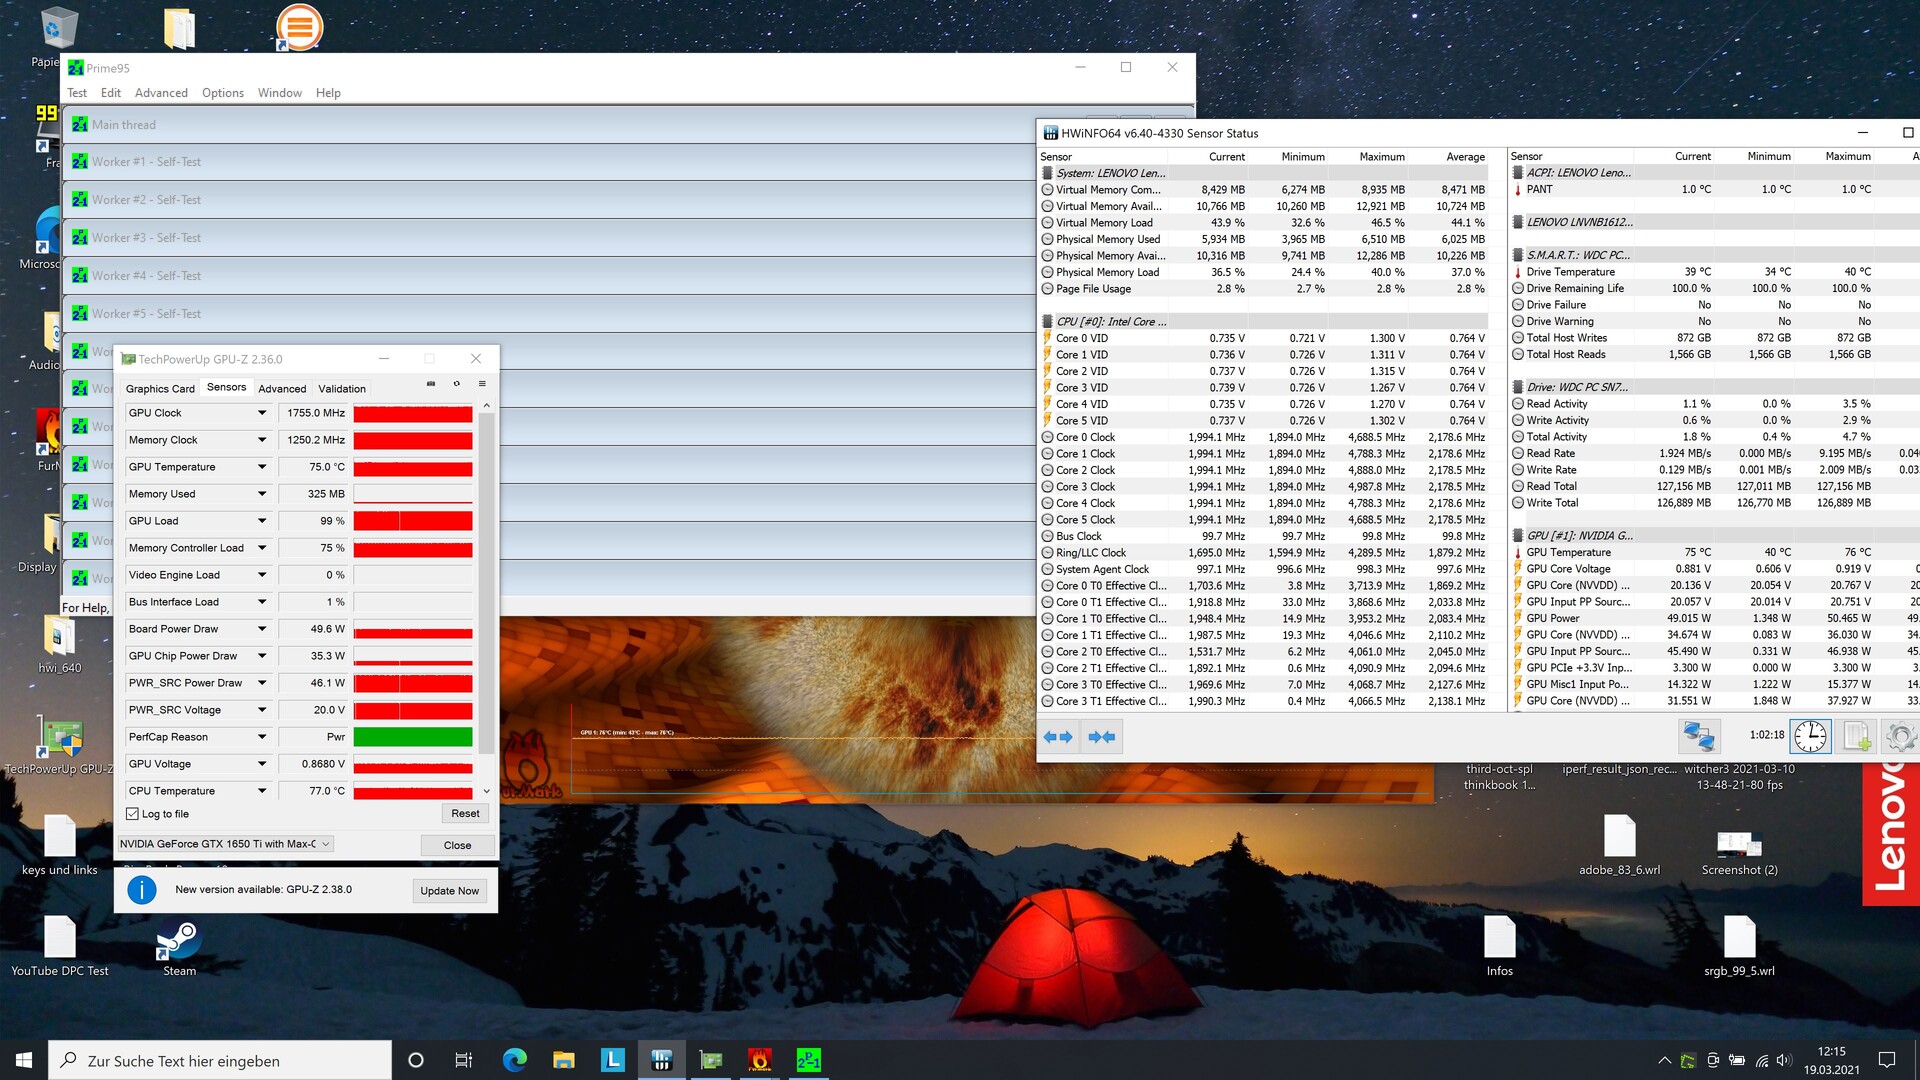
In the stress test, the cores briefly reach a clock speed above 4 GHz, but the thermal throttling already starts after less than one minute, and the clock speed drops to 3.5 GHz. After 1.5 to 2 minutes, it is only 2.3 GHz, and after about 10 minutes, only about 2 GHz, which can then be maintained constantly until the end of the test after one hour.
During this time, the graphics card has a constant clock speed of 1755 MHz, and its temperature is a moderate 75 °C (167 °F).
Speakers
The stereo speakers could have been slightly louder and of course also lack bass. So they correspond to today's standard, unfortunately. External audio devices can be connected to the combined audio port for headphones and microphones.
Lenovo ThinkBook 15p Gen1 4K audio analysis
(±) | speaker loudness is average but good (79.1 dB)
Bass 100 - 315 Hz
(-) | nearly no bass - on average 15.9% lower than median
(±) | linearity of bass is average (13.9% delta to prev. frequency)
Mids 400 - 2000 Hz
(±) | higher mids - on average 6.6% higher than median
(+) | mids are linear (6.8% delta to prev. frequency)
Highs 2 - 16 kHz
(+) | balanced highs - only 2.6% away from median
(±) | linearity of highs is average (9.8% delta to prev. frequency)
Overall 100 - 16.000 Hz
(±) | linearity of overall sound is average (19% difference to median)
Compared to same class
» 58% of all tested devices in this class were better, 8% similar, 34% worse
» The best had a delta of 5%, average was 17%, worst was 45%
Compared to all devices tested
» 44% of all tested devices were better, 8% similar, 49% worse
» The best had a delta of 4%, average was 24%, worst was 134%
Lenovo ThinkPad X1 Extreme Gen3-20TLS0UV00 audio analysis
(±) | speaker loudness is average but good (77.2 dB)
Bass 100 - 315 Hz
(±) | reduced bass - on average 9.1% lower than median
(±) | linearity of bass is average (11.6% delta to prev. frequency)
Mids 400 - 2000 Hz
(±) | higher mids - on average 7.2% higher than median
(+) | mids are linear (5.4% delta to prev. frequency)
Highs 2 - 16 kHz
(+) | balanced highs - only 3.9% away from median
(+) | highs are linear (5.7% delta to prev. frequency)
Overall 100 - 16.000 Hz
(±) | linearity of overall sound is average (19.7% difference to median)
Compared to same class
» 63% of all tested devices in this class were better, 7% similar, 30% worse
» The best had a delta of 5%, average was 17%, worst was 45%
Compared to all devices tested
» 49% of all tested devices were better, 7% similar, 44% worse
» The best had a delta of 4%, average was 24%, worst was 134%
Power Management - 4K slightly lowers the battery life
Power Consumption
During idle operation, the device consumes a maximum of 13.2 watts, if you have set the keyboard illumination to the second level. At the first level, it uses only 11.8 watts, and without the illumination, 11.5 watts. During the stress test, we measure a peak consumption of 140 watts, but this value levels out at 112 watts.
Particularly considering the very bright 4K display, these values are okay. While the Asus ZenBook, which also has a 4K display, is more efficient, the ThinkPad X1 with its Full-HD display consumes almost as much.
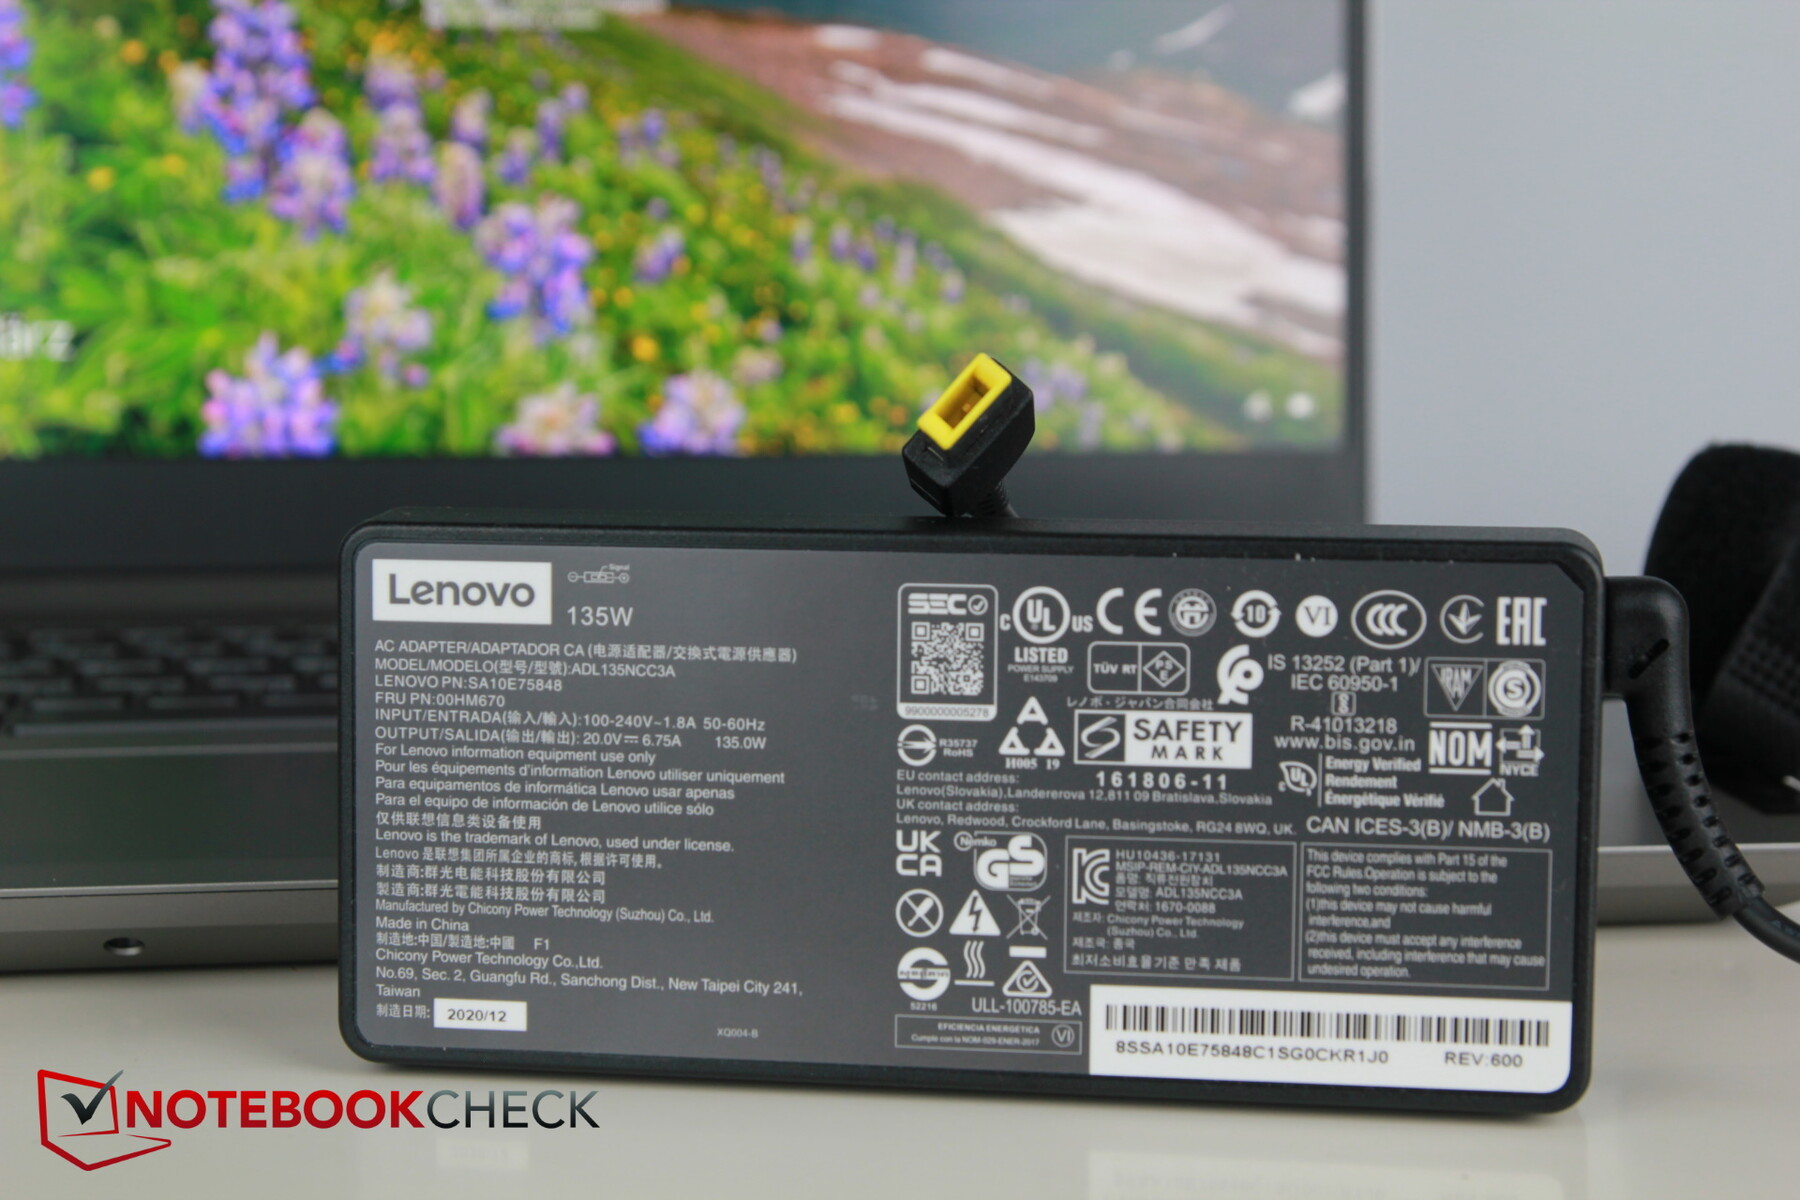
The power supply with its proprietary plug is rated at 135 watts, so aside from the brief performance spurts, it should always be able to deliver sufficient power in the long run.
| Off / Standby | |
| Idle | |
| Load |
|
Key:
min: | |
| Lenovo ThinkBook 15p Gen1 4K i7-10750H, GeForce GTX 1650 Ti Max-Q, WDC PC SN730 SDBPNTY-1T00, IPS, 3840x2160, 15.6" | Lenovo ThinkBook 15 i5-10210U, UHD Graphics 620, Samsung SSD PM981 MZVLB512HAJQ, IPS, 1920x1080, 15.6" | Lenovo ThinkPad X1 Extreme Gen3-20TLS0UV00 i7-10750H, GeForce GTX 1650 Ti Max-Q, Toshiba XG6 KXG6AZNV1T02, IPS, 1920x1080, 15.6" | Asus ZenBook UX535-M01440 i7-10750H, GeForce GTX 1650 Ti Max-Q, WDC PC SN730 SDBPNTY-1T00, IPS, 3840x2160, 15.6" | Schenker Vision 15 i7-1165G7, Iris Xe G7 96EUs, Samsung SSD 980 Pro 1TB MZ-V8P1T0BW, IPS, 1920x1080, 15.6" | Asus VivoBook 15 K571LI-PB71 i7-10750H, GeForce GTX 1650 Ti Mobile, Mushkin Helix-L 1TB MKNSSDHL1TB-08, IPS, 1920x1080, 15.6" | Average NVIDIA GeForce GTX 1650 Ti Max-Q | Average of class Multimedia | |
|---|---|---|---|---|---|---|---|---|
| Power Consumption | 42% | 5% | 10% | 44% | -17% | -13% | 5% | |
| Idle Minimum * (Watt) | 4.3 | 3.5 19% | 5 -16% | 4.4 -2% | 3.5 19% | 6.4 -49% | 7.23 ? -68% | 5.91 ? -37% |
| Idle Average * (Watt) | 10.8 | 7.1 34% | 9 17% | 9.8 9% | 6.3 42% | 10.6 2% | 12.6 ? -17% | 10.3 ? 5% |
| Idle Maximum * (Watt) | 13.2 | 7.8 41% | 12.2 8% | 14.5 -10% | 6.8 48% | 18.4 -39% | 16.3 ? -23% | 12.4 ? 6% |
| Load Average * (Watt) | 103.2 | 38.9 62% | 94.4 9% | 83 20% | 43.2 58% | 103.7 -0% | 80.6 ? 22% | 69 ? 33% |
| Witcher 3 ultra * (Watt) | 94 | 89 5% | 67 29% | 52 45% | 99.1 -5% | |||
| Load Maximum * (Watt) | 140.2 | 65.4 53% | 133.9 4% | 123 12% | 67.7 52% | 154.9 -10% | 107.7 ? 23% | 112.2 ? 20% |
* ... smaller is better
Battery Life
The battery of the ThinkBook offers a capacity of 57 Wh and lasts for almost 10 hours in our WLAN test at a reduced brightness. If you maximize the brightness, the runtime drops dramatically. Due to the bright 4K display, it drops by almost a half. When watching videos, it lasted for 7 hours and 17 minutes, also at a reduced brightness.
However, the average of the class is still about 11% better. While the Asus ZenBook with the same equipment lasts 26% longer, its battery is also almost twice as large! So the values are okay, but there is still considerable room for improvement. Perhaps Lenovo should use an even larger battery here.
| Lenovo ThinkBook 15p Gen1 4K i7-10750H, GeForce GTX 1650 Ti Max-Q, 57 Wh | Lenovo ThinkBook 15 i5-10210U, UHD Graphics 620, 45 Wh | Lenovo ThinkPad X1 Extreme Gen3-20TLS0UV00 i7-10750H, GeForce GTX 1650 Ti Max-Q, 80 Wh | Asus ZenBook UX535-M01440 i7-10750H, GeForce GTX 1650 Ti Max-Q, 96 Wh | Schenker Vision 15 i7-1165G7, Iris Xe G7 96EUs, 73 Wh | Asus VivoBook 15 K571LI-PB71 i7-10750H, GeForce GTX 1650 Ti Mobile, 42 Wh | Average of class Multimedia | |
|---|---|---|---|---|---|---|---|
| Battery runtime | -16% | 22% | 28% | 62% | -55% | 44% | |
| H.264 (h) | 7.3 | 7 -4% | 12.2 67% | 11.9 63% | 18.7 156% | 15.8 ? 116% | |
| WiFi v1.3 (h) | 9.8 | 6.8 -31% | 11.6 18% | 10.1 3% | 15.2 55% | 3.7 -62% | 11.5 ? 17% |
| Load (h) | 1.7 | 1.5 -12% | 1.4 -18% | 2 18% | 1.3 -24% | 0.9 -47% | 1.688 ? -1% |
| Reader / Idle (h) | 17.9 | 18.3 | 10.2 | 23.7 ? |
Pros
Cons
Verdict - Not the premium series, but with a great display
With the ThinkBook 15p, you will get a decent multimedia device, but you can still see that the manufacturer also offers something better (such as the ThinkPad series). We really liked the bright, high-contrast 4K display.
Areas where Lenovo has cut some corners include mainly the connection equipment: only three USB ports are not very much. Thunderbolt is not integrated, and the speed is limited to the USB-3.0 standard. You also look for a DisplayPort in vain, and the SD card reader is slow as well, but at least there is one. The ThinkPad series offers better and more modern connection options, the better input devices, and easier maintenance. However, with the same hardware it is also again significantly more expensive.
The ThinkBook 15p is a solid business allrounder in the entry-level segment with weak connection options. At the price of around 1600 Euros (~$1910) you might find something better, but the very bright and good 4K display makes it an interesting device.
Price and Availability
We received our test unit from Campuspoint (in Germany), where it currently costs 1415 Euros (~$1689). In the US, it is currently available at CDW.com for $1390.
Lenovo ThinkBook 15p Gen1 4K
- 03/22/2021 v7 (old)
Christian Hintze
Price comparison

