HP Pavilion 17 FHD V3A33AV Notebook Review
As evident by the recent launch of the Omen series, HP has been putting more and more effort into gaming on notebooks. The multimedia Pavilion series is now more powerful than ever with its GTX 960M graphics as opposed to previous iterations where GPU options were only available up to the GTX 950M. This puts the Pavilion series on roughly equal footing with the Dell XPS 15 9550, Asus UX501, and even the Lenovo Y700 gaming series. The manufacturer has yet to offer enthusiast-level mobile gaming solutions in the same vein as the MSI GT series or the Asus ROG series, but the Pavilion series certainly has a more mass market mid-range appeal.
The Pavilion 17 shares many of the same physical features as the Pavilion 15, so we recommend checking out our review page on the Pavilion 15 for more information or even our older Pavilion 17 pages for comparisons and reference.
Case
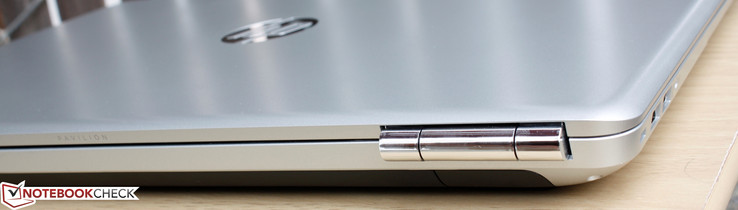
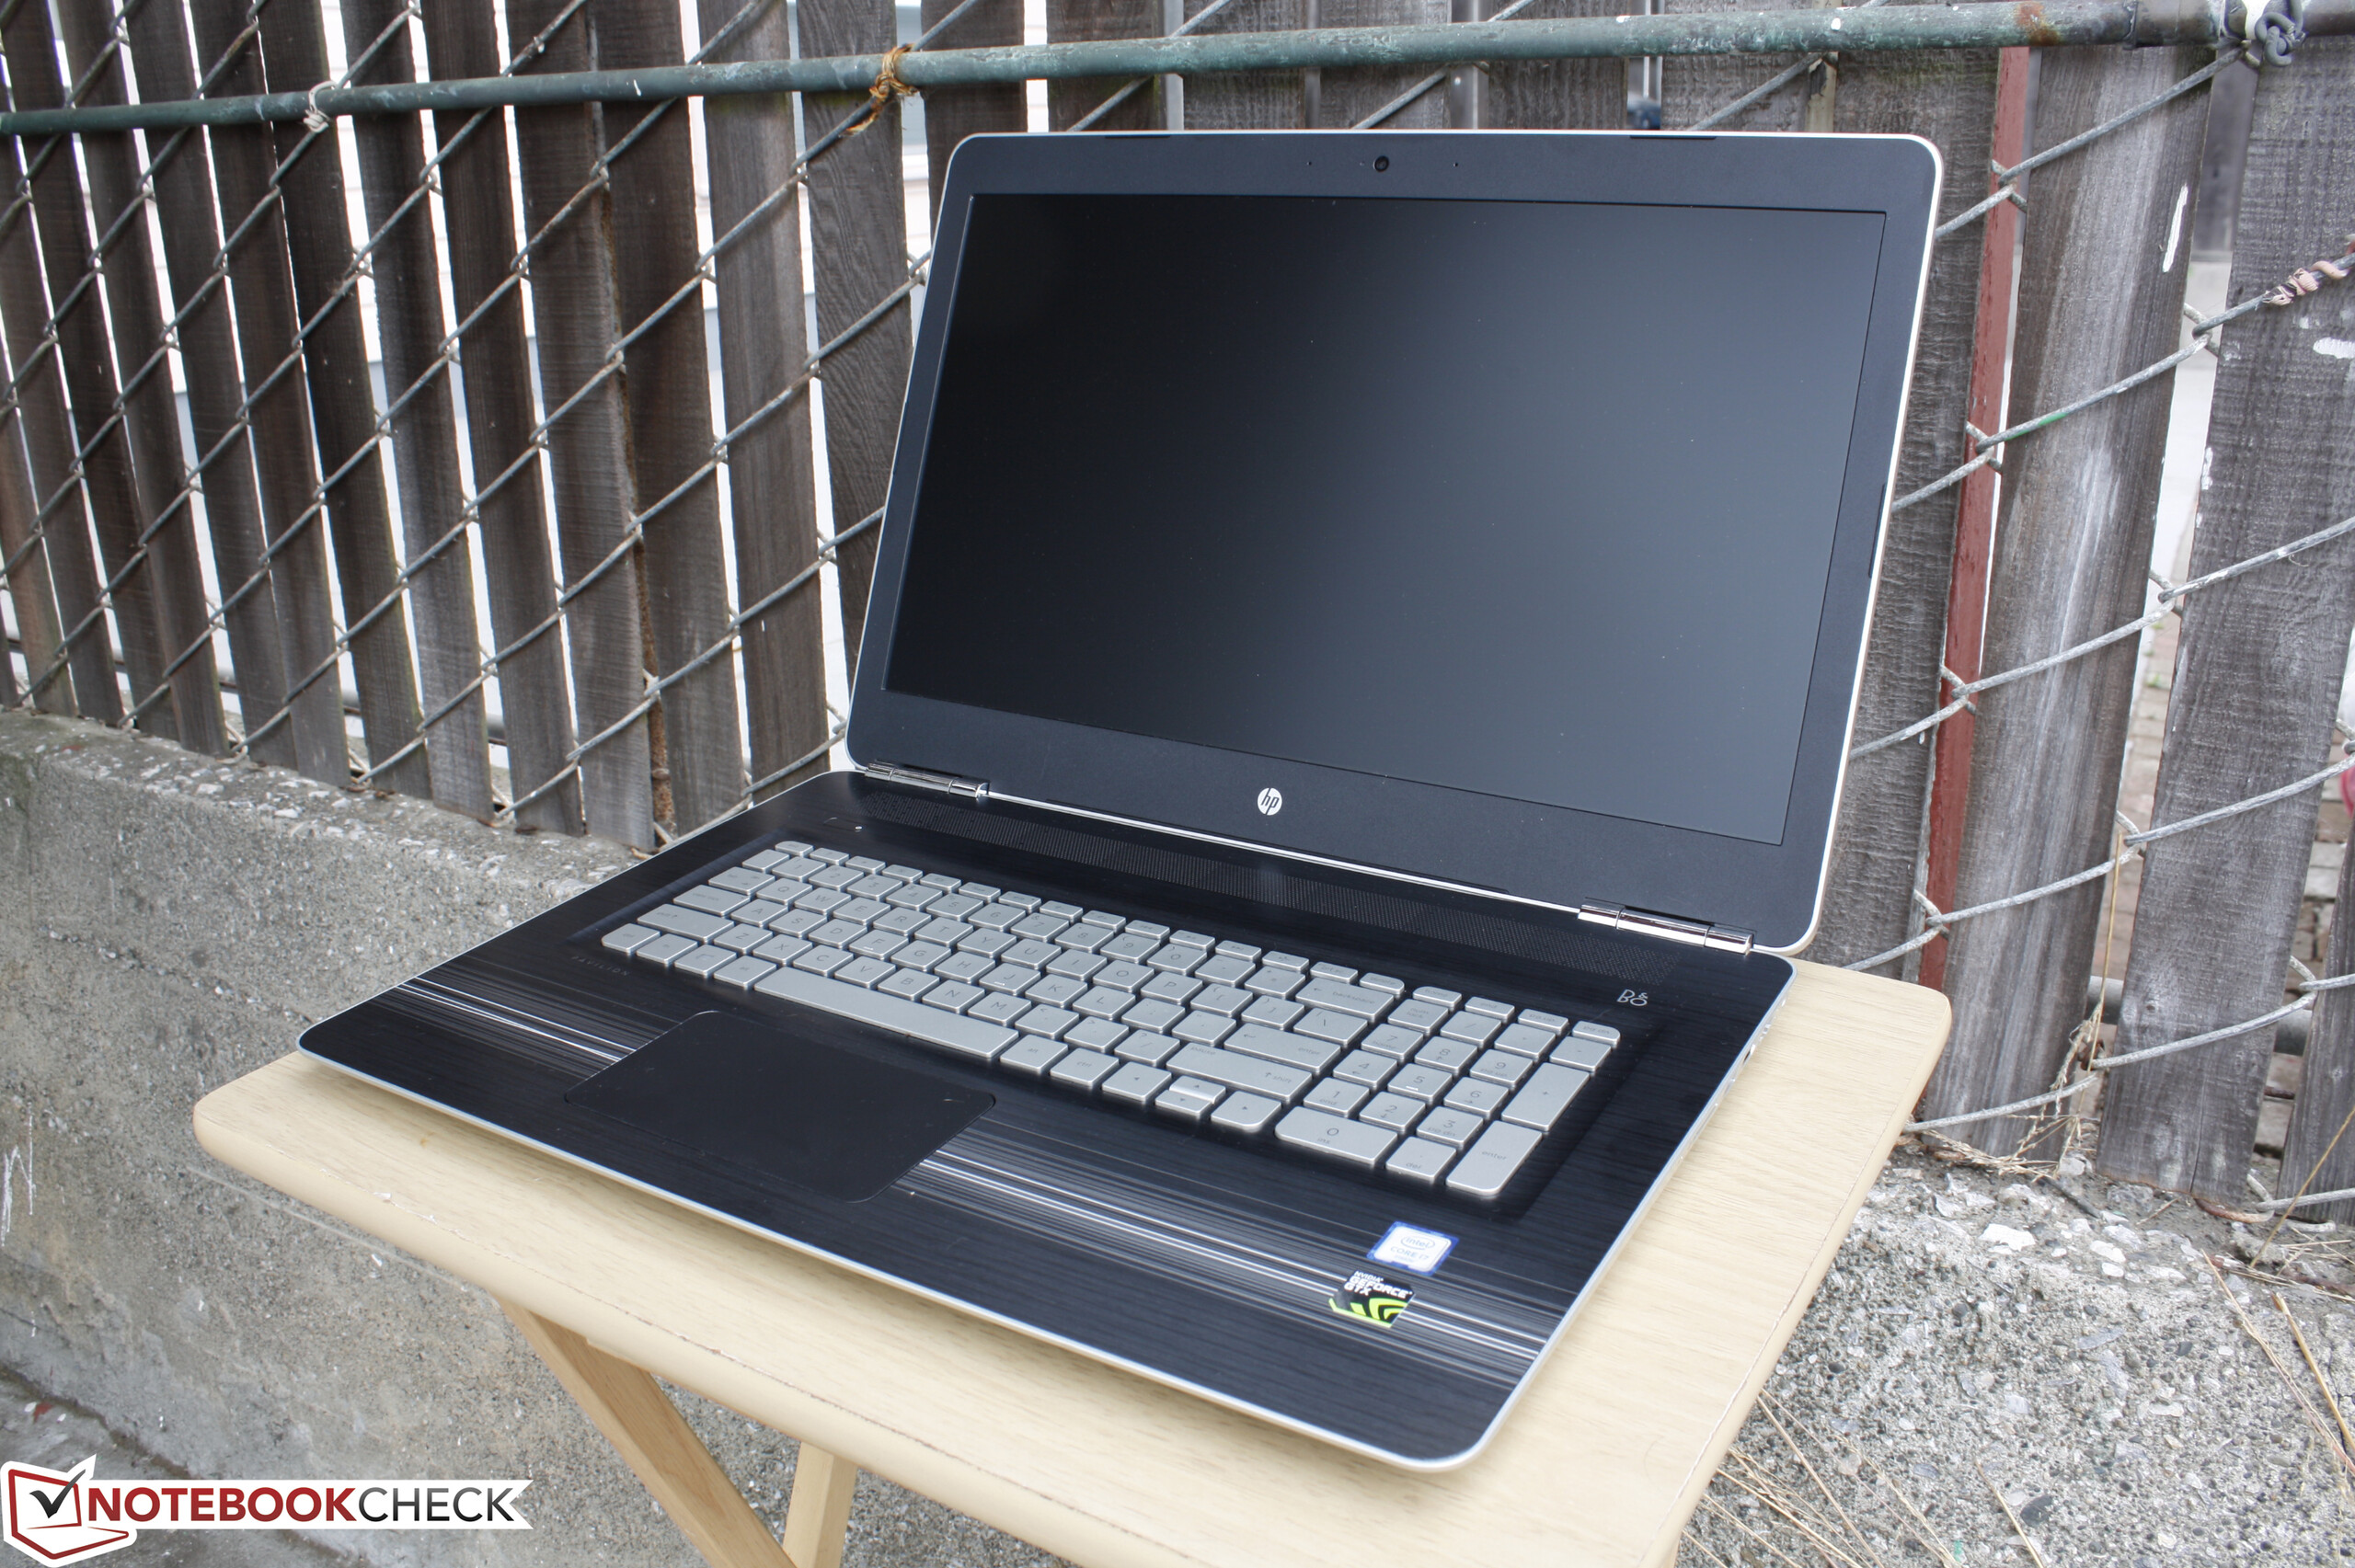
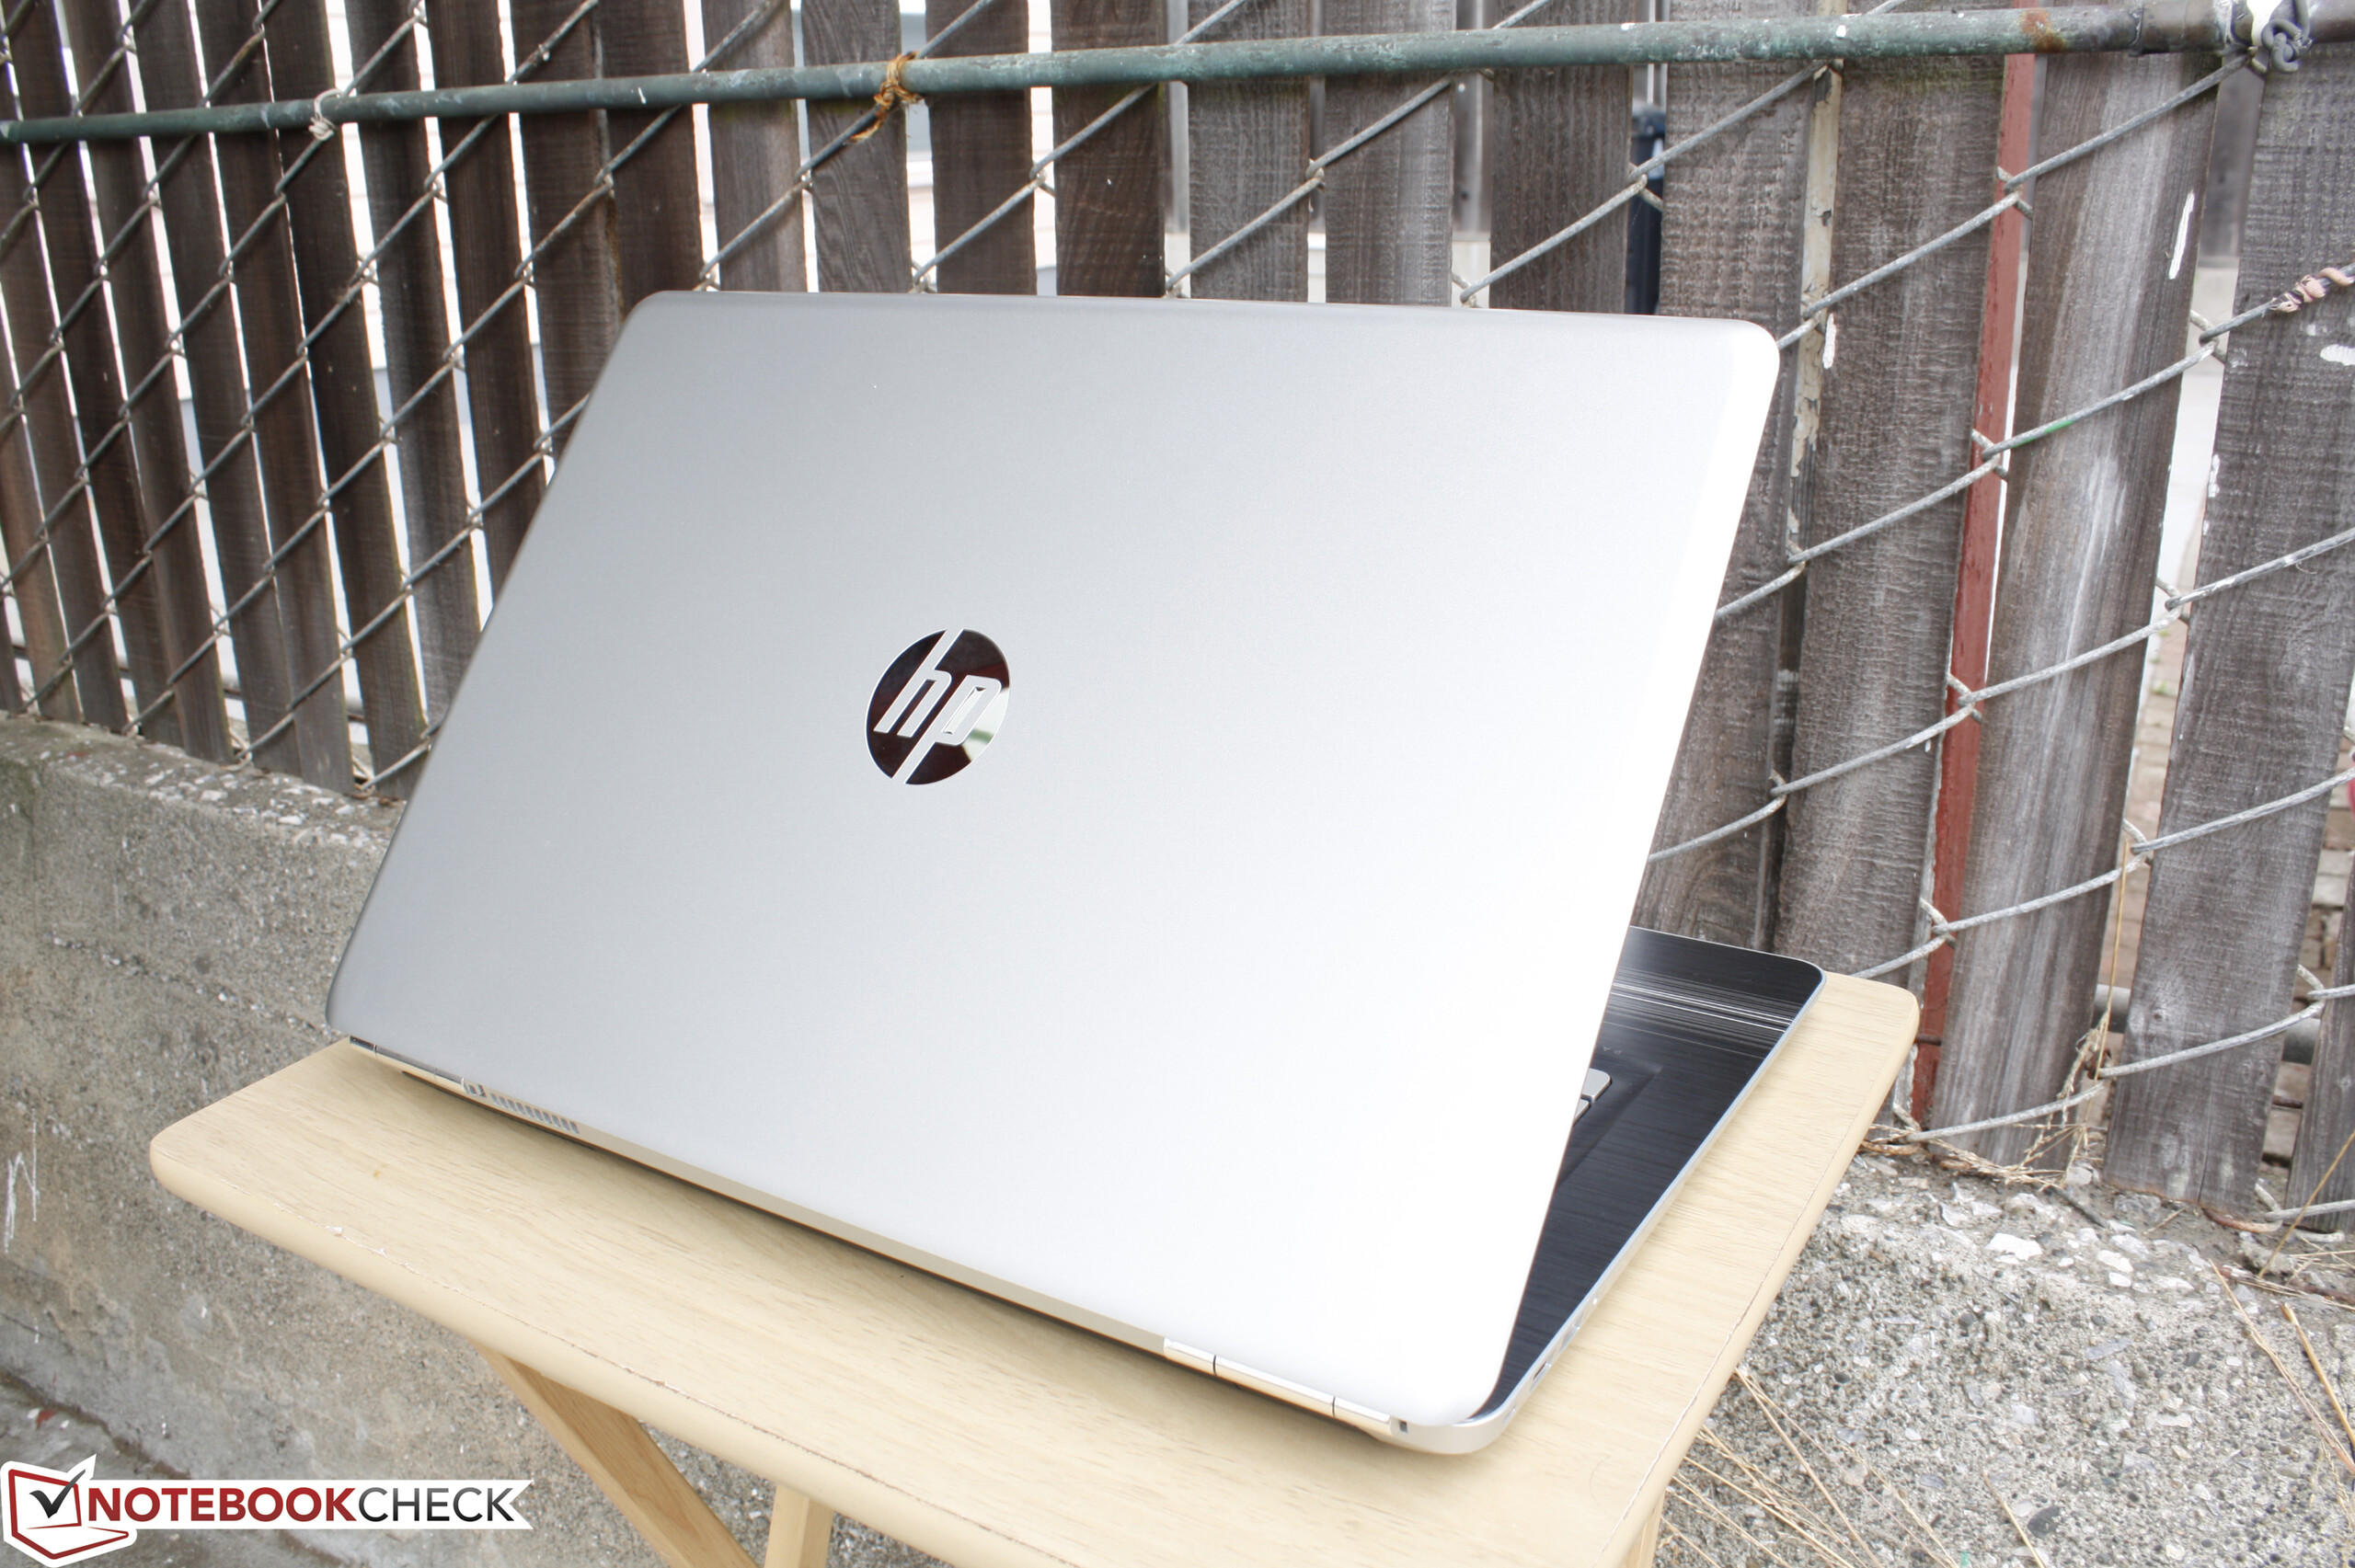
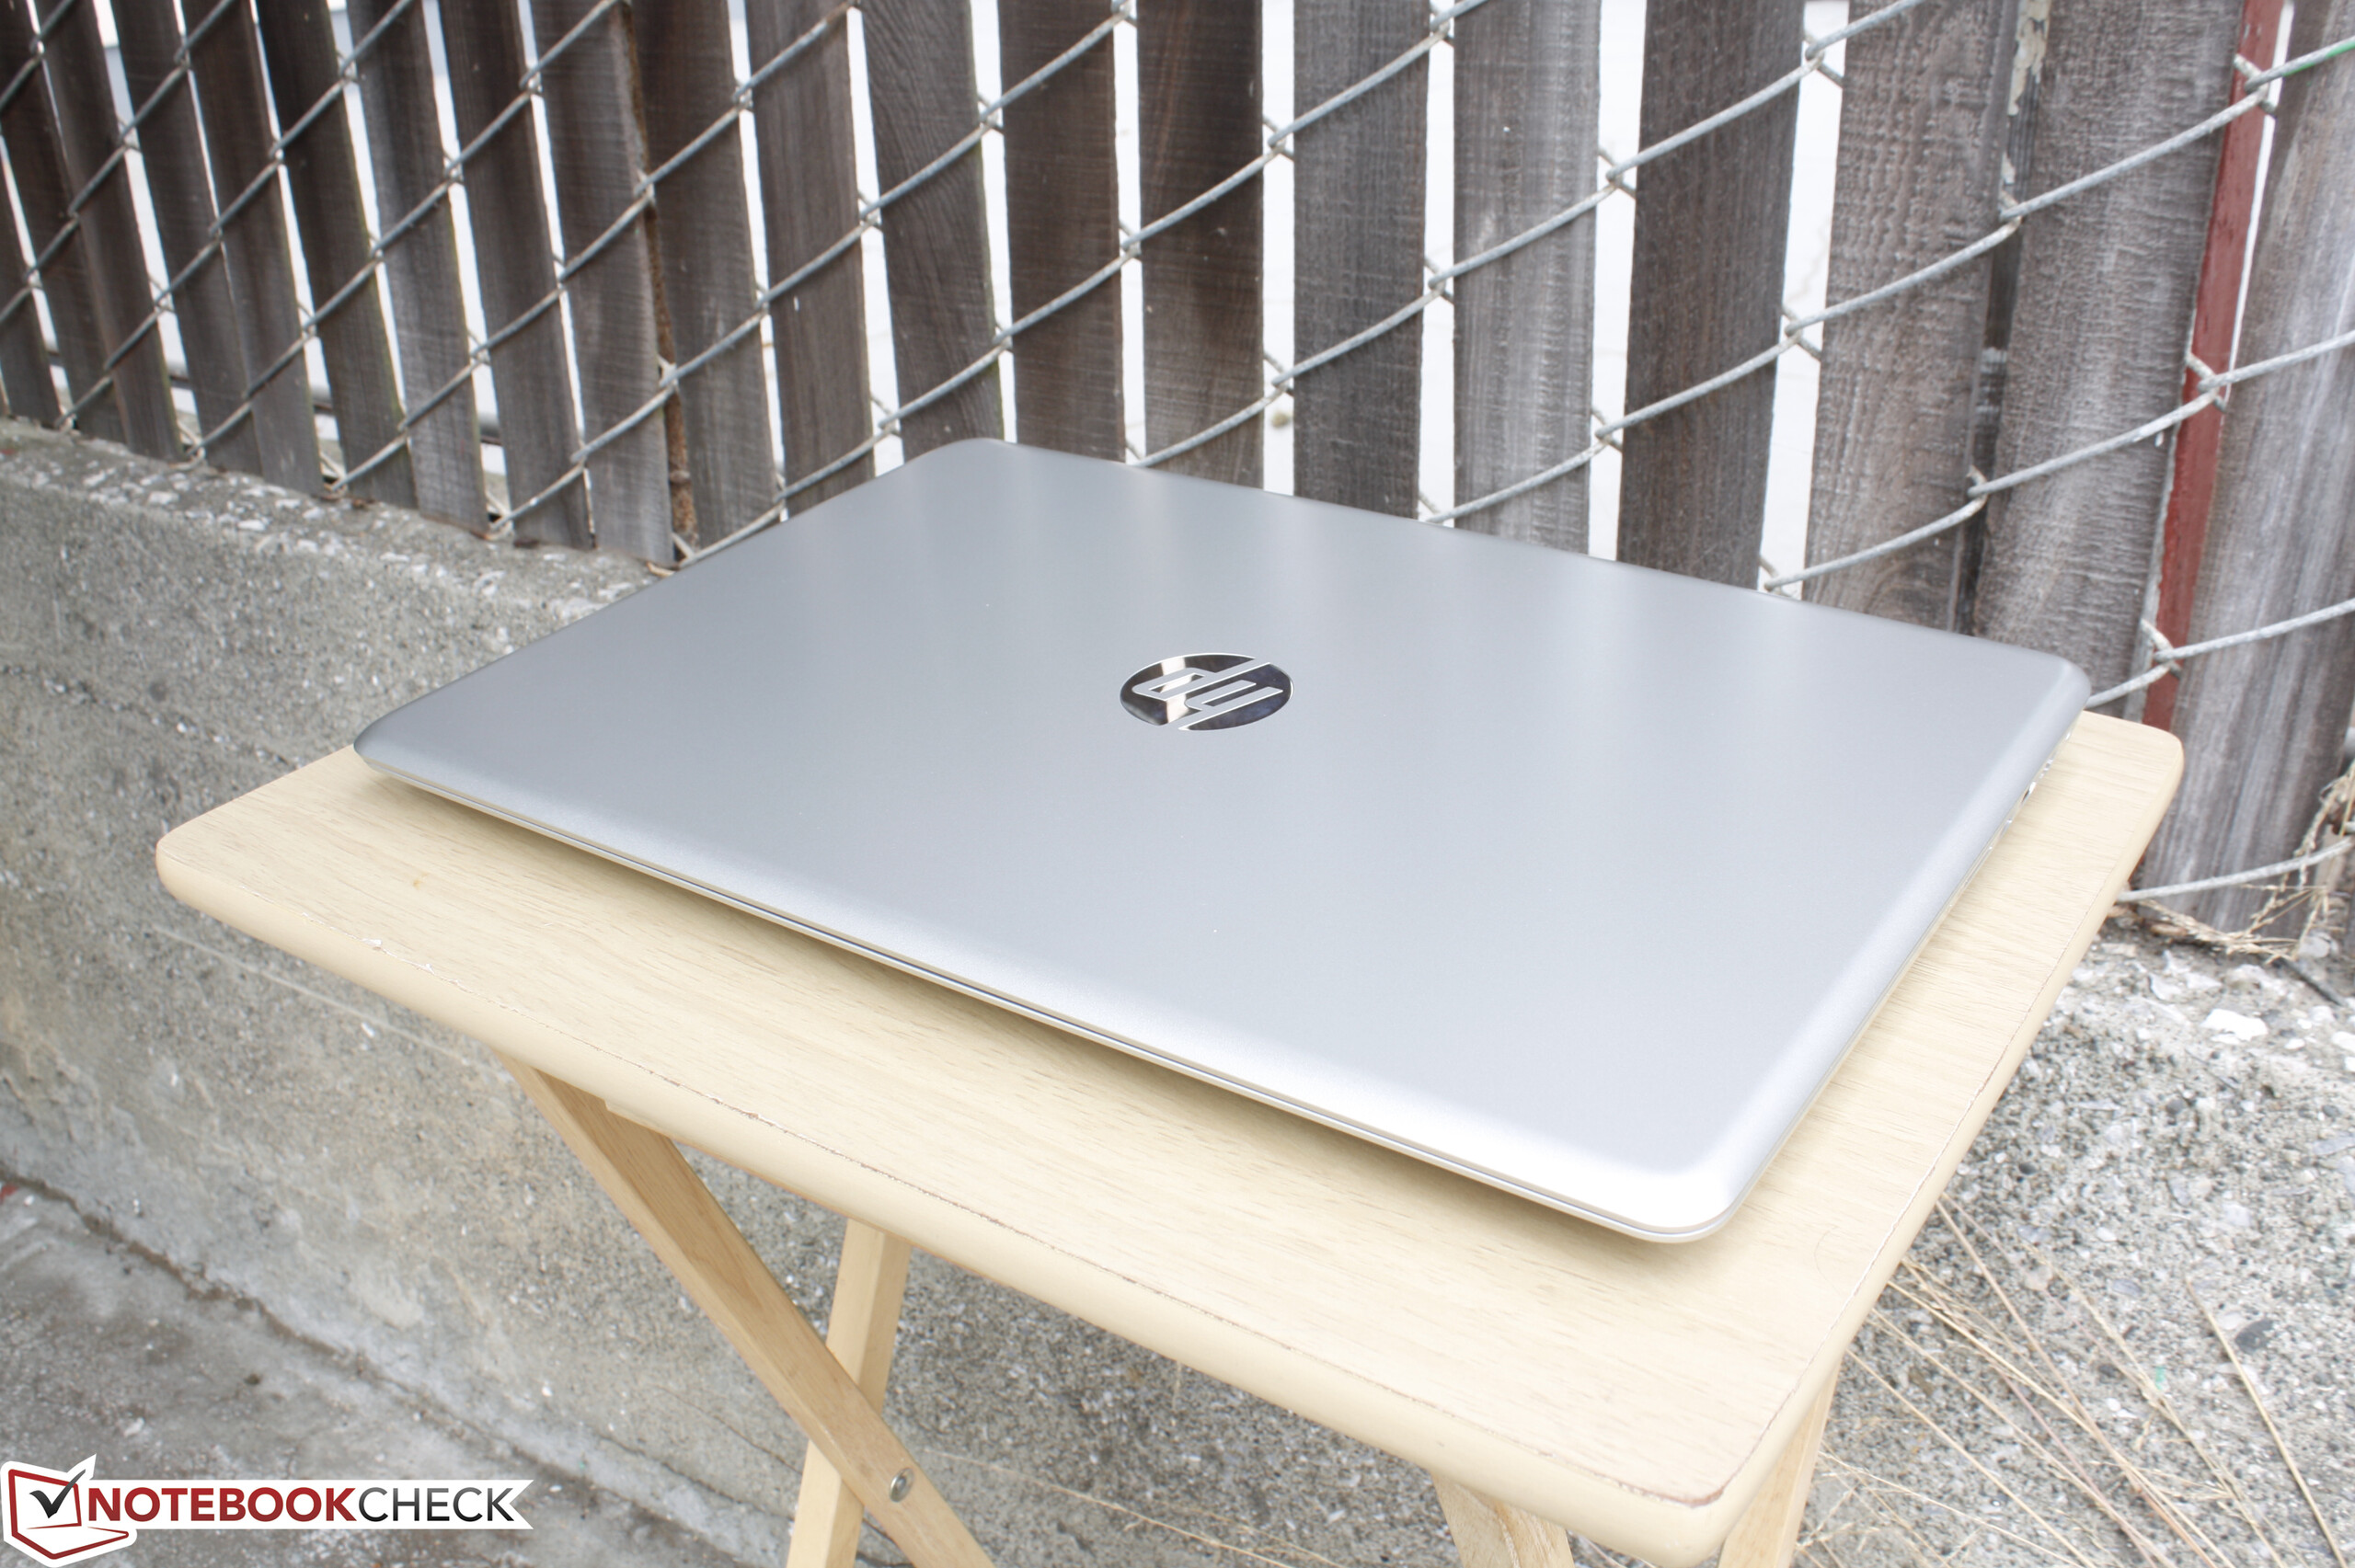
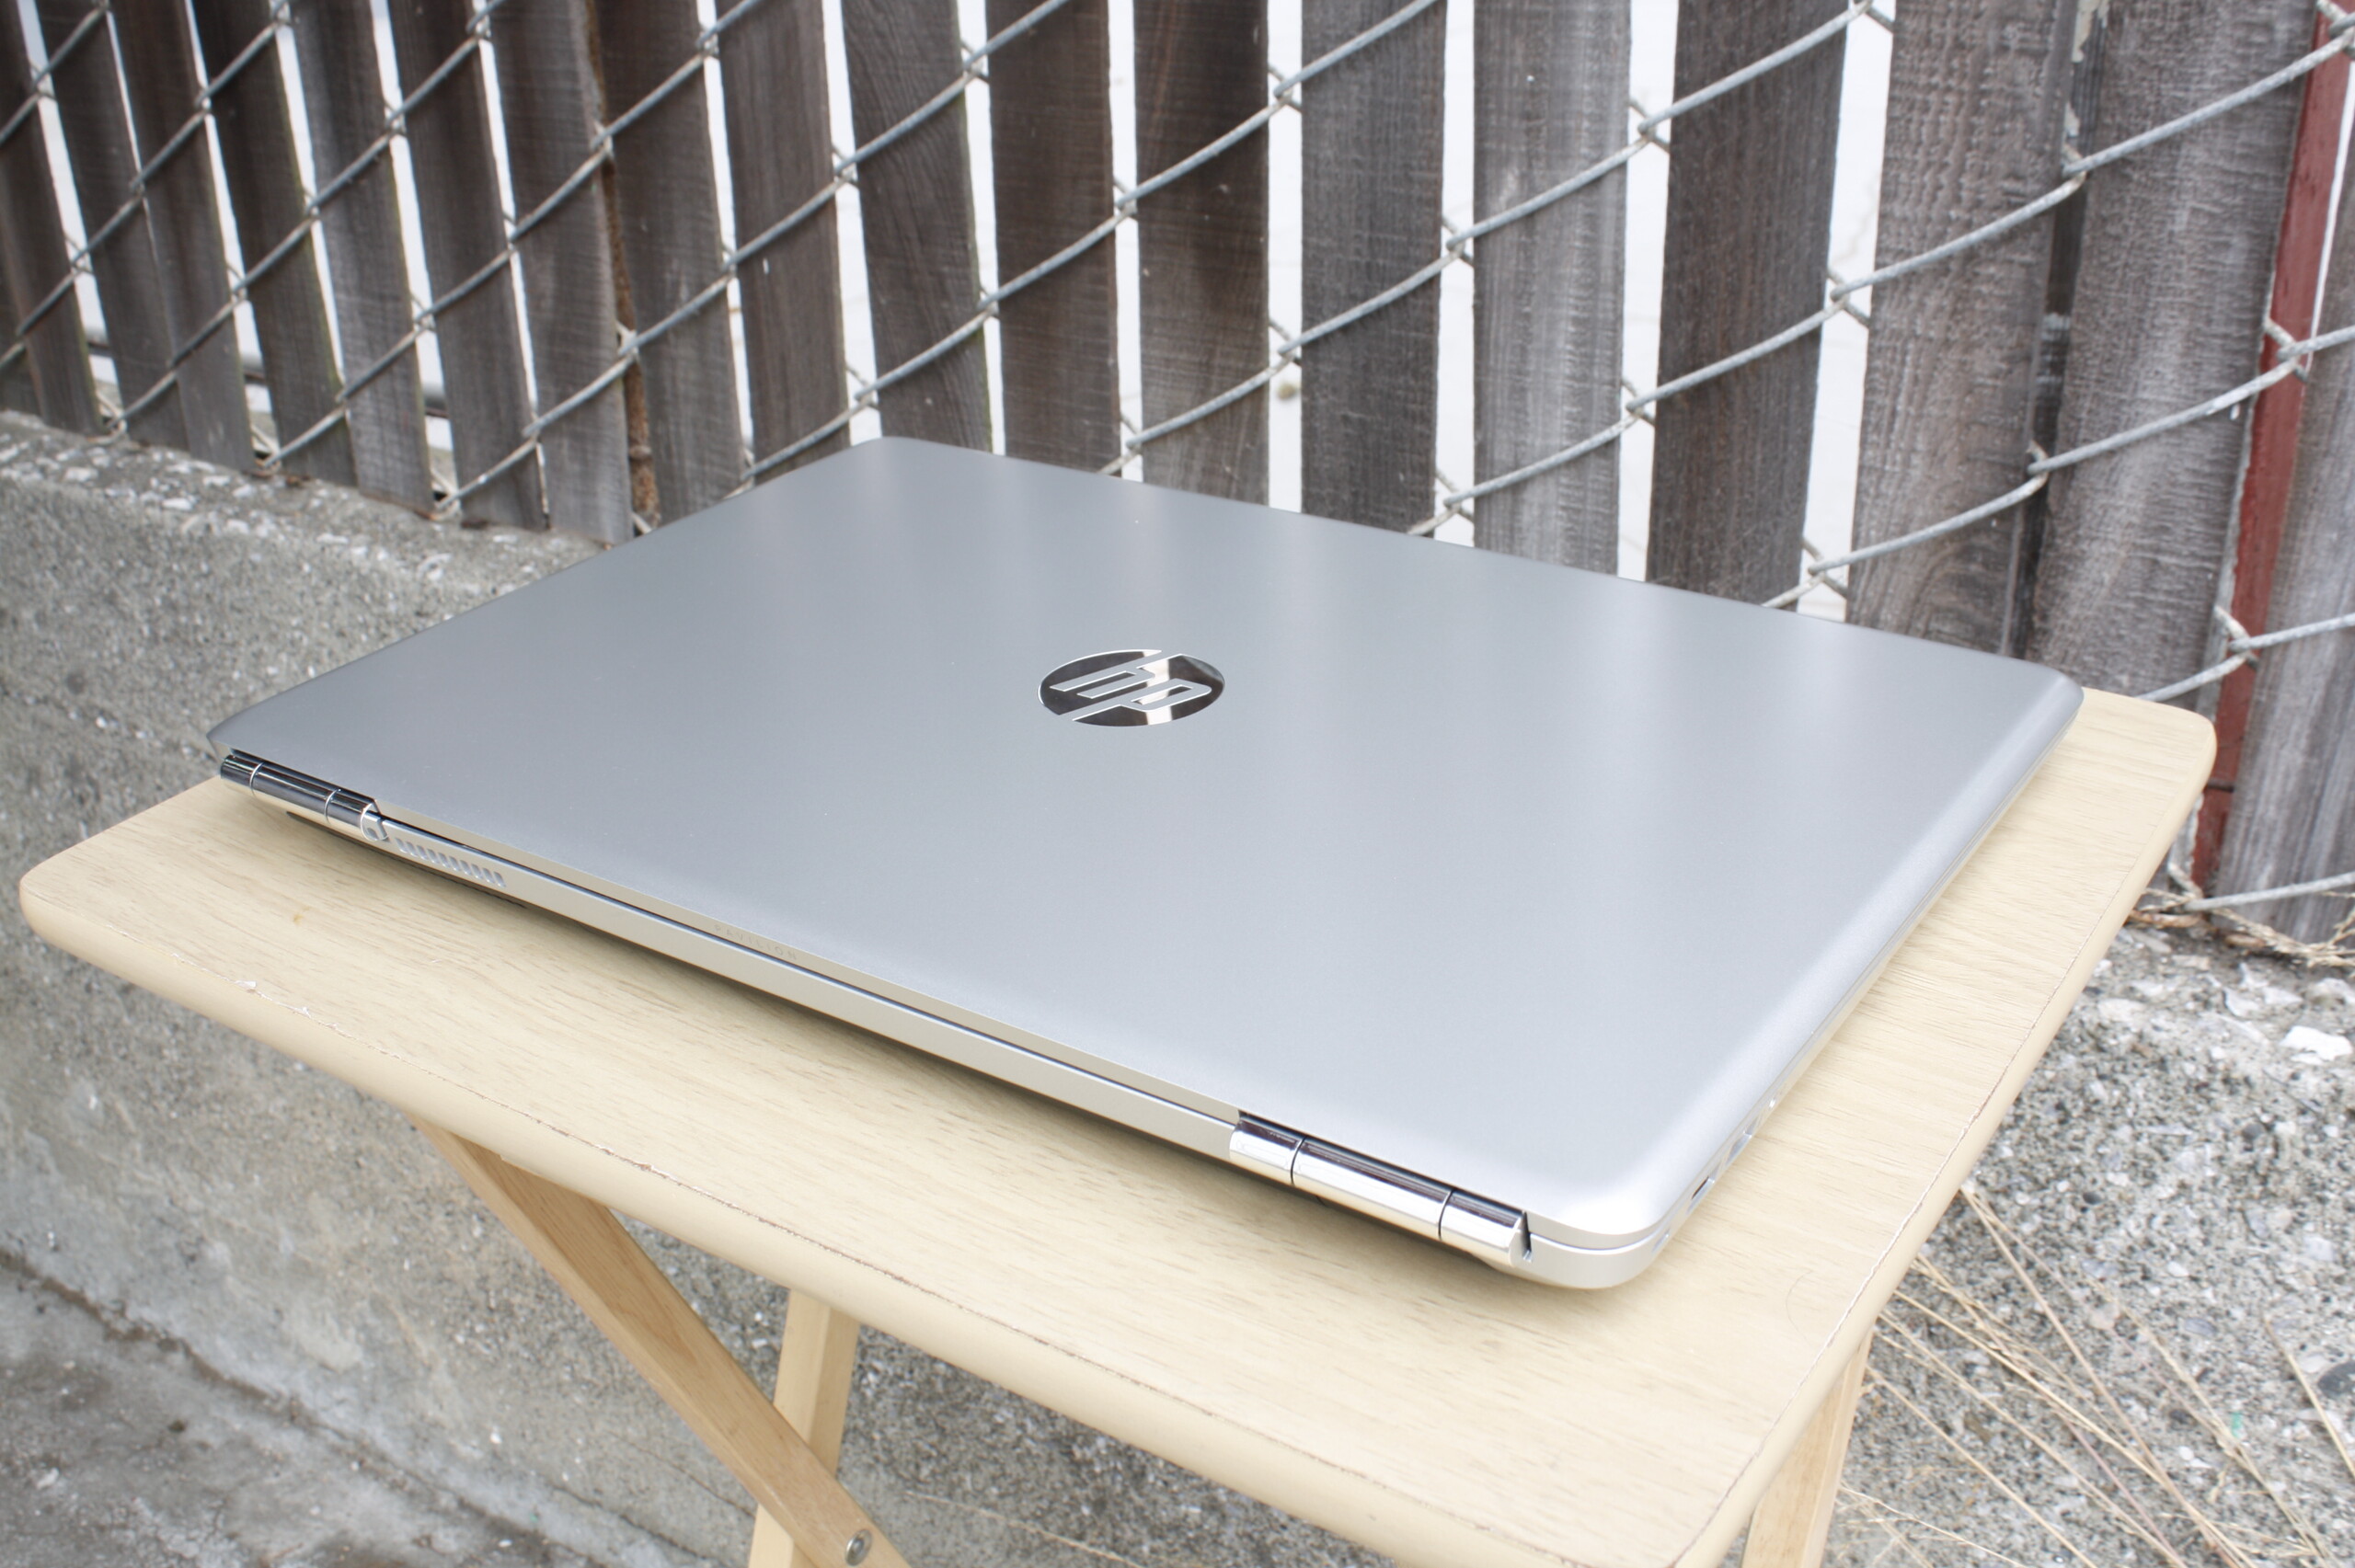
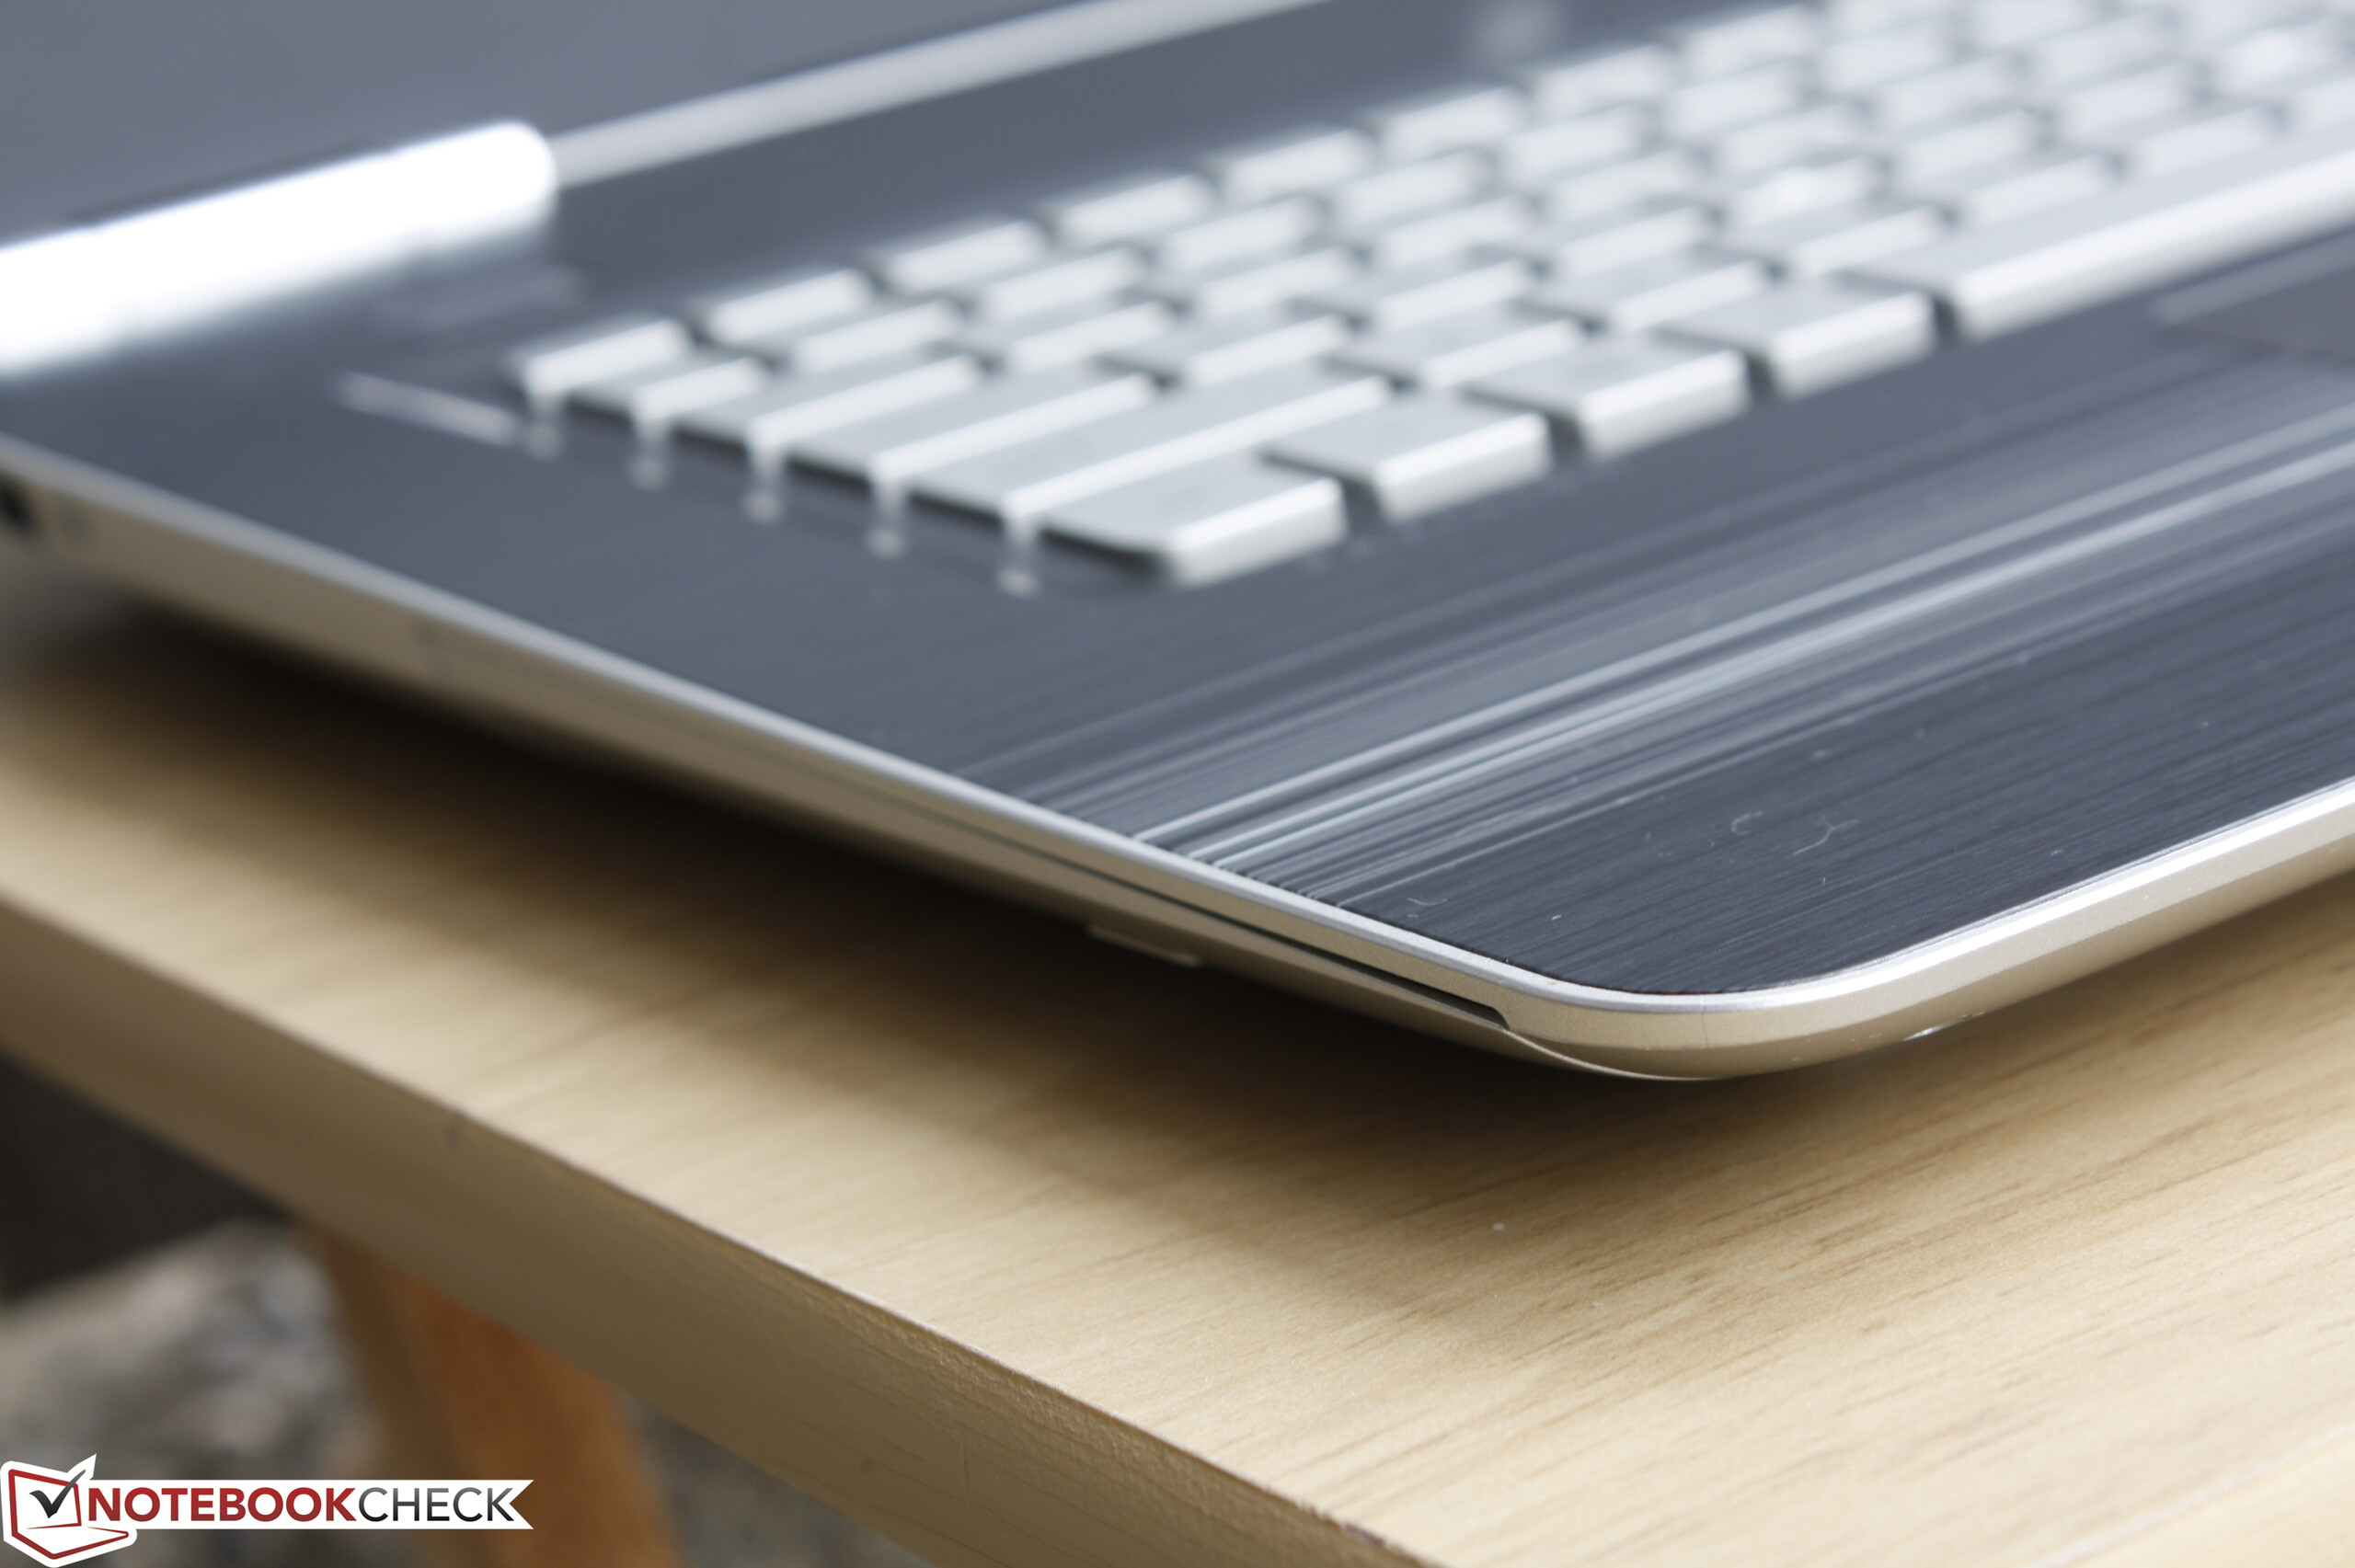
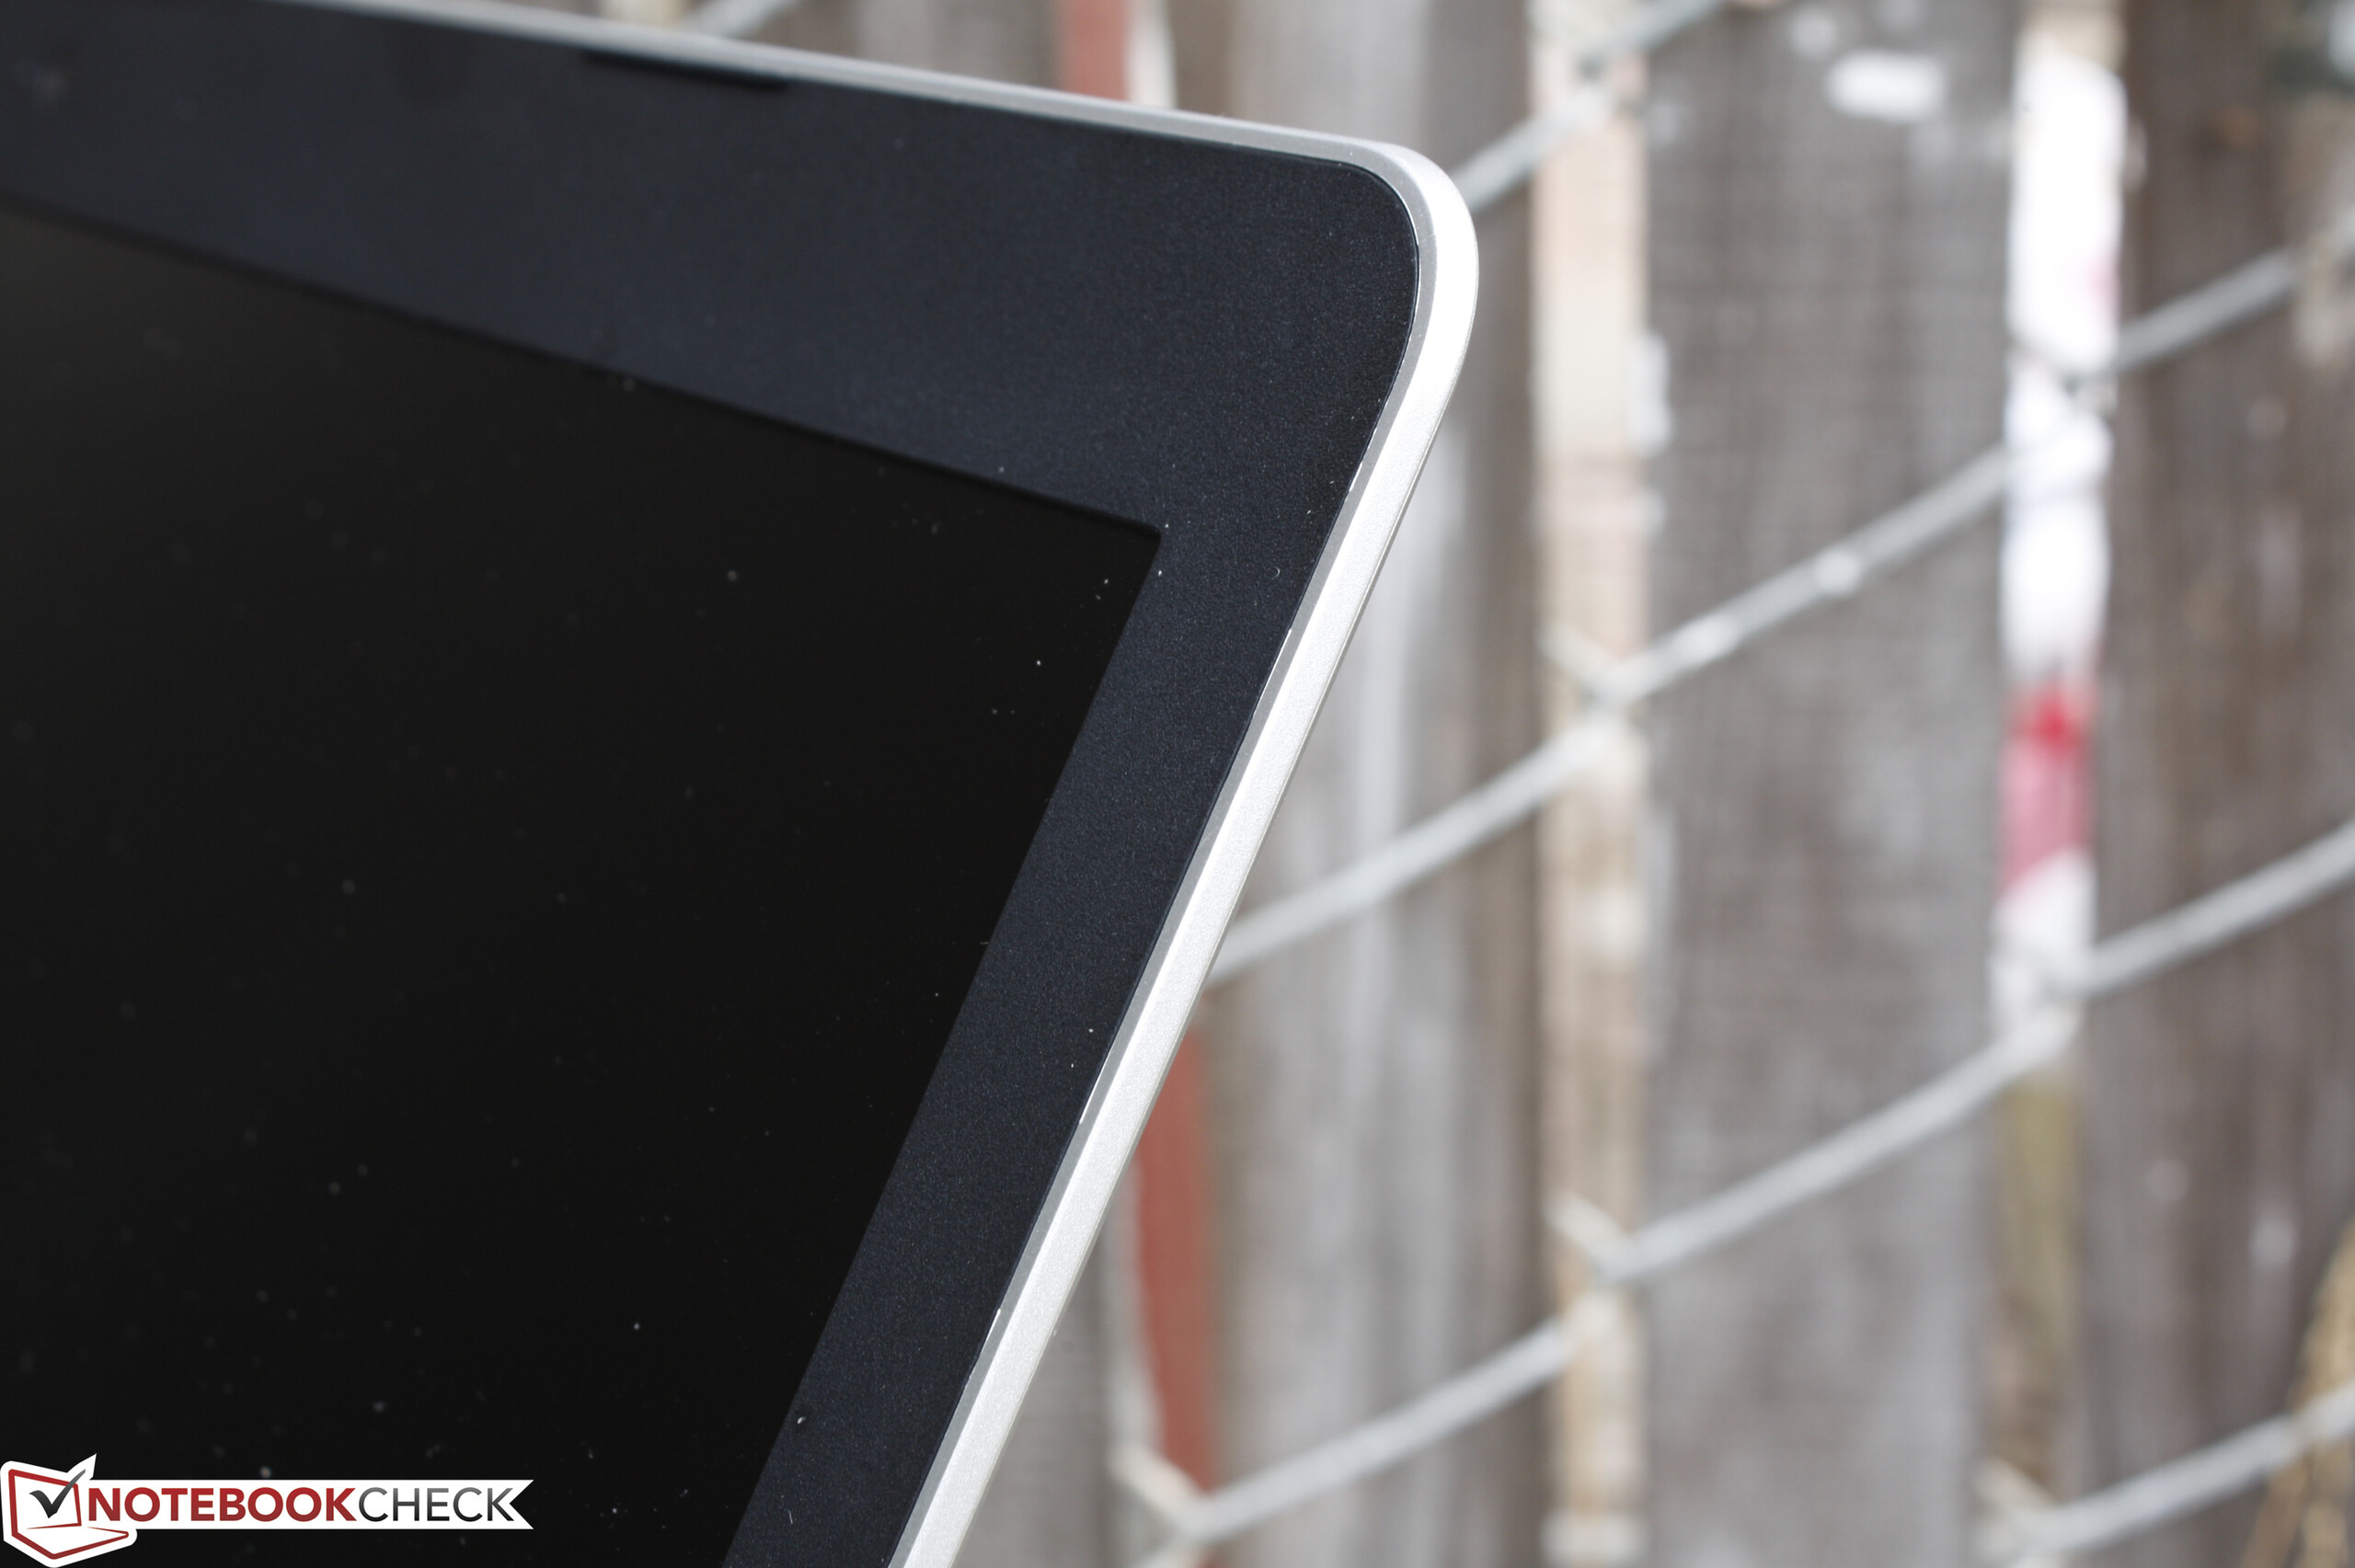
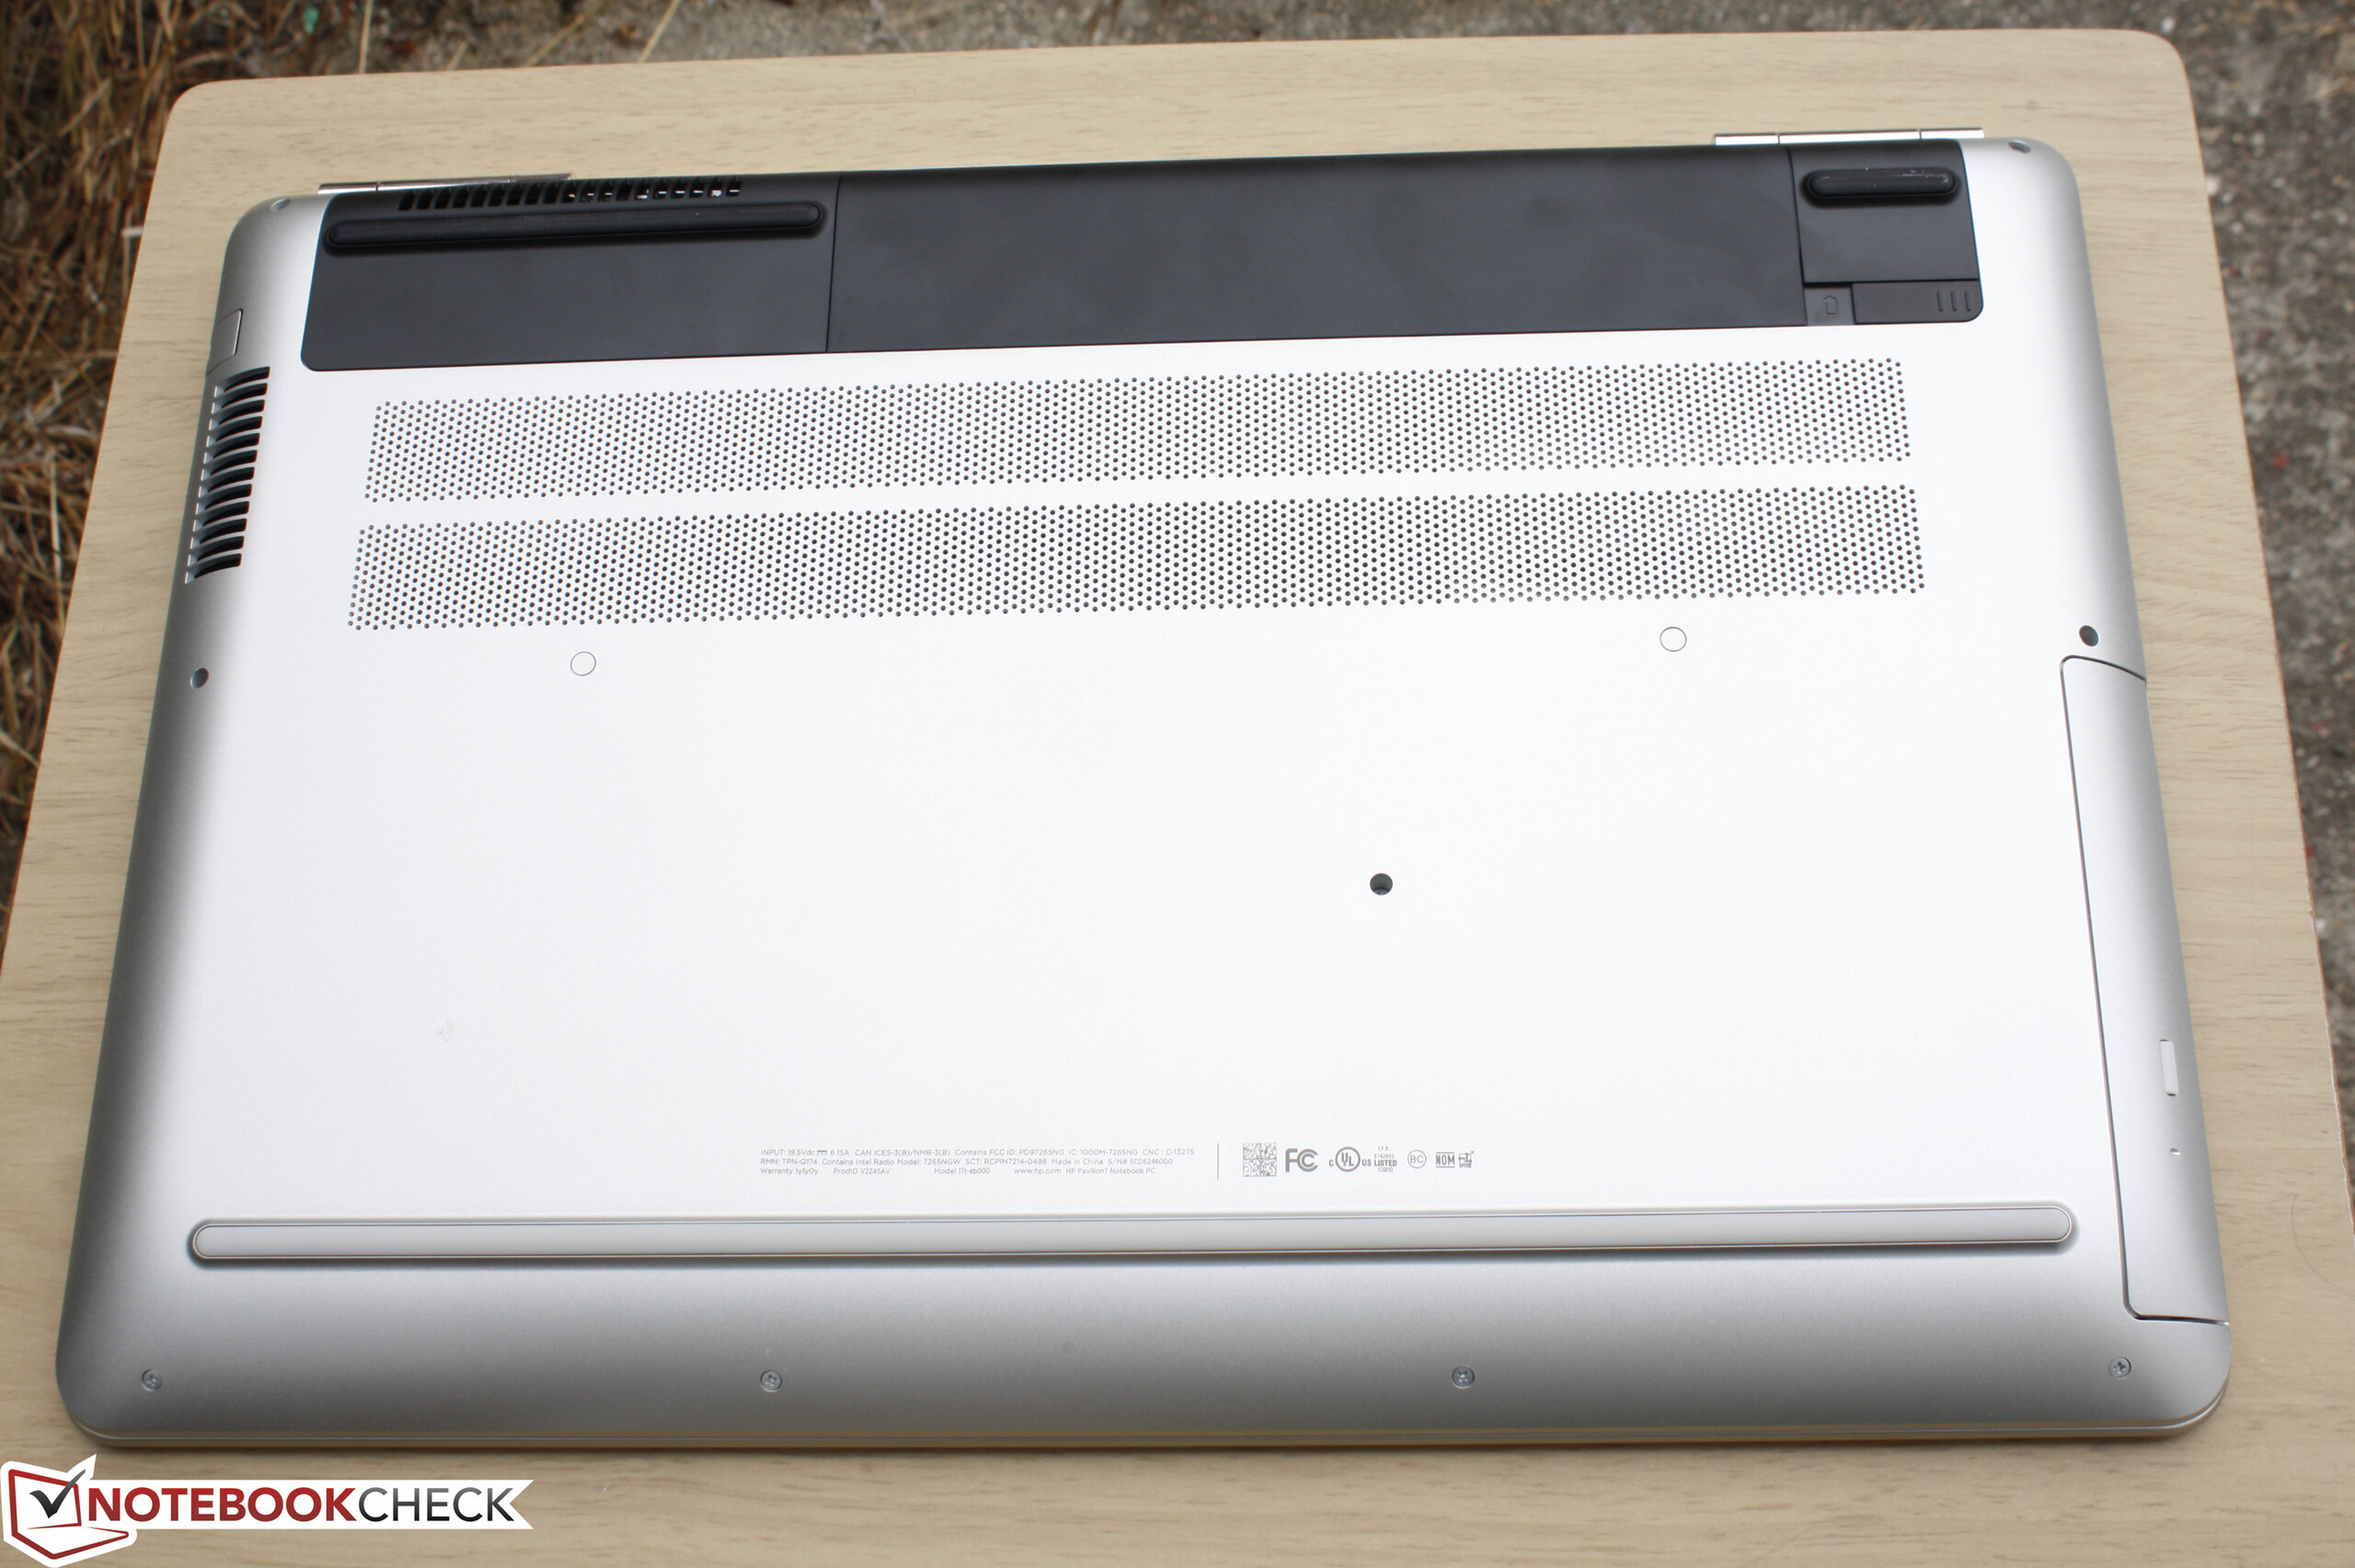
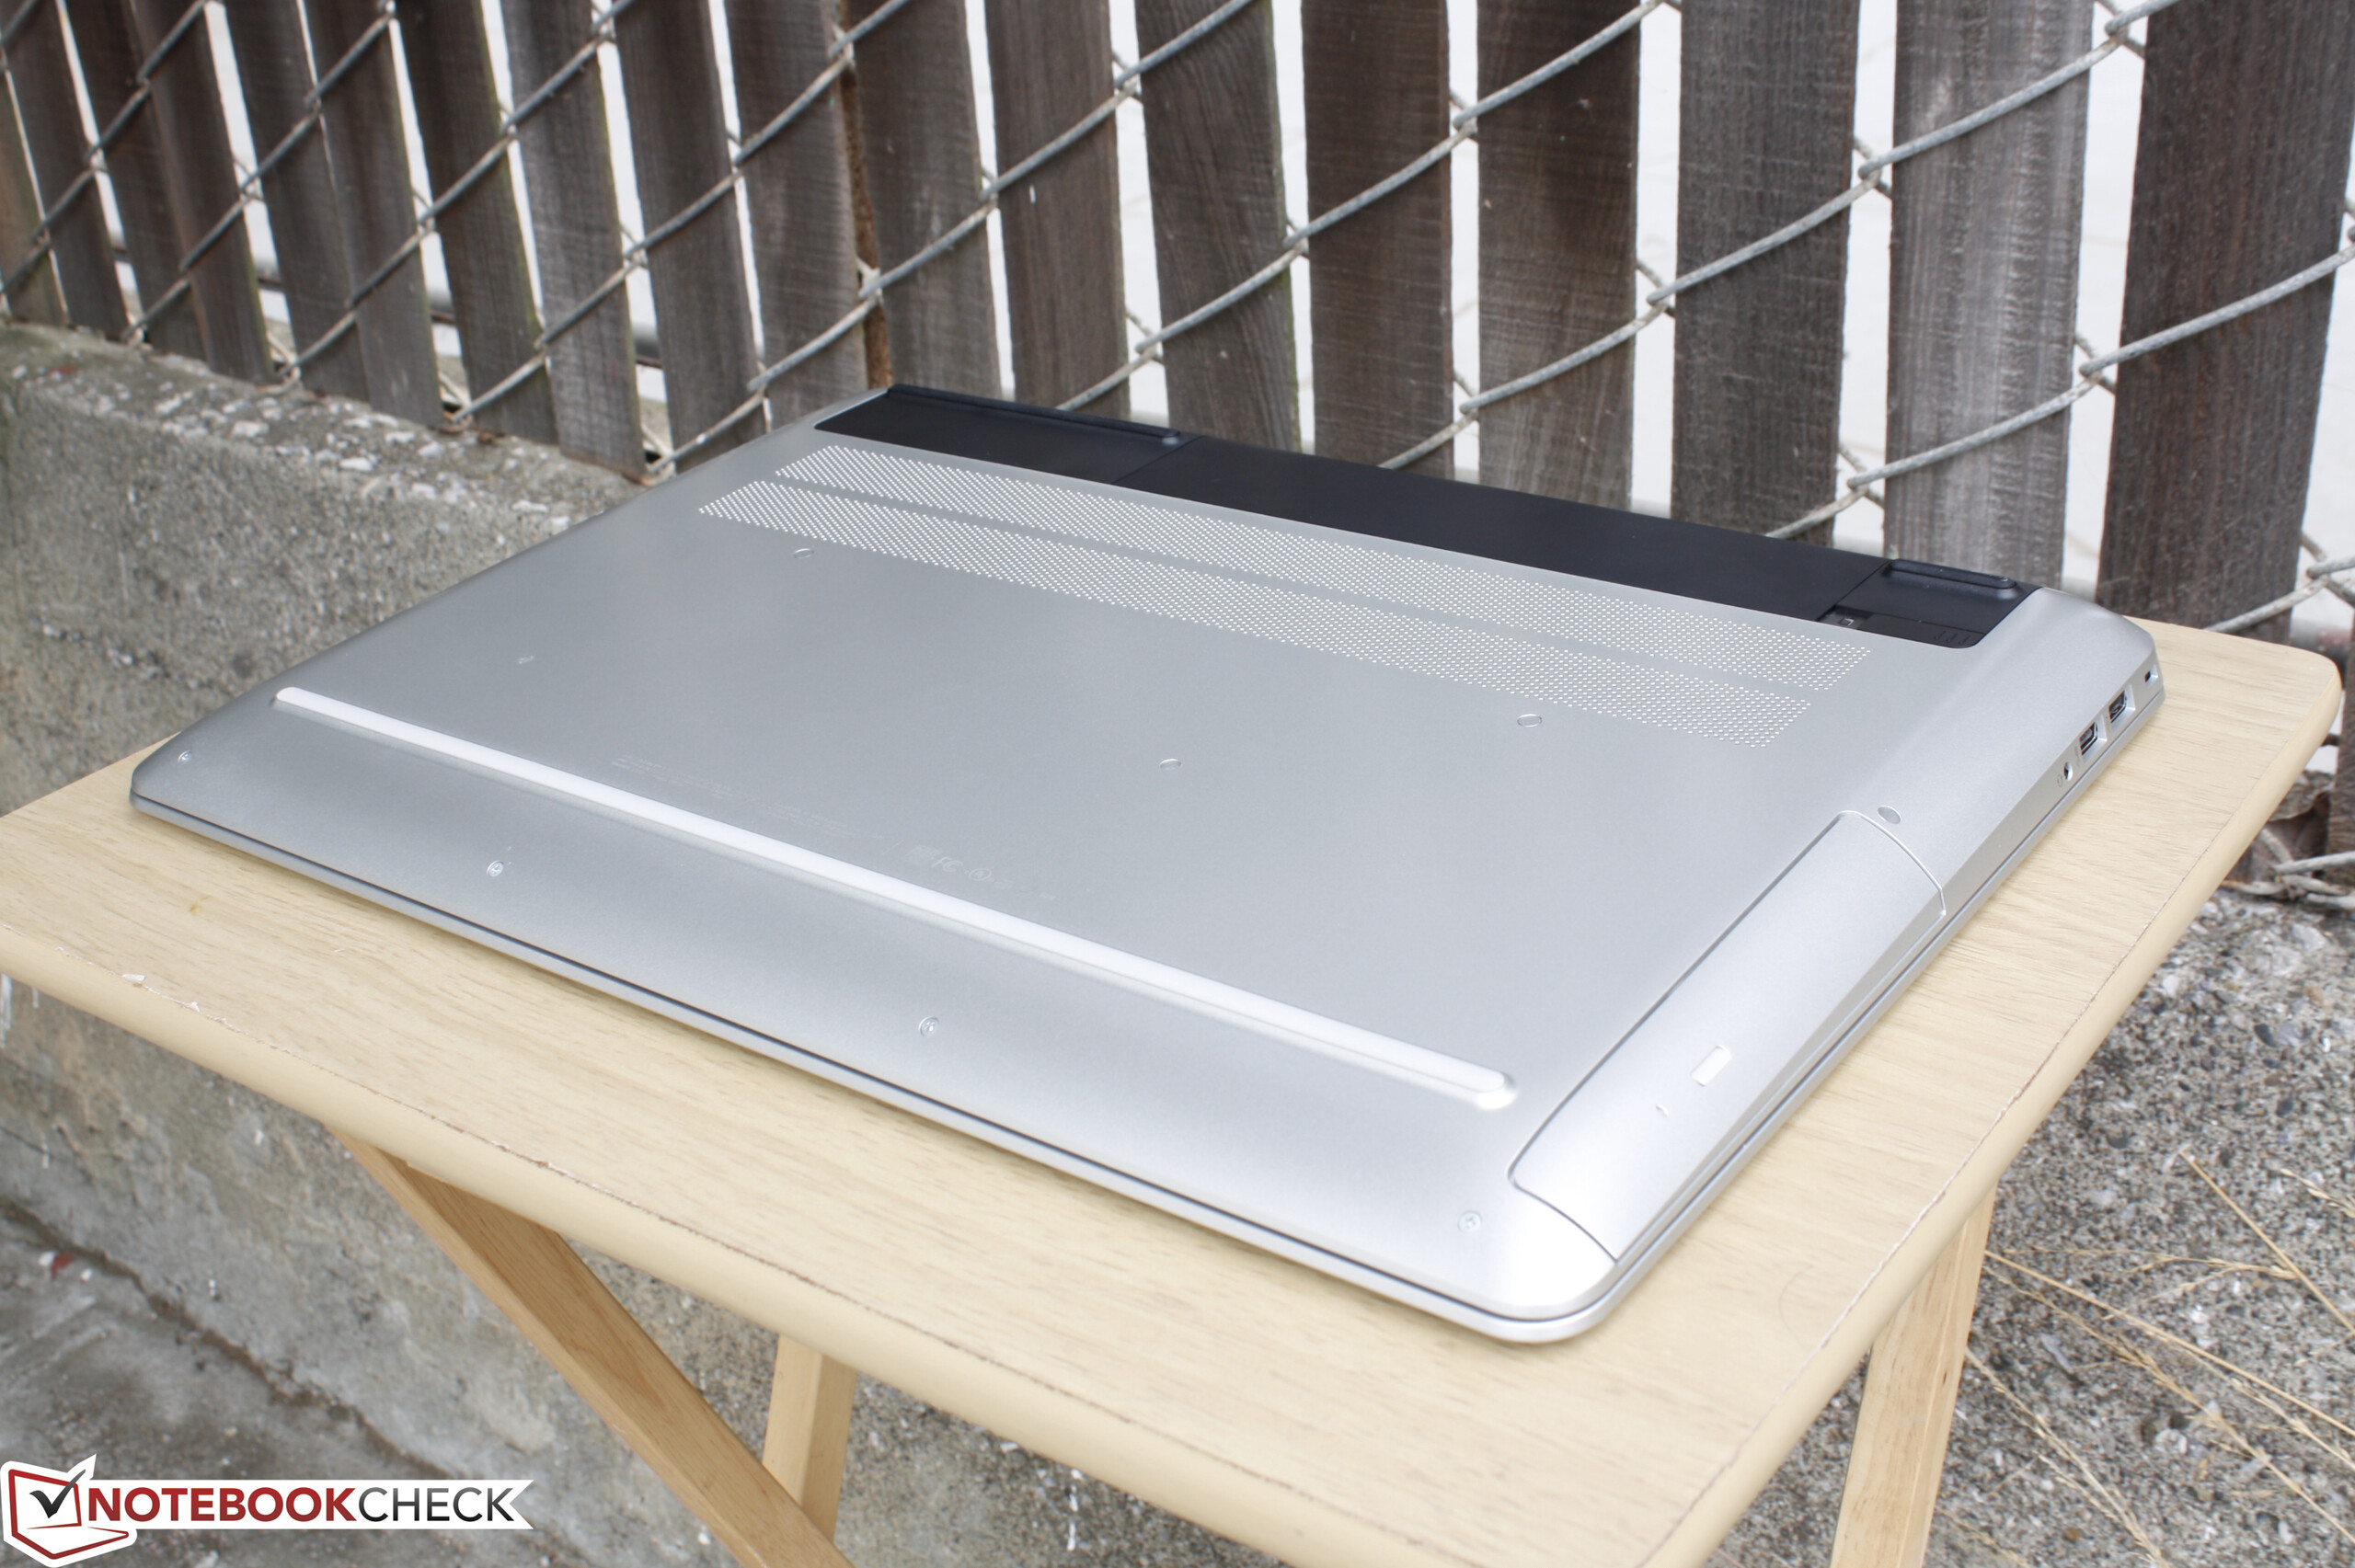
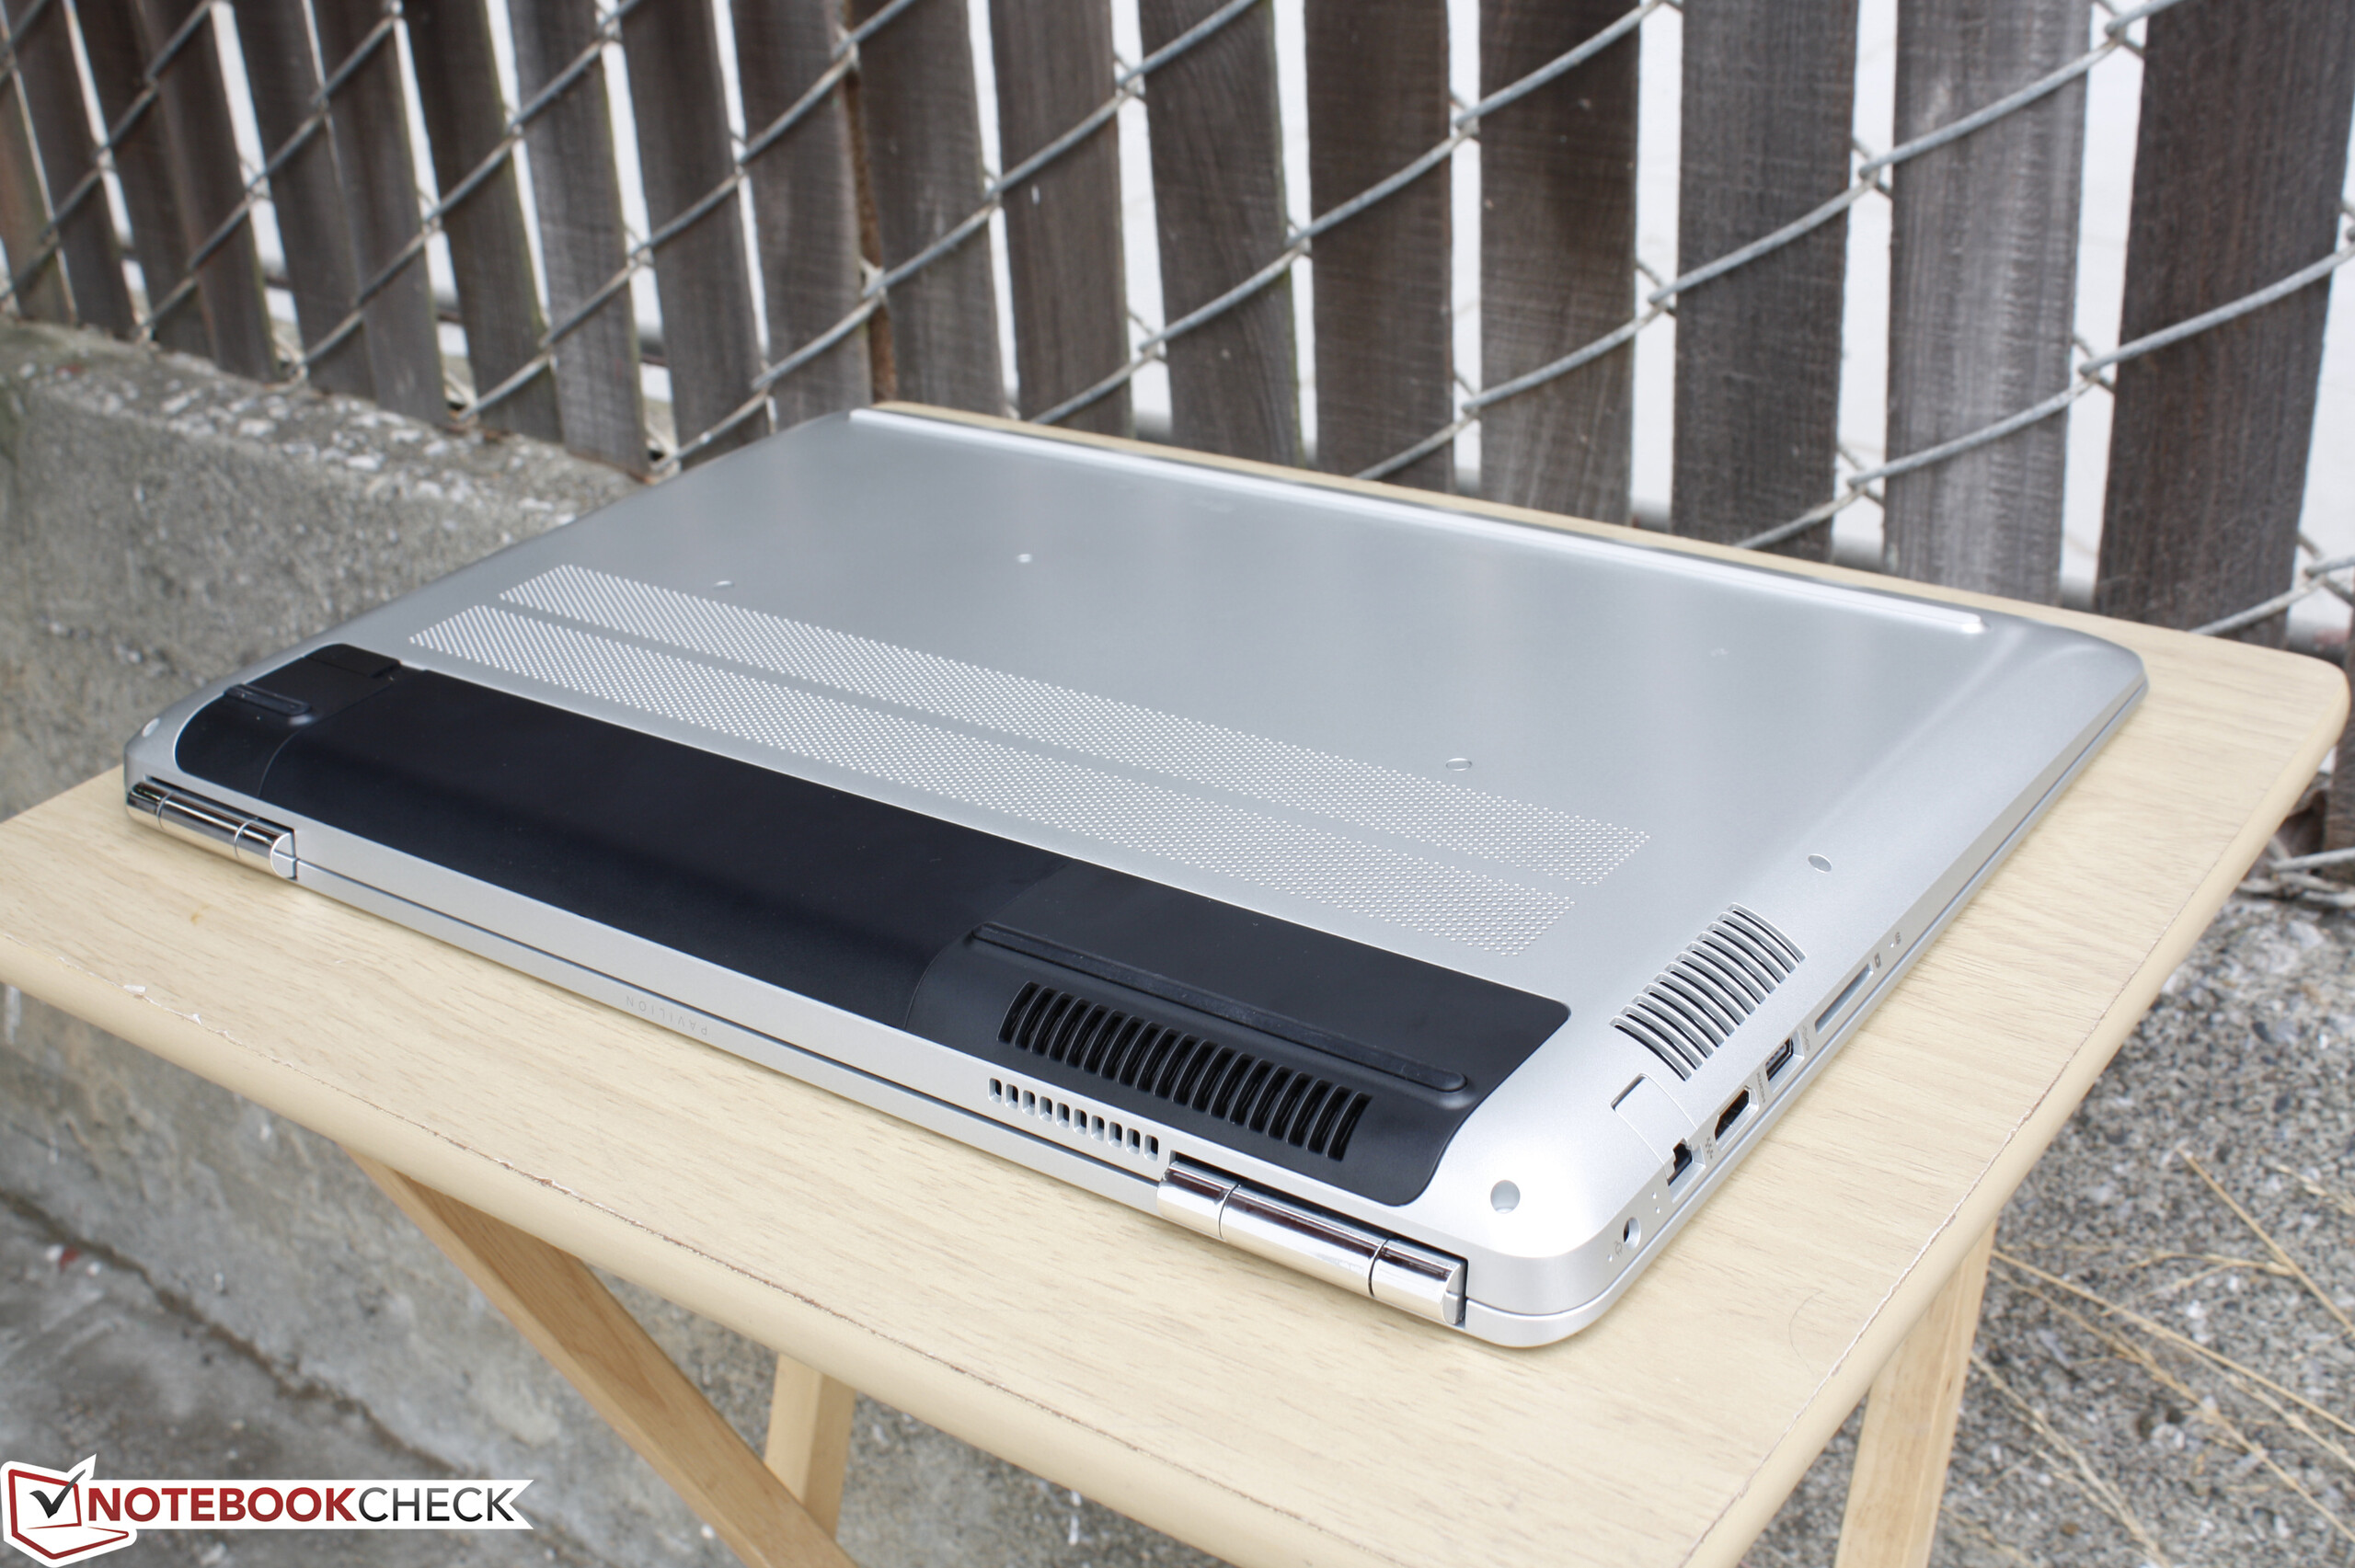
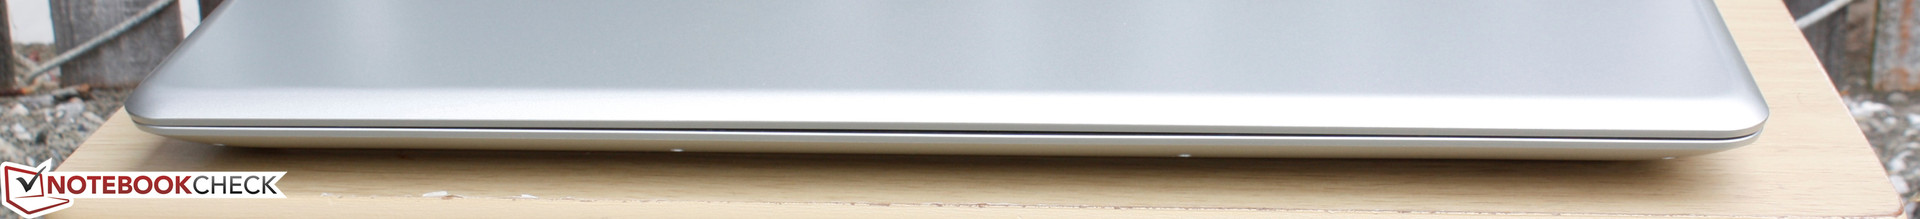
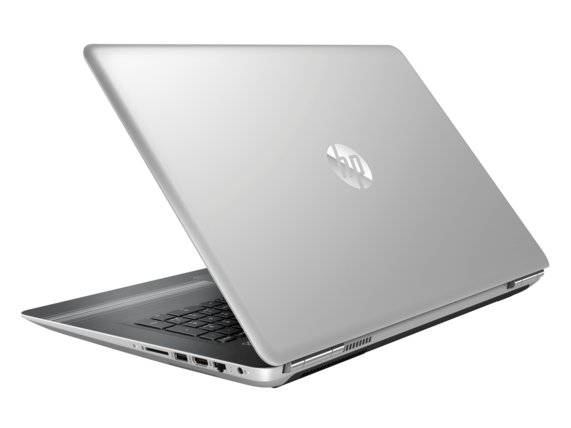
The design of the Pavilion 17 contrasts the Lenovo Y700 very well in that instead of sharp edges, corners, and accents, the matte HP is rounder and smoother from top to bottom for an overall simpler and more mainstream look when the notebook is closed. Open up the lid, however, and the plastics become very obvious. The base bends and depresses slightly to applied pressure and the center of the outer lid is especially susceptible to warping. Even though the system shares design similarities with the Pavilion 15, the materials don't scale perfectly into a 17-inch form factor, so the Pavilion 17 feels a step weaker than its smaller alternative and tends to creak when attempting to twist its base.
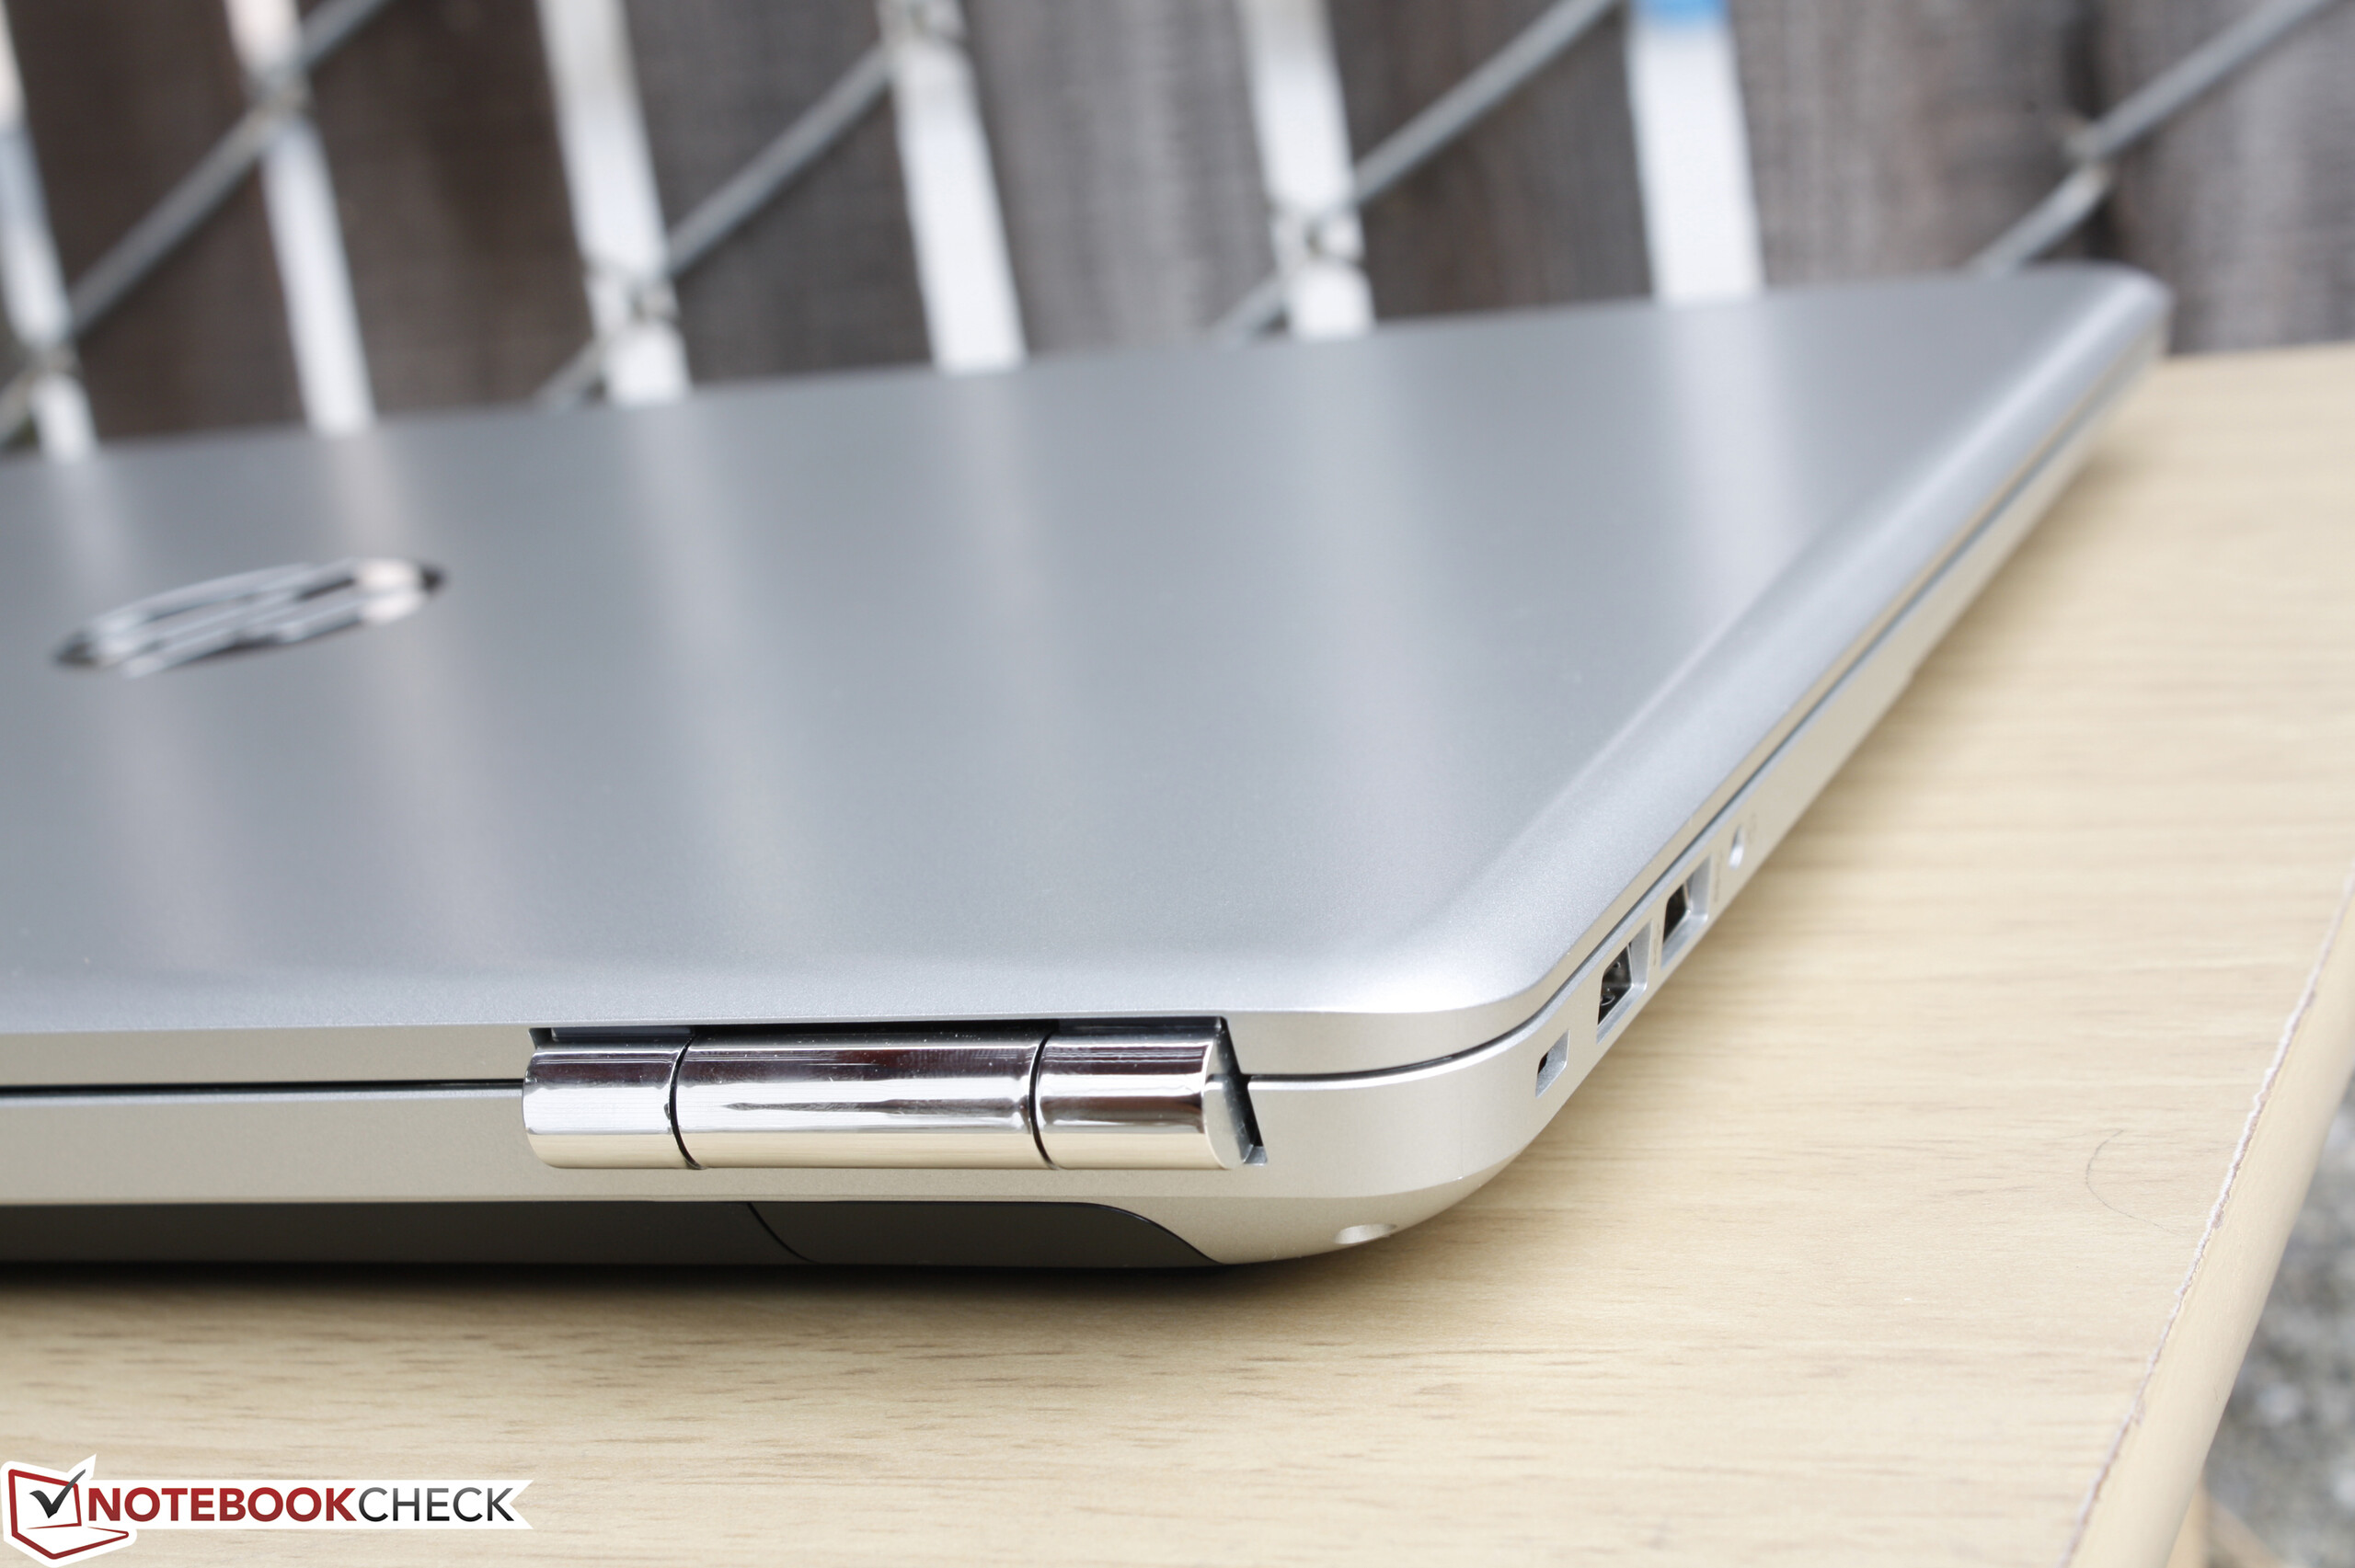
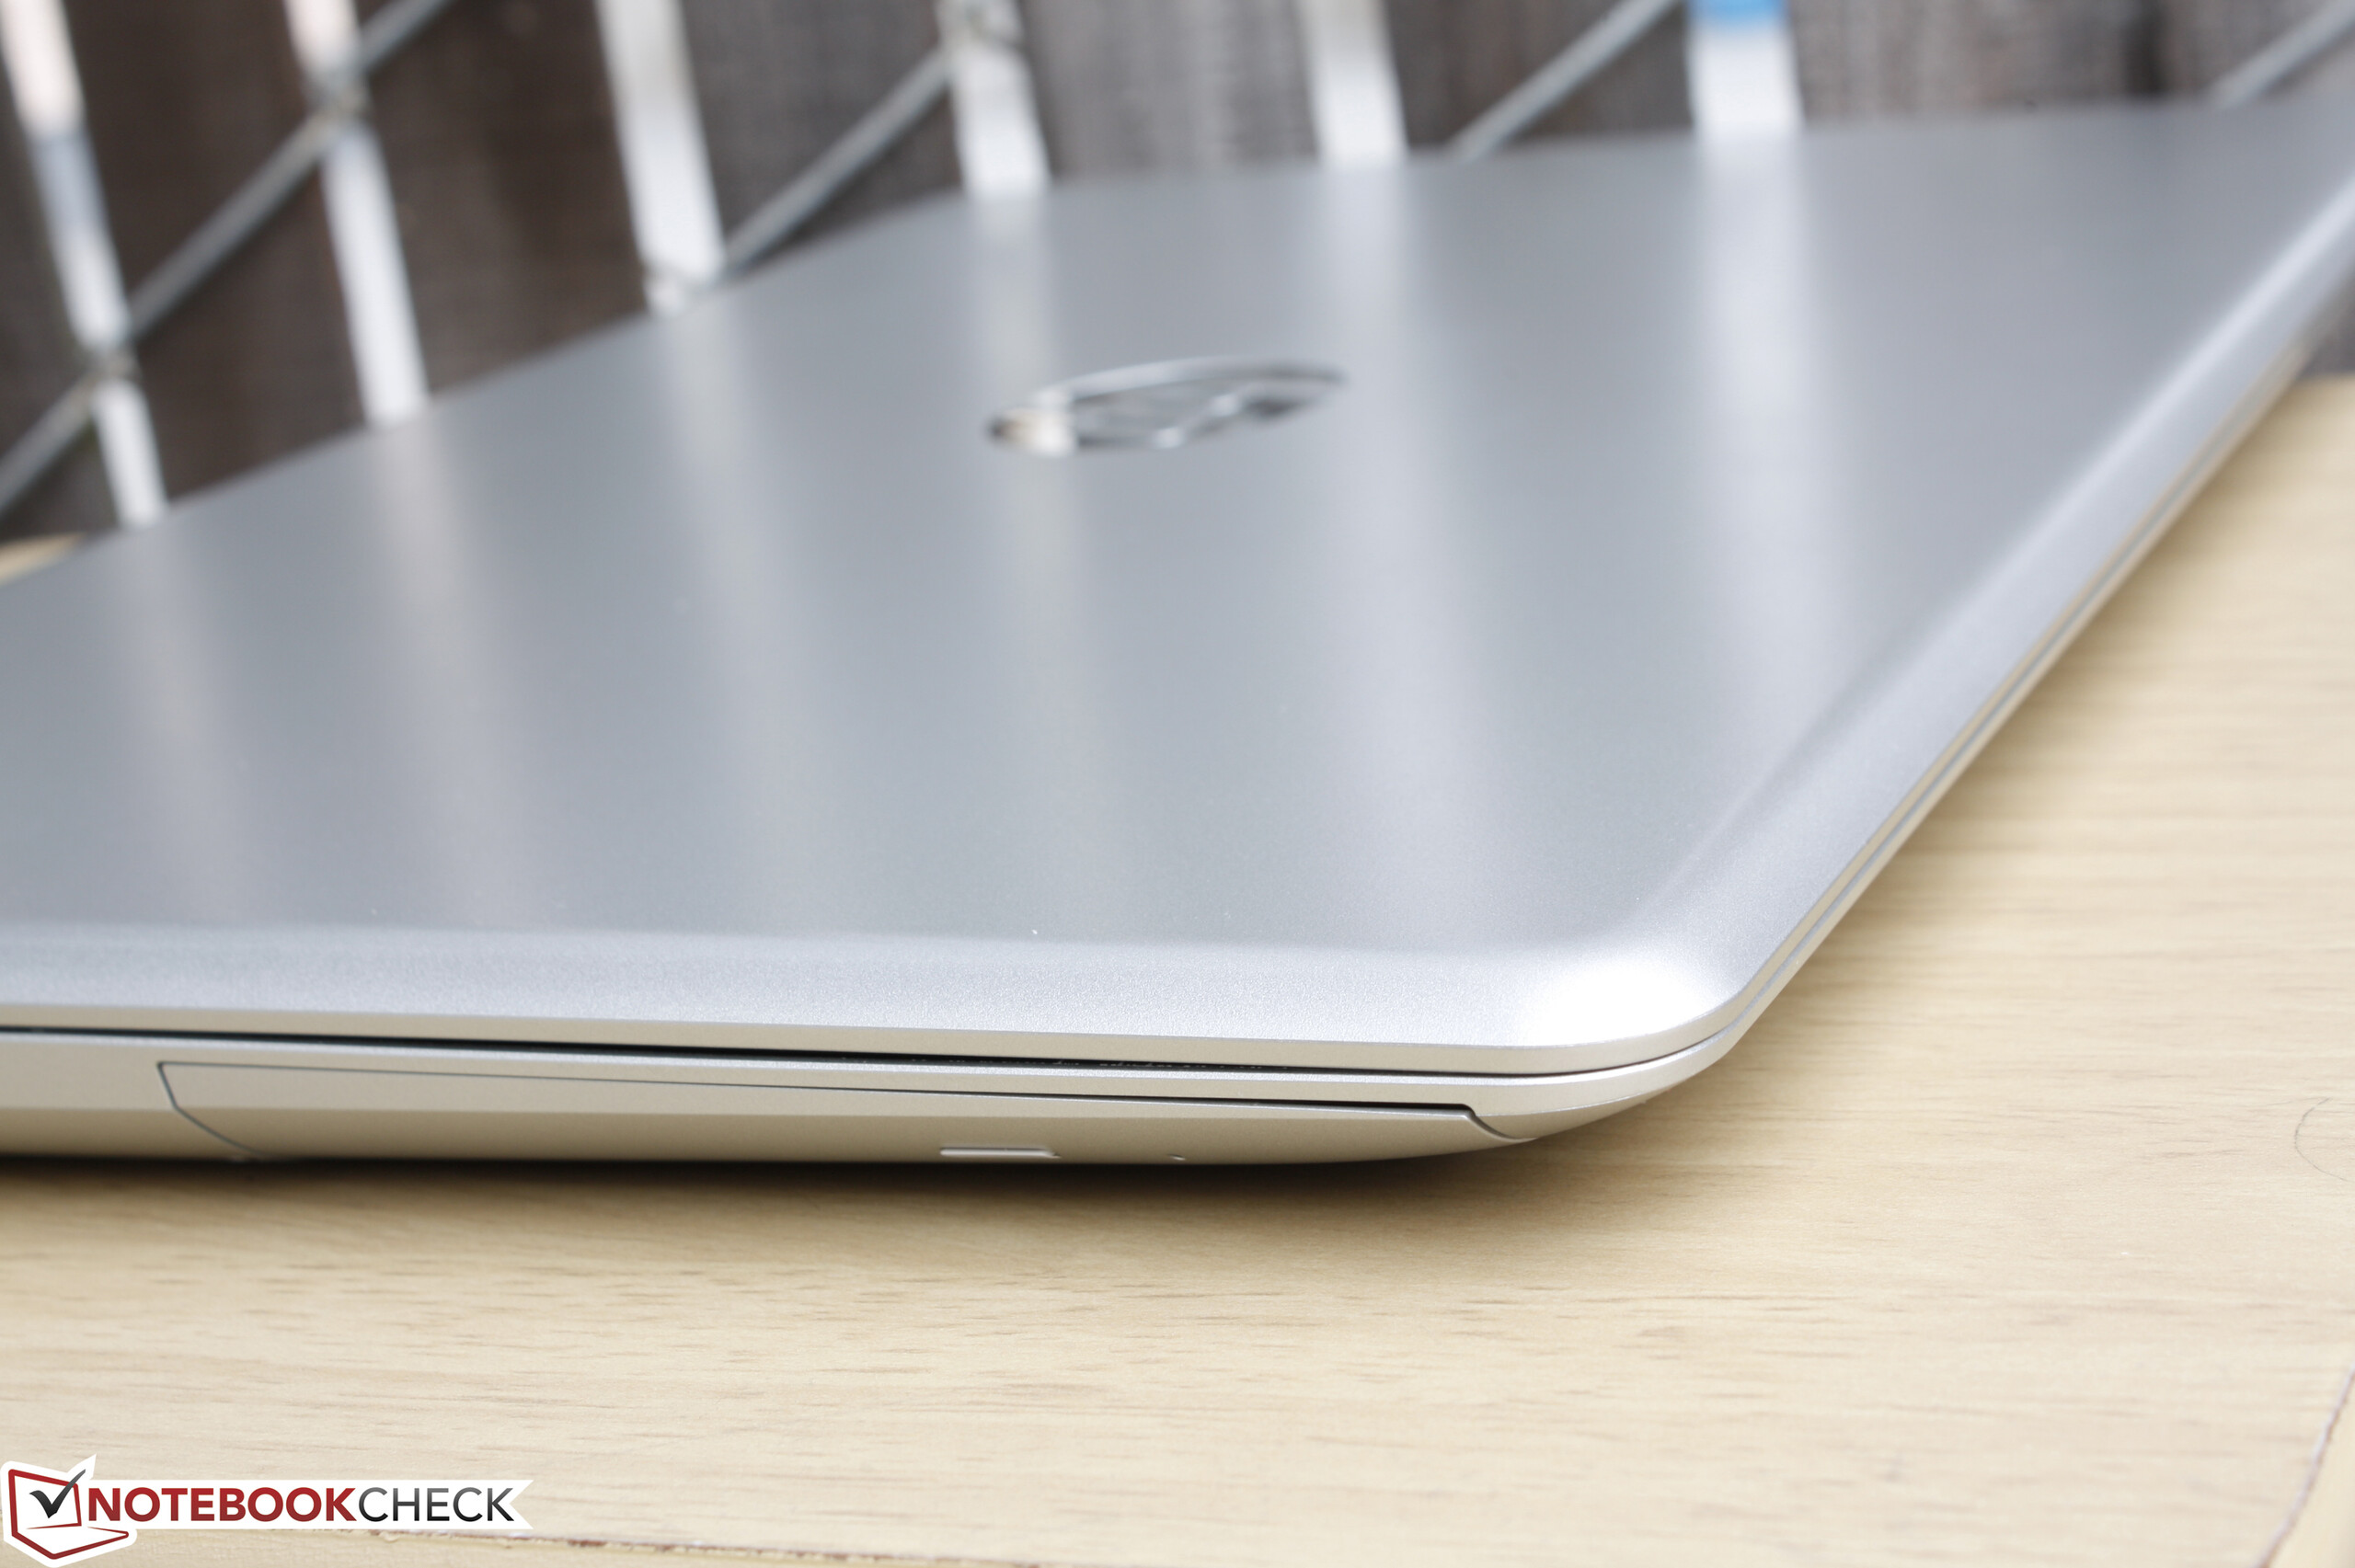
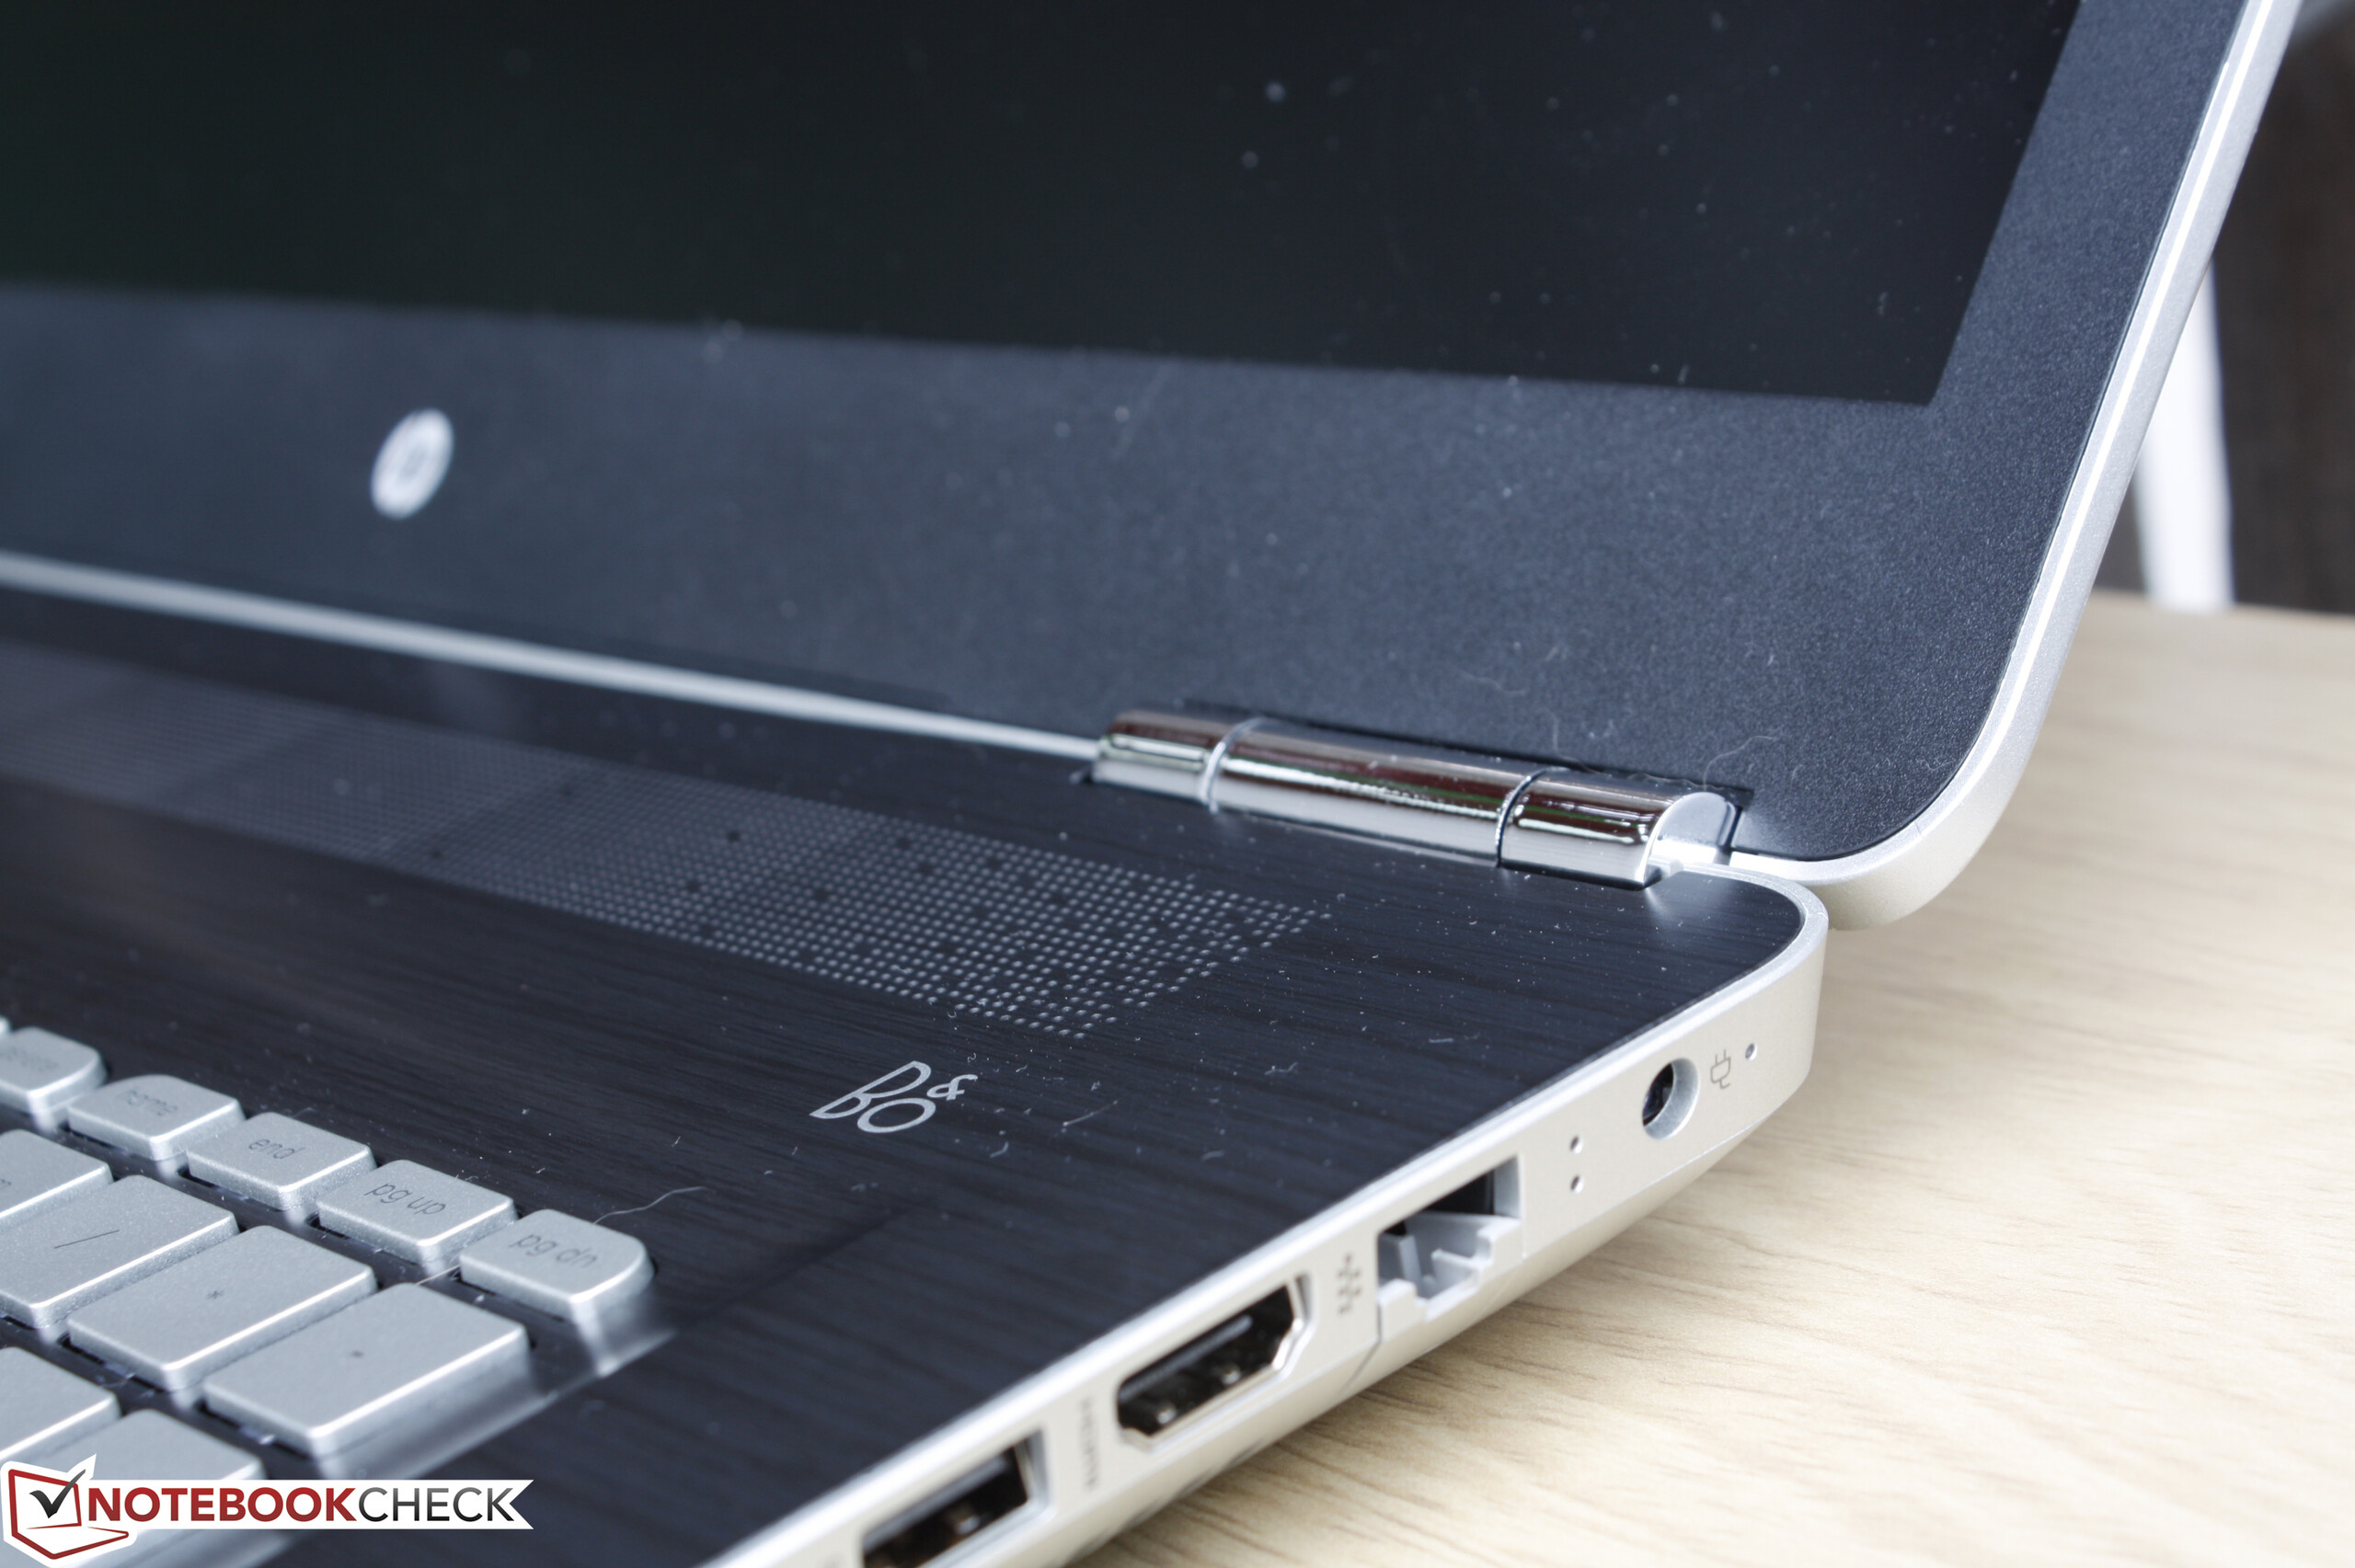
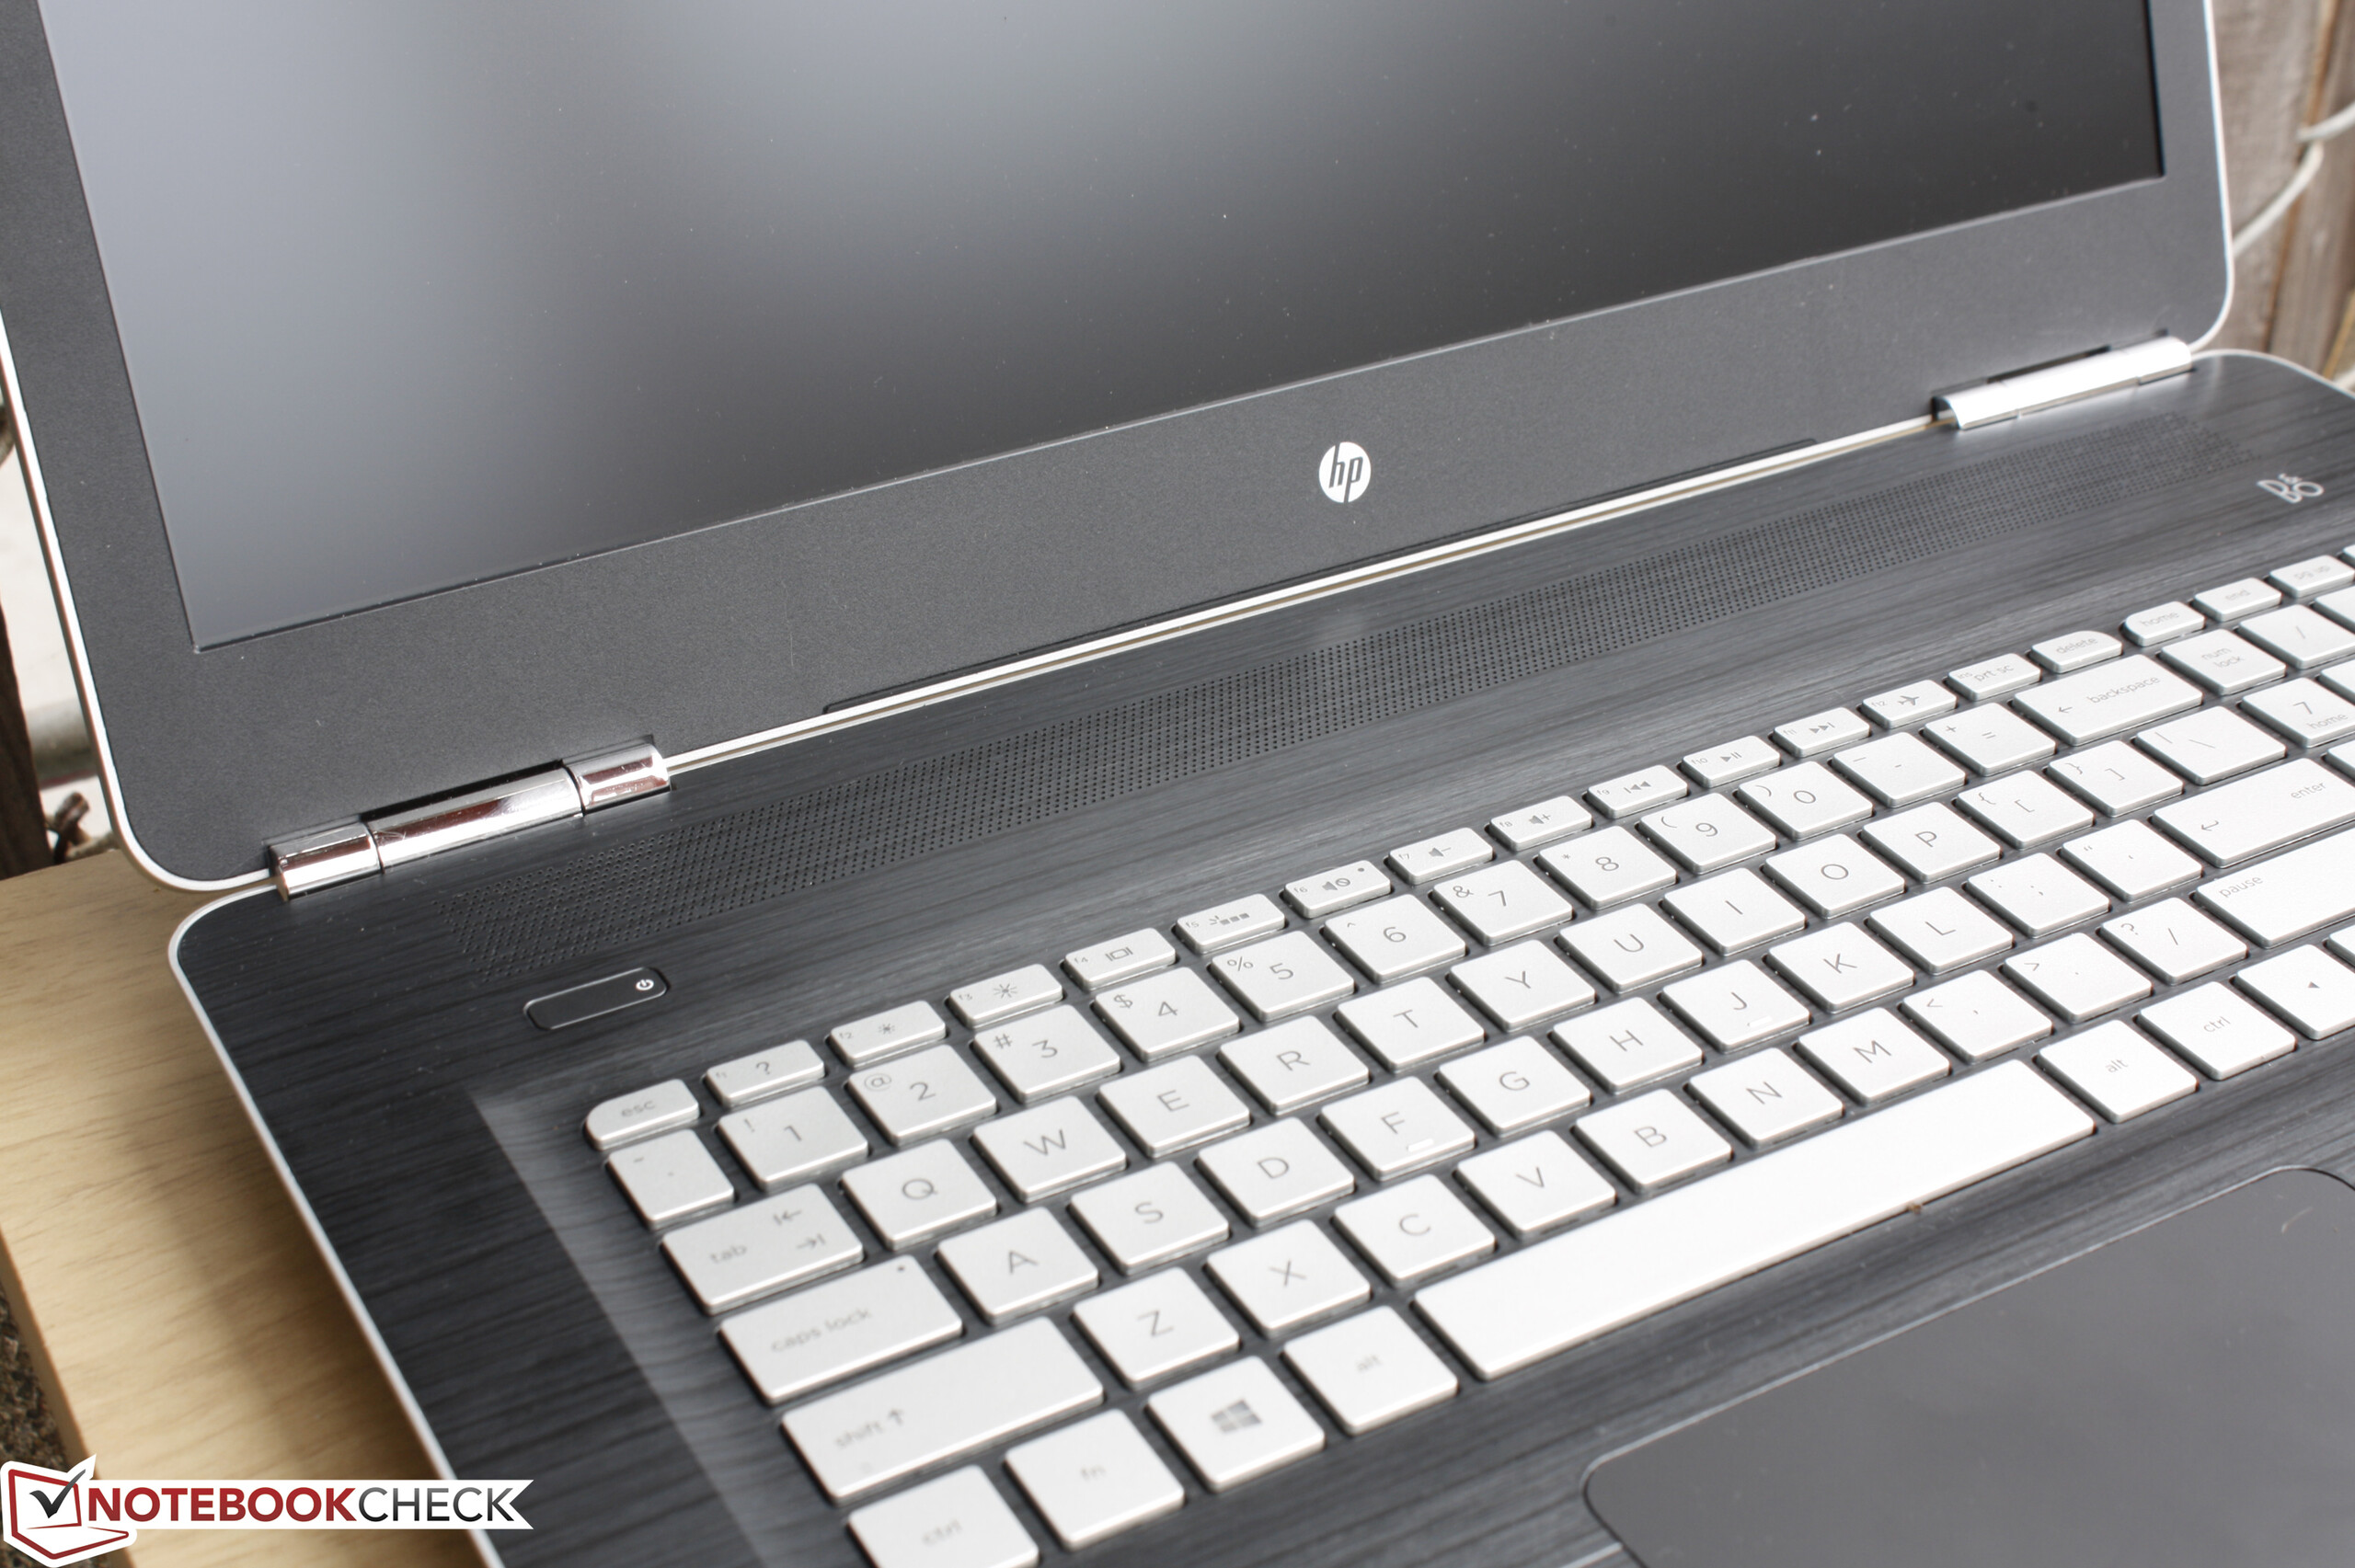
Workmanship is otherwise very good with no major gaps between materials. There is only a very small gap around the front left corner where the optical drive is not completely flush with the base as shown in the image gallery below. The hinges are rigid enough to prevent teetering when typing up to its maximum angle of about 140 degrees.

As for size and weight, our comparison diagram below shows the newer Pavilion 17 to be heavier and thicker than the lesser-equipped Pavilion 17-g120ng and its ULV CPU and GT 940M graphics. It's both smaller and significantly lighter than the Lenovo Y700 while being about the same as the MSI PE70/GE70 series in size.
Connectivity
Available interfaces are identical to that of the Pavilion 15 with the addition of an optical drive. We were hoping to see a little more especially since its larger footprint should allow for more options, though the Lenovo Y700 suffers from this same issue as well. USB Type-C, mDP, or even more USB Type-A ports would have been appreciated.


SD Card Reader
Transfer rates from the SD reader average about 74 MB/s according to AS SSD using our Toshiba Exceria Pro SDXC 64 GB UHS-II test card. This is in the range of most other mainstream notebooks including the MacBook Pro 13, though the XPS 15 9550 and other higher-end gaming notebooks are capable of over twice the read speeds.
| SD Card Reader | |
| average JPG Copy Test (av. of 3 runs) | |
| Dell XPS 13 2016 9350 (FHD, i7-6560U) | |
| Apple MacBook Pro Retina 13 inch 2013-10 | |
| Alienware 17 R3 (A17-9935) | |
| HP Pavilion 17 FHD V3A33AV | |
| maximum AS SSD Seq Read Test (1GB) | |
| Dell XPS 13 2016 9350 (FHD, i7-6560U) | |
| Alienware 17 R3 (A17-9935) | |
| HP Pavilion 17 FHD V3A33AV | |
Communication
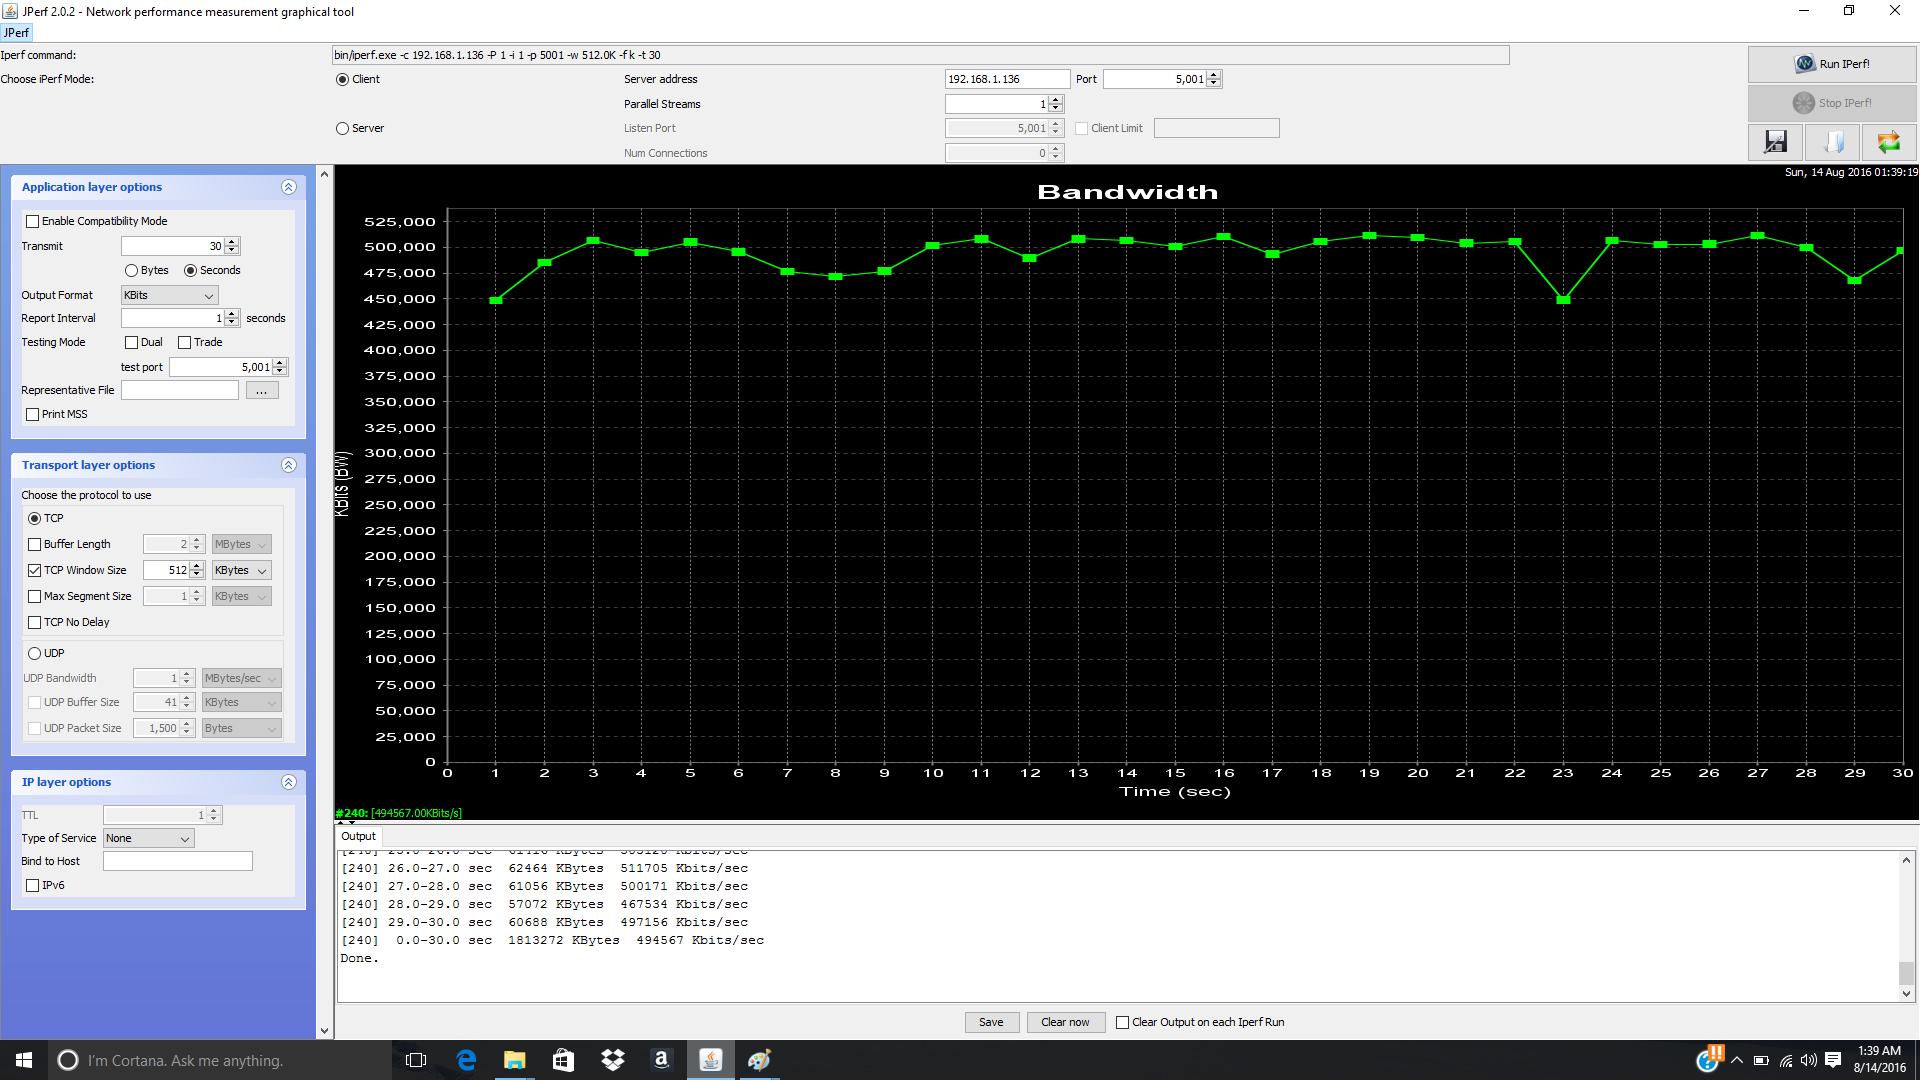
WLAN is provided by a dual-band 2x2 Intel 7265 M.2 module capable of theoretical transfer rates of up to 867 Mbps. Our real-world test standing 1 meter away from our Linksys EA8500 test router shows an average transfer rate of 495 Mbps with Jperf settings as shown below. We experienced no recurring connectivity issues with our test unit.

| Networking | |
| iperf Server (receive) TCP 1 m | |
| Dell XPS 13 2016 9350 (FHD, i7-6560U) | |
| Apple MacBook 12 (Early 2016) 1.1 GHz | |
| iperf Client (transmit) TCP 1 m | |
| Dell XPS 13 2016 9350 (FHD, i7-6560U) | |
| Apple MacBook 12 (Early 2016) 1.1 GHz | |
Accessories
There are no included extras outside of the usual small user guide and warranty card. No proprietary or specialized accessories are available for the Pavilion series either, so users will need to rely on USB docking stations for additional connectivity options.
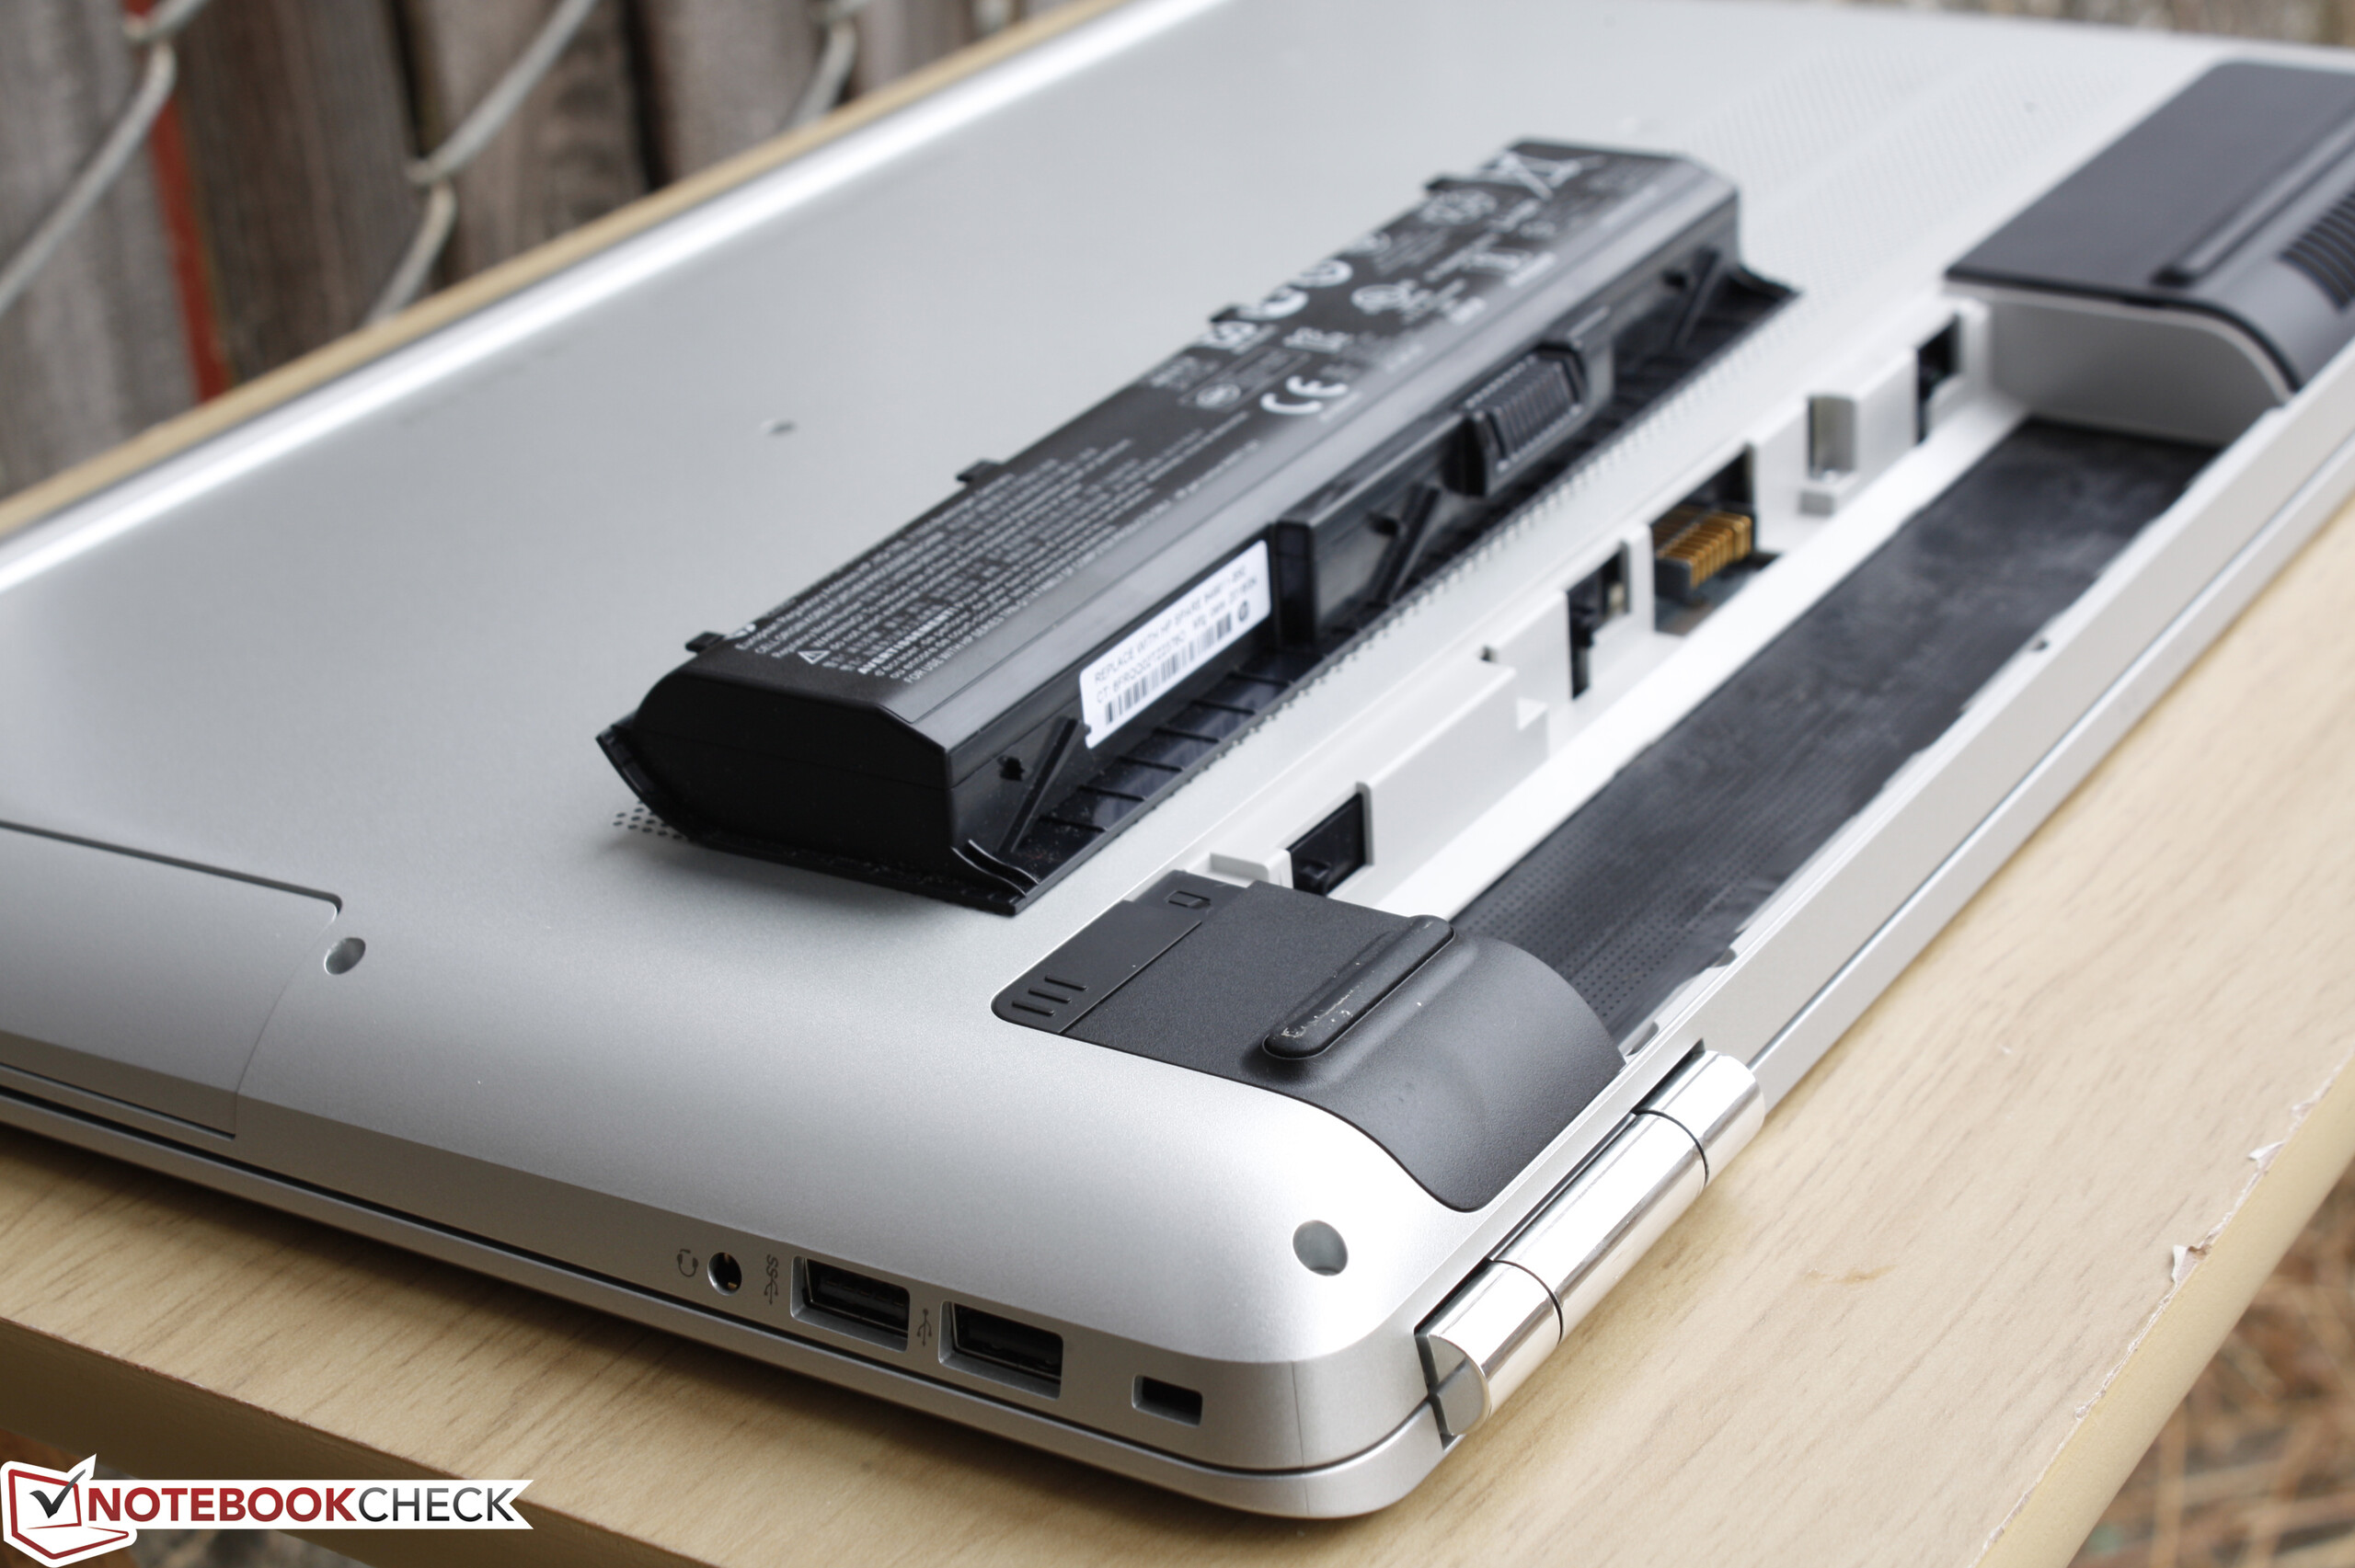
Maintenance
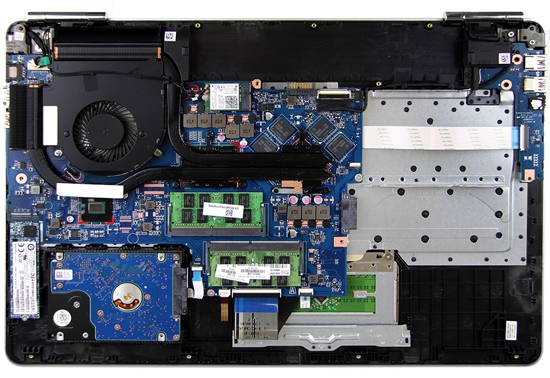
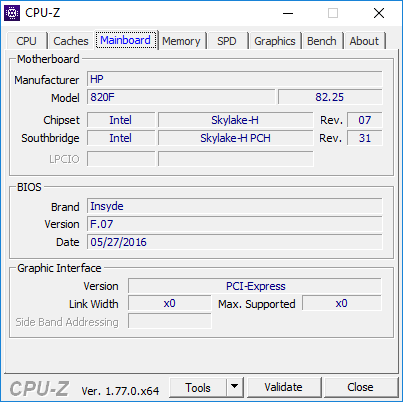
Since the Pavilion 17 shares its overall chassis design with the Pavilion 15, serviceability continues to be limited for the end user. Users must pry off the bottom base after removing at least 9 Philips screws and the optical drive. CUKUSA includes a disassembly guide for the model showing the soldered CPU and GPU, 2x SODIMM slots, and both M.2 and 2.5-inch HDD bays.
Warranty
The standard one-year limited warranty applies from the manufacturer with options to extend up to three years including accidental damage protection. CUKUSA covers any components installed by the retailer for up to three years including hard drives and RAM.
Input Devices
Keyboard & Touchpad
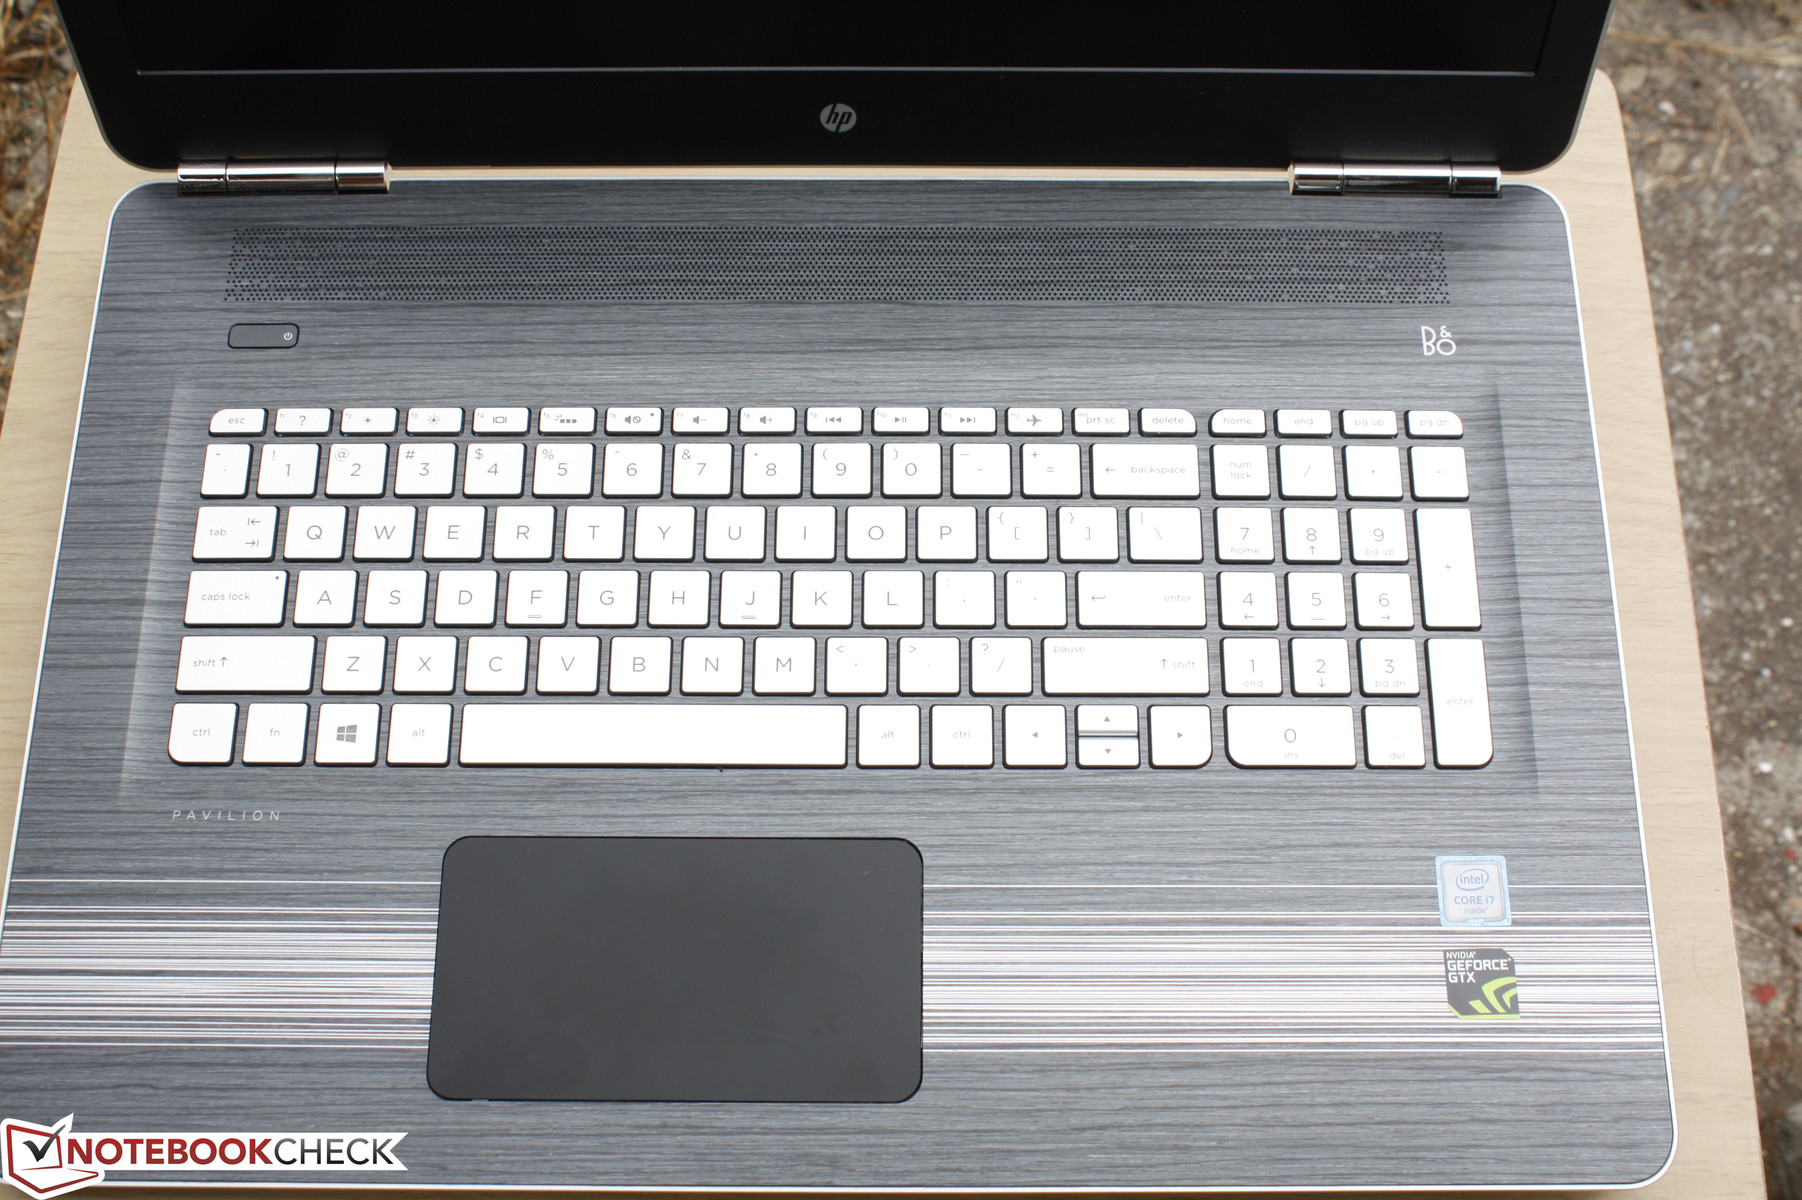
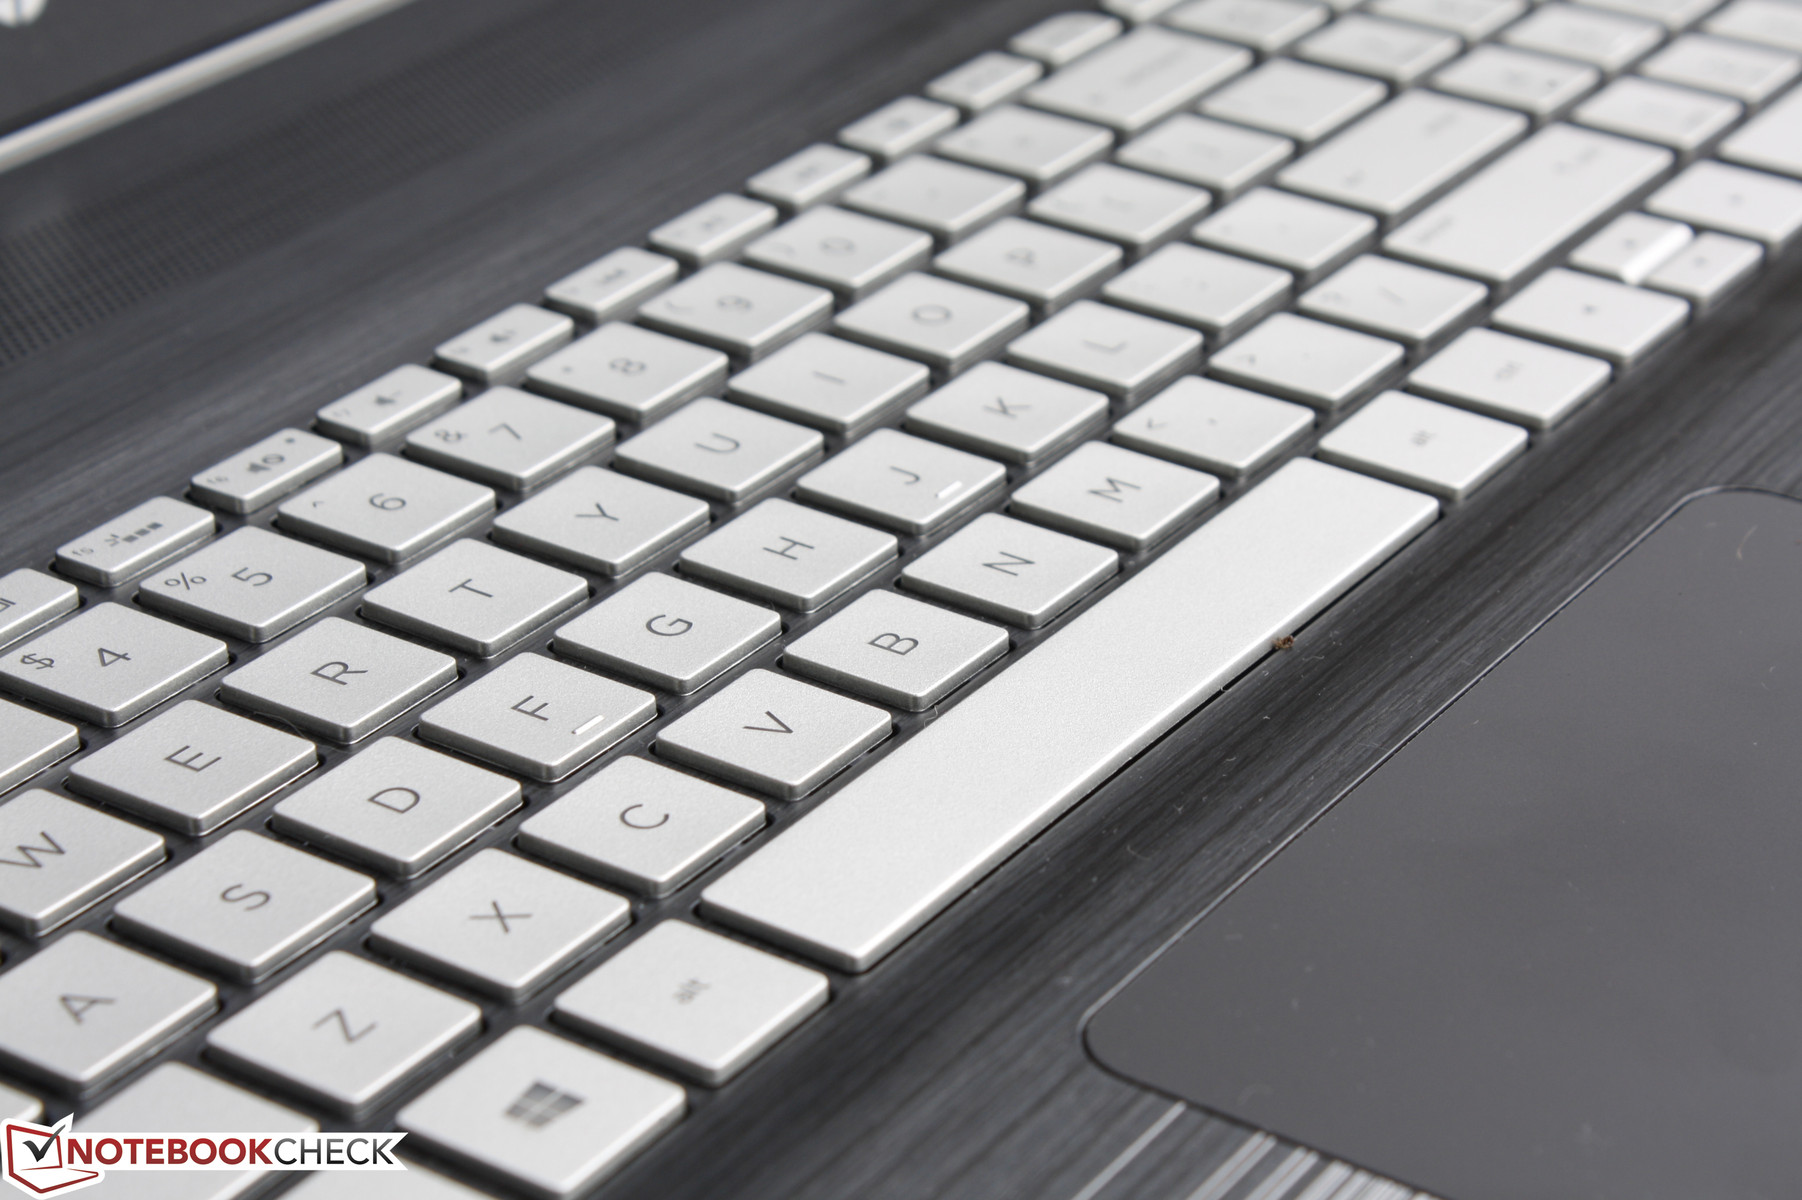
Both the keyboard (34.25 x10 cm) and touchpad (12.0 x 6.5 cm) are essentially identical to the ones on the Pavilion 15 down to their sizes and feedback. The keys are very light with shallow travel that should feel instantly familiar to anyone who has used an Ultrabook. The Up and Down arrow keys are unfortunately very small and hard to use accurately. Empty space is plentiful surrounding the keyboard, so extras such as auxiliary keys, Macro keys, or full-size Arrow keys would have been appreciated especially for a gaming notebook. Like on most consumer notebooks from HP, the white backlight is available in only one brightness level.
We found the touchpad to be very poor on the Pavilion 15 and this continues to be true on the Pavilion 17. Feedback is too soft and spongy to be comfortable to use for long periods. The smooth surface itself is otherwise adequate for simple cursor control and the Synaptics controller is able to recognize up to three-finger inputs without any major issues.
Display
Our configuration uses the matte WLED-backlit 1080p display while higher-end SKUs have 1080p touchscreen options and matte 4K UHD. Our measurements below reflect only the 1080p option as the 4K panel is very likely to be different in terms of contrast, response times, and colors.
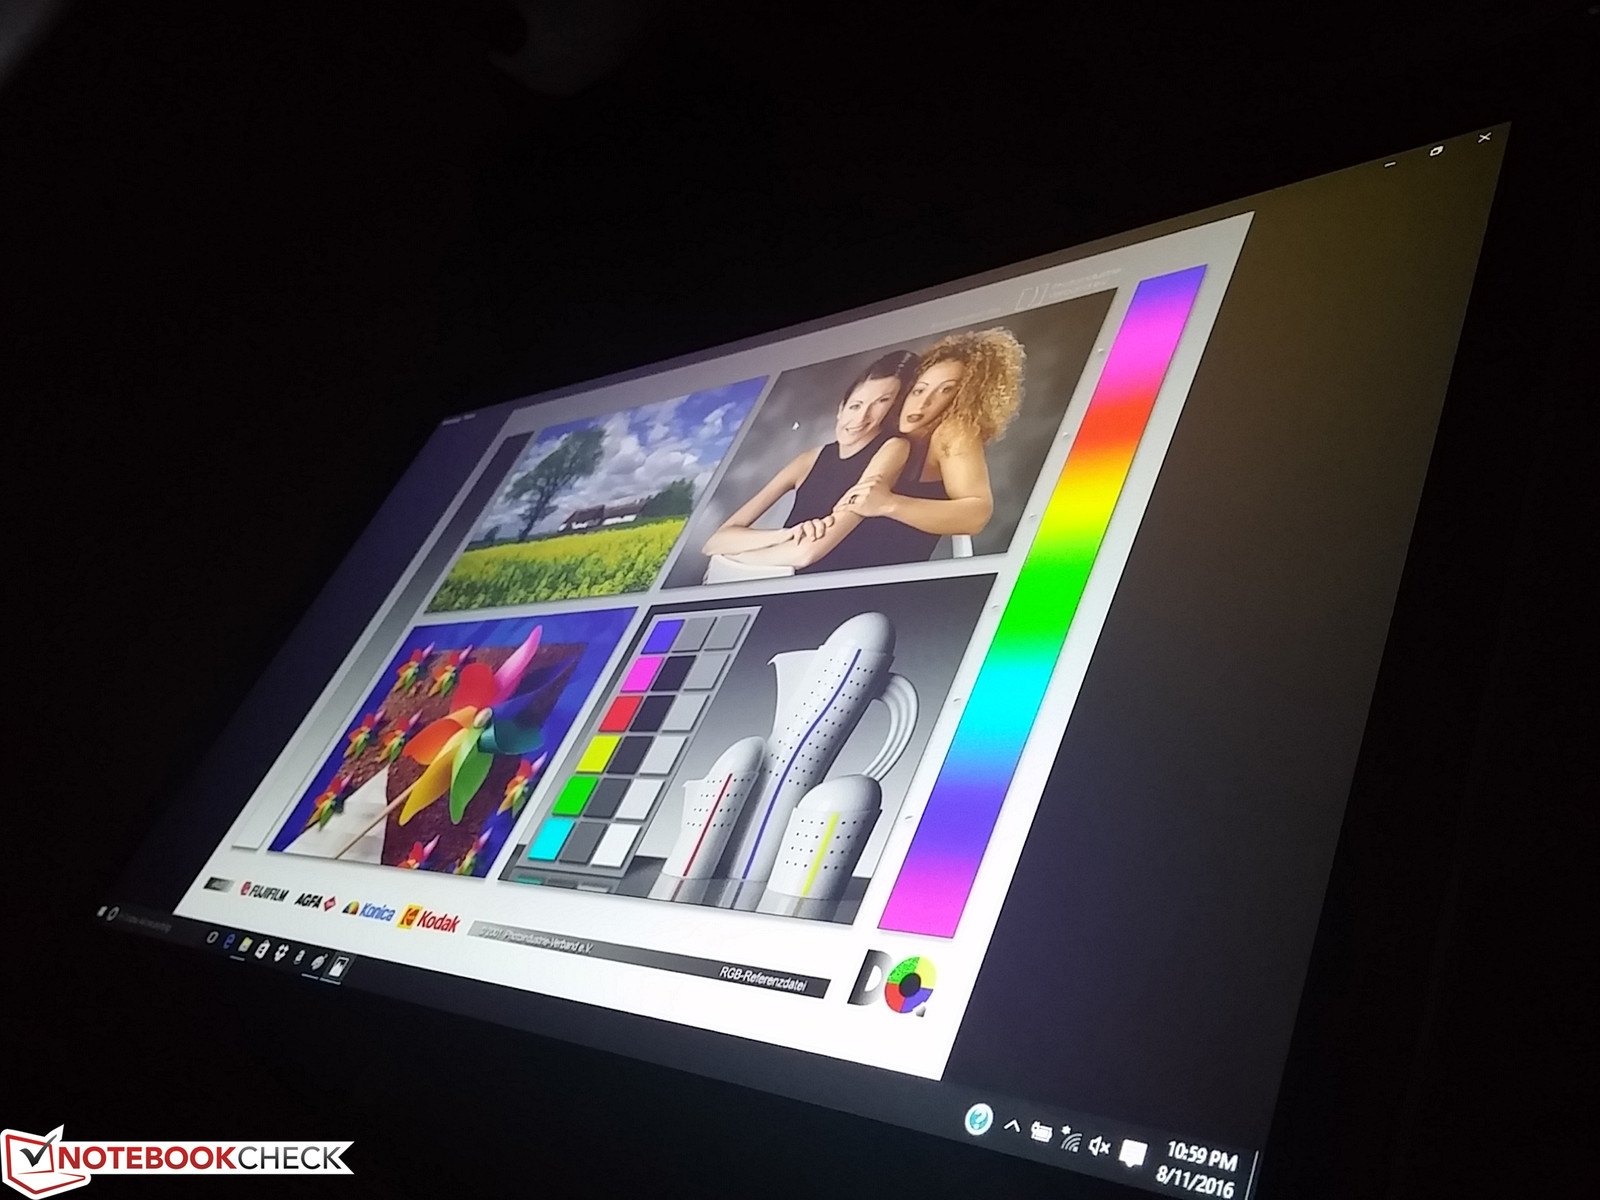
Subjectively, the 1080p screen is crisp and without any major issues. It does, however, suffer from some graininess that becomes obvious when displaying bright white colors. The recently reviewed Asus G701VO, for example, does not suffer from this problem for its own 1080p matte display. Brightness and contrast are otherwise very good at about 300 nits and 1100:1, respectively. A quick search for its AU Optronics B173HW01 panel shows that the HP ProBook 470 G3 also uses a very similar display as the one on our Pavilion 17.
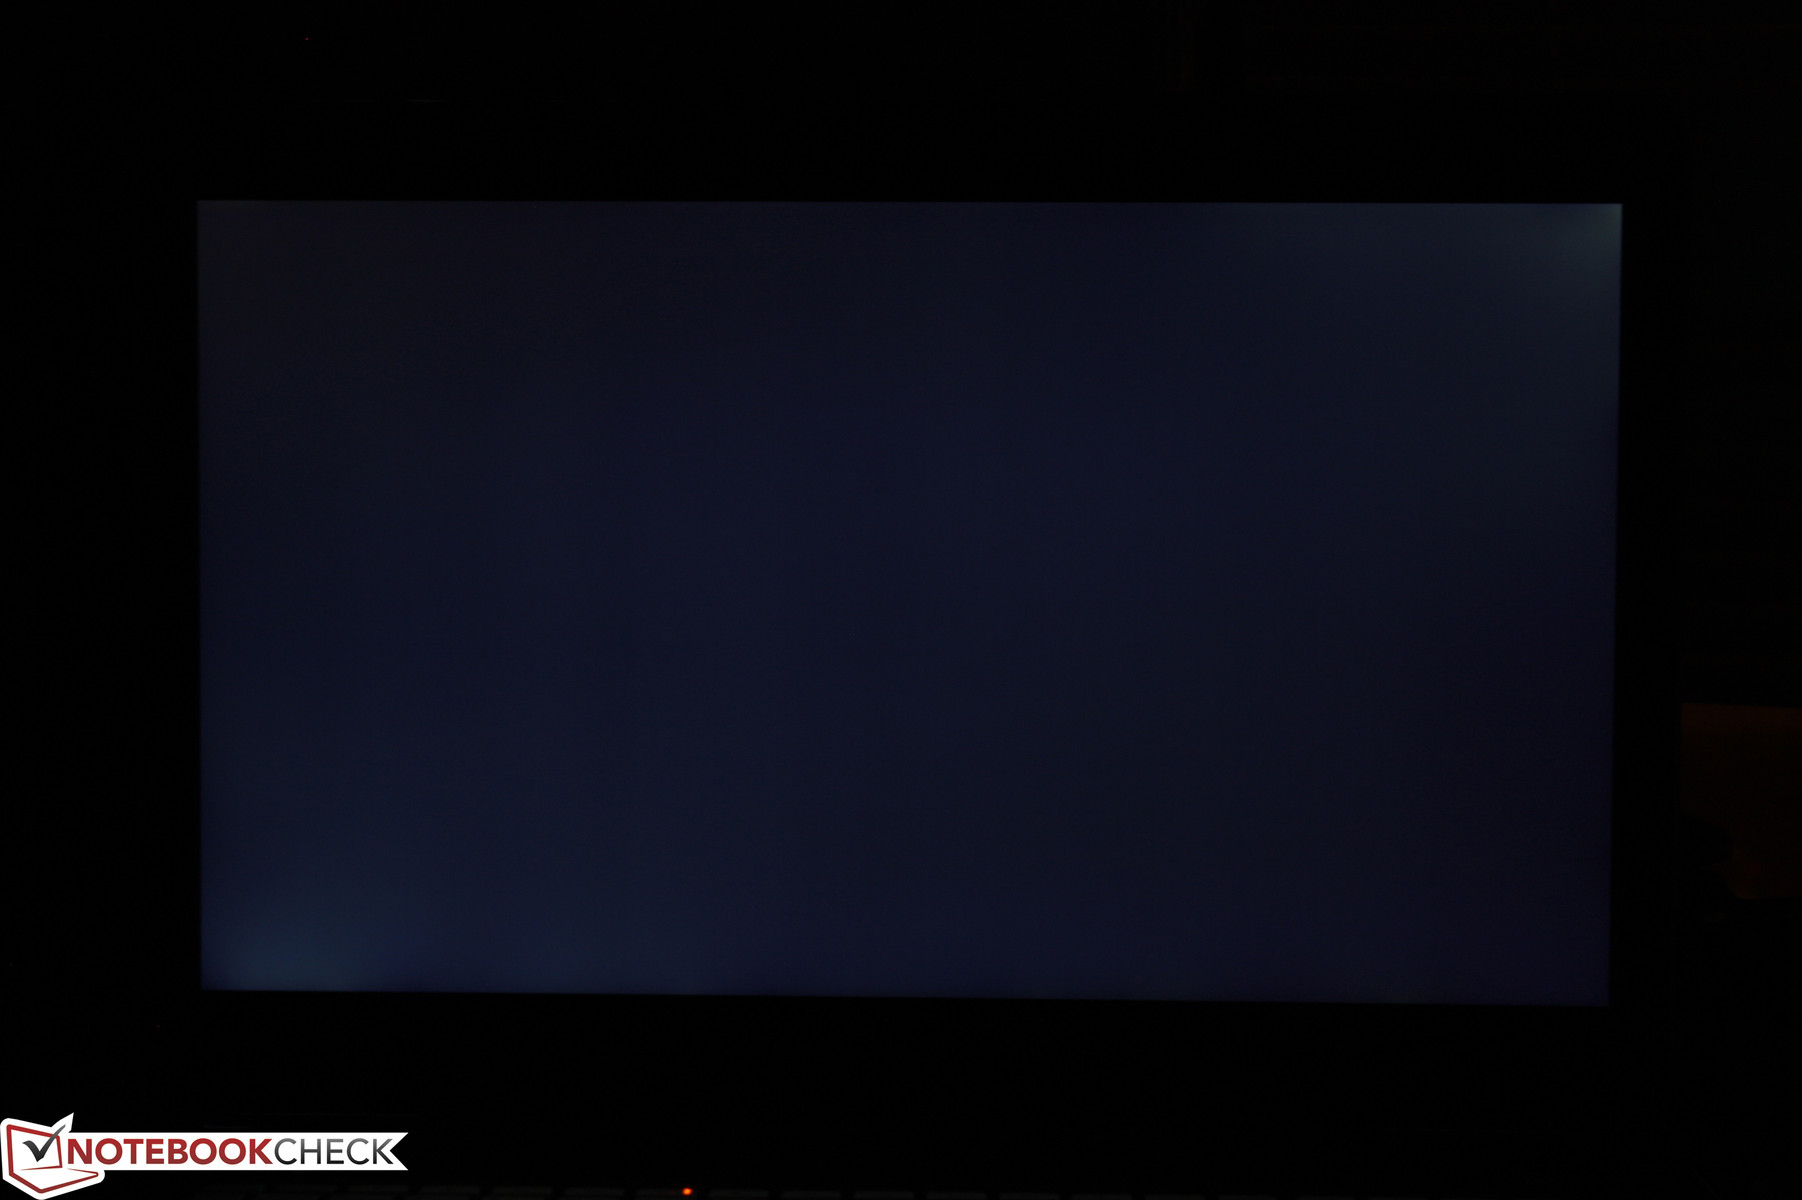
Backlight bleeding is minimal around the bottom left and top right corners and is only barely noticeable during movie playback with black borders.
| |||||||||||||||||||||||||
Brightness Distribution: 86 %
Center on Battery: 327.2 cd/m²
Contrast: 1128:1 (Black: 0.29 cd/m²)
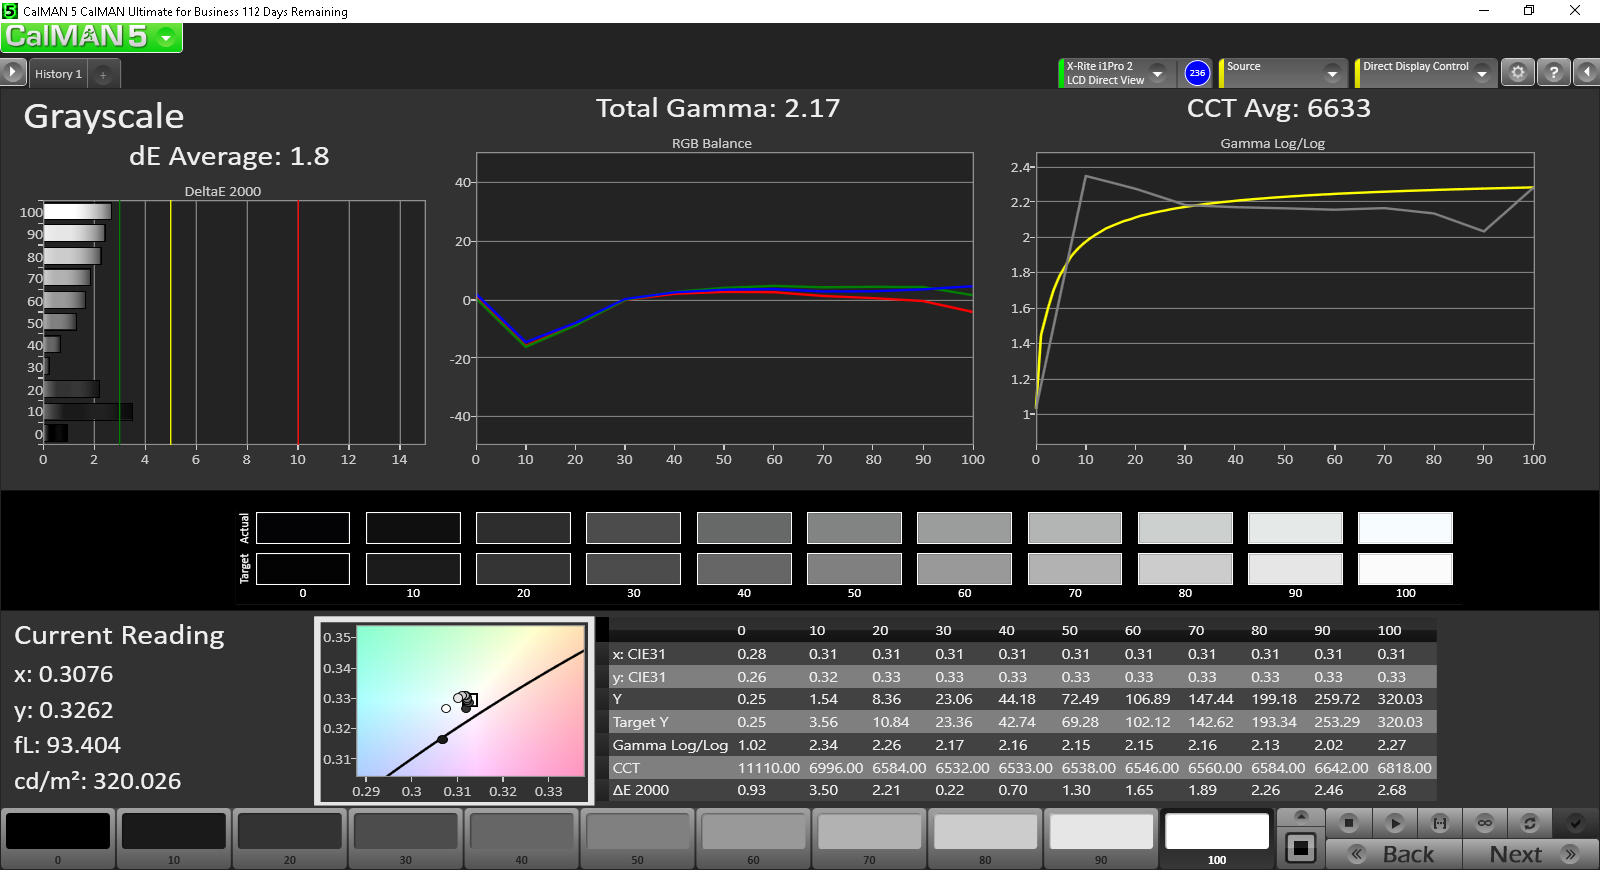
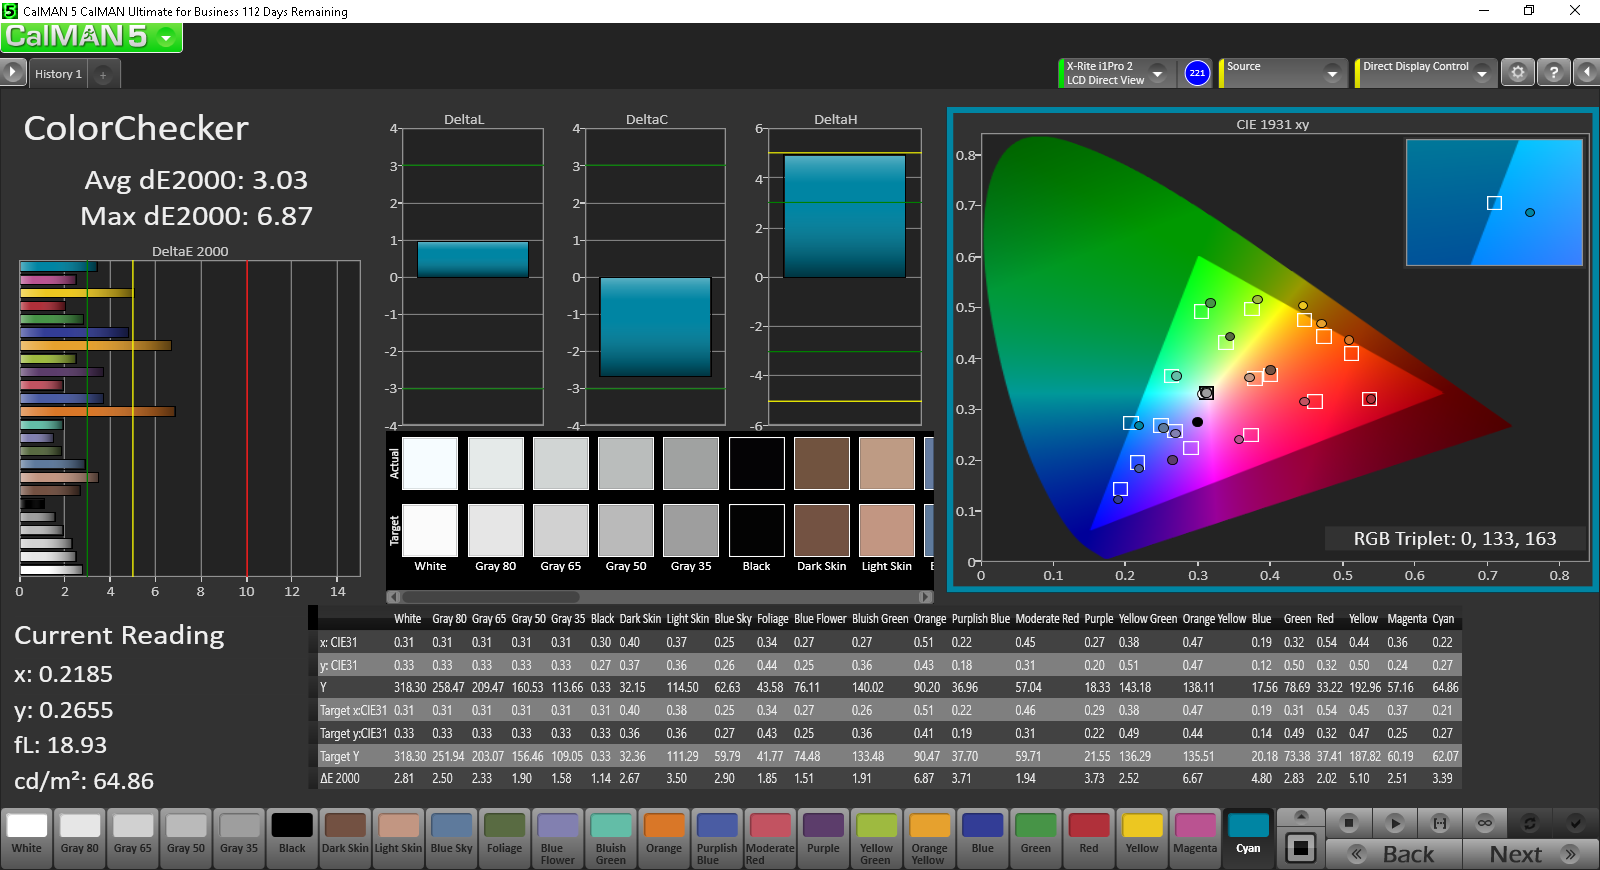
ΔE ColorChecker Calman: 3.03 | ∀{0.5-29.43 Ø4.76}
ΔE Greyscale Calman: 1.8 | ∀{0.09-98 Ø5}
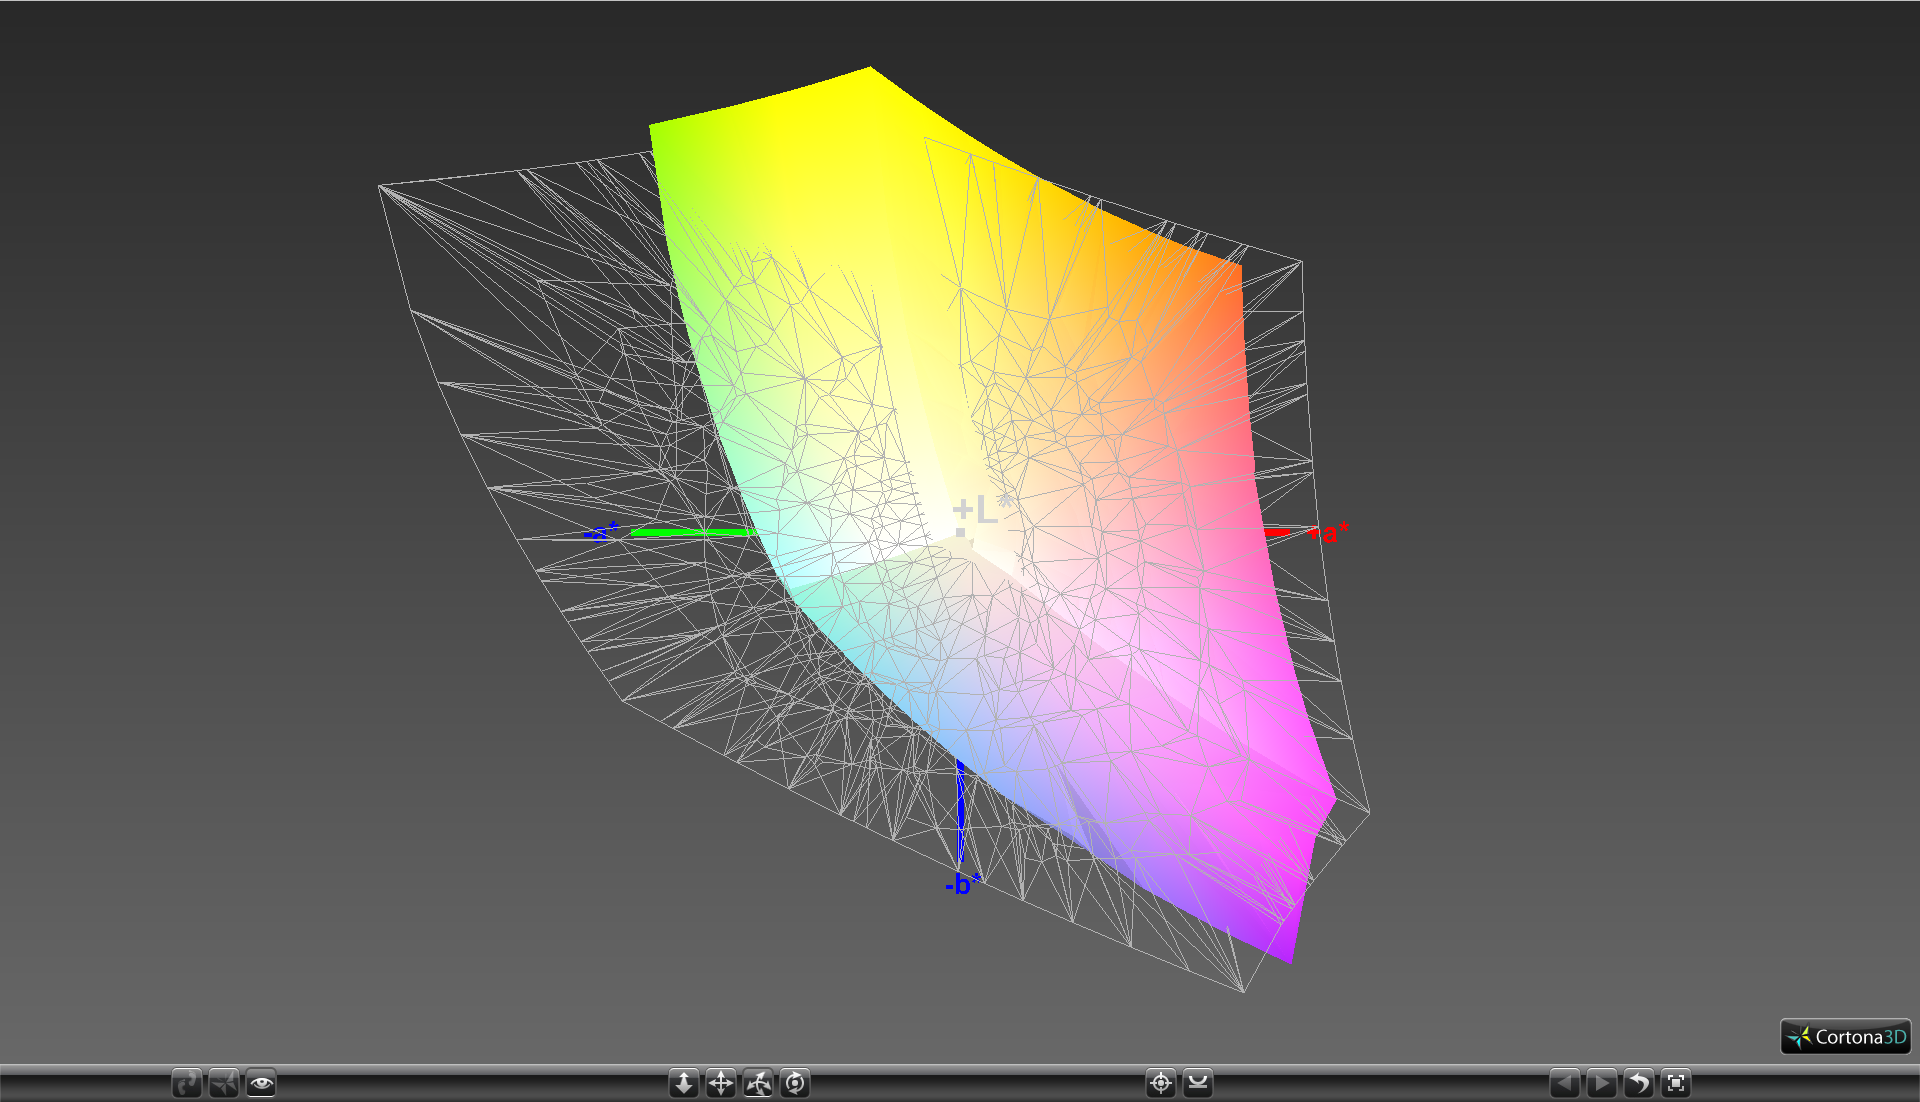
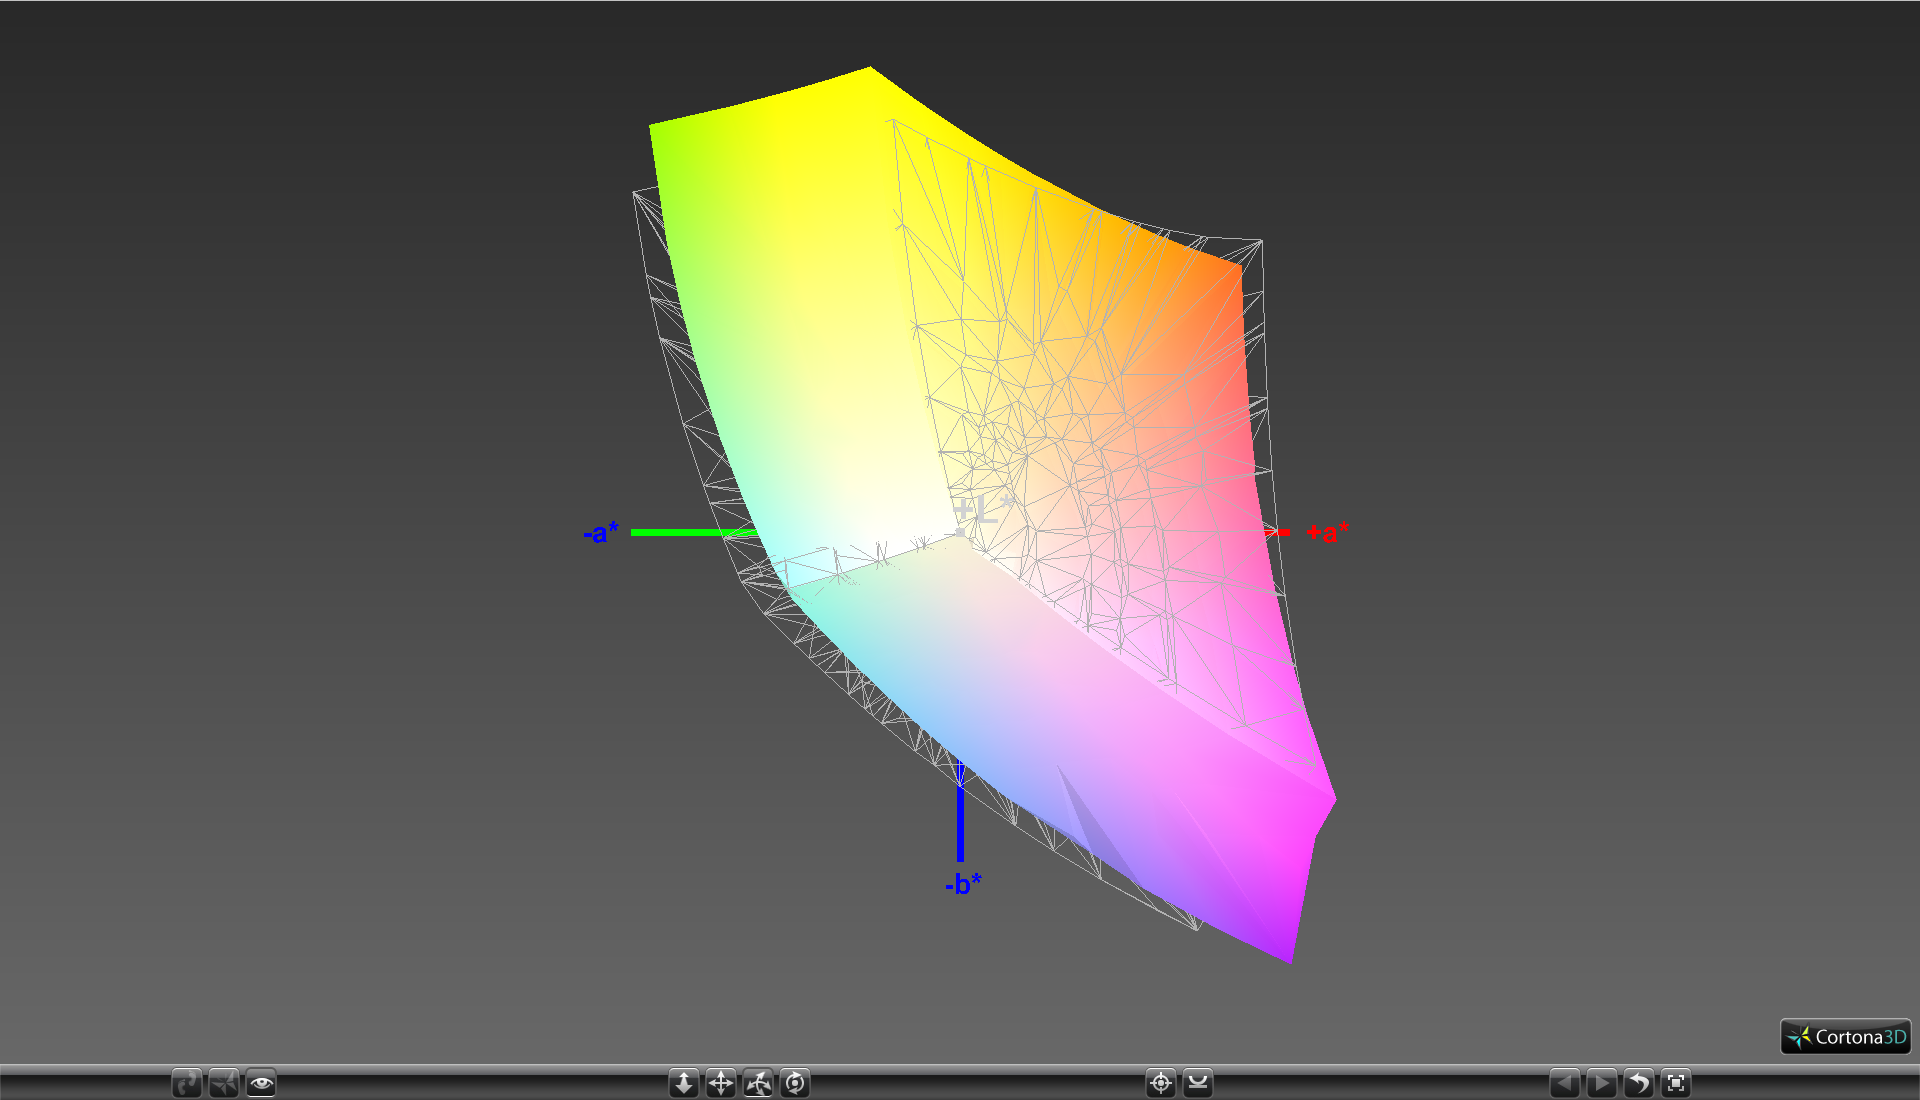
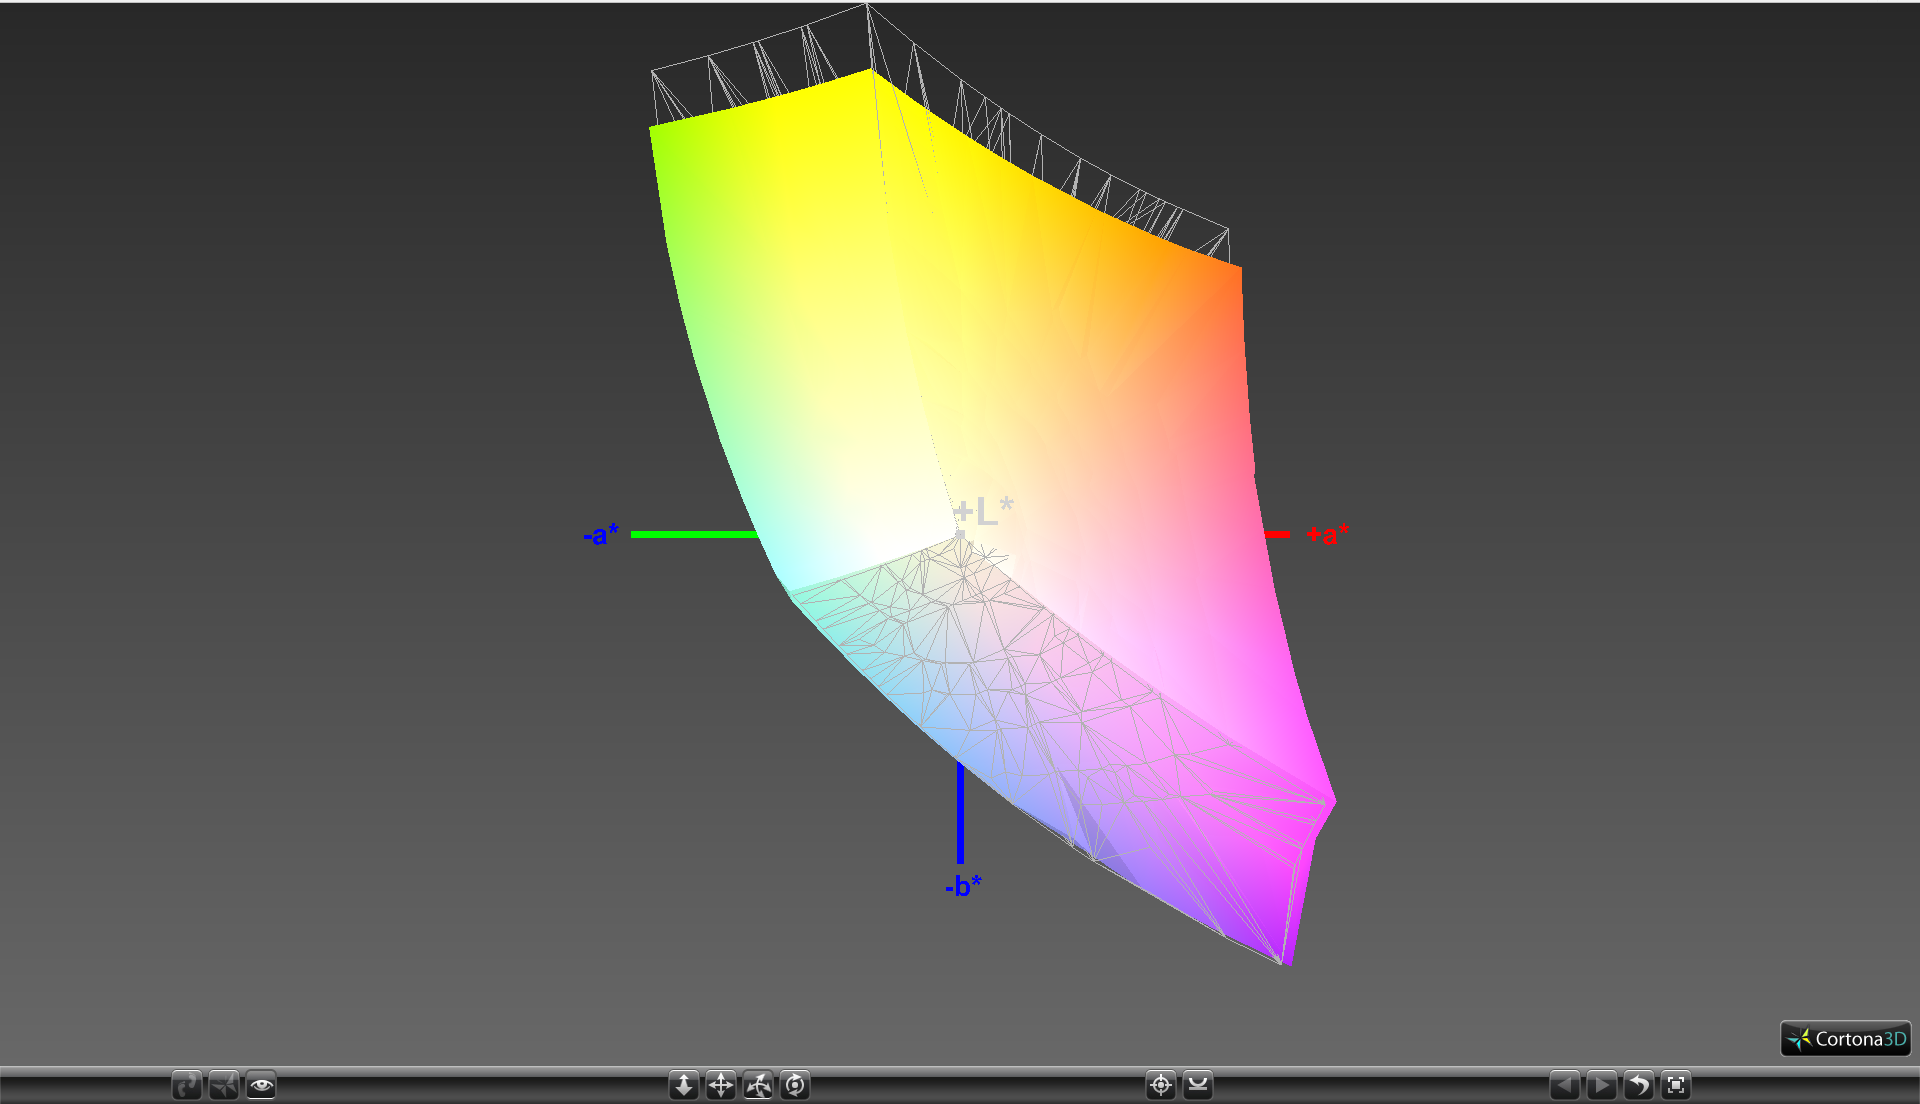
87.6% sRGB (Argyll 1.6.3 3D)
57.2% AdobeRGB 1998 (Argyll 1.6.3 3D)
64.4% AdobeRGB 1998 (Argyll 3D)
88.1% sRGB (Argyll 3D)
64.3% Display P3 (Argyll 3D)
Gamma: 2.17
CCT: 6633 K
| HP Pavilion 17 FHD V3A33AV IPS, 17.3", 1920x1080 | Lenovo Ideapad Y700 17ISK 80Q0 IPS, 17.3", 1920x1080 | HP Pavilion 17-g120ng Samsung_SDC3854, IPS, 17.3", 1920x1080 | Gigabyte P57W LG Philips LP173WF4-SPF1 (LGD0469), IPS, 17.3", 1920x1080 | Asus ZenBook Pro UX501VW-DS71T IPS, 15.6", 3840x2160 | |
|---|---|---|---|---|---|
| Display | -1% | 6% | -2% | 1% | |
| Display P3 Coverage (%) | 64.3 | 67.4 5% | 65.7 2% | 66.5 3% | 64.3 0% |
| sRGB Coverage (%) | 88.1 | 84.8 -4% | 97.6 11% | 84.4 -4% | 89.9 2% |
| AdobeRGB 1998 Coverage (%) | 64.4 | 62 -4% | 67.7 5% | 61.7 -4% | 65.4 2% |
| Response Times | -42% | -91% | -1% | -16% | |
| Response Time Grey 50% / Grey 80% * (ms) | 31.2 ? | 51.6 ? -65% | 70 ? -124% | 37 ? -19% | 43.2 ? -38% |
| Response Time Black / White * (ms) | 29.2 ? | 34.4 ? -18% | 46 ? -58% | 24 ? 18% | 27.2 ? 7% |
| PWM Frequency (Hz) | 200 ? | ||||
| Screen | -13% | -27% | -28% | -53% | |
| Brightness middle (cd/m²) | 327.2 | 349.7 7% | 309 -6% | 286 -13% | 252.9 -23% |
| Brightness (cd/m²) | 297 | 332 12% | 292 -2% | 274 -8% | 250 -16% |
| Brightness Distribution (%) | 86 | 90 5% | 86 0% | 87 1% | 89 3% |
| Black Level * (cd/m²) | 0.29 | 0.304 -5% | 0.27 7% | 0.31 -7% | 0.5 -72% |
| Contrast (:1) | 1128 | 1150 2% | 1144 1% | 923 -18% | 506 -55% |
| Colorchecker dE 2000 * | 3.03 | 3.99 -32% | 4.53 -50% | 4.49 -48% | 5.22 -72% |
| Colorchecker dE 2000 max. * | 6.87 | 8.74 -27% | 7.83 -14% | 8.33 -21% | |
| Greyscale dE 2000 * | 1.8 | 3.34 -86% | 5.66 -214% | 4.76 -164% | 6.74 -274% |
| Gamma | 2.17 101% | 2.23 99% | 2.62 84% | 2.47 89% | 2.45 90% |
| CCT | 6633 98% | 6111 106% | 7893 82% | 6843 95% | 6026 108% |
| Color Space (Percent of AdobeRGB 1998) (%) | 57.2 | 55.8 -2% | 62 8% | 55 -4% | 58.4 2% |
| Color Space (Percent of sRGB) (%) | 87.6 | 84.8 -3% | 98 12% | 84 -4% | 89.7 2% |
| Total Average (Program / Settings) | -19% /
-14% | -37% /
-29% | -10% /
-19% | -23% /
-37% |
* ... smaller is better
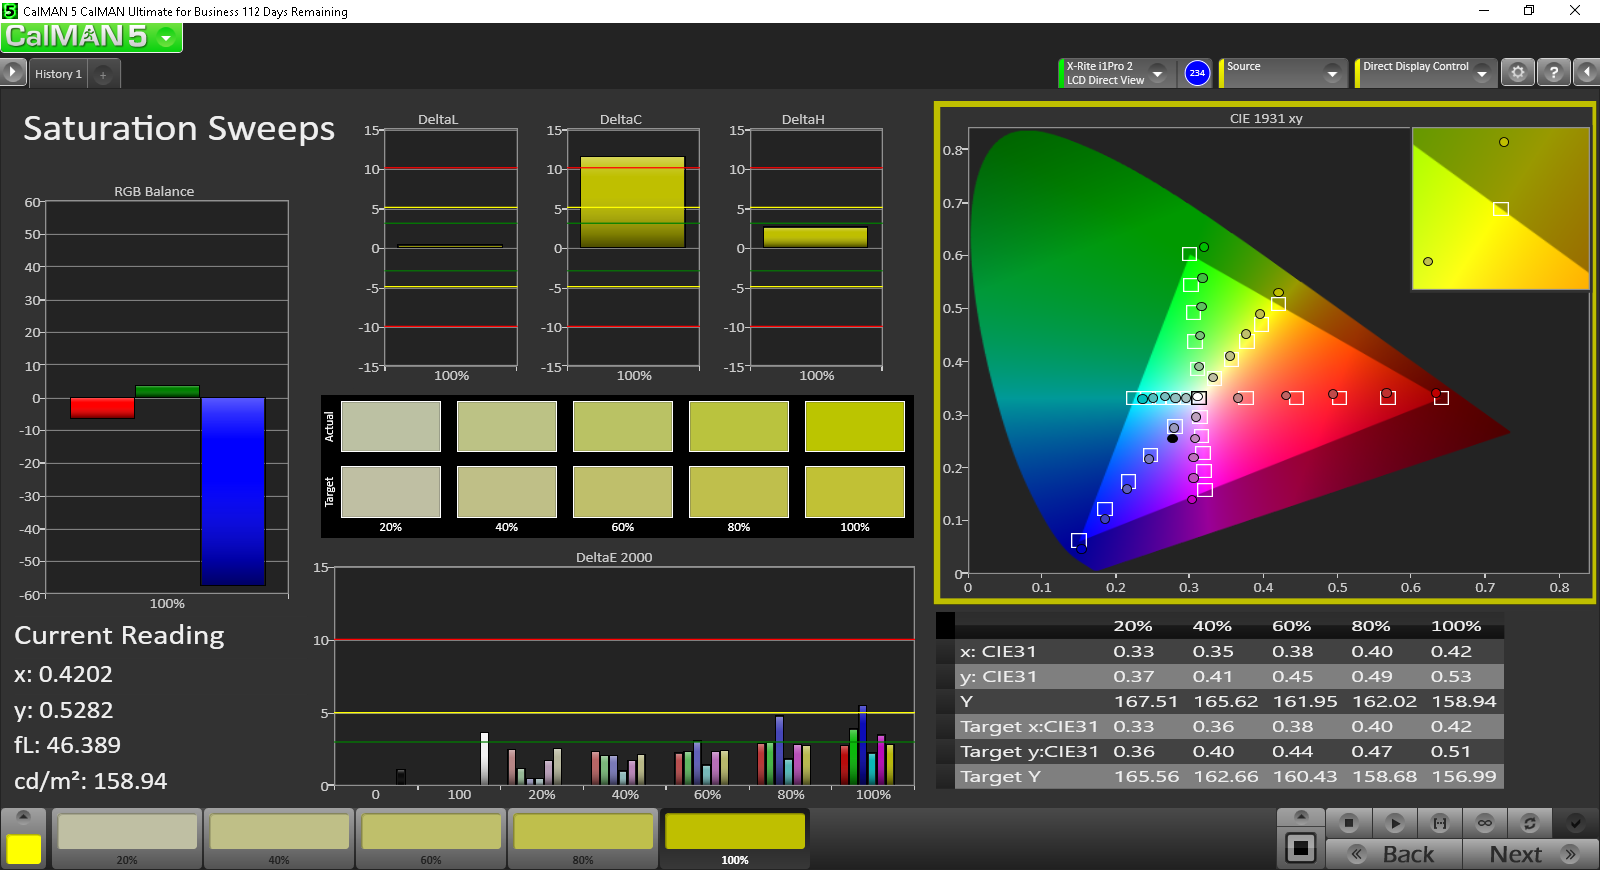
The panel covers approximately 57 percent and 88 percent of the AdobeRGB and sRGB standards, respectively. This is indicative of a quality panel, though it's worth mentioning that a number of other gaming notebooks offer even wider color gamuts for potentially richer colors including the older Pavilion 17 and its near 100 percent sRGB coverage. For gaming purposes, however, color accuracy is not a large concern.

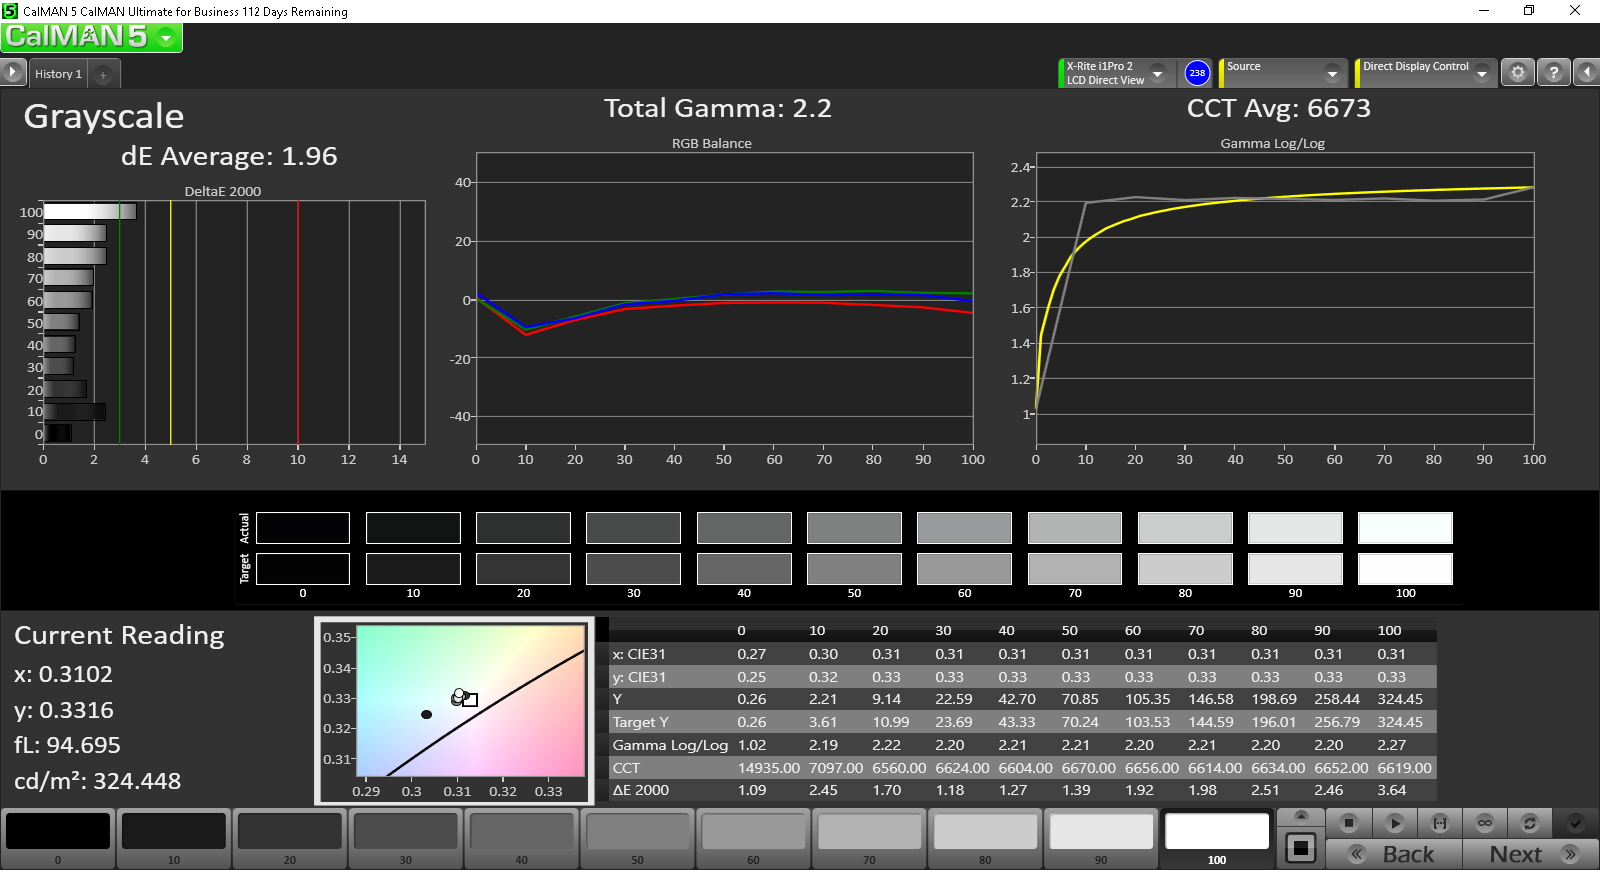
Further measurements with an X-Rite spectrophotometer reveal very good grayscale and colors out-of-the-box. A quick calibration results in only minor improvements and is not entirely necessary. Colors are shown to become slightly more inaccurate at higher saturation levels due to the imperfect sRGB coverage.


Display Response Times
| ↔ Response Time Black to White | ||
|---|---|---|
| 29.2 ms ... rise ↗ and fall ↘ combined | ↗ 6 ms rise | 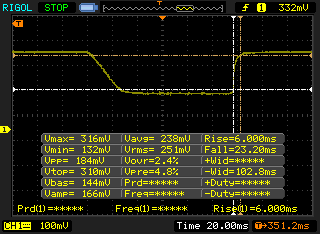 |
| ↘ 23.2 ms fall | ||
| The screen shows relatively slow response rates in our tests and may be too slow for gamers. In comparison, all tested devices range from 0.1 (minimum) to 240 (maximum) ms. » 77 % of all devices are better. This means that the measured response time is worse than the average of all tested devices (20.1 ms). | ||
| ↔ Response Time 50% Grey to 80% Grey | ||
| 31.2 ms ... rise ↗ and fall ↘ combined | ↗ 15.2 ms rise | 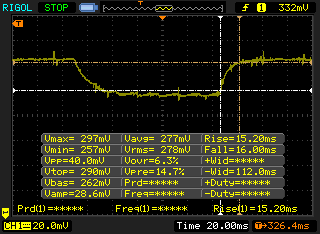 |
| ↘ 16 ms fall | ||
| The screen shows slow response rates in our tests and will be unsatisfactory for gamers. In comparison, all tested devices range from 0.165 (minimum) to 636 (maximum) ms. » 41 % of all devices are better. This means that the measured response time is similar to the average of all tested devices (31.4 ms). | ||
Screen Flickering / PWM (Pulse-Width Modulation)
| Screen flickering / PWM not detected | 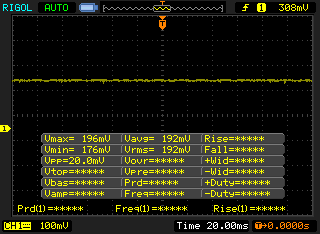 | ||
In comparison: 53 % of all tested devices do not use PWM to dim the display. If PWM was detected, an average of 8013 (minimum: 5 - maximum: 343500) Hz was measured. | |||
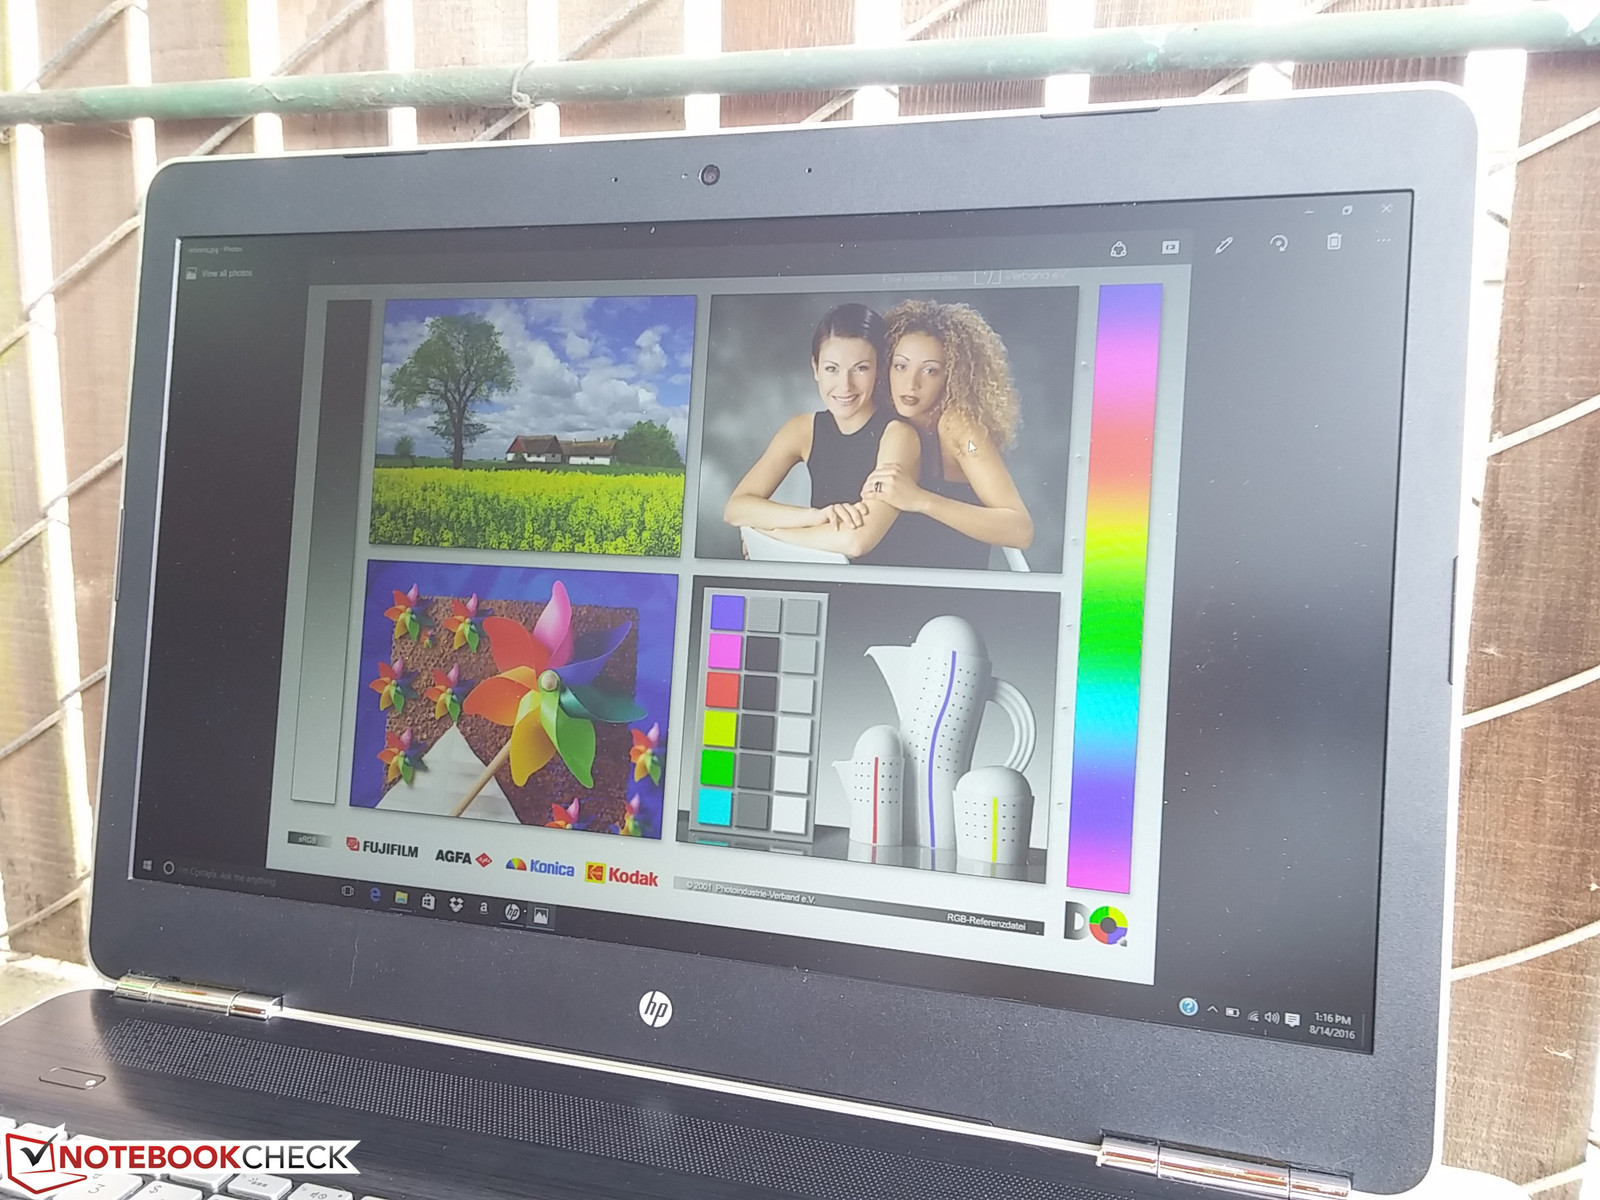
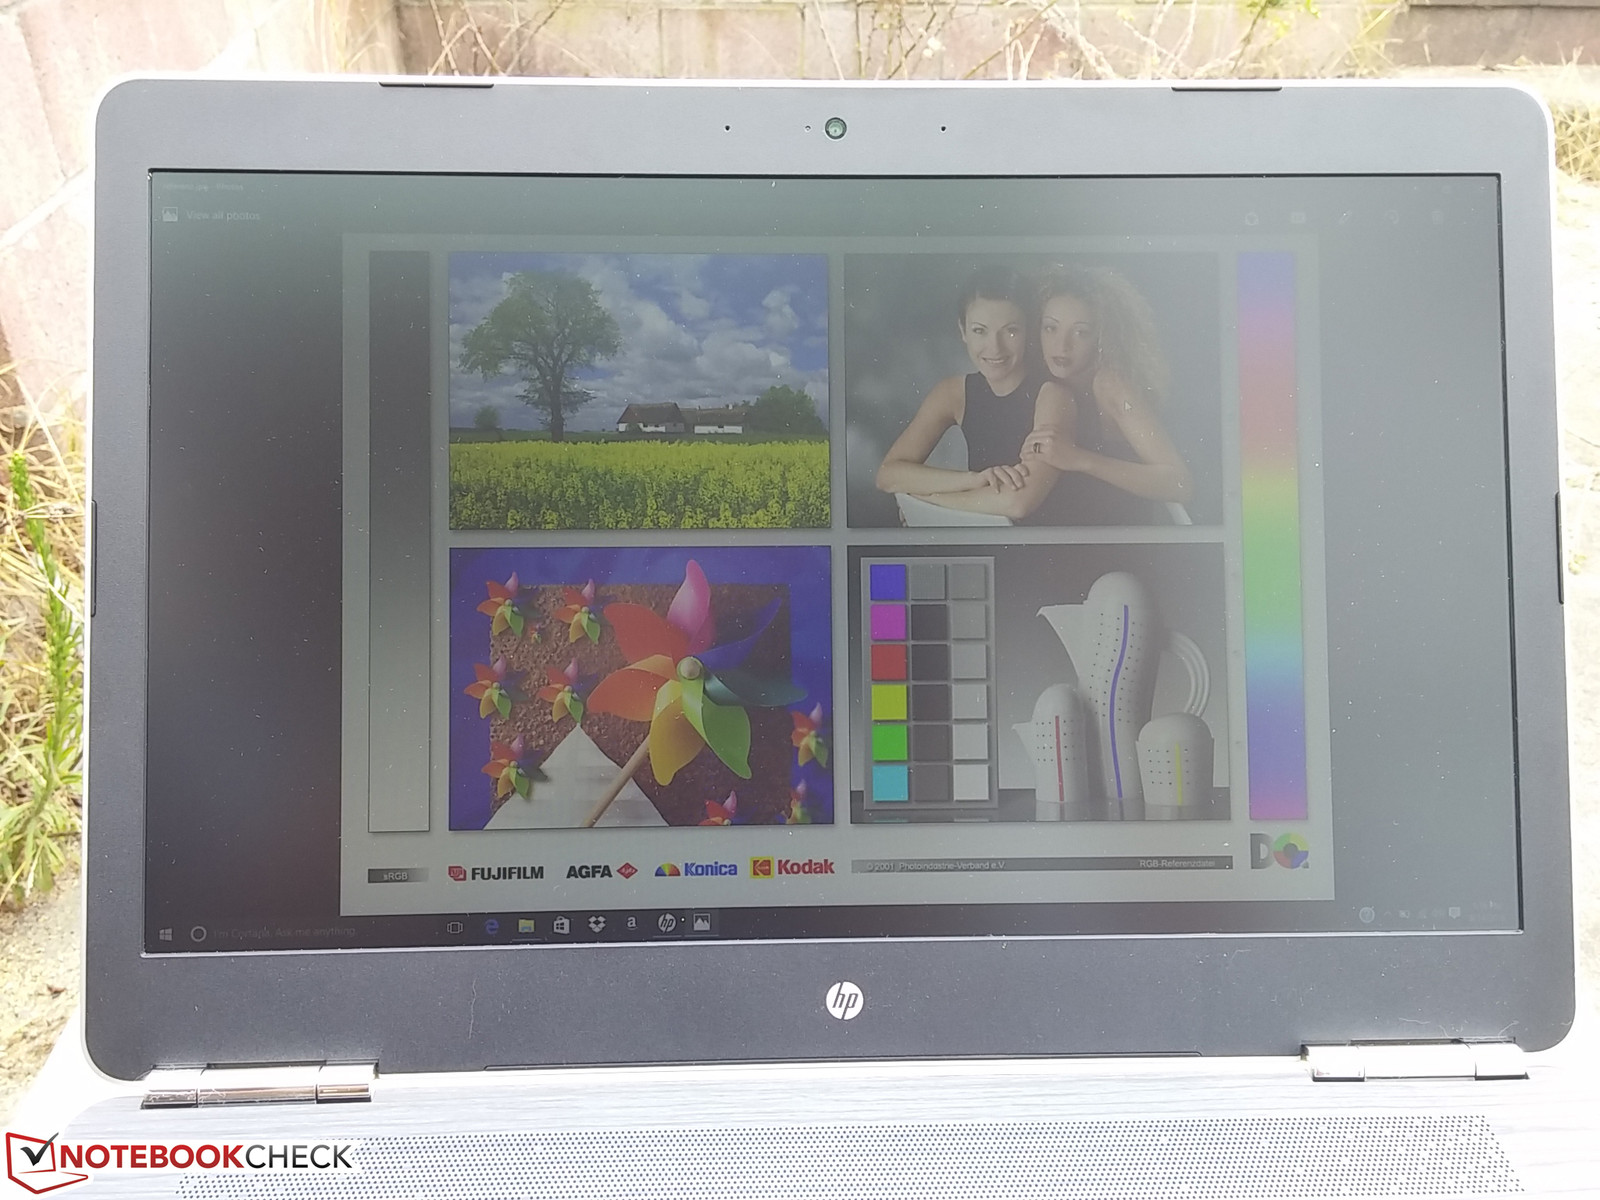
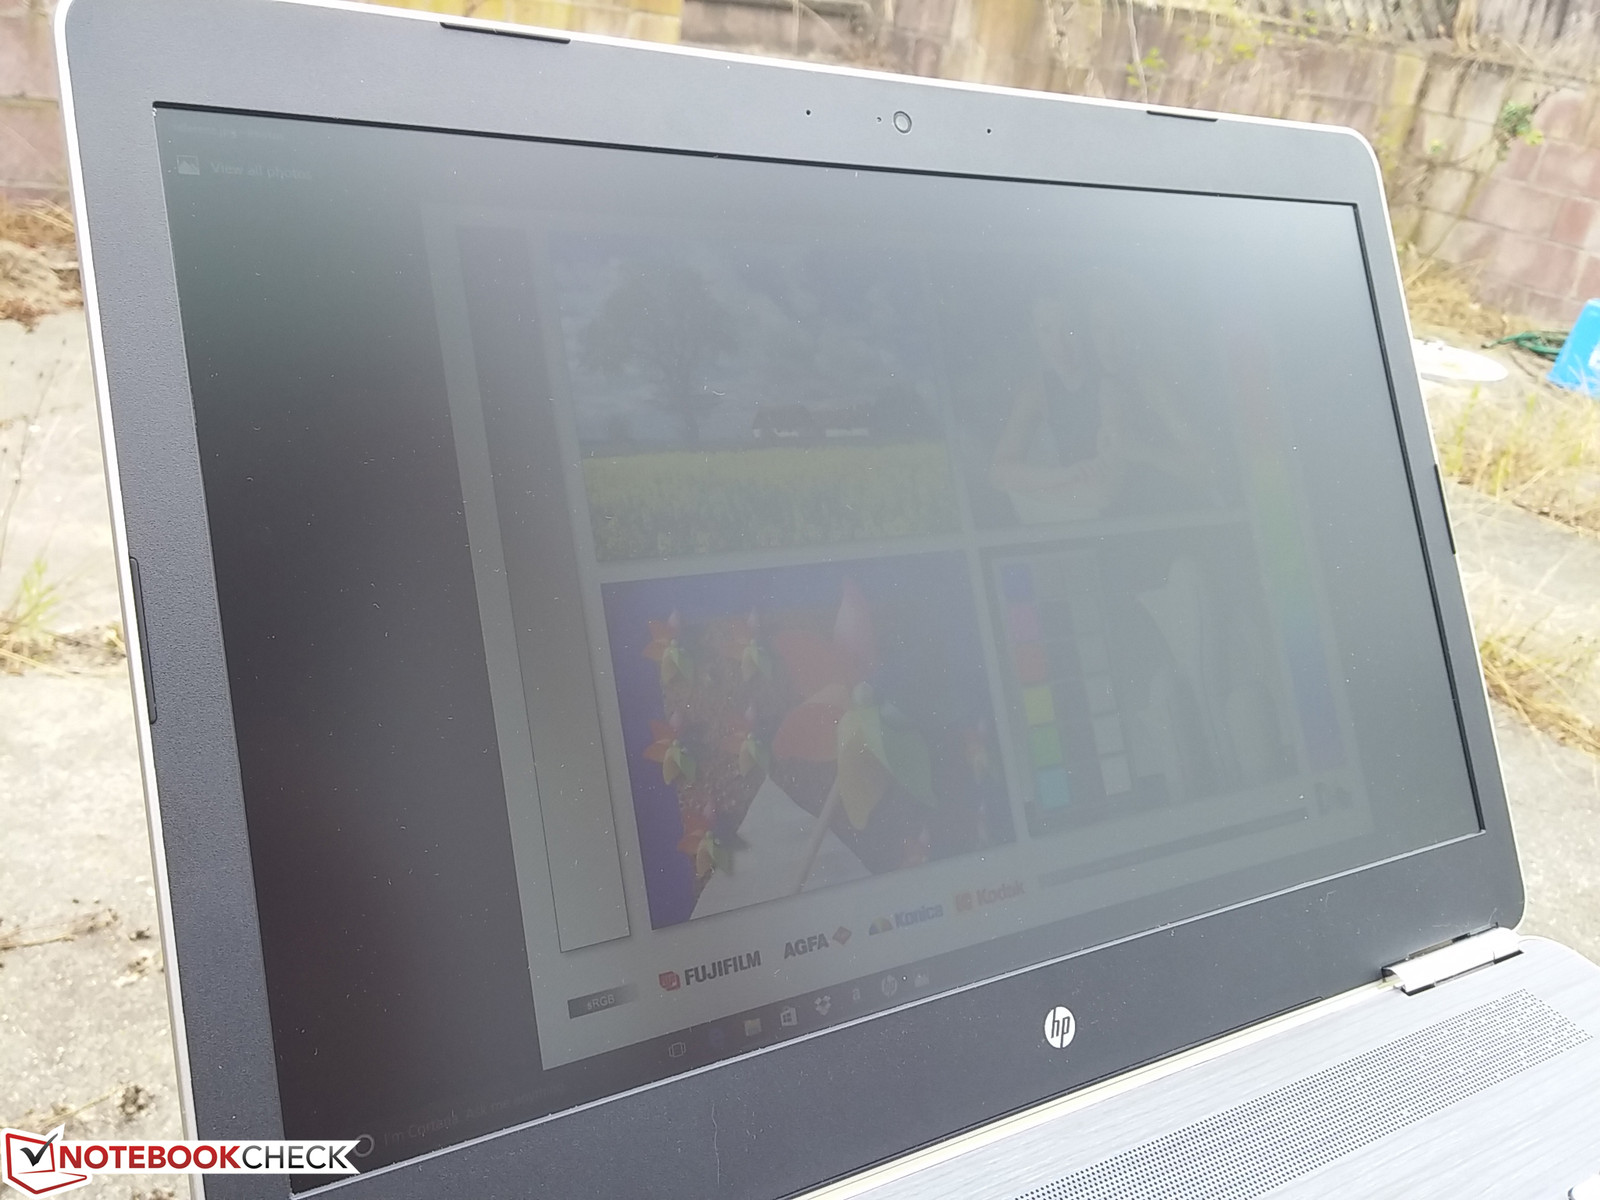
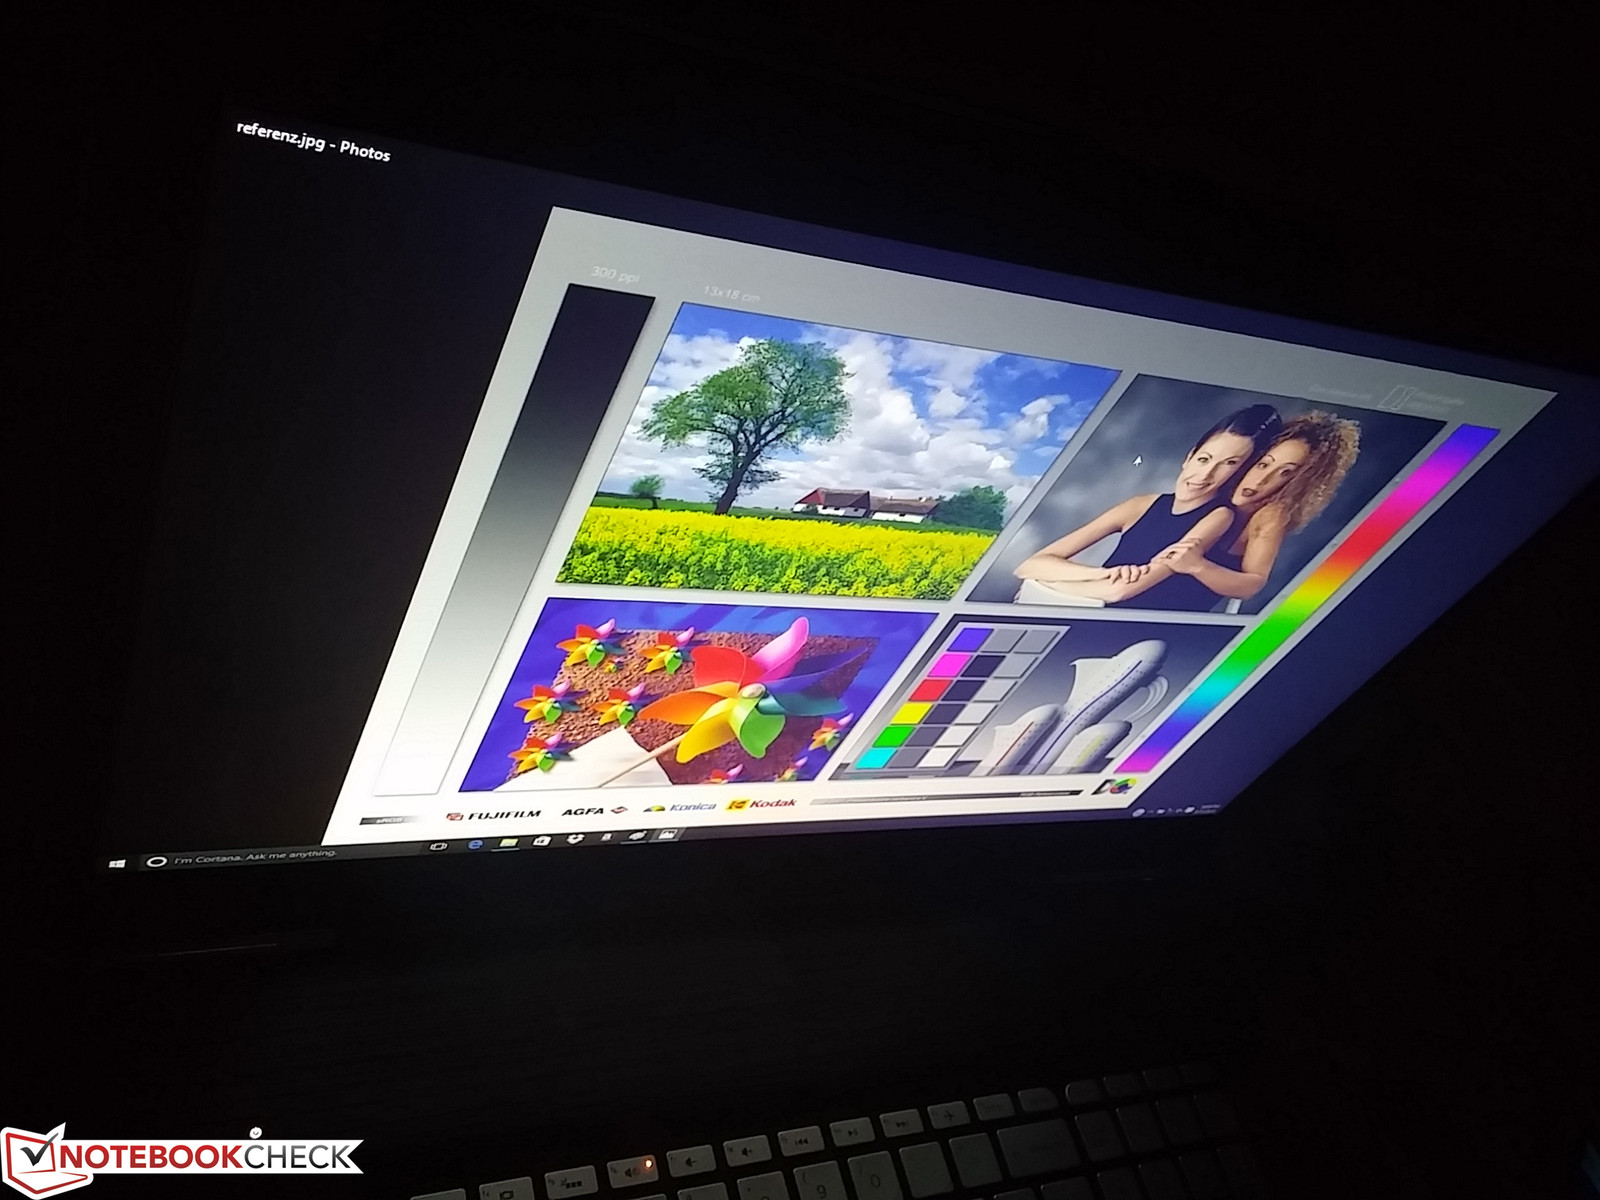
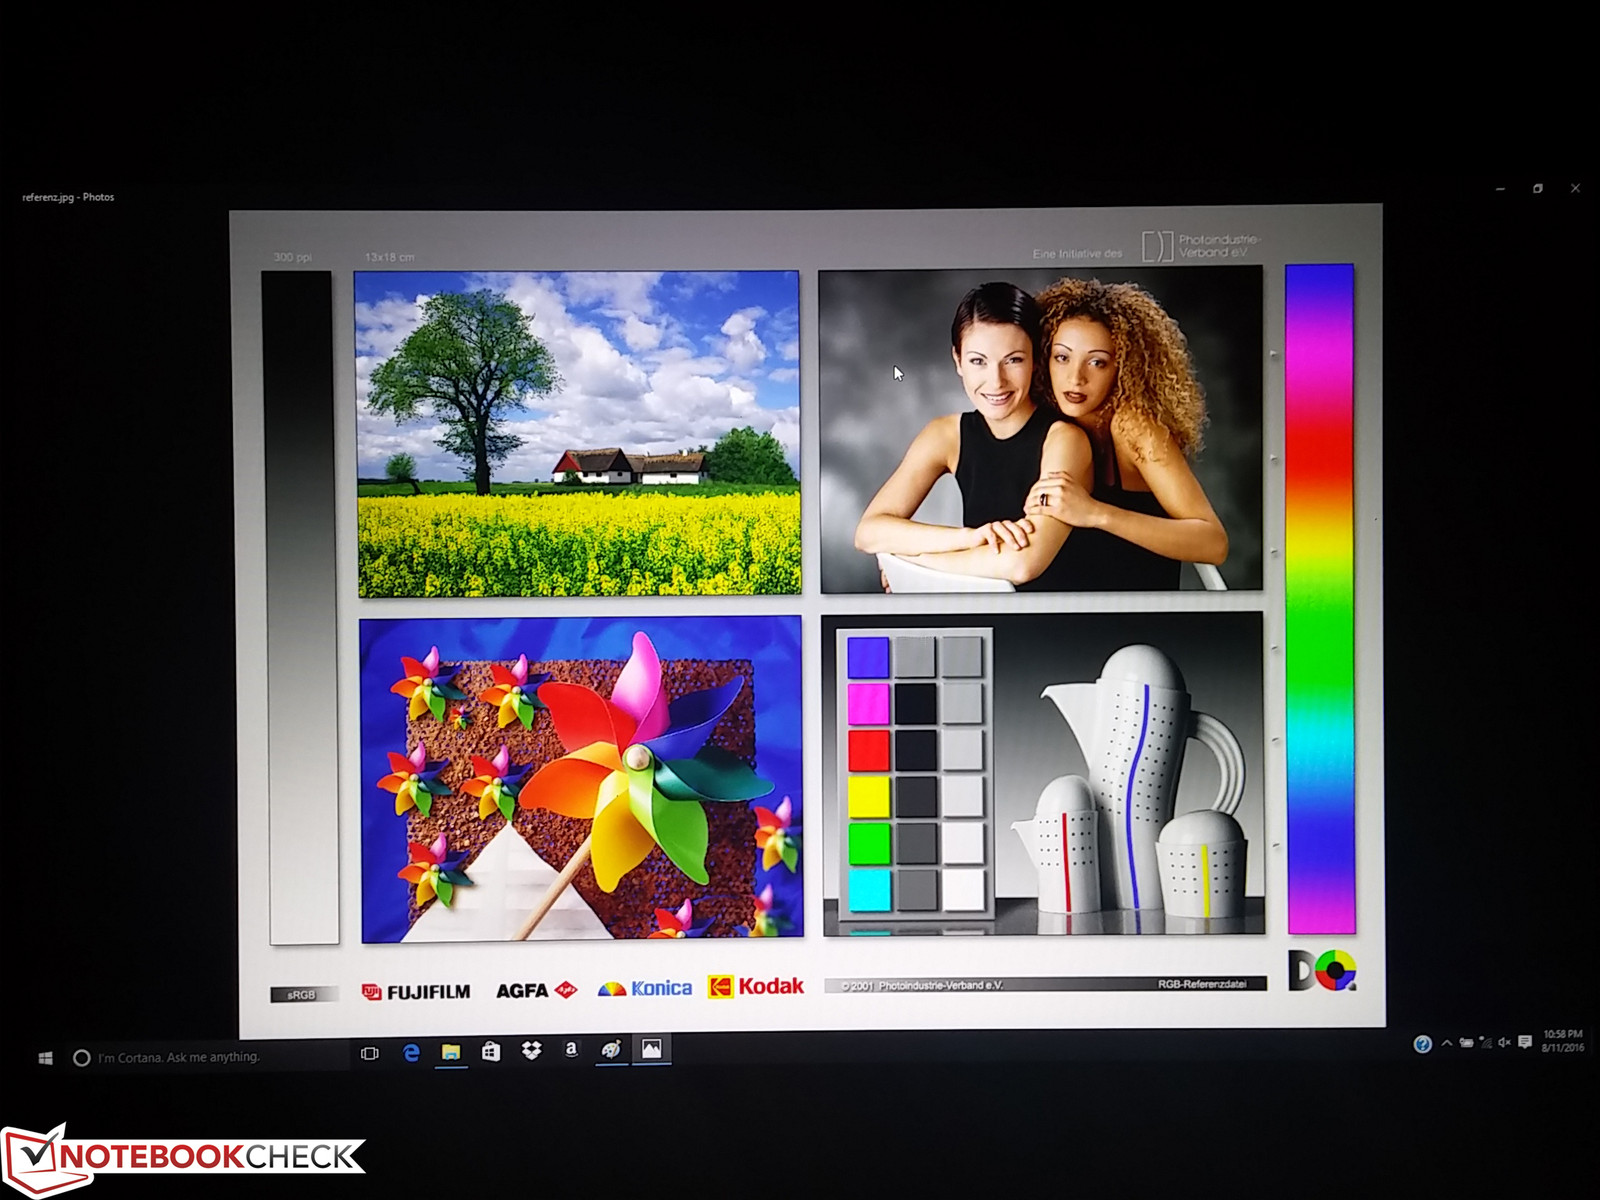
Outdoor visibility is average under shade and becomes uncomfortable when under direct sunlight or an overcast day. The matte display reduces glare significantly, but colors become easily washed out as well. Viewing angles are wide as expected from an IPS panel.
Performance
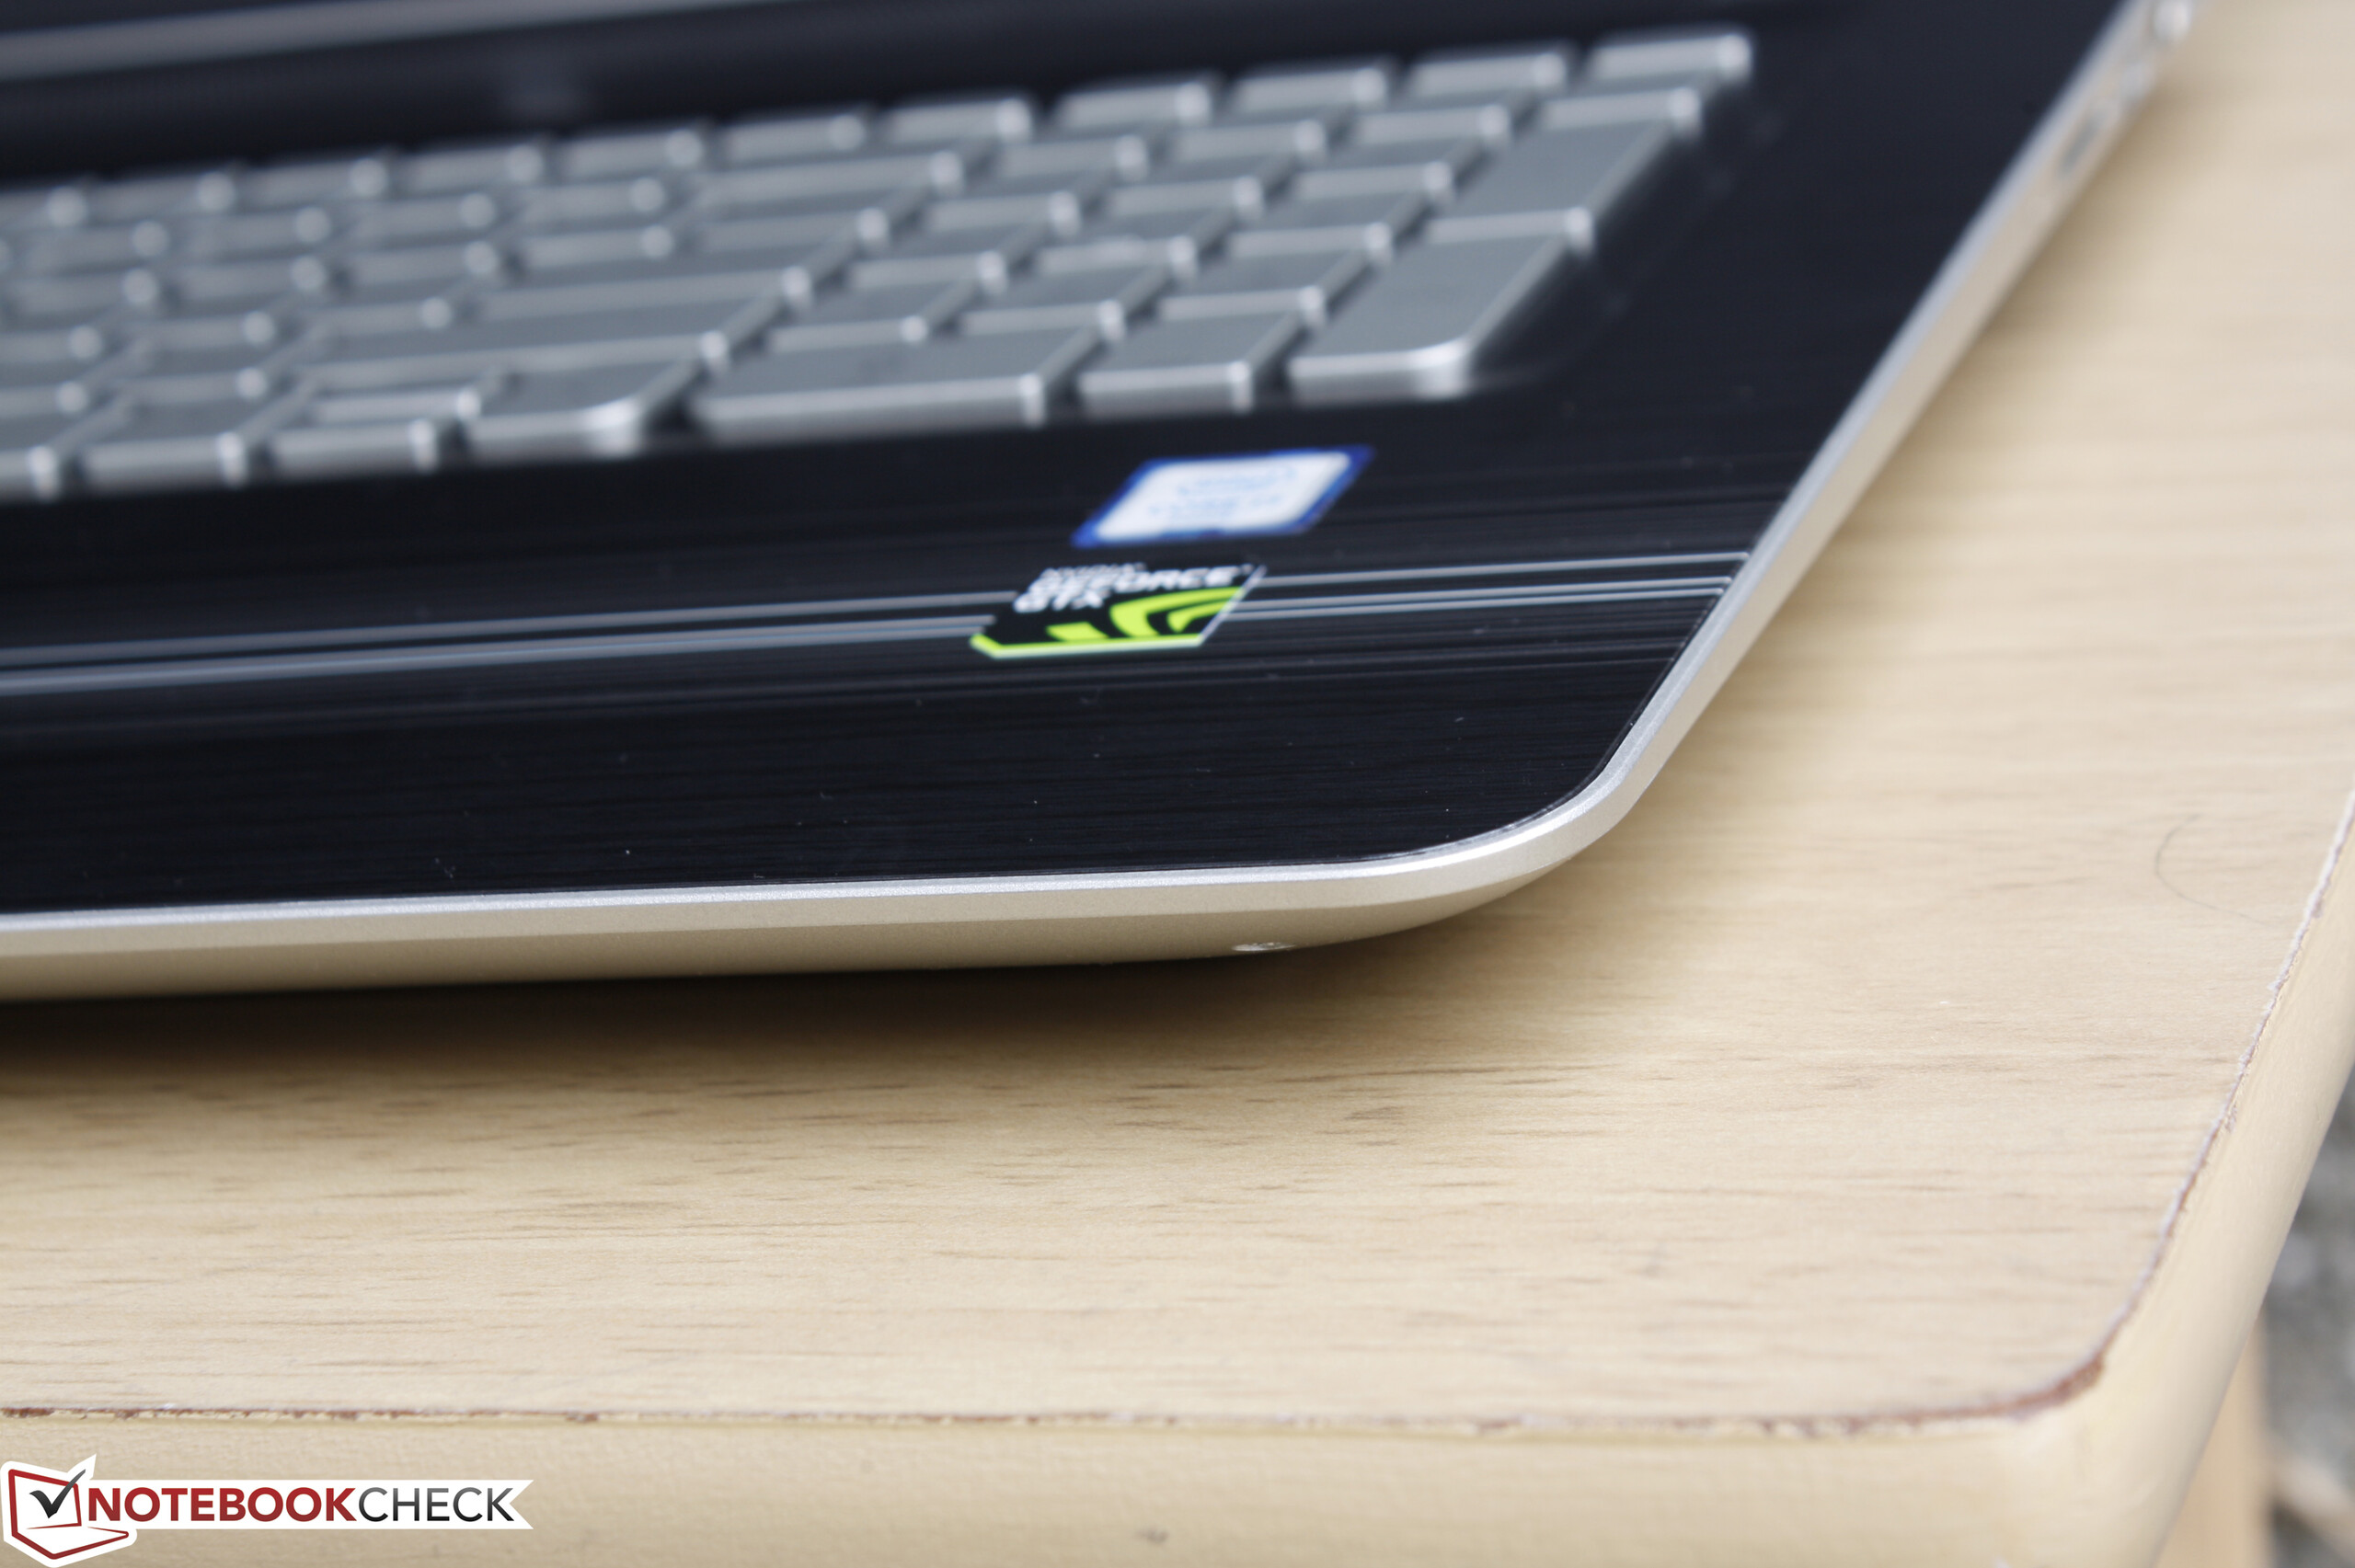
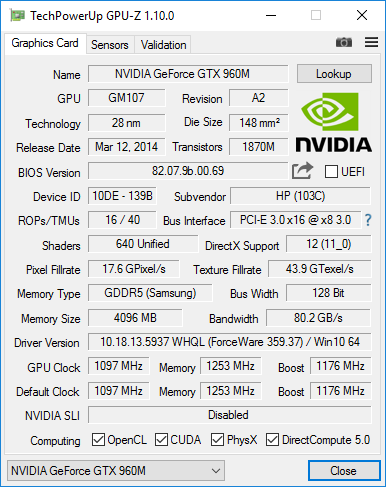
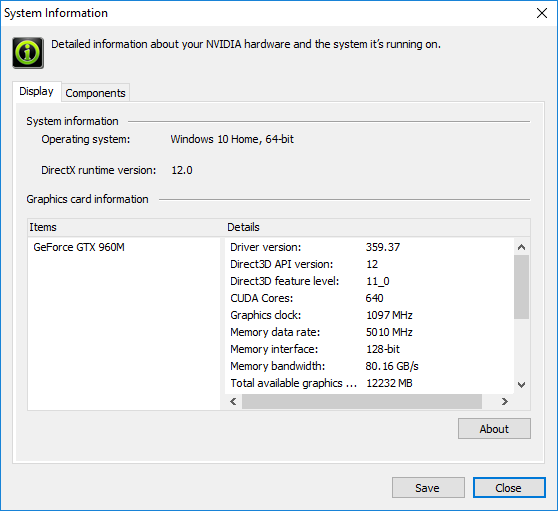
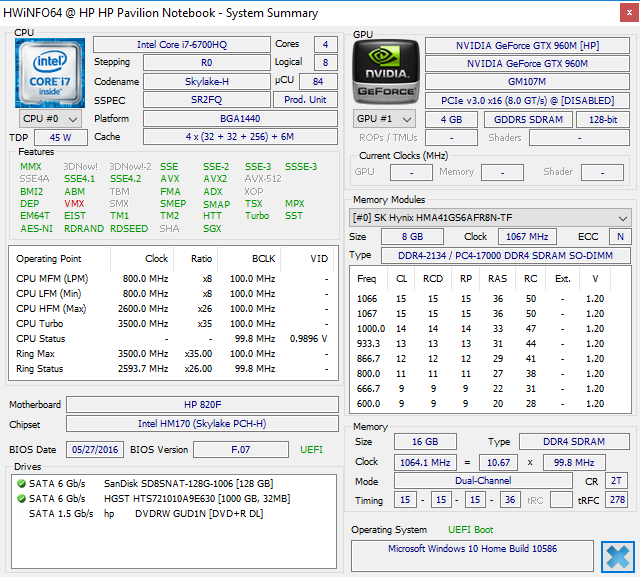
Our configuration houses an i7-6700HQ while lower-end SKUs offer the i5-6300HQ. When compared to the i7-6700HQ, the i5-6300HQ is noticeably slower in multi-core processes as shown in our Processor section below. All SKUs otherwise come with the same GTX 960M GPU, but it's worth noting that the i5-6300HQ configurations carry only half the VRAM at 2 GB GDDR5 instead of 4 GB as on our i7-6700HQ test unit.
The system includes Optimus for graphics switching to the integrated HD Graphics 530 when appropriate.
Processor
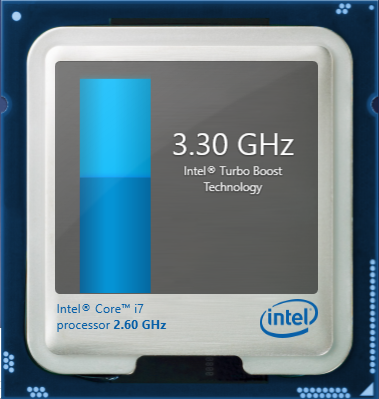
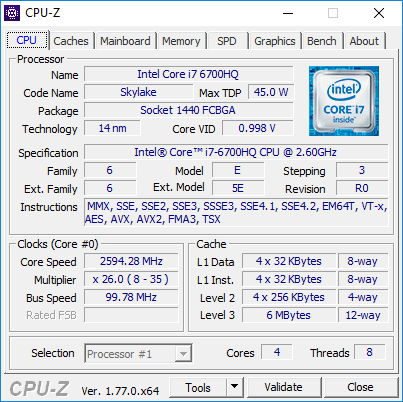
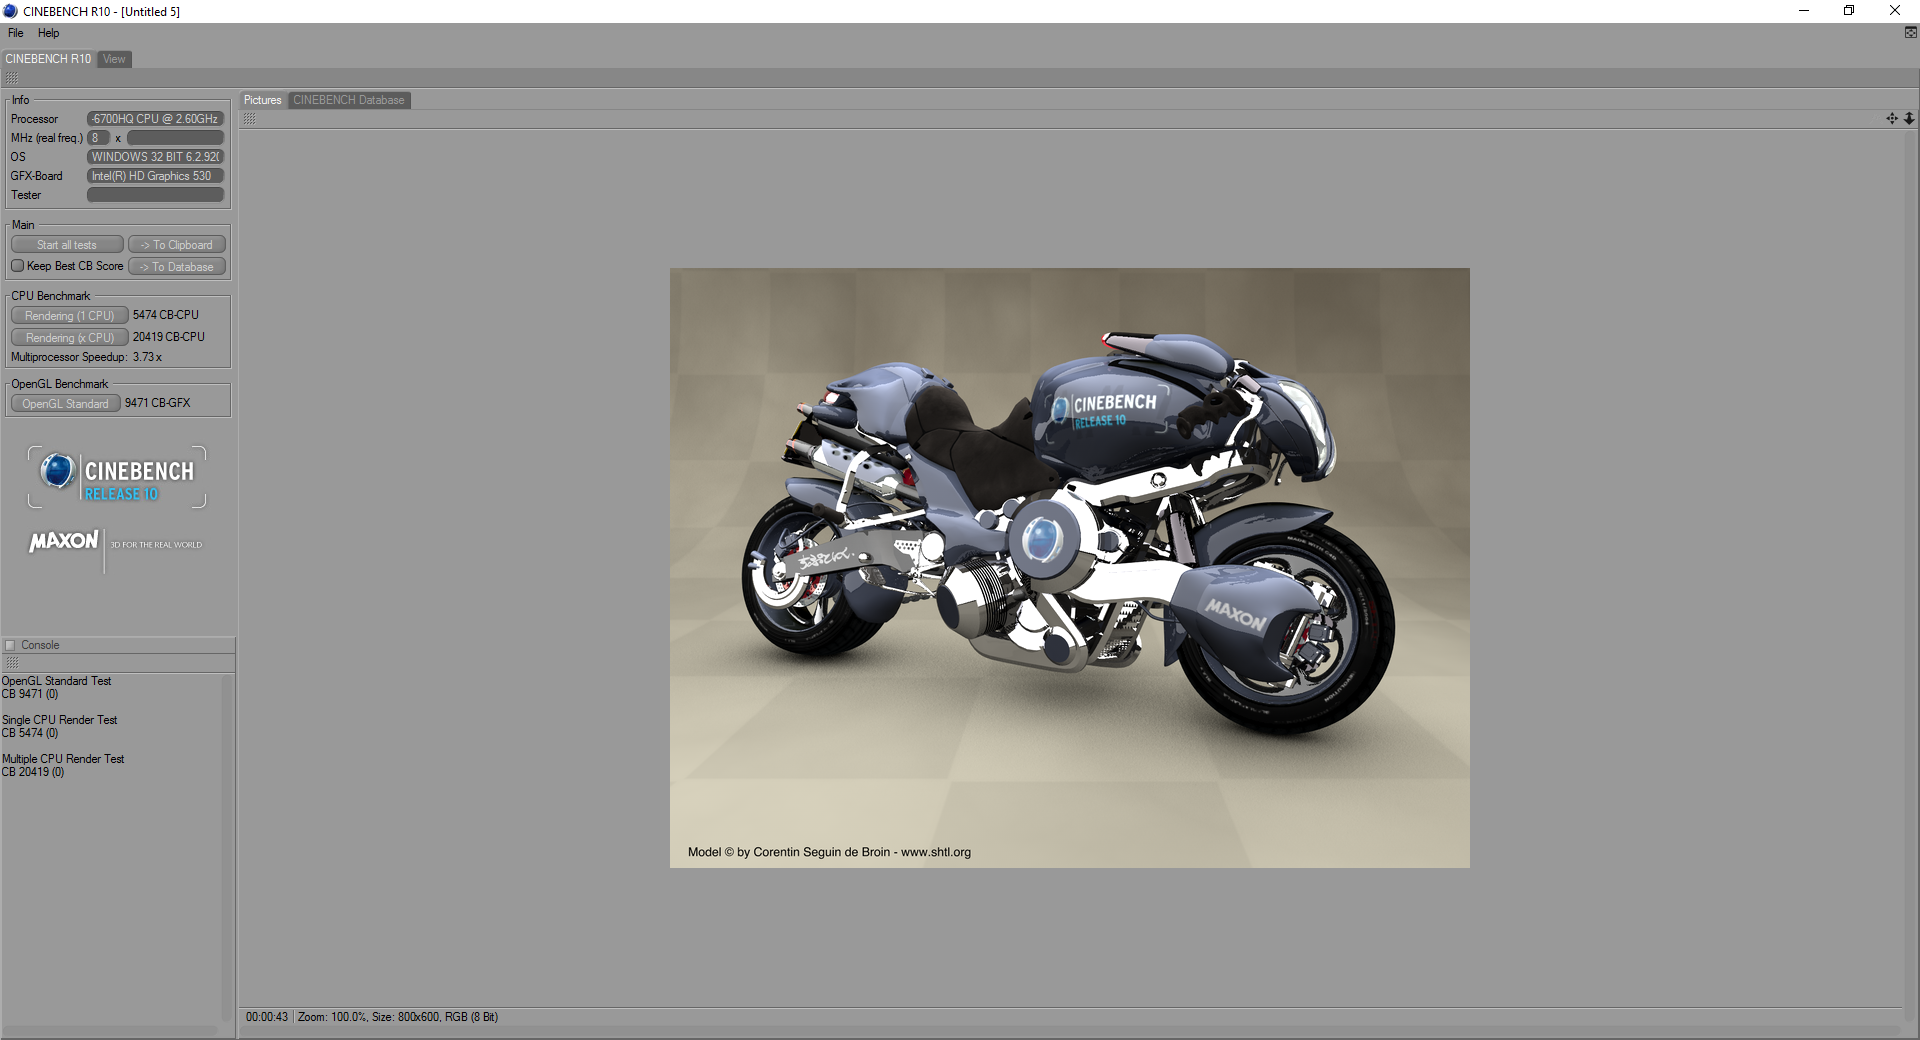
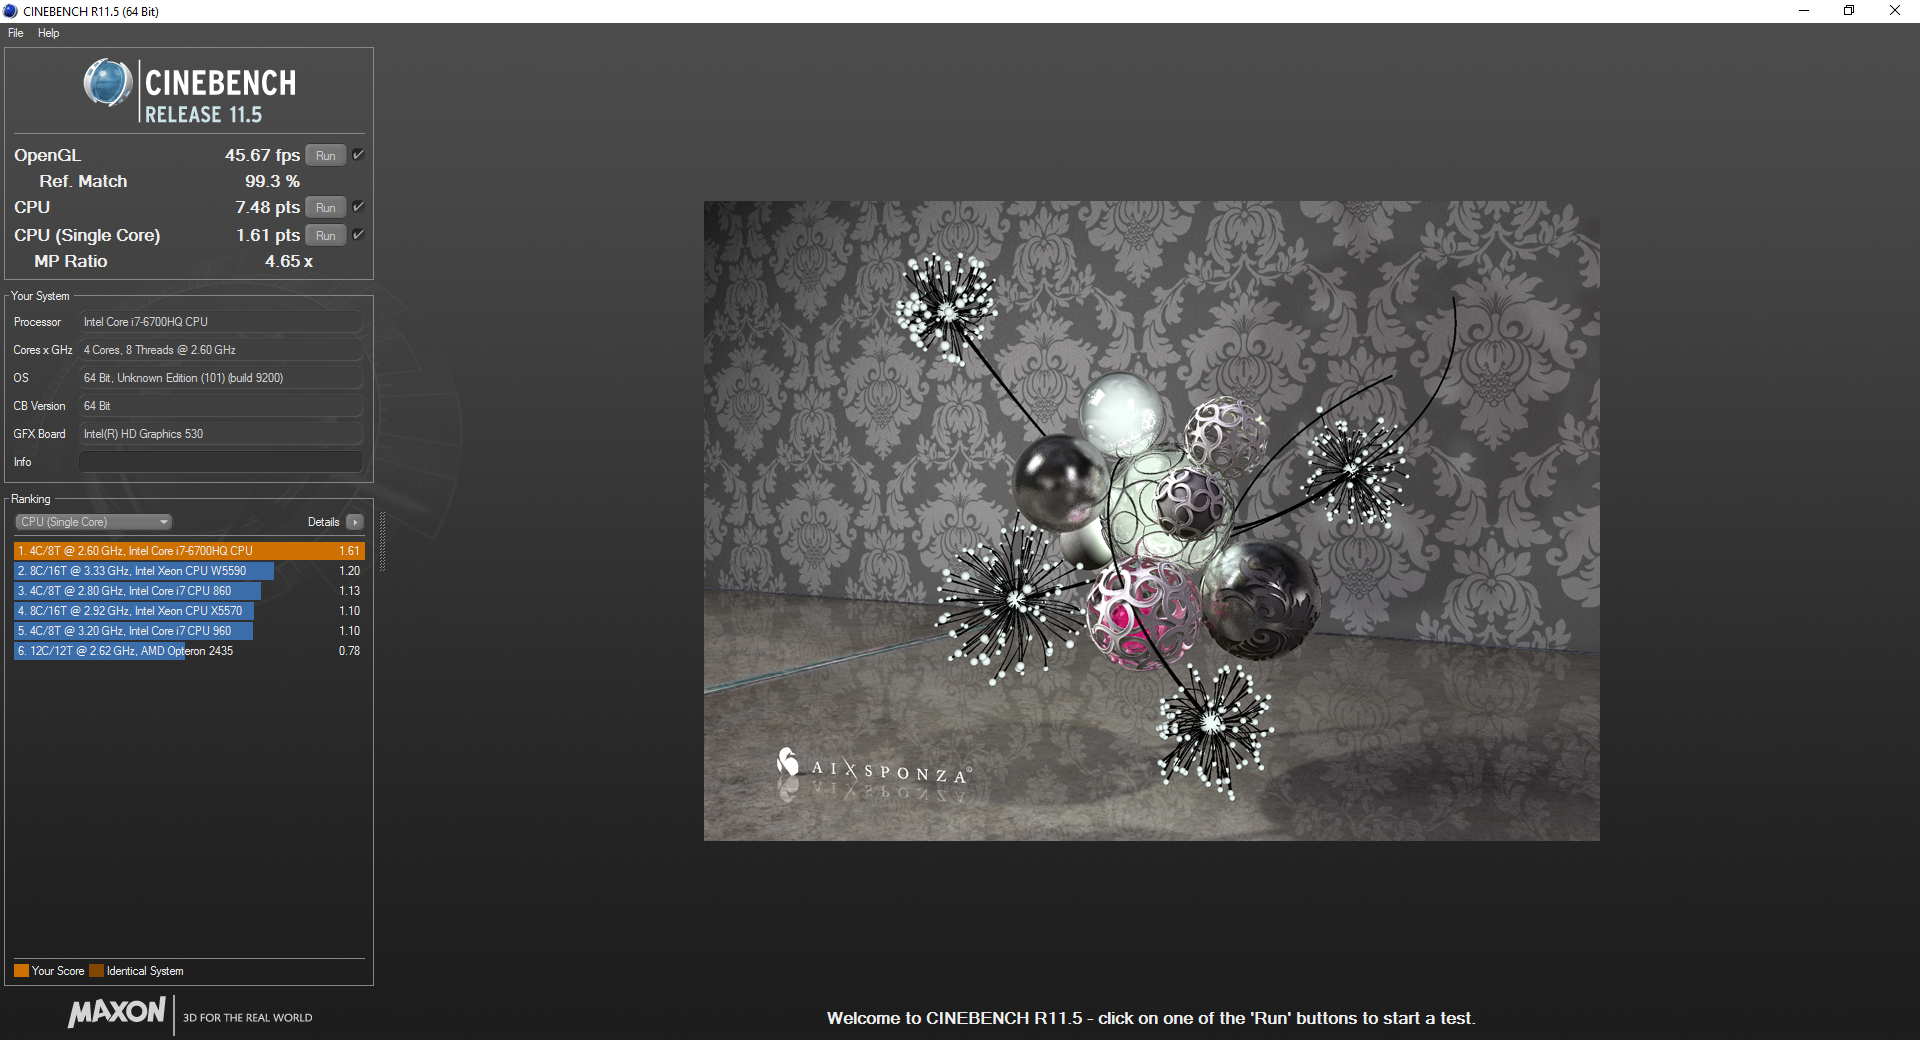
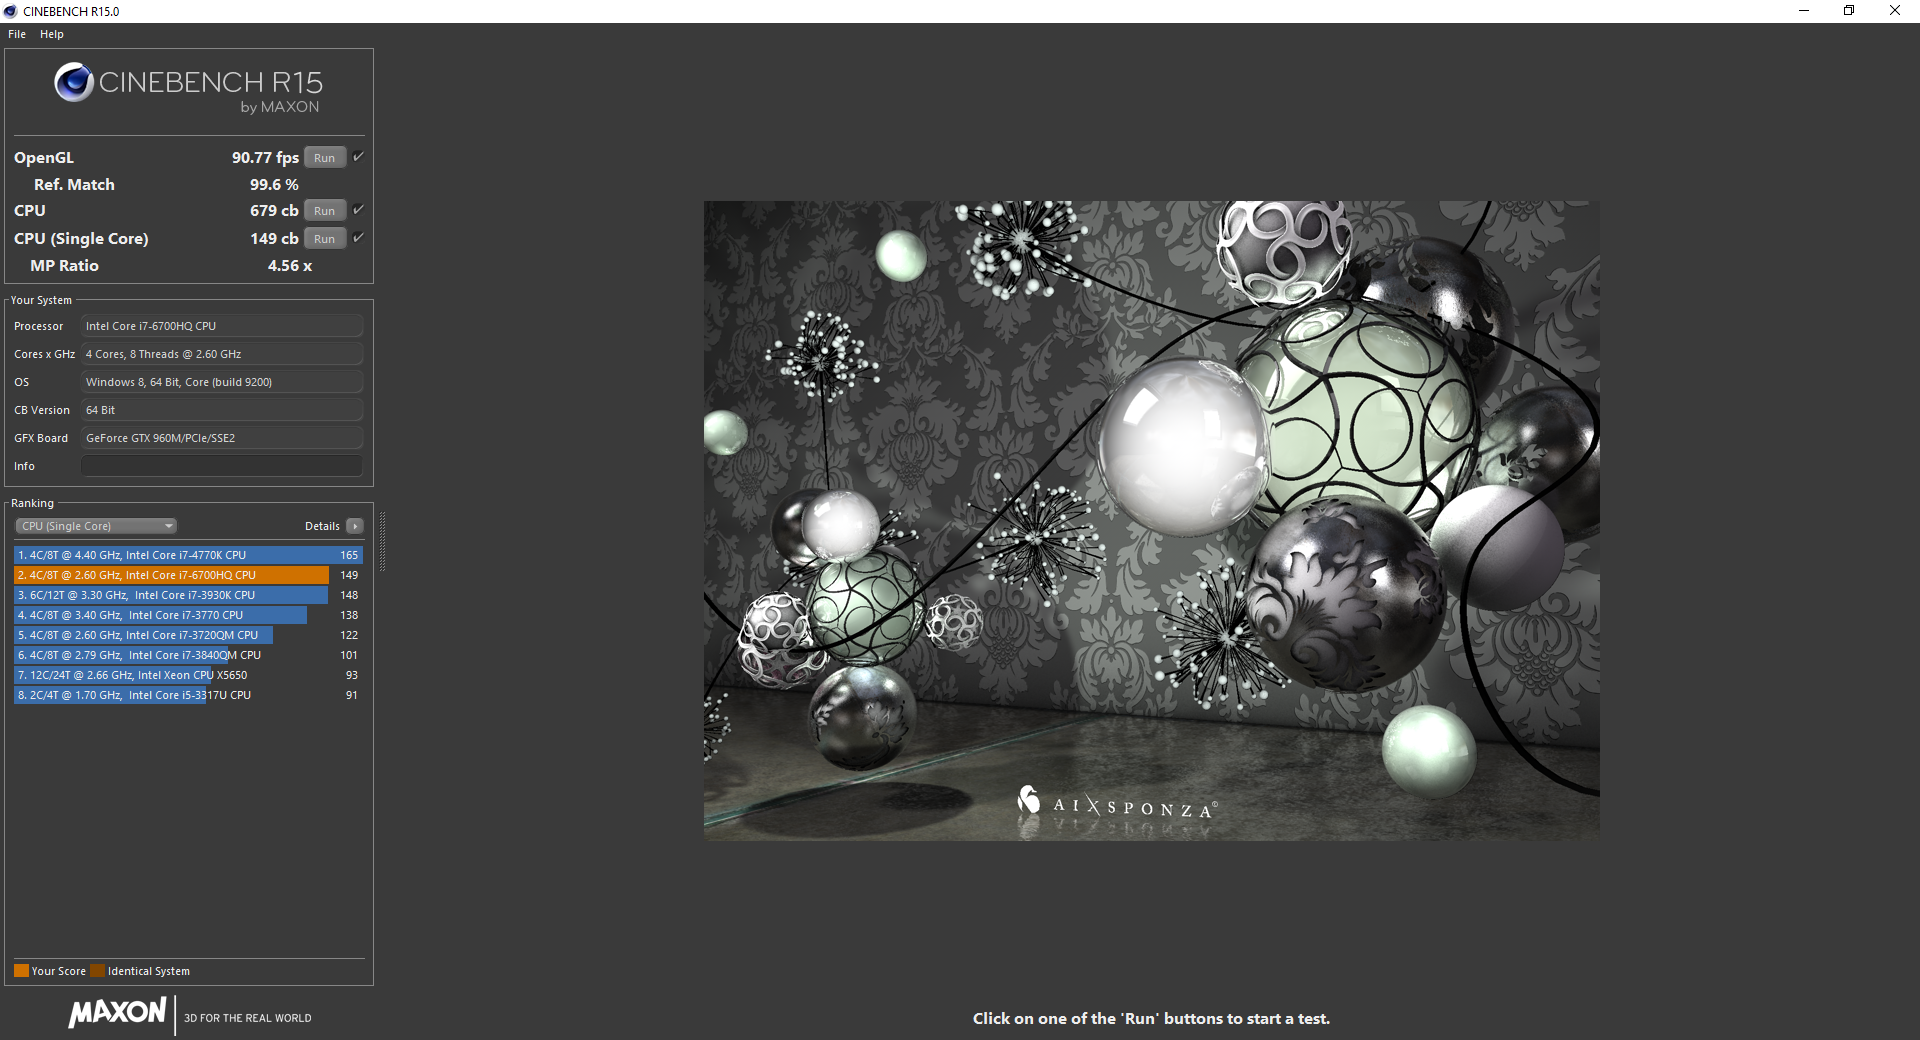
CPU performance according to CineBench benchmarks is not unlike the previous generation i7-5700HQ or even the higher-end and overclockable i7-6820HK. This is expected as the Skylake generation focuses on performance-per-Watt and better integrated GPU performance over raw CPU power.
See our dedicated CPU page on the Core i7-6700HQ for more technical information and benchmark comparisons.
| Cinebench R15 | |
| CPU Single 64Bit | |
| DogHouse Systems Mobius SS | |
| Asus G701VO-CS74K | |
| HP Pavilion 17 FHD V3A33AV | |
| MSI GE62 2QC-468XPL | |
| Acer Aspire V Nitro VN7-792G-55SF | |
| Toshiba Satellite S70-B-106 | |
| Acer TravelMate P648-M-757N | |
| CPU Multi 64Bit | |
| DogHouse Systems Mobius SS | |
| MSI GE62 2QC-468XPL | |
| Asus G701VO-CS74K | |
| HP Pavilion 17 FHD V3A33AV | |
| Toshiba Satellite S70-B-106 | |
| Acer Aspire V Nitro VN7-792G-55SF | |
| Acer TravelMate P648-M-757N | |
| Cinebench R11.5 | |
| CPU Single 64Bit | |
| DogHouse Systems Mobius SS | |
| Asus G701VO-CS74K | |
| MSI GE62 2QC-468XPL | |
| HP Pavilion 17 FHD V3A33AV | |
| Toshiba Satellite S70-B-106 | |
| Acer Aspire V Nitro VN7-792G-55SF | |
| Acer TravelMate P648-M-757N | |
| CPU Multi 64Bit | |
| DogHouse Systems Mobius SS | |
| MSI GE62 2QC-468XPL | |
| Asus G701VO-CS74K | |
| HP Pavilion 17 FHD V3A33AV | |
| Toshiba Satellite S70-B-106 | |
| Acer Aspire V Nitro VN7-792G-55SF | |
| Acer TravelMate P648-M-757N | |
| Cinebench R10 | |
| Rendering Multiple CPUs 32Bit | |
| DogHouse Systems Mobius SS | |
| MSI GE62 2QC-468XPL | |
| Asus G701VO-CS74K | |
| HP Pavilion 17 FHD V3A33AV | |
| Acer Aspire V Nitro VN7-792G-55SF | |
| Acer TravelMate P648-M-757N | |
| Rendering Single 32Bit | |
| DogHouse Systems Mobius SS | |
| Asus G701VO-CS74K | |
| MSI GE62 2QC-468XPL | |
| HP Pavilion 17 FHD V3A33AV | |
| Acer Aspire V Nitro VN7-792G-55SF | |
| Acer TravelMate P648-M-757N | |
| wPrime 2.10 - 1024m | |
| Acer Aspire V Nitro VN7-792G-55SF | |
| Asus G701VO-CS74K | |
| MSI GE62 2QC-468XPL | |
| DogHouse Systems Mobius SS | |
| Super Pi Mod 1.5 XS 32M - 32M | |
| Acer Aspire V Nitro VN7-792G-55SF | |
| MSI GE62 2QC-468XPL | |
| HP Pavilion 17 FHD V3A33AV | |
| Asus G701VO-CS74K | |
| DogHouse Systems Mobius SS | |
* ... smaller is better
System Performance
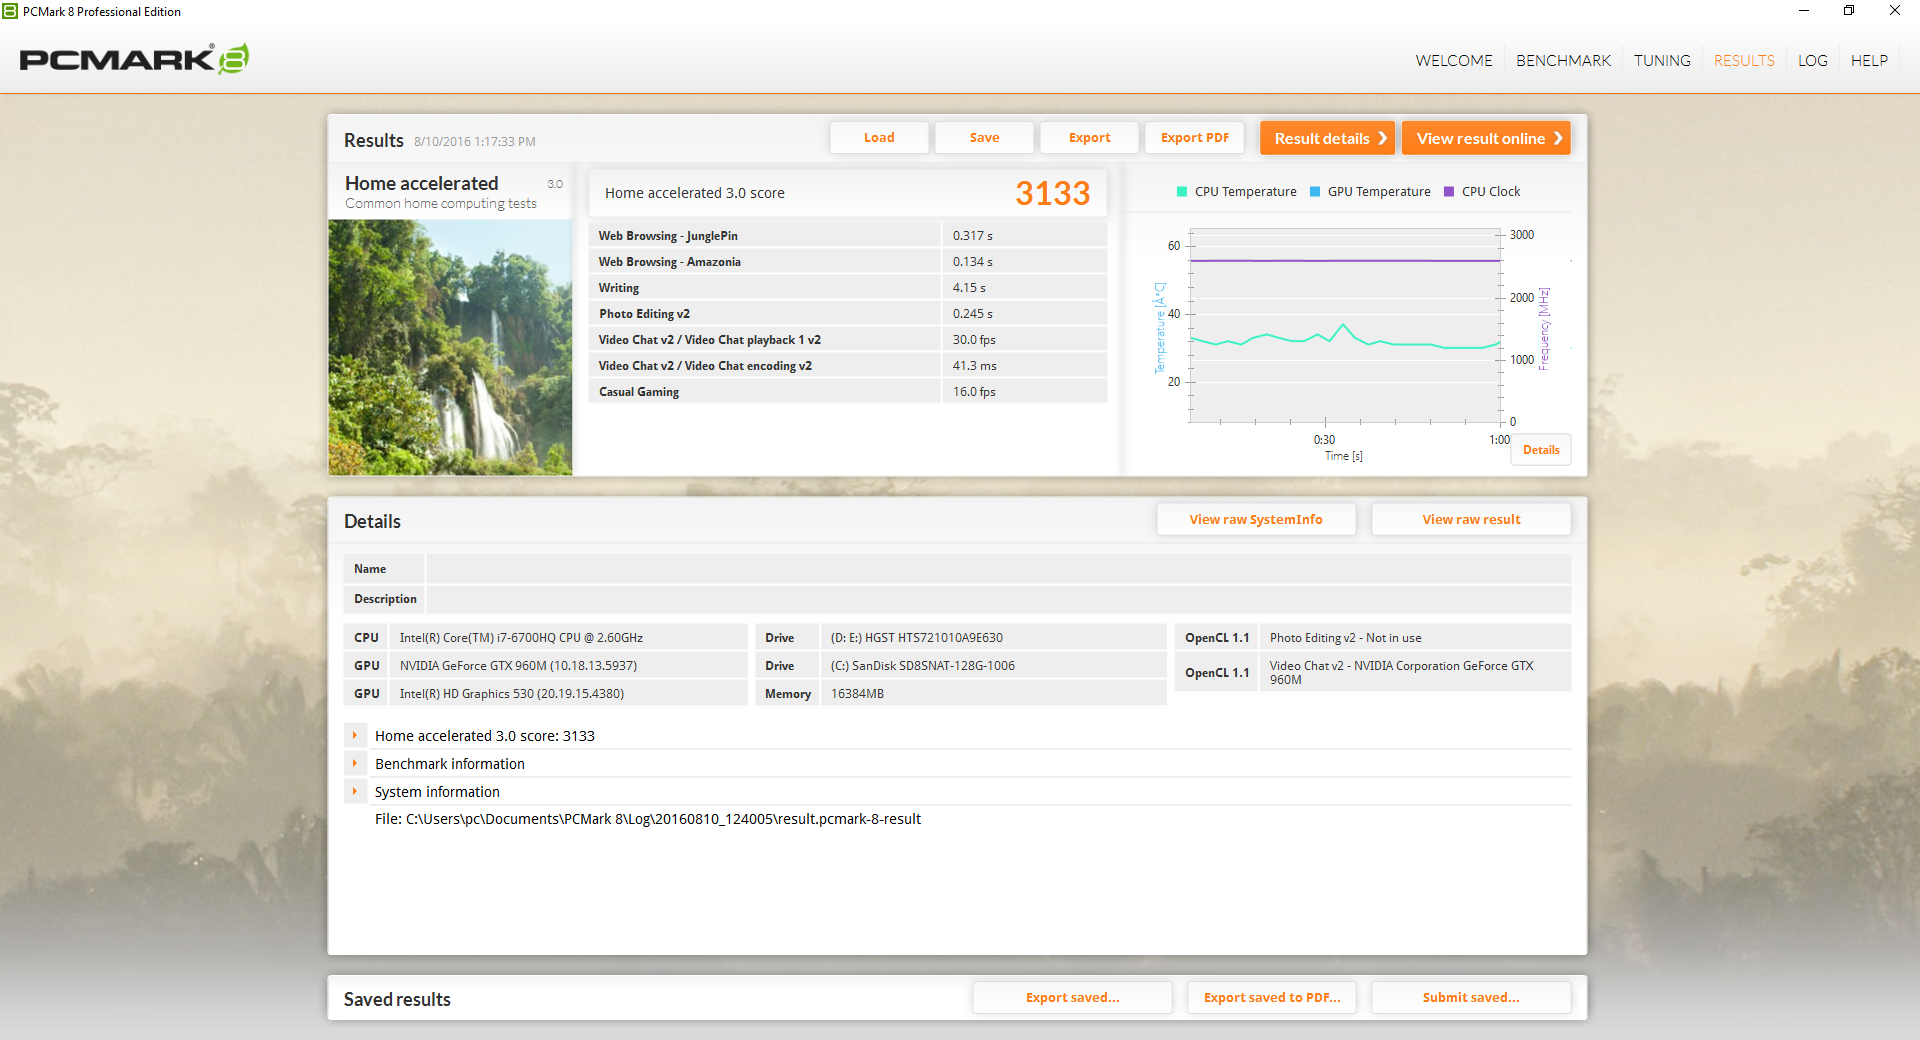
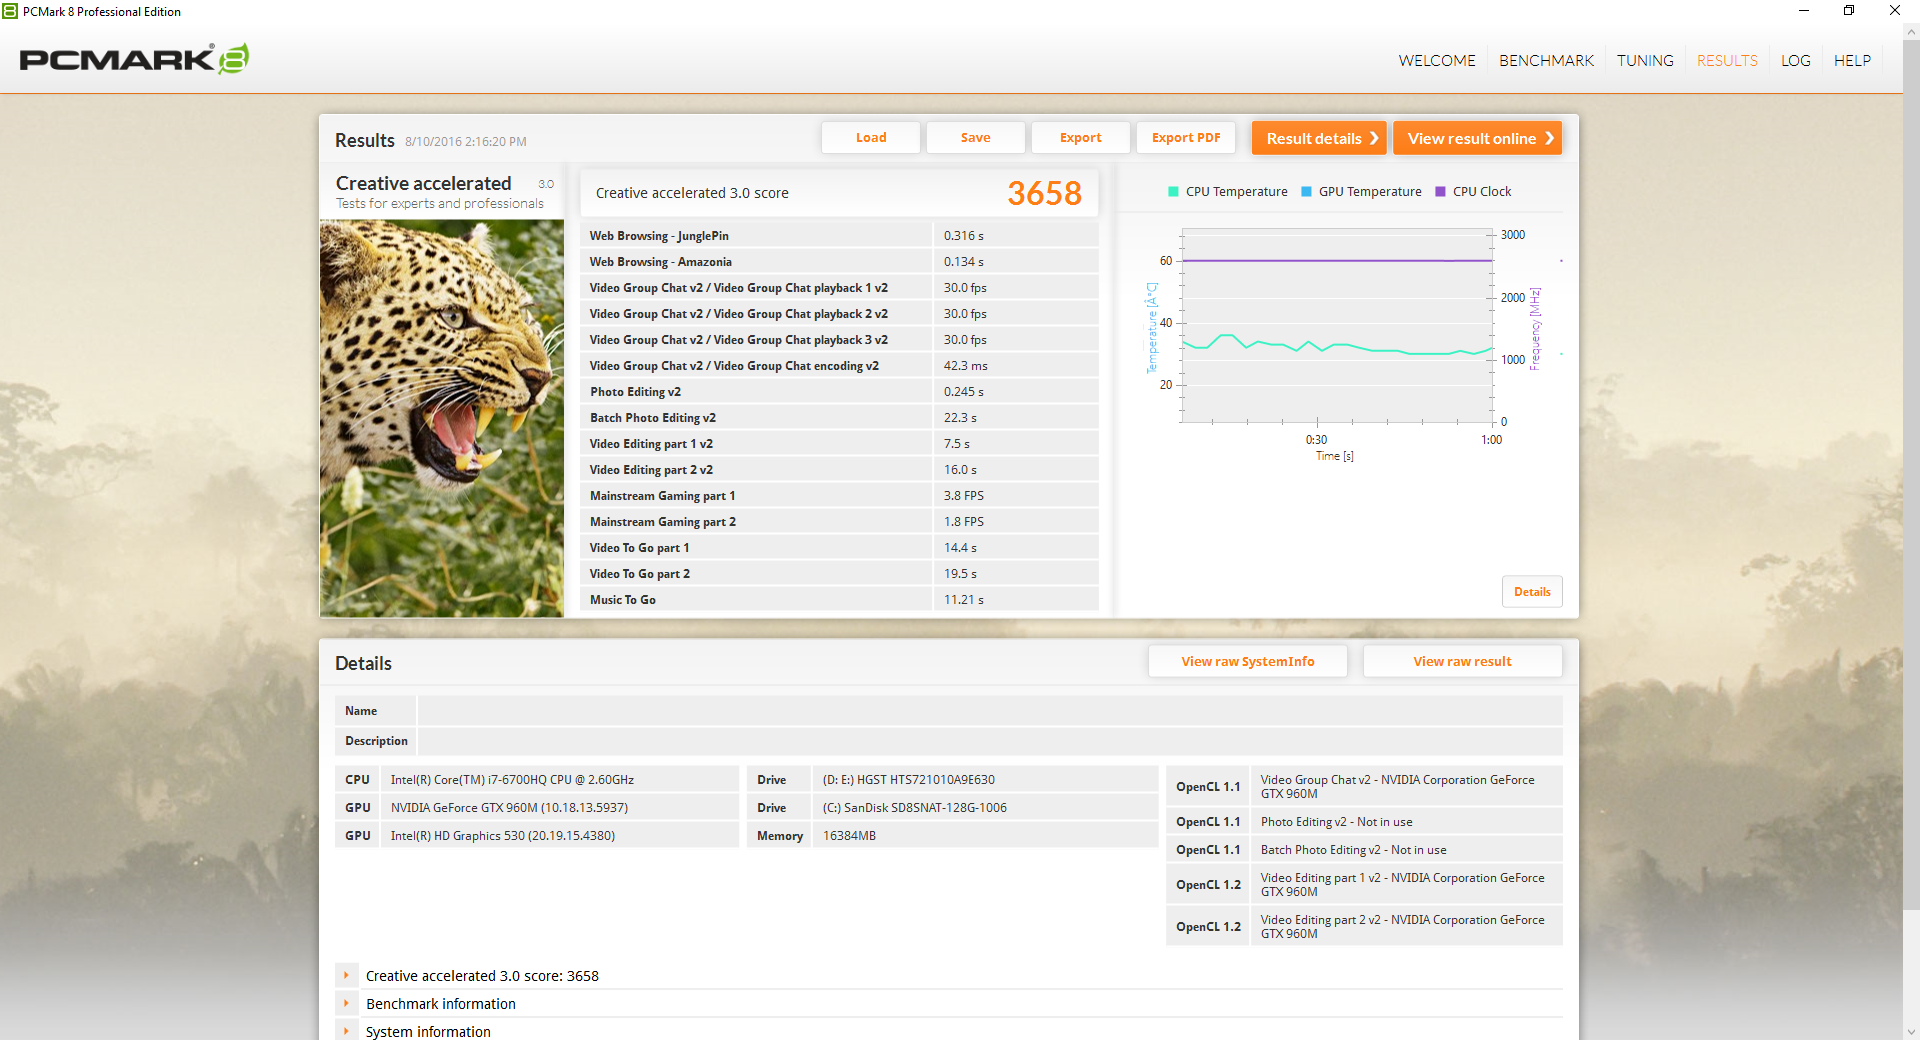
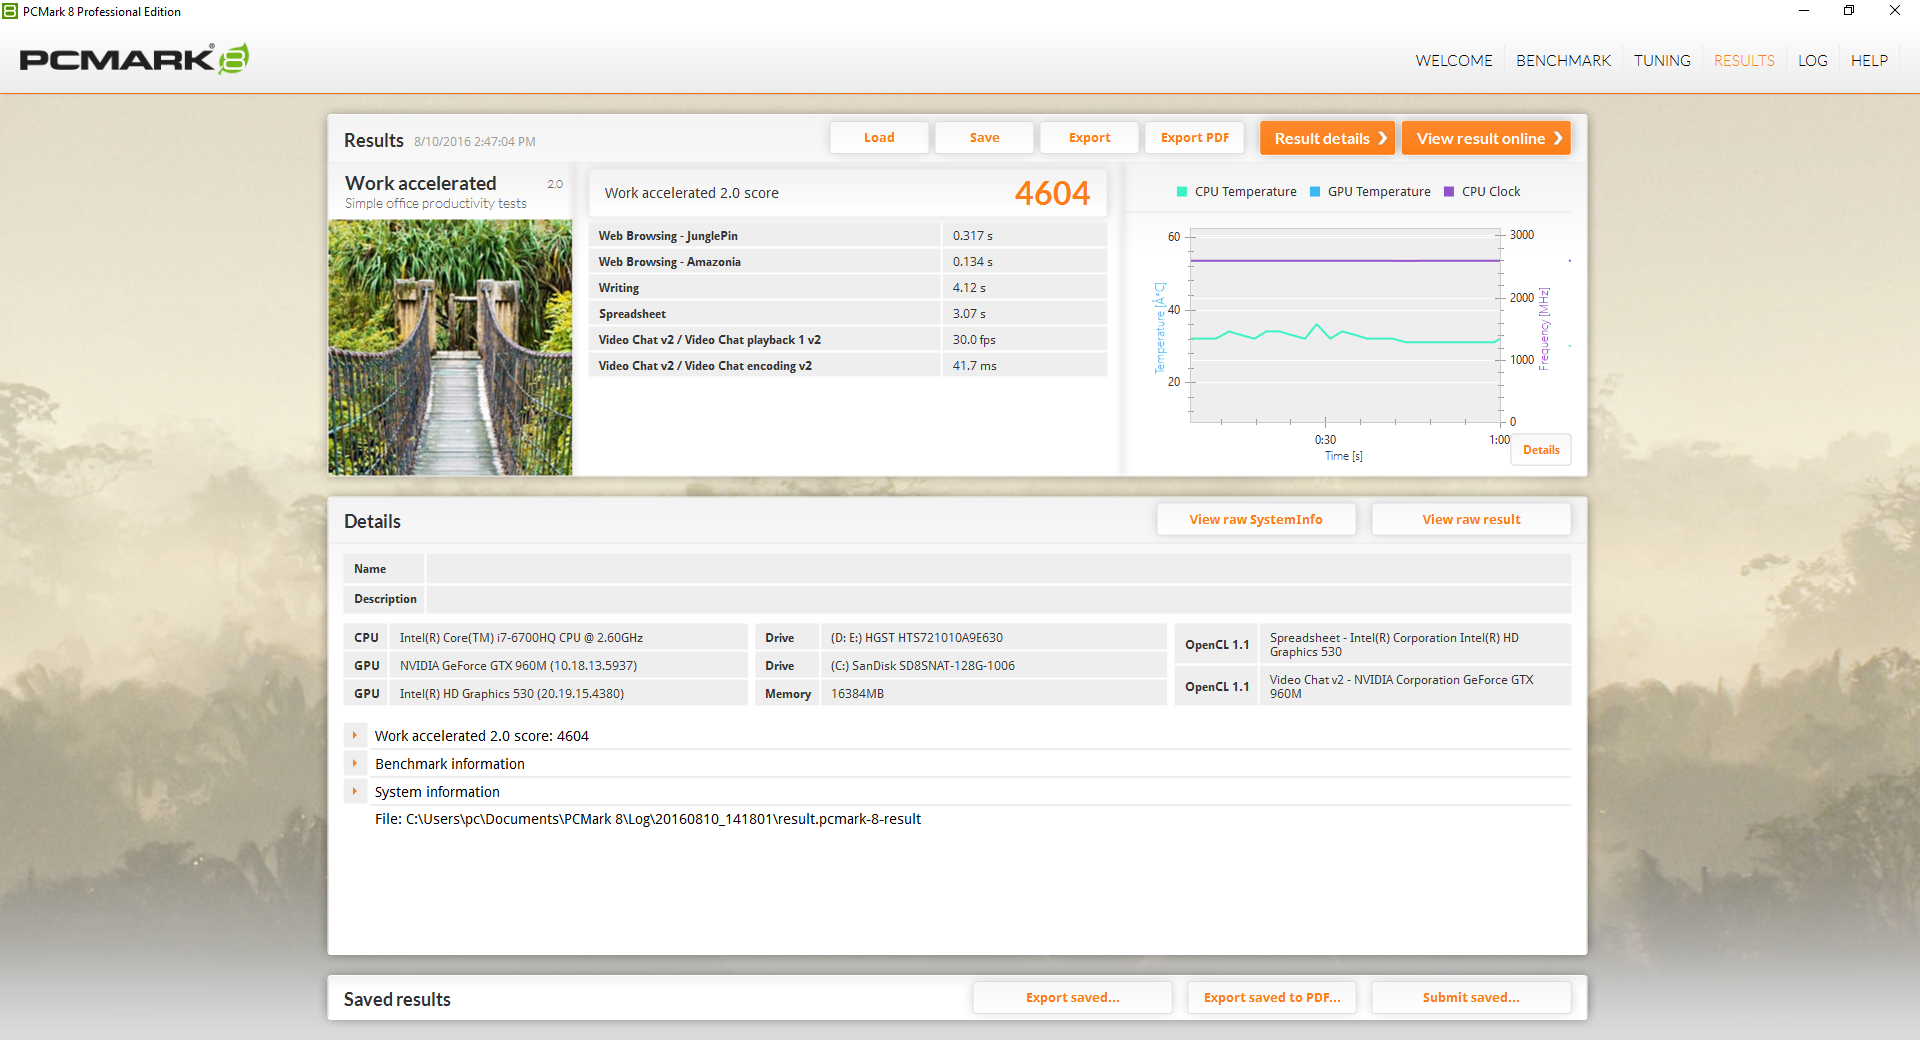
PCMark benchmarks rank the Pavilion 17 in the same ballpark as competing notebooks with an identical CPU and GPU. We experienced no notable hardware or software issues during our time with the test unit.
| PCMark 8 | |
| Home Score Accelerated v2 | |
| Dell XPS 15 9550 i7 FHD | |
| Asus Strix GL502VT-DS74 | |
| Asus G501VW-FY081T | |
| HP Pavilion 17 FHD V3A33AV | |
| HP Pavilion 15 UHD T9Y85AV | |
| Work Score Accelerated v2 | |
| Asus Strix GL502VT-DS74 | |
| Dell XPS 15 9550 i7 FHD | |
| HP Pavilion 17 FHD V3A33AV | |
| Asus G501VW-FY081T | |
| HP Pavilion 15 UHD T9Y85AV | |
| Creative Score Accelerated v2 | |
| Dell XPS 15 9550 i7 FHD | |
| HP Pavilion 15 UHD T9Y85AV | |
| Asus Strix GL502VT-DS74 | |
| Asus G501VW-FY081T | |
| HP Pavilion 17 FHD V3A33AV | |
| PCMark 8 Home Score Accelerated v2 | 3133 points | |
| PCMark 8 Creative Score Accelerated v2 | 3658 points | |
| PCMark 8 Work Score Accelerated v2 | 4604 points | |
Help | ||
Storage Devices
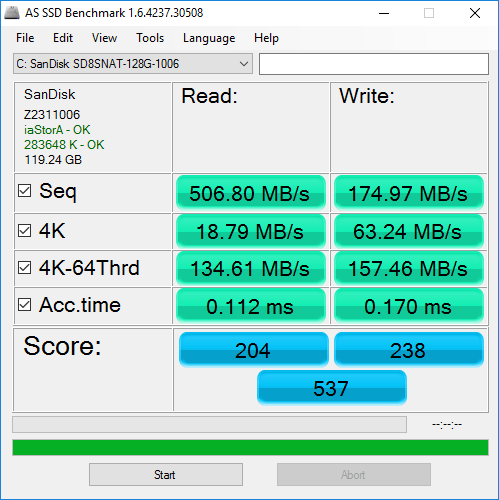
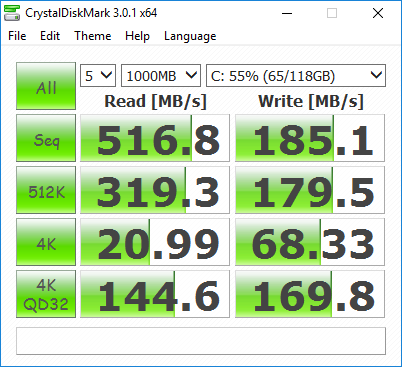
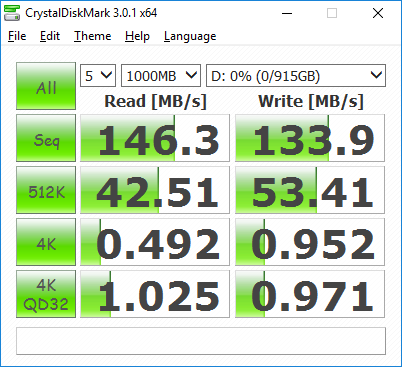
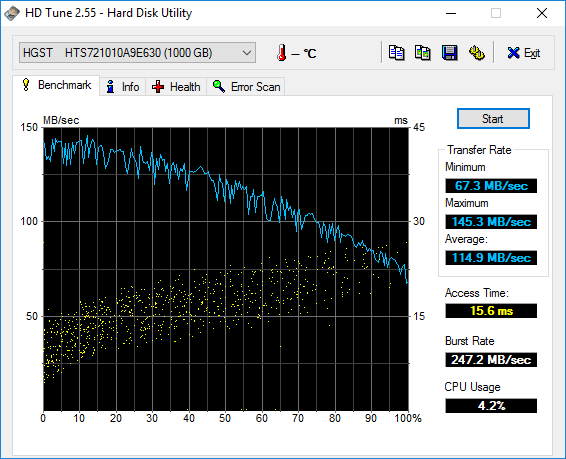
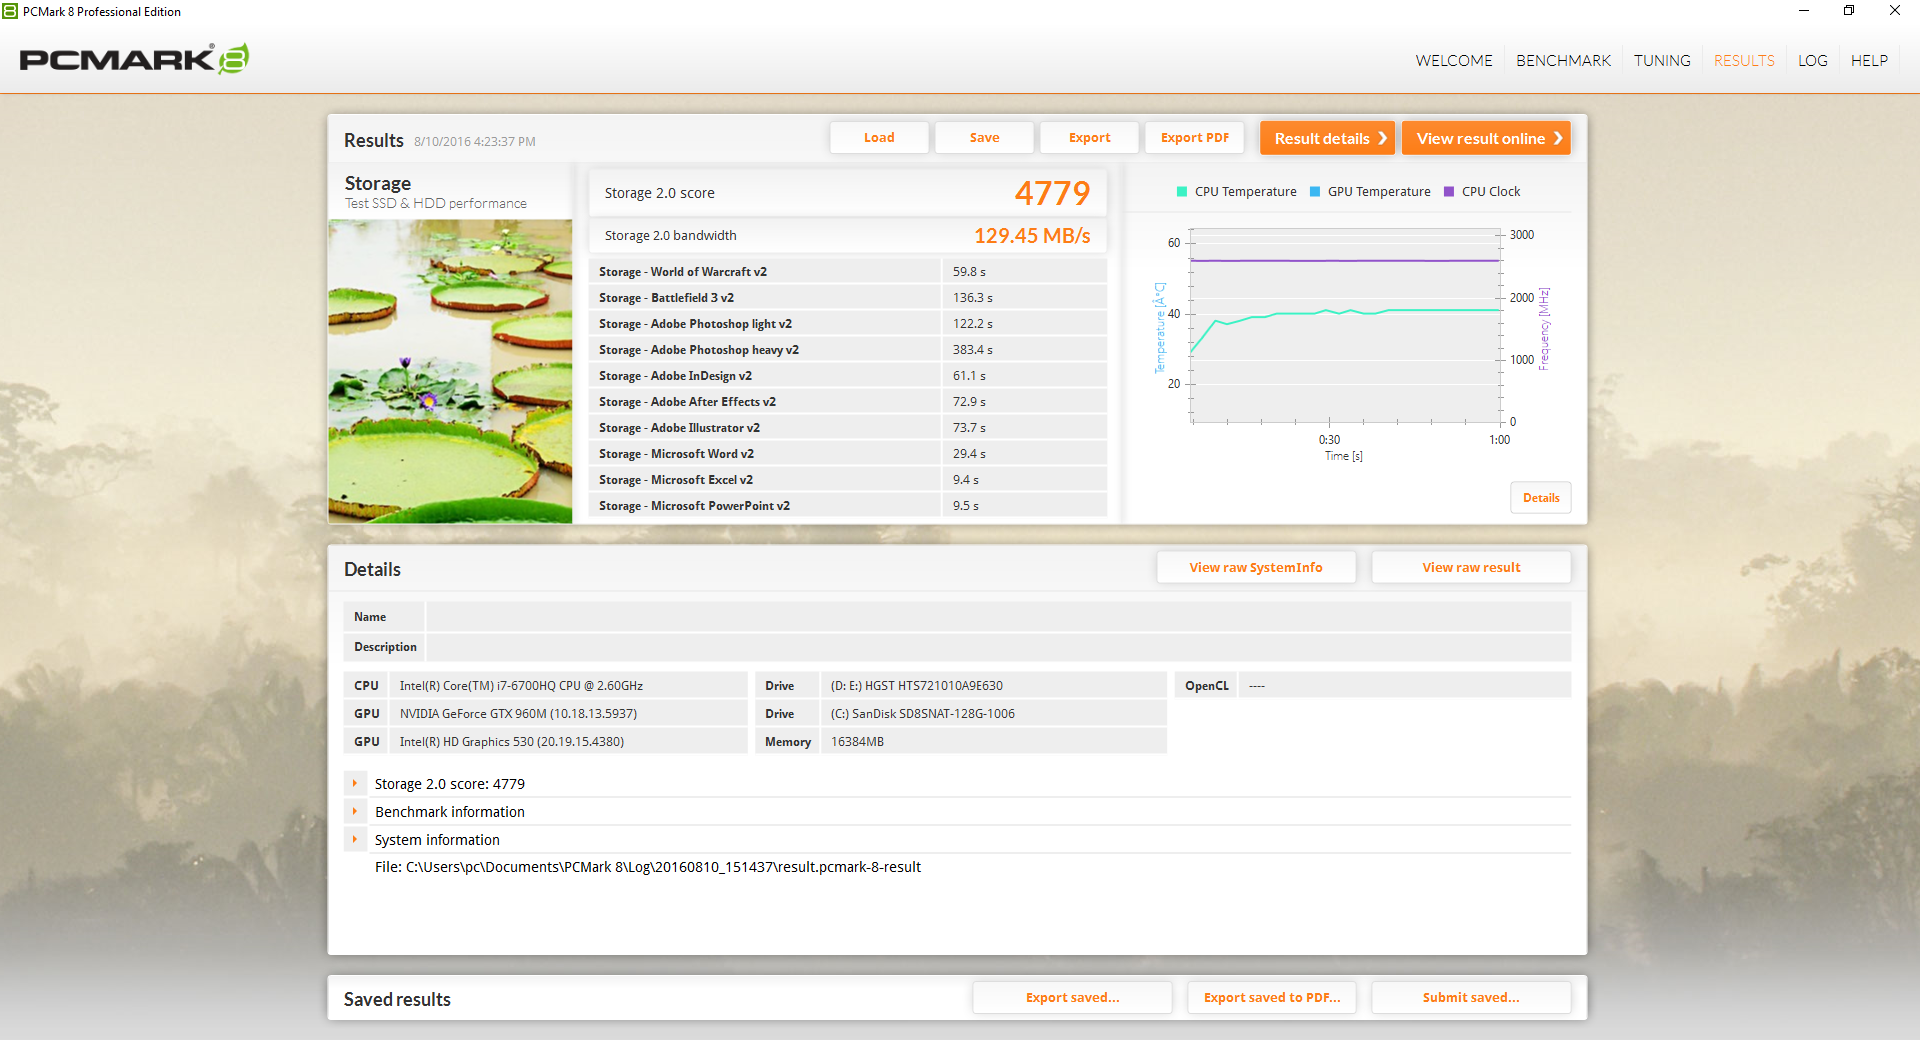
Two storage bays are available as an M.2 2280 slot and a 2.5-inch SATA III bay. Our test configuration is equipped with a 128 GB SanDisk Z400s SSD and a secondary 1 TB HGST HDD. Performance is good considering the SATA III interface limitation with sequential read and write rates of 517 MB/s and 185 MB/s, respectively. Sequential write rates could have been faster as the Lite-On SSD on our Gigabyte P57W delivers over twice the average transfer rate in comparison. Meanwhile, the secondary 7200 RPM HDD returns a fast average transfer rate of 115 MB/s according to HD Tune.
See our growing table of HDDs and SSDs for more comparisons and benchmarks.
| HP Pavilion 17 FHD V3A33AV SanDisk Z400s SD8SNAT-128G | Lenovo Ideapad Y700 17ISK 80Q0 Samsung MZNLN128HCGR-000L2 | HP Pavilion 17-g120ng Toshiba MQ01ABD100 | Gigabyte P57W Lite-On IT L8T-256L9G | Asus ZenBook Pro UX501VW-DS71T Samsung SM951 MZVPV512HDGL m.2 PCI-e | |
|---|---|---|---|---|---|
| CrystalDiskMark 3.0 | 32% | -87% | 52% | 322% | |
| Read Seq (MB/s) | 517 | 513 -1% | 104.6 -80% | 491.6 -5% | 1633 216% |
| Write Seq (MB/s) | 185.1 | 156.3 -16% | 96.3 -48% | 391.1 111% | 1579 753% |
| Read 512 (MB/s) | 319.3 | 435.6 36% | 30.33 -91% | 352.8 10% | 1068 234% |
| Write 512 (MB/s) | 179.5 | 156.5 -13% | 36.95 -79% | 371.7 107% | 1570 775% |
| Read 4k (MB/s) | 20.99 | 36.89 76% | 0.358 -98% | 29.89 42% | 50.4 140% |
| Write 4k (MB/s) | 68.3 | 96.9 42% | 0.815 -99% | 37.75 -45% | 128.6 88% |
| Read 4k QD32 (MB/s) | 144.6 | 358.8 148% | 0.679 -100% | 338.7 134% | 534 269% |
| Write 4k QD32 (MB/s) | 169.8 | 138.9 -18% | 0.79 -100% | 278 64% | 344 103% |

GPU Performance
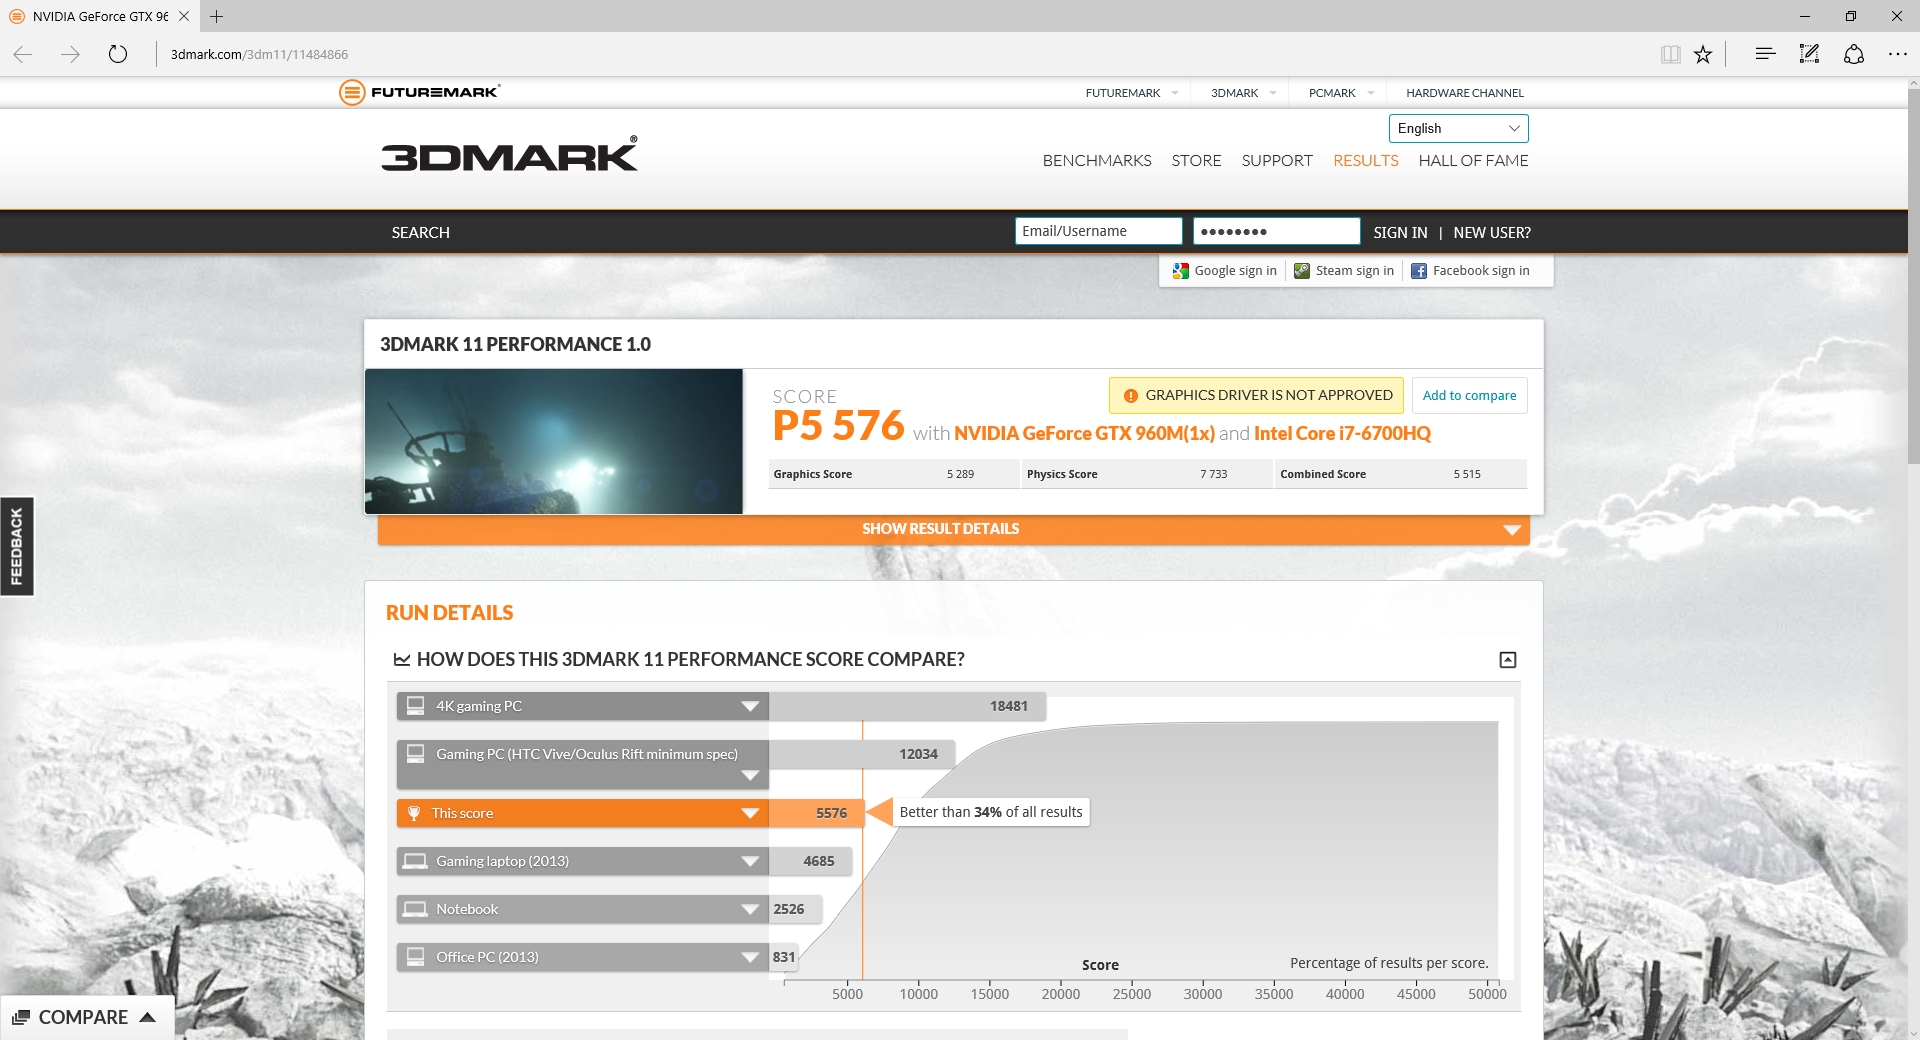
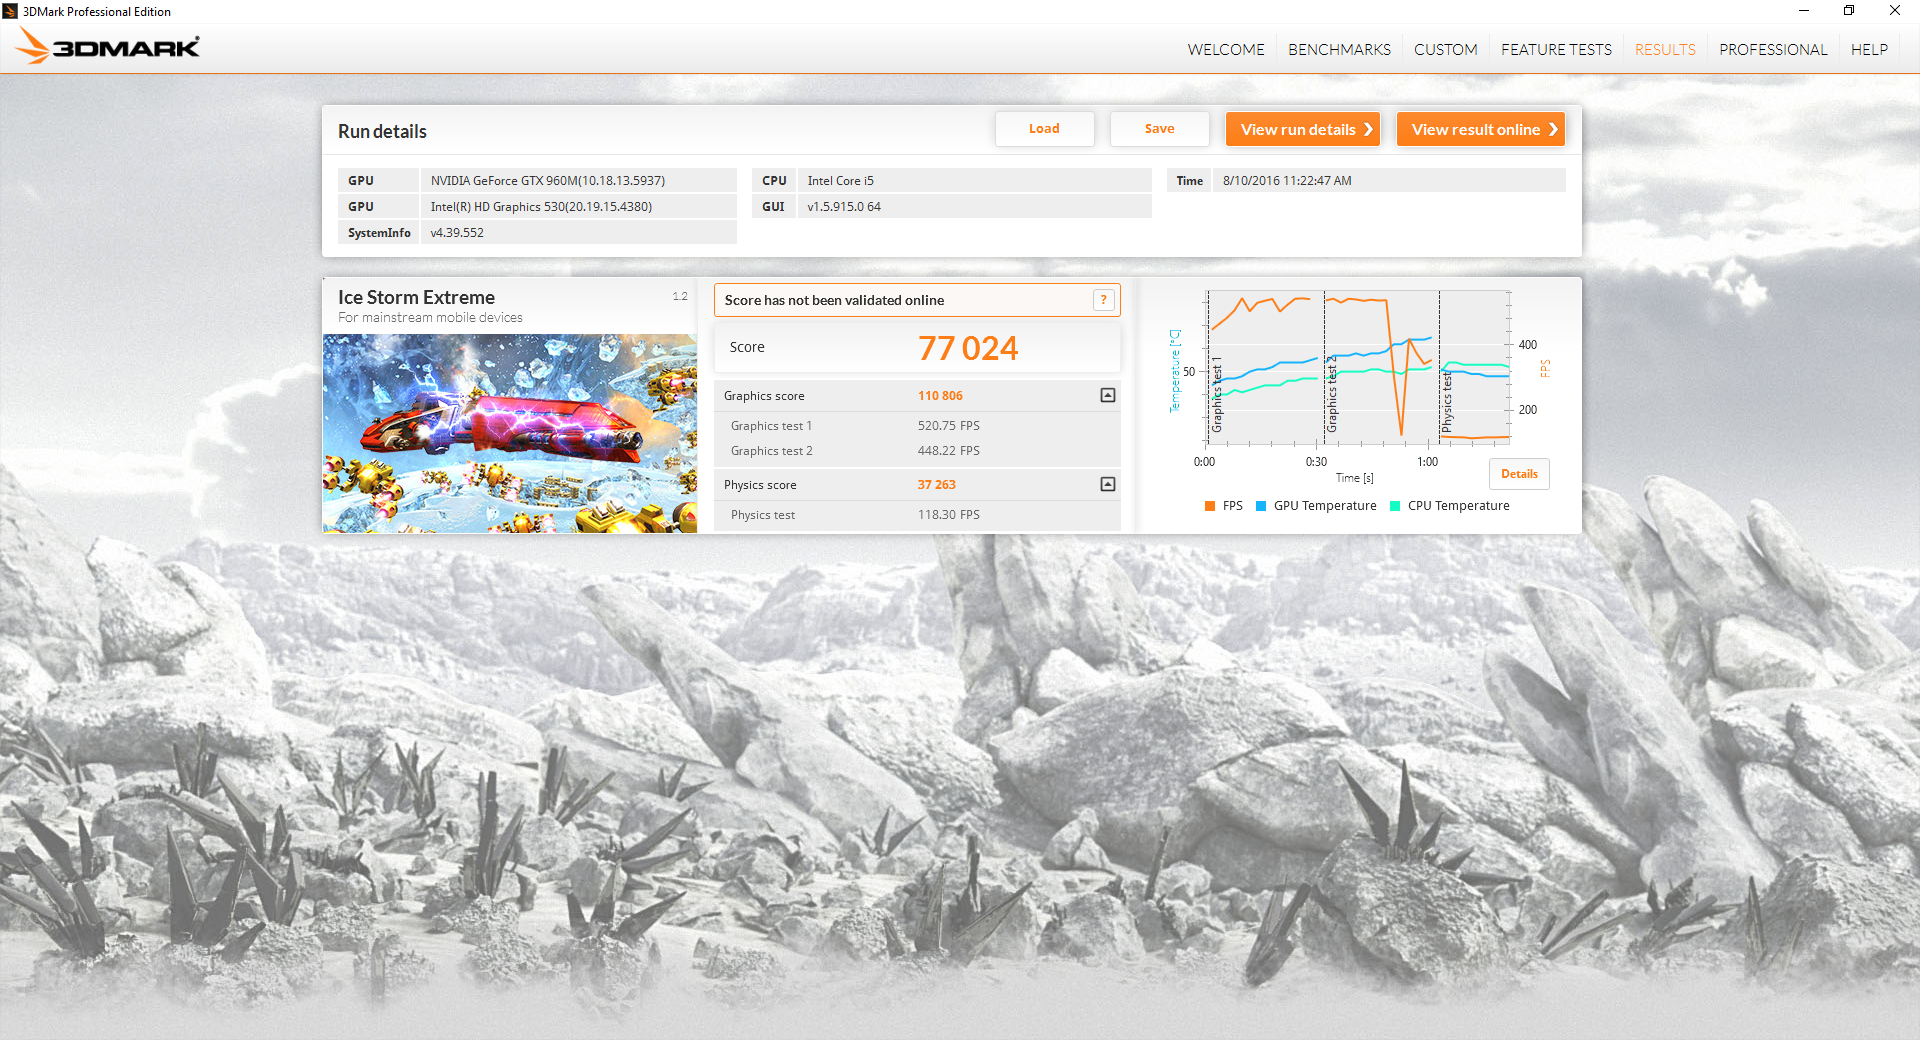
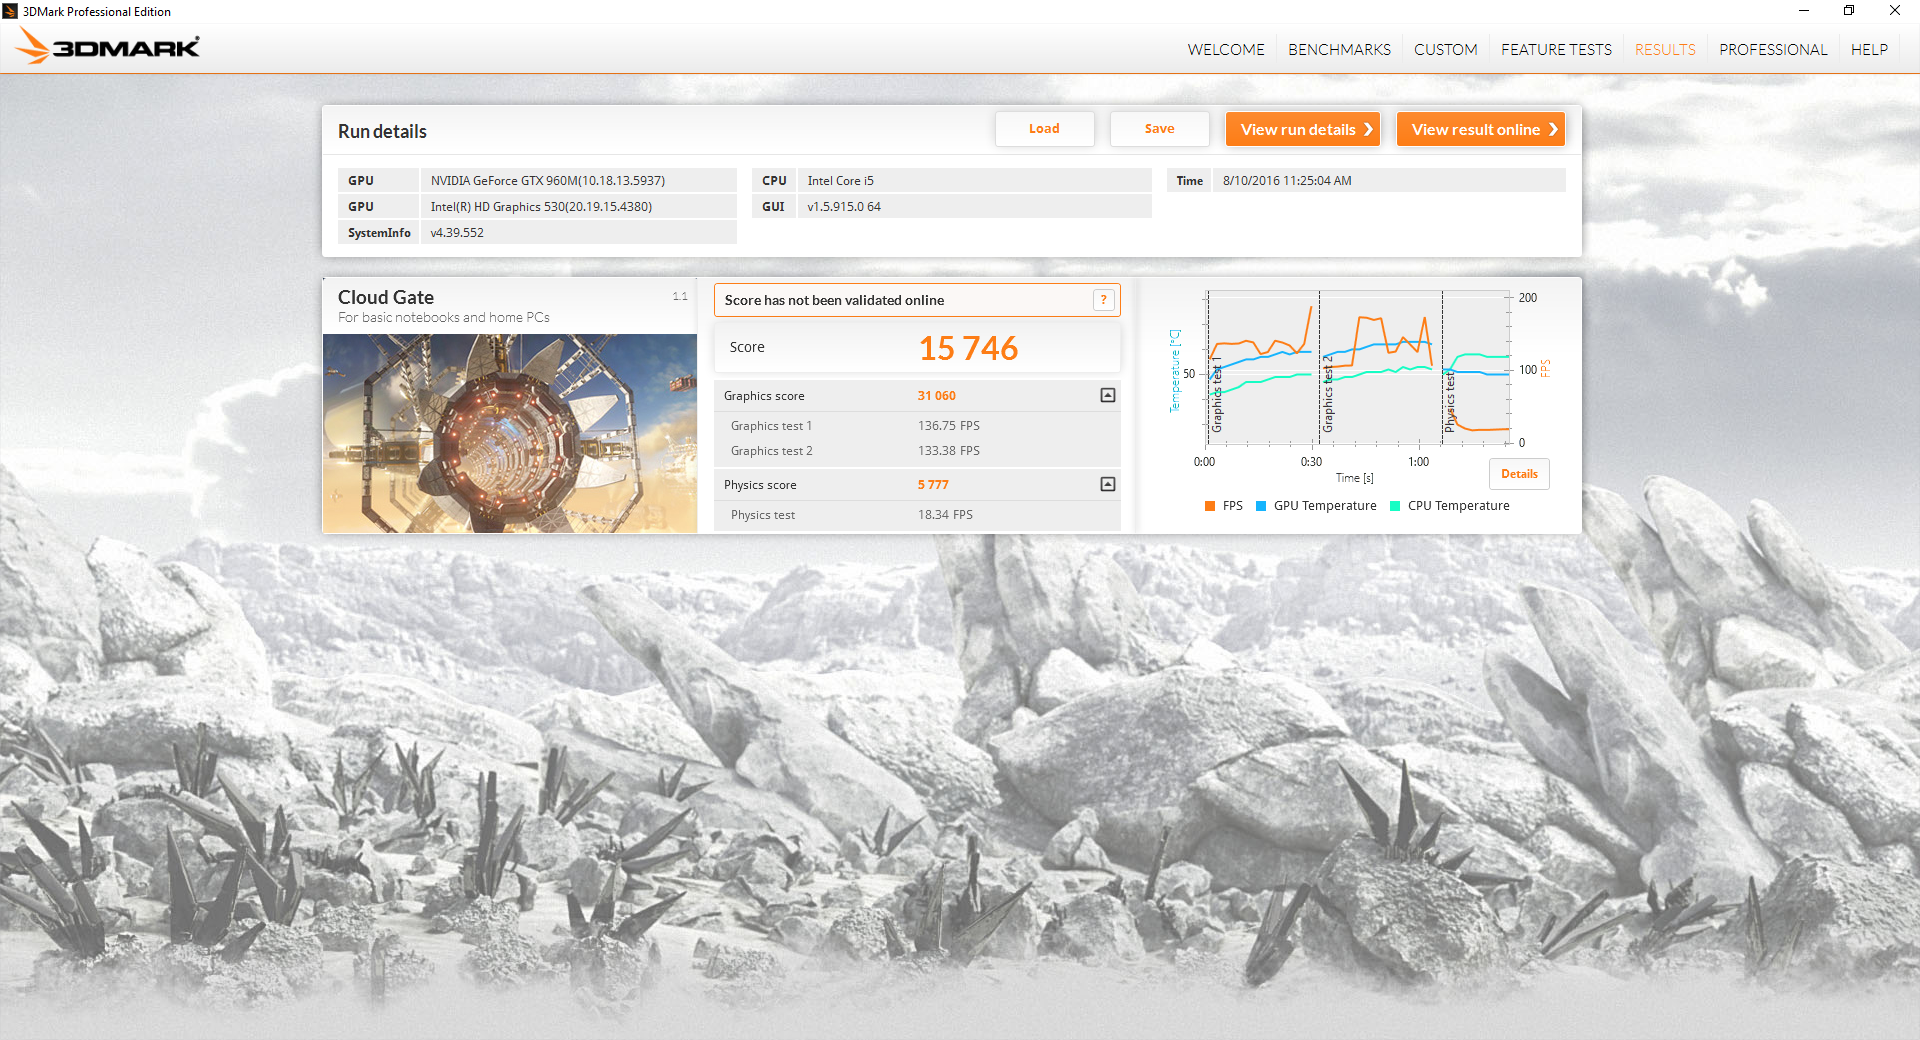
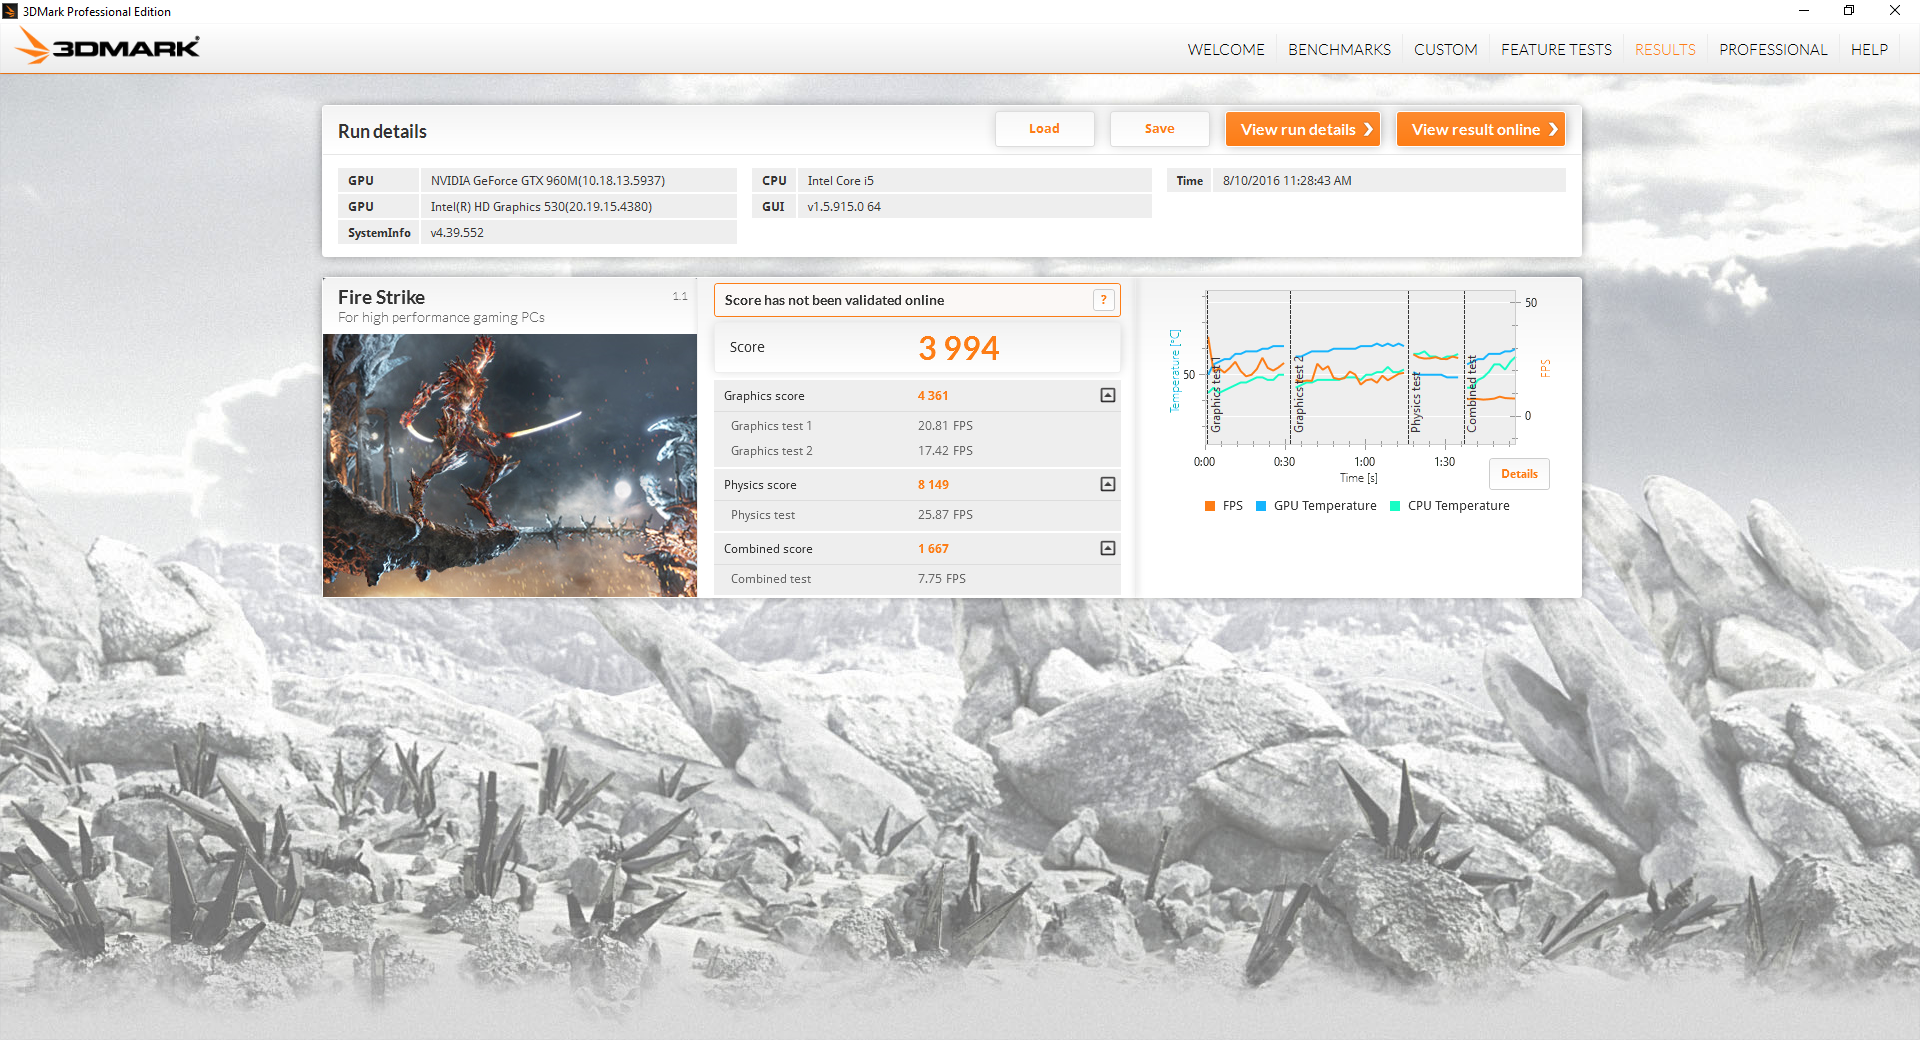
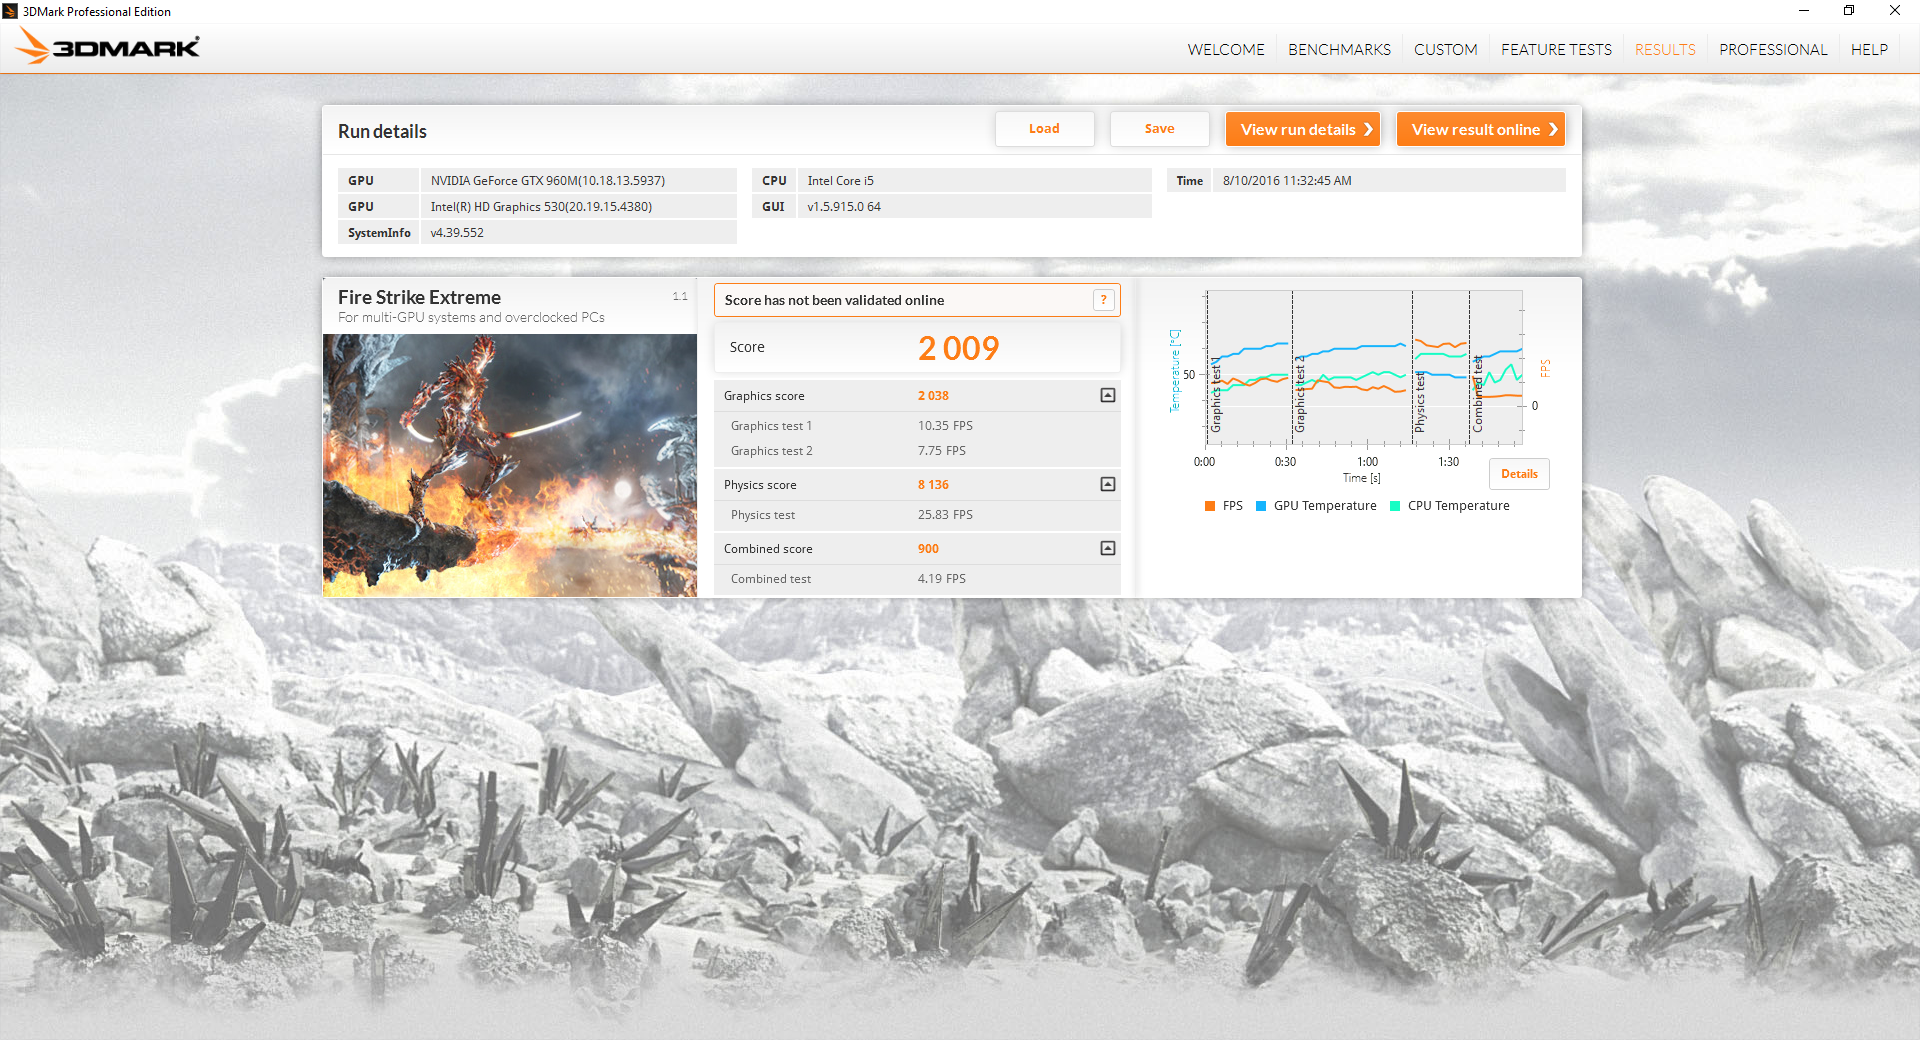
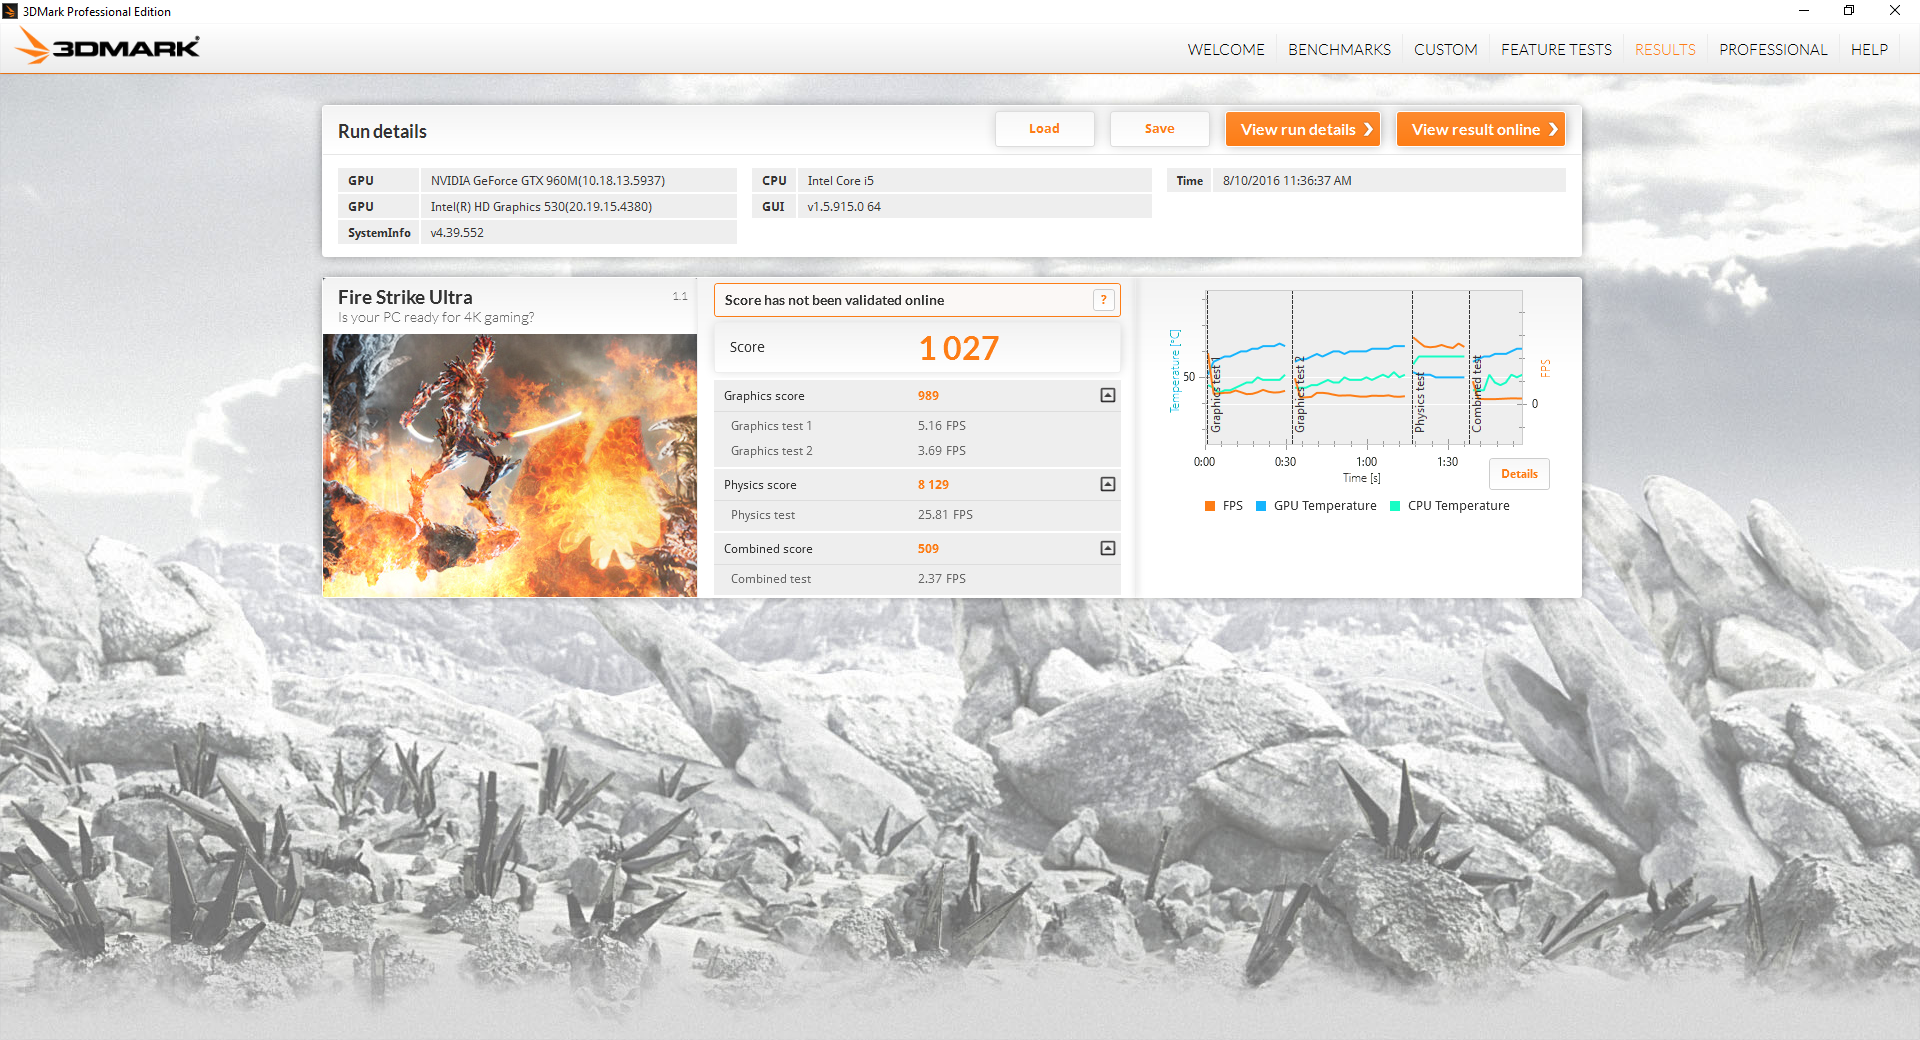
Raw performance from the GTX 960M is predictably in between the GTX 950M and GTX 965M according to 3DMark benchmarks. Thus, users need not worry about any artificial throttling or an under-performing GPU. 3DMark benchmarks are also essentially identical to the Lenovo Y700 gaming notebook with the same i7-6700HQ CPU and GTX 960M GPU. Making the jump to a GTX 980M will bring over twice the raw graphics horsepower for those who want a more capable gaming machine.
| 3DMark 11 | |
| 1280x720 Performance GPU | |
| Asus Strix GL502VY-DS71 | |
| Asus Strix GL502VT-DS74 | |
| HP Omen 17-w010ng | |
| Lenovo Y700-15 80NV004LPB | |
| HP Pavilion 17 FHD V3A33AV | |
| MSI PX60 6QD | |
| 1280x720 Performance Combined | |
| Asus Strix GL502VY-DS71 | |
| Asus Strix GL502VT-DS74 | |
| HP Omen 17-w010ng | |
| Lenovo Y700-15 80NV004LPB | |
| HP Pavilion 17 FHD V3A33AV | |
| MSI PX60 6QD | |
| 3DMark | |
| 1920x1080 Fire Strike Graphics | |
| Asus Strix GL502VY-DS71 | |
| Asus Strix GL502VT-DS74 | |
| HP Omen 17-w010ng | |
| Lenovo Y700-15 80NV004LPB | |
| HP Pavilion 17 FHD V3A33AV | |
| MSI PX60 6QD | |
| Fire Strike Extreme Graphics | |
| Asus Strix GL502VY-DS71 | |
| Asus Strix GL502VT-DS74 | |
| HP Pavilion 17 FHD V3A33AV | |
| 3DMark 11 Performance | 5576 points | |
| 3DMark Ice Storm Standard Score | 80214 points | |
| 3DMark Cloud Gate Standard Score | 15746 points | |
| 3DMark Fire Strike Score | 3994 points | |
| 3DMark Fire Strike Extreme Score | 2009 points | |
Help | ||
Gaming Performance
The GTX 960M remains a capable solution for 1080p gaming despite the launch of mobile Pascal. Players who are satisfied with 30 FPS can play most titles on High settings, though the more intensive titles should be played on Medium settings instead.
See our dedicated GPU page on the GTX 960M for more technical information and benchmark comparisons.
| BioShock Infinite - 1920x1080 Ultra Preset, DX11 (DDOF) | |
| Asus Strix GL502VY-DS71 | |
| Asus Strix GL502VT-DS74 | |
| Gigabyte P55K v5 | |
| HP Pavilion 17 FHD V3A33AV | |
| MSI PX60 6QD | |
| Sleeping Dogs - 1920x1080 Extreme Preset AA:Extreme | |
| Asus Strix GL502VY-DS71 | |
| Asus Strix GL502VT-DS74 | |
| Gigabyte P55K v5 | |
| HP Pavilion 17 FHD V3A33AV | |
| Metro: Last Light - 1920x1080 Very High (DX11) AF:16x | |
| Asus Strix GL502VT-DS74 | |
| Gigabyte P55K v5 | |
| HP Pavilion 17 FHD V3A33AV | |
| Thief - 1920x1080 Very High Preset AA:FXAA & High SS AF:8x | |
| Asus Strix GL502VY-DS71 | |
| Asus Strix GL502VT-DS74 | |
| Gigabyte P55K v5 | |
| HP Pavilion 17 FHD V3A33AV | |
| Batman: Arkham Knight - 1920x1080 High / On AA:SM AF:16x | |
| Asus Strix GL502VT-DS74 | |
| Gigabyte P55K v5 | |
| HP Pavilion 17 FHD V3A33AV | |
| Metal Gear Solid V - 1920x1080 Extra High / On | |
| Asus Strix GL502VT-DS74 | |
| Asus Strix GL502VY-DS71 | |
| Gigabyte P55K v5 | |
| HP Pavilion 17 FHD V3A33AV | |
| Fallout 4 - 1920x1080 Ultra Preset AA:T AF:16x | |
| Asus Strix GL502VY-DS71 | |
| Asus Strix GL502VT-DS74 | |
| Gigabyte P55K v5 | |
| HP Pavilion 17 FHD V3A33AV | |
| Rise of the Tomb Raider - 1920x1080 Very High Preset AA:FX AF:16x | |
| Asus Strix GL502VY-DS71 | |
| Asus Strix GL502VT-DS74 | |
| Gigabyte P55K v5 | |
| HP Pavilion 17 FHD V3A33AV | |
| low | med. | high | ultra | |
|---|---|---|---|---|
| Sleeping Dogs (2012) | 91.3 | 24.3 | ||
| BioShock Infinite (2013) | 117.9 | 45 | ||
| Metro: Last Light (2013) | 59.3 | 31.2 | ||
| Thief (2014) | 55.5 | 28.4 | ||
| Batman: Arkham Knight (2015) | 34 | 23 | ||
| Metal Gear Solid V (2015) | 56.1 | 37.9 | ||
| Fallout 4 (2015) | 30.6 | 24.5 | ||
| Rise of the Tomb Raider (2016) | 30.2 | 24.2 | ||
| Overwatch (2016) | 39.4 |
Stress Test
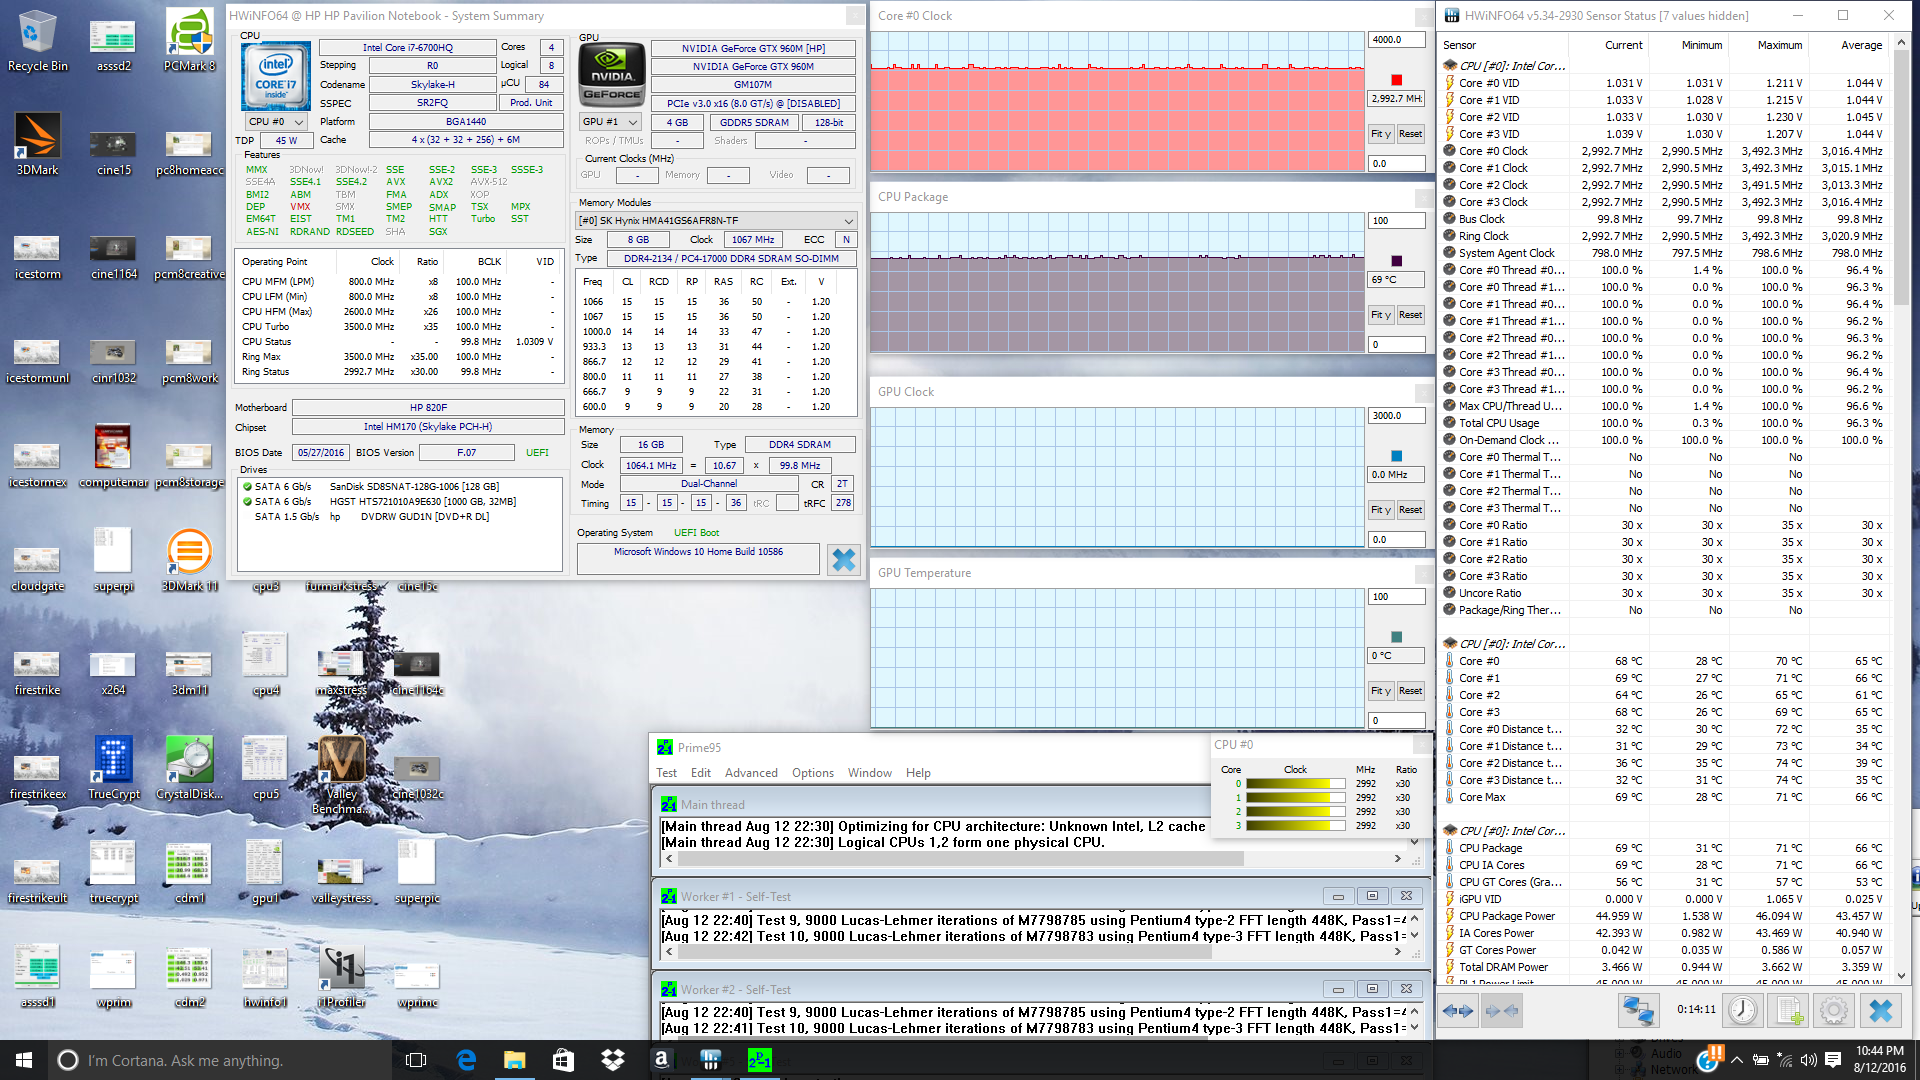
We subject the Pavilion 17 to maximum unrealistic workloads to test for stability and potential throttling issues. When under Prime95 stress, the CPU is able to maintain a Turbo Boost clock rate of 3.0 GHz compared to its advertised 3.1 GHz maximum and at a stable operating temperature of about 70 C. Running both Prime95 and FurMark will bump both the CPU and GPU down to their respective base clock rates of 2.6 GHz and 1097 MHz. Fortunately, both processors are able to run and maintain Turbo clock rates under Unigine Valley load with stable core temperatures below 70 C each.
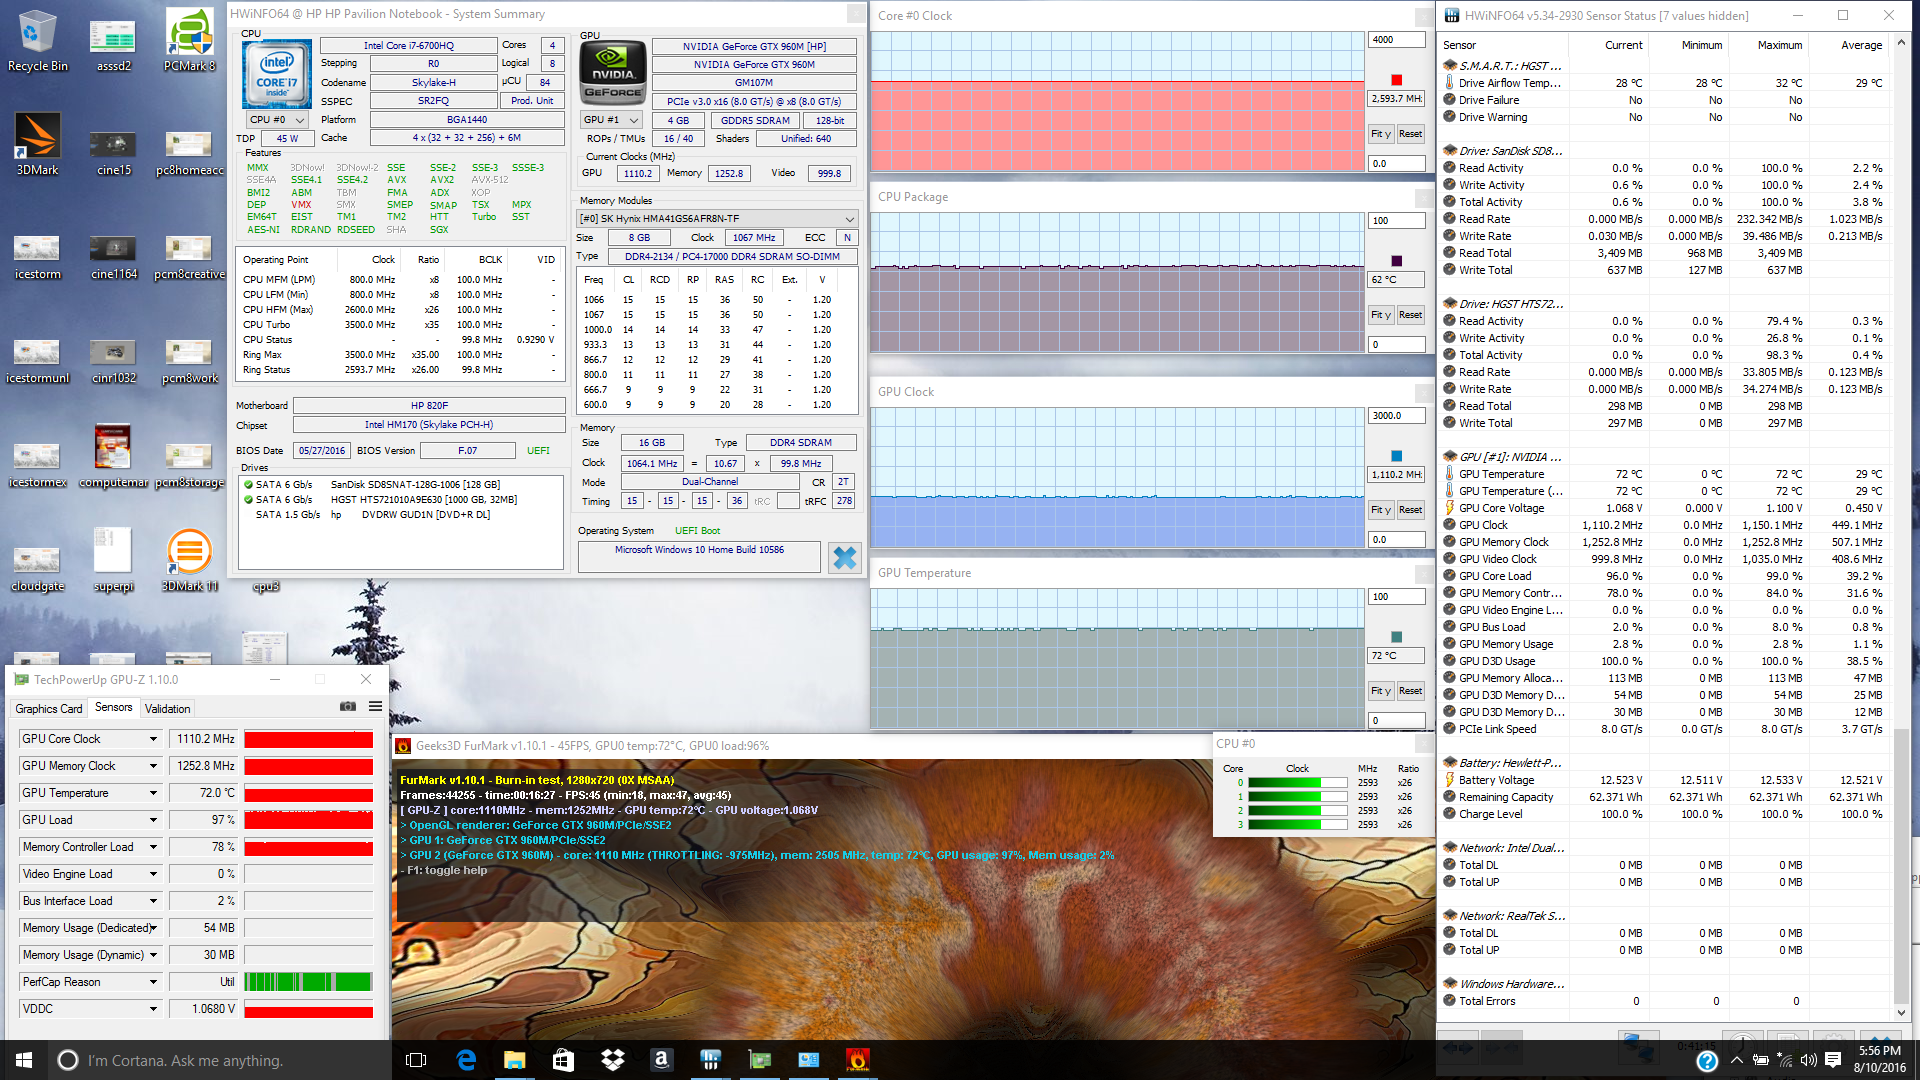
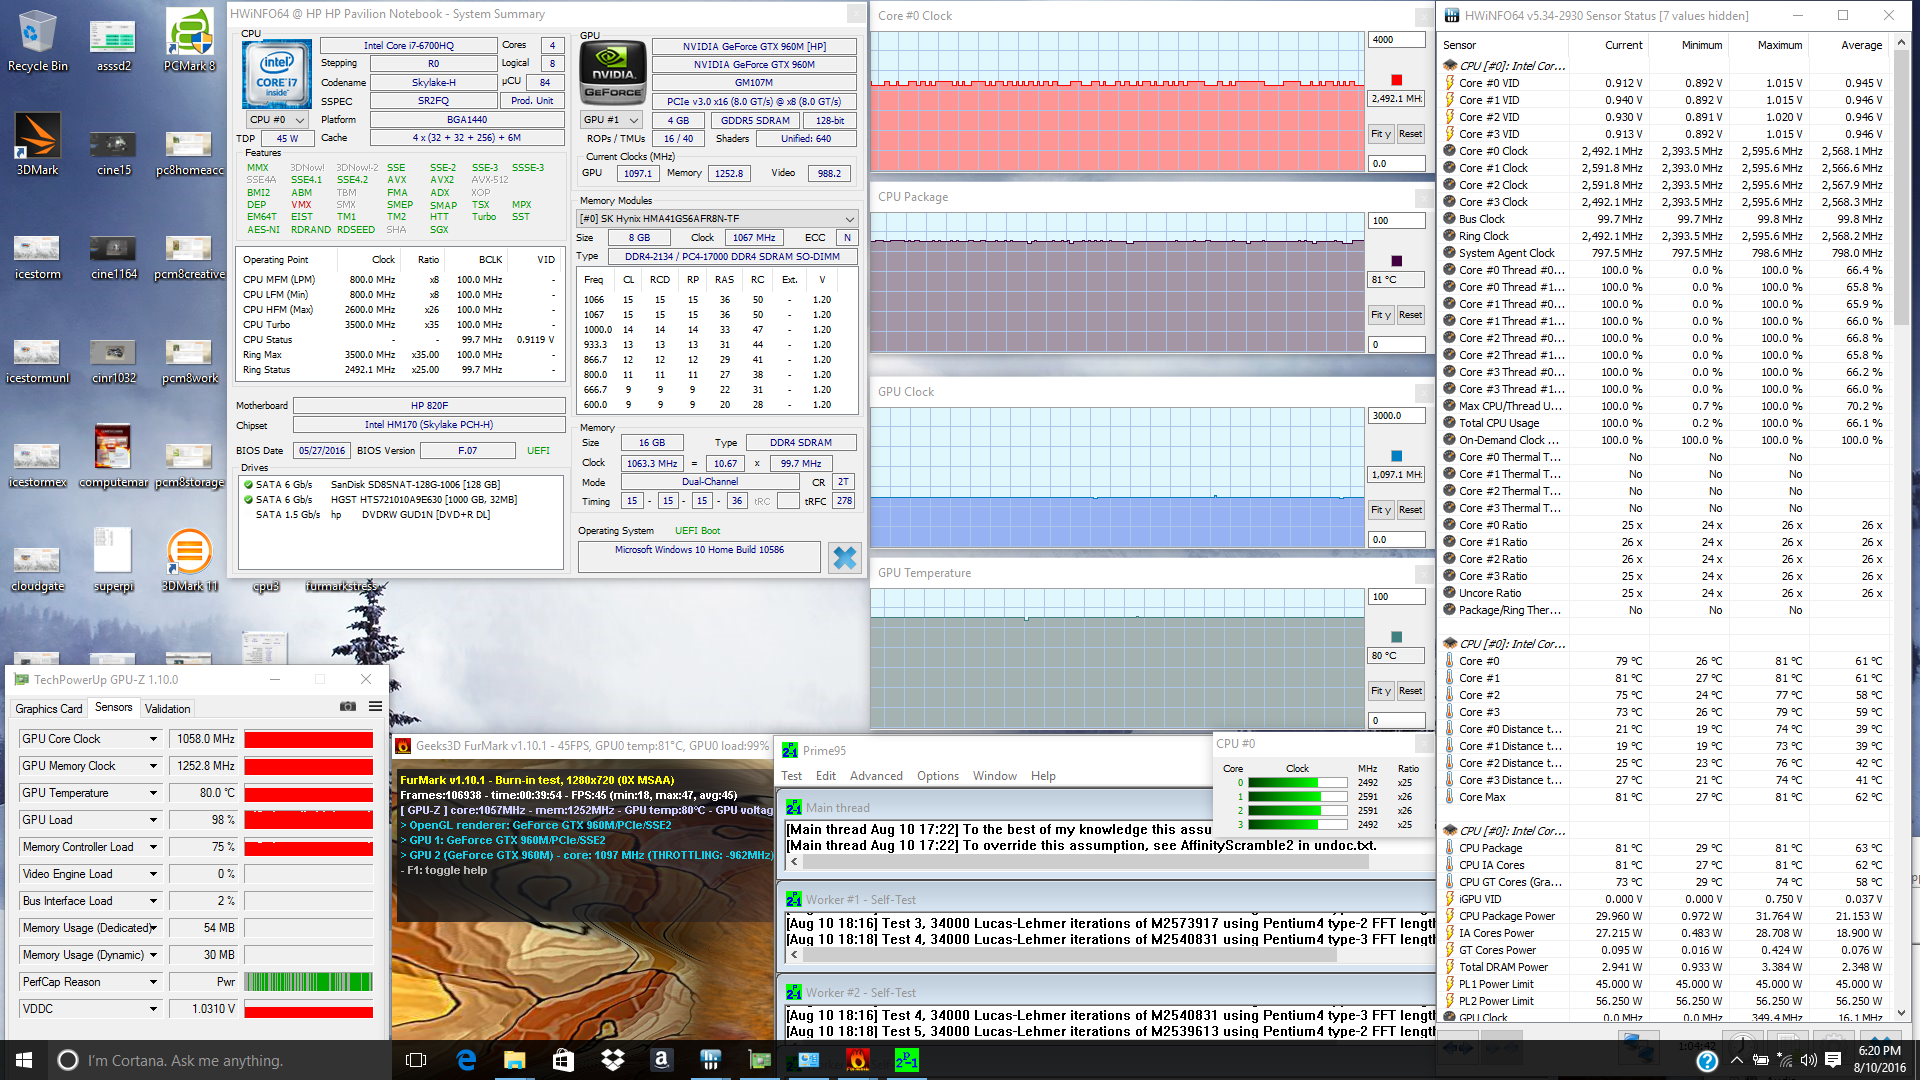
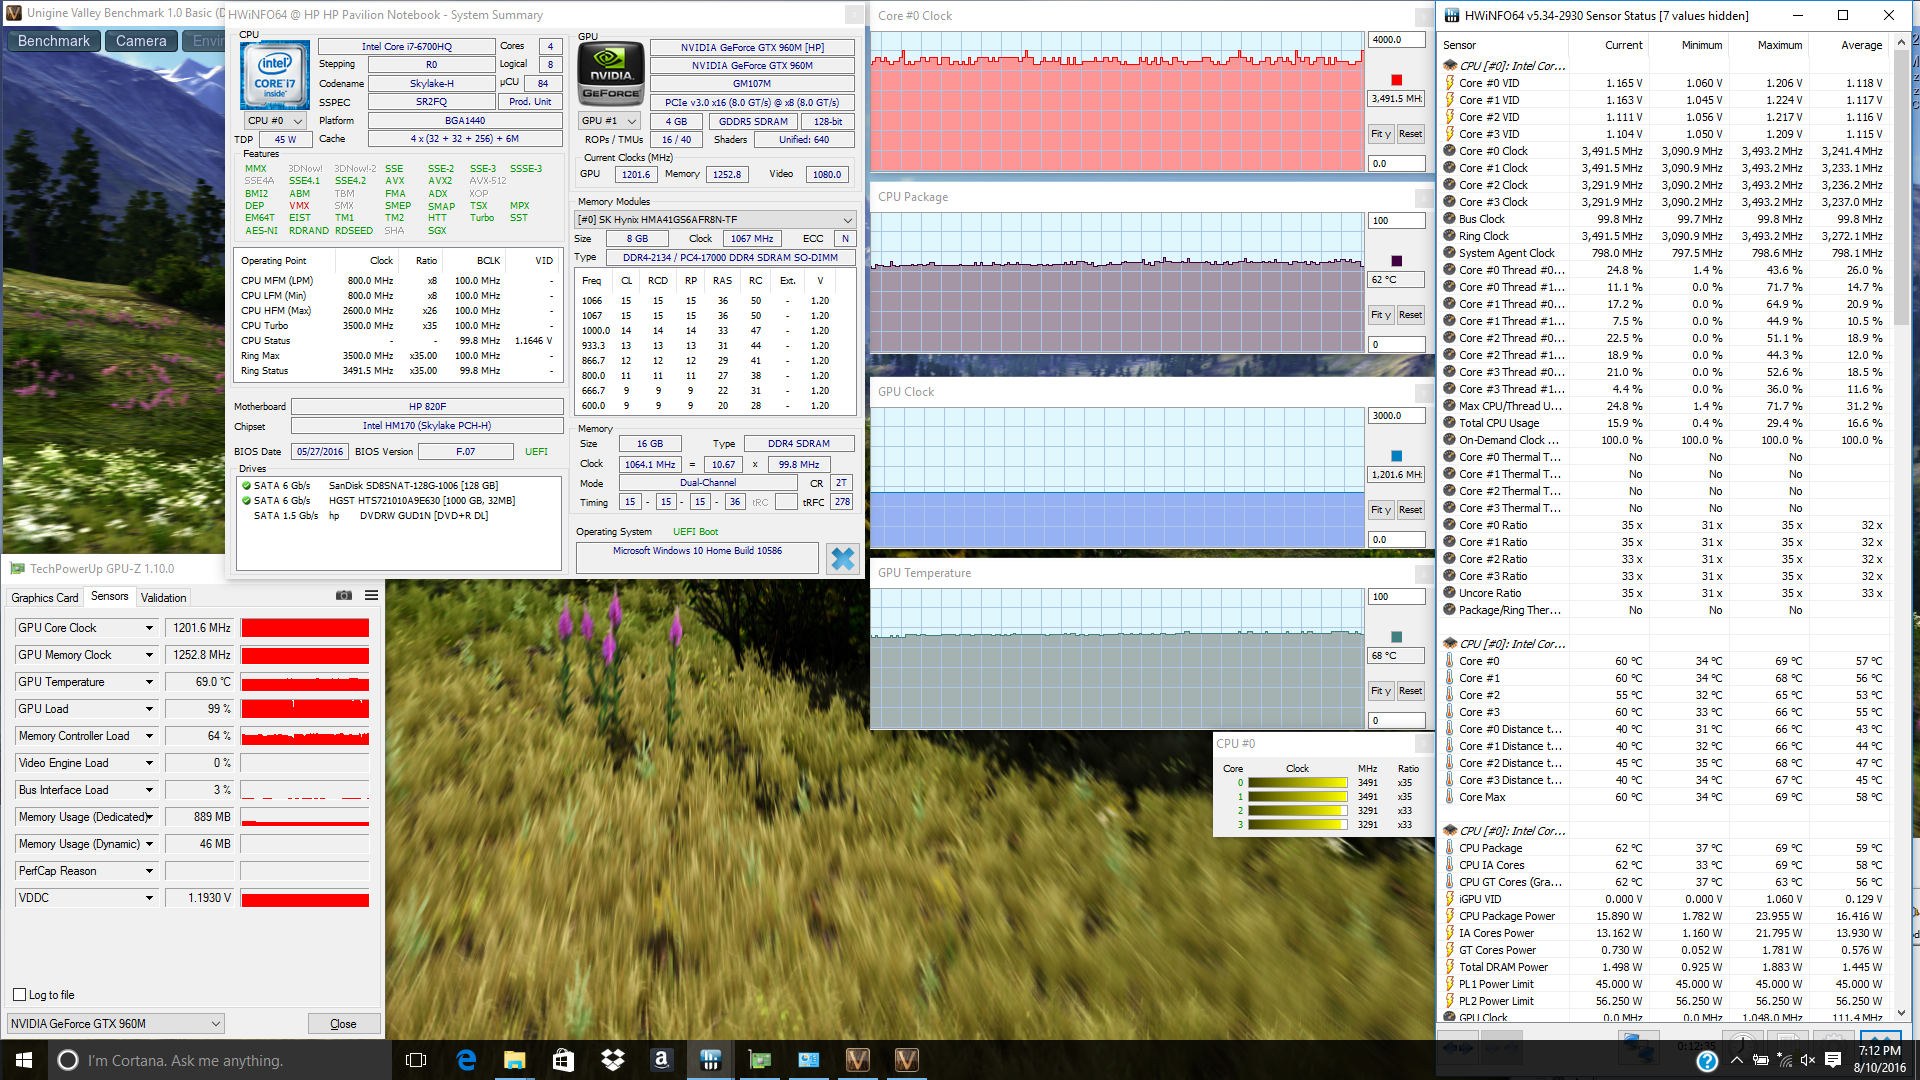
| CPU Clock (GHz) | GPU Clock (MHz) | Average CPU Temperature (°C) | Average GPU Temperature (°C) | |
| Prime95 Stress | 3.0 - 3.1 | -- | 69 | -- |
| FurMark Stress | -- | 1110 | 62 | 72 |
| Prime95 + FurMark Stress | 2.5 - 2.6 | 1097 | 81 | 80 |
| Unigine Valley Stress | 3.3+ | 1202 | 62 | 68 |
Emissions
System Noise
We were afraid of loud fan noise after testing out the Pavilion 15 and were hoping to not discover similar results with this 17-inch version. Unfortunately, the Pavilion 17 is also a noisy machine as its single system fan is always active and audible when under quiet ambient conditions. In fact, its cooling system is not very large to begin with and is shared equally between the CPU and GPU, so the higher fan noise is likely a compensation. Fan noise when idling is even louder than most gaming systems under similar conditions, which is unacceptable for a GTX 960M GPU. Expect gaming loads to be even louder at about 45 dB(A), so earphones are recommended to drown out the noise as much as possible.
On the bright side, the fan does not pulsate when word processing or browsing and will generally remain at its minimum fan noise during low loads.
Noise level
| Idle |
| 34.6 / 34.8 / 35.5 dB(A) |
| DVD |
| 39.4 / dB(A) |
| Load |
| 45.4 / 52.3 dB(A) |
 | ||
30 dB silent 40 dB(A) audible 50 dB(A) loud |
||
min: | ||
| HP Pavilion 17 FHD V3A33AV GeForce GTX 960M, 6700HQ, SanDisk Z400s SD8SNAT-128G | Lenovo Ideapad Y700-17 80QK7709PB GeForce GTX 960M, 6700HQ, Samsung SSD 850 EVO 500GB | HP Pavilion 17-g120ng GeForce 940M, 6500U, Toshiba MQ01ABD100 | Gigabyte P57W GeForce GTX 970M, 6700HQ, Lite-On IT L8T-256L9G | Asus ZenBook Pro UX501VW-DS71T GeForce GTX 960M, 6700HQ, Samsung SM951 MZVPV512HDGL m.2 PCI-e | |
|---|---|---|---|---|---|
| Noise | 9% | 5% | 6% | 14% | |
| off / environment * (dB) | 29 | 30 -3% | |||
| Idle Minimum * (dB) | 34.6 | 31.4 9% | 33.5 3% | 32 8% | 28.9 16% |
| Idle Average * (dB) | 34.8 | 31.4 10% | 33.5 4% | 33 5% | 28.9 17% |
| Idle Maximum * (dB) | 35.5 | 34.3 3% | 33.5 6% | 37 -4% | 30.2 15% |
| Load Average * (dB) | 45.4 | 41.3 9% | 45 1% | 37 19% | 41.8 8% |
| Load Maximum * (dB) | 52.3 | 44 16% | 47 10% | 47 10% | 43.9 16% |
* ... smaller is better
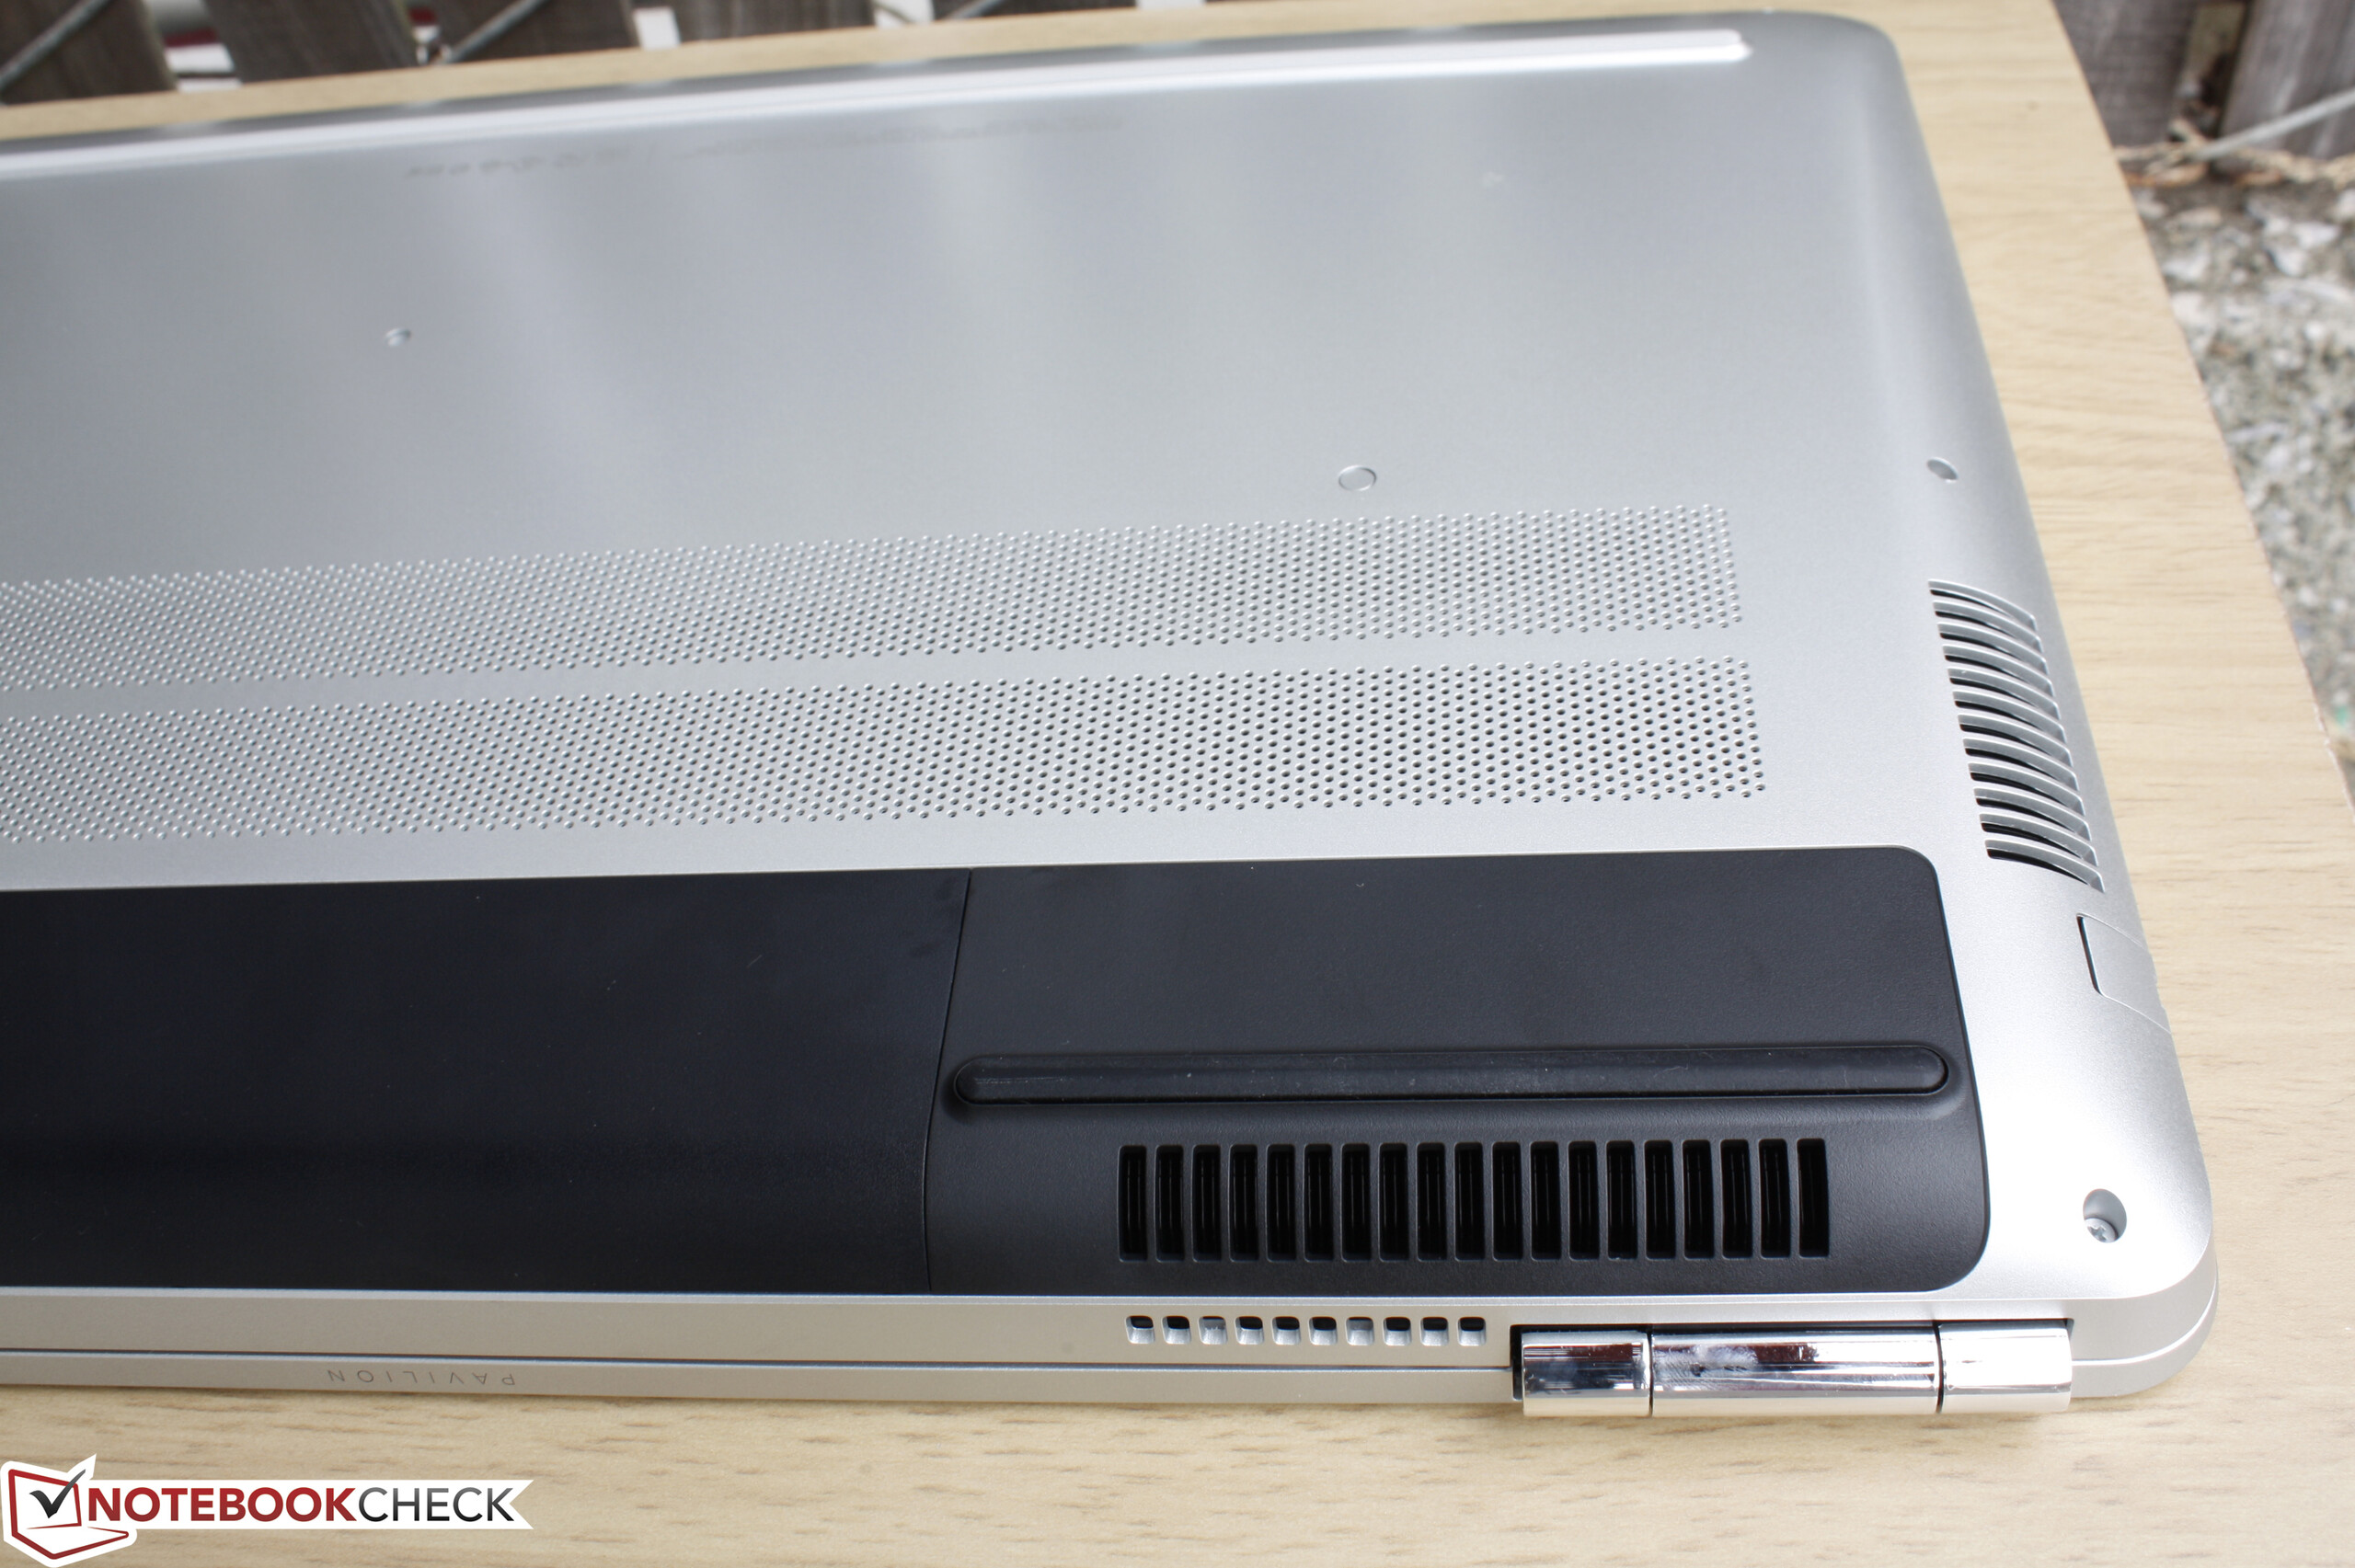
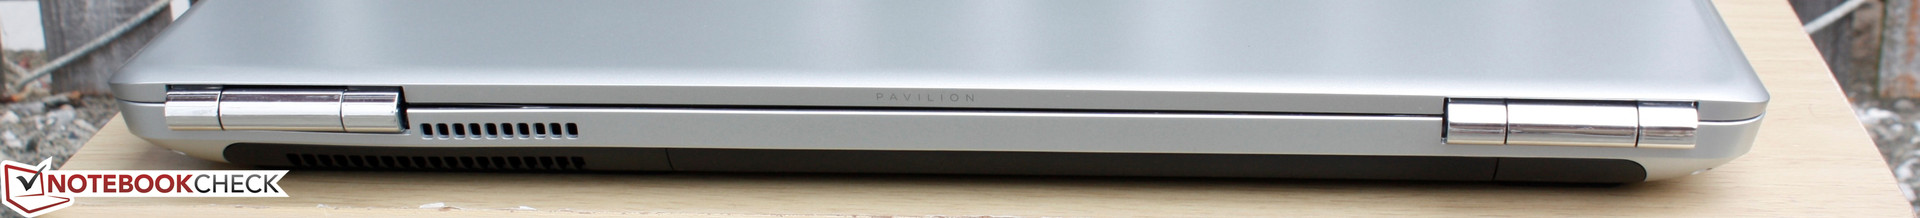
Temperature
Due to the design and orientation of the heat pipes, temperatures are warmer near the center of the notebook and on surfaces that are closer to the right corner exhaust grilles. The center of the keyboard can be as warm as 49 C under extreme (and unrealistic) processing conditions while the surrounding palm rests and WASD and NumPad keys remain much cooler in comparison. It's easy to notice the keyboard becoming warmer during use, but it fortunately never reaches uncomfortable levels even when gaming. Nonetheless, the HP runs slightly cooler than the Zenbook UX501 and warmer than the Lenovo Y700 on average.
Surface temperatures are flat on both sides when idling or during very low loads.
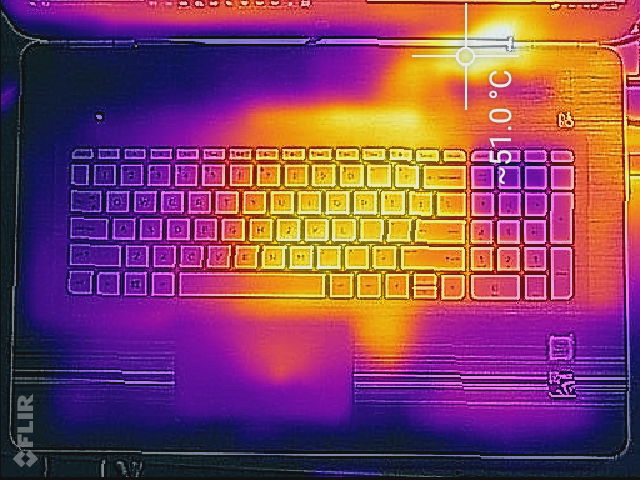
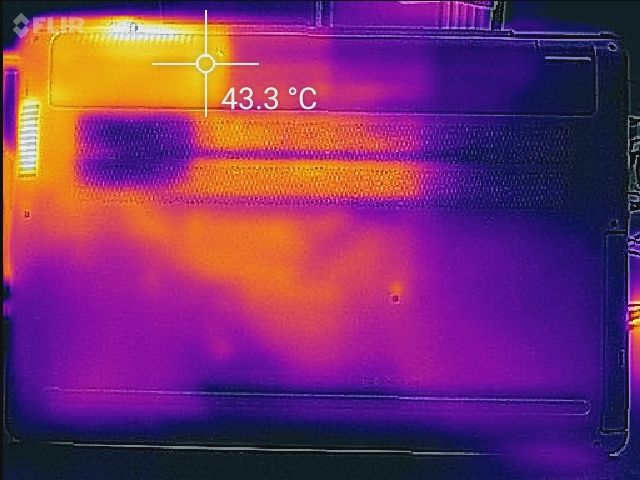
(-) The maximum temperature on the upper side is 50 °C / 122 F, compared to the average of 40.4 °C / 105 F, ranging from 21.2 to 68.8 °C for the class Gaming.
(±) The bottom heats up to a maximum of 44 °C / 111 F, compared to the average of 43.3 °C / 110 F
(+) In idle usage, the average temperature for the upper side is 23.3 °C / 74 F, compared to the device average of 33.9 °C / 93 F.
(+) The palmrests and touchpad are cooler than skin temperature with a maximum of 31.6 °C / 88.9 F and are therefore cool to the touch.
(-) The average temperature of the palmrest area of similar devices was 28.8 °C / 83.8 F (-2.8 °C / -5.1 F).
Speakers
")
Sound quality from the B&O stereo speakers is good compared to smaller notebooks. As a multimedia or gaming notebook, however, it's average at best with no dedicated subwoofer for improved bass reproduction. The chassis reverberates when on higher volume settings, so it is recommended to avoid the maximum volume setting and use earphones or external speakers when possible.
HP Pavilion 17 FHD V3A33AV audio analysis
(-) | not very loud speakers (66 dB)
Analysis not possible as minimum curve is missing or too high
Apple MacBook 12 (Early 2016) 1.1 GHz audio analysis
(+) | speakers can play relatively loud (83.6 dB)
Bass 100 - 315 Hz
(±) | reduced bass - on average 11.3% lower than median
(±) | linearity of bass is average (14.2% delta to prev. frequency)
Mids 400 - 2000 Hz
(+) | balanced mids - only 2.4% away from median
(+) | mids are linear (5.5% delta to prev. frequency)
Highs 2 - 16 kHz
(+) | balanced highs - only 2% away from median
(+) | highs are linear (4.5% delta to prev. frequency)
Overall 100 - 16.000 Hz
(+) | overall sound is linear (10.2% difference to median)
Compared to same class
» 7% of all tested devices in this class were better, 2% similar, 91% worse
» The best had a delta of 5%, average was 18%, worst was 53%
Compared to all devices tested
» 4% of all tested devices were better, 1% similar, 94% worse
» The best had a delta of 4%, average was 24%, worst was 134%
Schenker F516 Flex audio analysis
(-) | not very loud speakers (69 dB)
Analysis not possible as minimum curve is missing or too high
Frequency Comparison (Checkbox select/deselectable!)
Graph 1: Pink Noise 100% Vol.; Graph 2: Audio off
Energy Management
Power Consumption
The system demands just over 5 Watts when idling on the minimum brightness setting and about 12 Watts when idling on maximum brightness and the High Performance profile. Gaming will demand about 70 W, which is very close to the Asus UX501JW with the same GPU and about 20 percent less than the more powerful Gigabyte P57W.
Maximum load with both Prime95 and FurMark simultaneously will draw about 120 W against a power adapter rated for up to 134 W.
| Off / Standby | |
| Idle | |
| Load |
|
Key:
min: | |
| HP Pavilion 17 FHD V3A33AV 6700HQ, GeForce GTX 960M, SanDisk Z400s SD8SNAT-128G, IPS, 1920x1080, 17.3" | Lenovo Ideapad Y700-17 80QK7709PB 6700HQ, GeForce GTX 960M, Samsung SSD 850 EVO 500GB, IPS, 1920x1080, 17.3" | HP Pavilion 17-g120ng 6500U, GeForce 940M, Toshiba MQ01ABD100, IPS, 1920x1080, 17.3" | Gigabyte P57W 6700HQ, GeForce GTX 970M, Lite-On IT L8T-256L9G, IPS, 1920x1080, 17.3" | Asus Zenbook Pro UX501JW-FI218H 4720HQ, GeForce GTX 960M, SanDisk SD7SN3Q128G1002, IPS, 3840x2160, 15.6" | |
|---|---|---|---|---|---|
| Power Consumption | -29% | 22% | -65% | -67% | |
| Idle Minimum * (Watt) | 5.3 | 4.3 19% | 4.8 9% | 11 -108% | 15.6 -194% |
| Idle Average * (Watt) | 10.6 | 13.8 -30% | 10.1 5% | 17 -60% | 20.5 -93% |
| Idle Maximum * (Watt) | 11.8 | 19.8 -68% | 10.4 12% | 22 -86% | 21.2 -80% |
| Load Average * (Watt) | 70.9 | 115.9 -63% | 45.4 36% | 85 -20% | 75.8 -7% |
| Load Maximum * (Watt) | 119.8 | 123.5 -3% | 63 47% | 178 -49% | 72.9 39% |
* ... smaller is better
Battery Life
Runtimes are similar to both the Asus Zenbook UX501 and 17-inch Lenovo Y700 at about 6 hours of constant WLAN runtime. Users can squeeze out almost double the battery life when idling on desktop at the minimum brightness setting, though this is unrepresentative of real-world use. This is above average for a gaming notebook and the Li-Ion battery itself is removable unlike on the smaller Pavilion 15 and most other competitors.
Charging from near empty to full capacity will take approximately 1.5 hours.
| HP Pavilion 17 FHD V3A33AV 6700HQ, GeForce GTX 960M, 62 Wh | Lenovo Ideapad Y700 17ISK 80Q0 6700HQ, GeForce GTX 960M, 60 Wh | HP Pavilion 17-g120ng 6500U, GeForce 940M, 41 Wh | Gigabyte P57W 6700HQ, GeForce GTX 970M, 75.81 Wh | Asus ZenBook Pro UX501VW-DS71T 6700HQ, GeForce GTX 960M, 96 Wh | |
|---|---|---|---|---|---|
| Battery runtime | -8% | -27% | -14% | 6% | |
| Reader / Idle (h) | 12.5 | 11.5 -8% | 7.7 -38% | 11.5 -8% | |
| WiFi v1.3 (h) | 5.9 | 5.6 -5% | 4.3 -27% | 5.6 -5% | 6.3 7% |
| Load (h) | 1.7 | 1.5 -12% | 1.7 0% | 2 18% |
Pros
Cons
Verdict

The latest Pavilion 17 walks a fine line between being a multimedia notebook and a gaming notebook. It's more powerful than what its modest plastic design would otherwise suggest and is relatively portable considering its screen size. This makes the notebook a jack-of-all-trades solution for those who want the larger screen size and Nvidia GTX GPU without compromising too much on weight.
Look beyond the graphics and you have a a fairly barebones notebook. The system is lacking wide connectivity options and high-end features found on other gaming notebooks like G-Sync and a subwoofer and is even lacking some that are found on Ultrabooks like USB Type-C and NVMe. Fan noise is loud even for a gaming notebook due in part to its powerful internals, relatively thin design, and single fan cooling solution. We can only recommend the Pavilion 17 and its GTX 960M GPU if its screen size, portability, price, and graphics power take priority over extra features, serviceability, and fan noise.
HP Pavilion 17 FHD V3A33AV
- 08/16/2016 v5.1 (old)
Allen Ngo
Price comparison
