 Deutsch
 English
 Español
 Français
 Italiano
 Nederlands
 Polski
 Português
 Русский
 Türkçe
 Svenska
 Chinese
 Magyar
Dell Latitude 7490 (i7-8650U, FHD Touchscreen) Laptop Review
Dell's Latitude laptops are popular choices for business and government entities, and with good reason. The line consistently scores well in our tests year after year, thanks mainly to its build quality, good input devices, and wide array of connectivity and security options. The new Latitude 7490 maintains the design of its older brother, the 7480, but the internals have been upgraded. The Latitude 7490 brings Intel's new 8th generation U-class CPUs to Dell's business line. The Kaby Lake R processors herald a major overhaul of Intel's 15 W chips by doubling the core count. The new quad-core design brings significant gains in performance, albeit with some sacrifice to power consumption. We'll compare the new Latitude 7490 to last year's Latitude 7480 to see just how big a leap two more cores allows.
The business market has always been one of the most competitive segments in the world of laptops. As such, we'll see how the Latitude 7490 fares against some of the most common competitors, including Lenovo's 14-inch ThinkPad devices (the T480, 480s, and X1 Carbon), HP's Elitebook 1040 G4, the new ASUSPRO B9440UA from Asus, and the Toshiba Tecra X40D. Let's dive in.
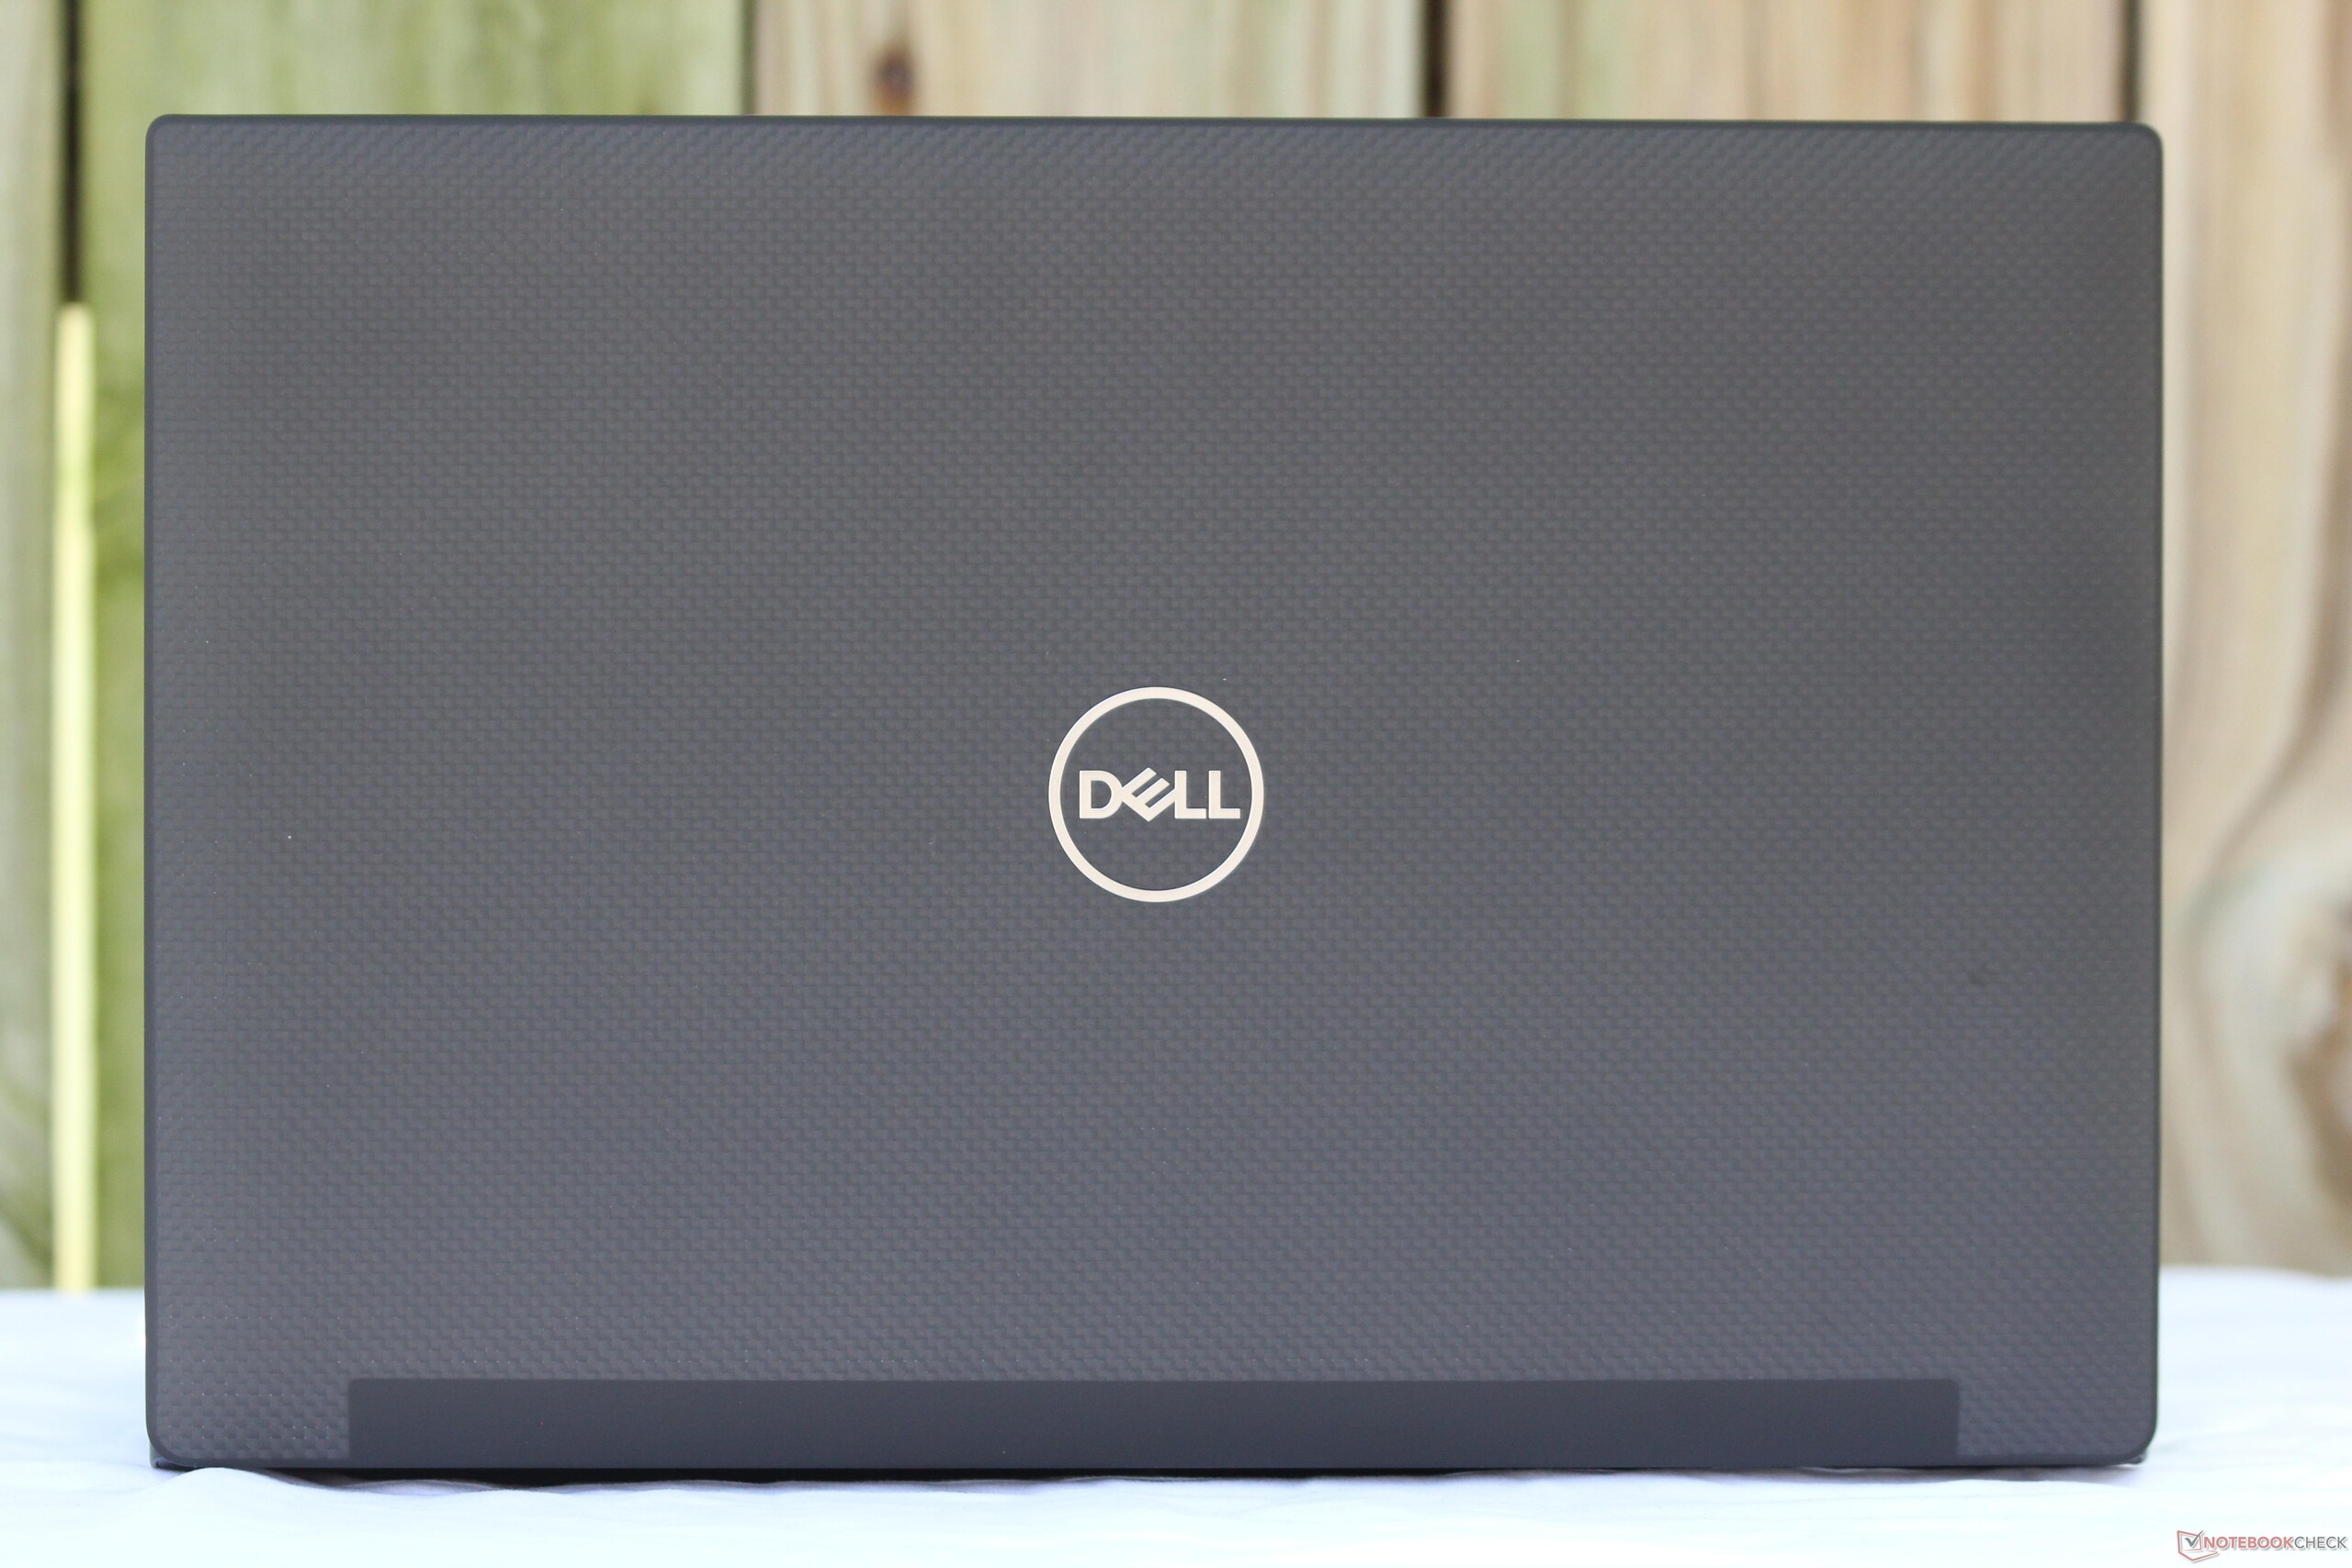
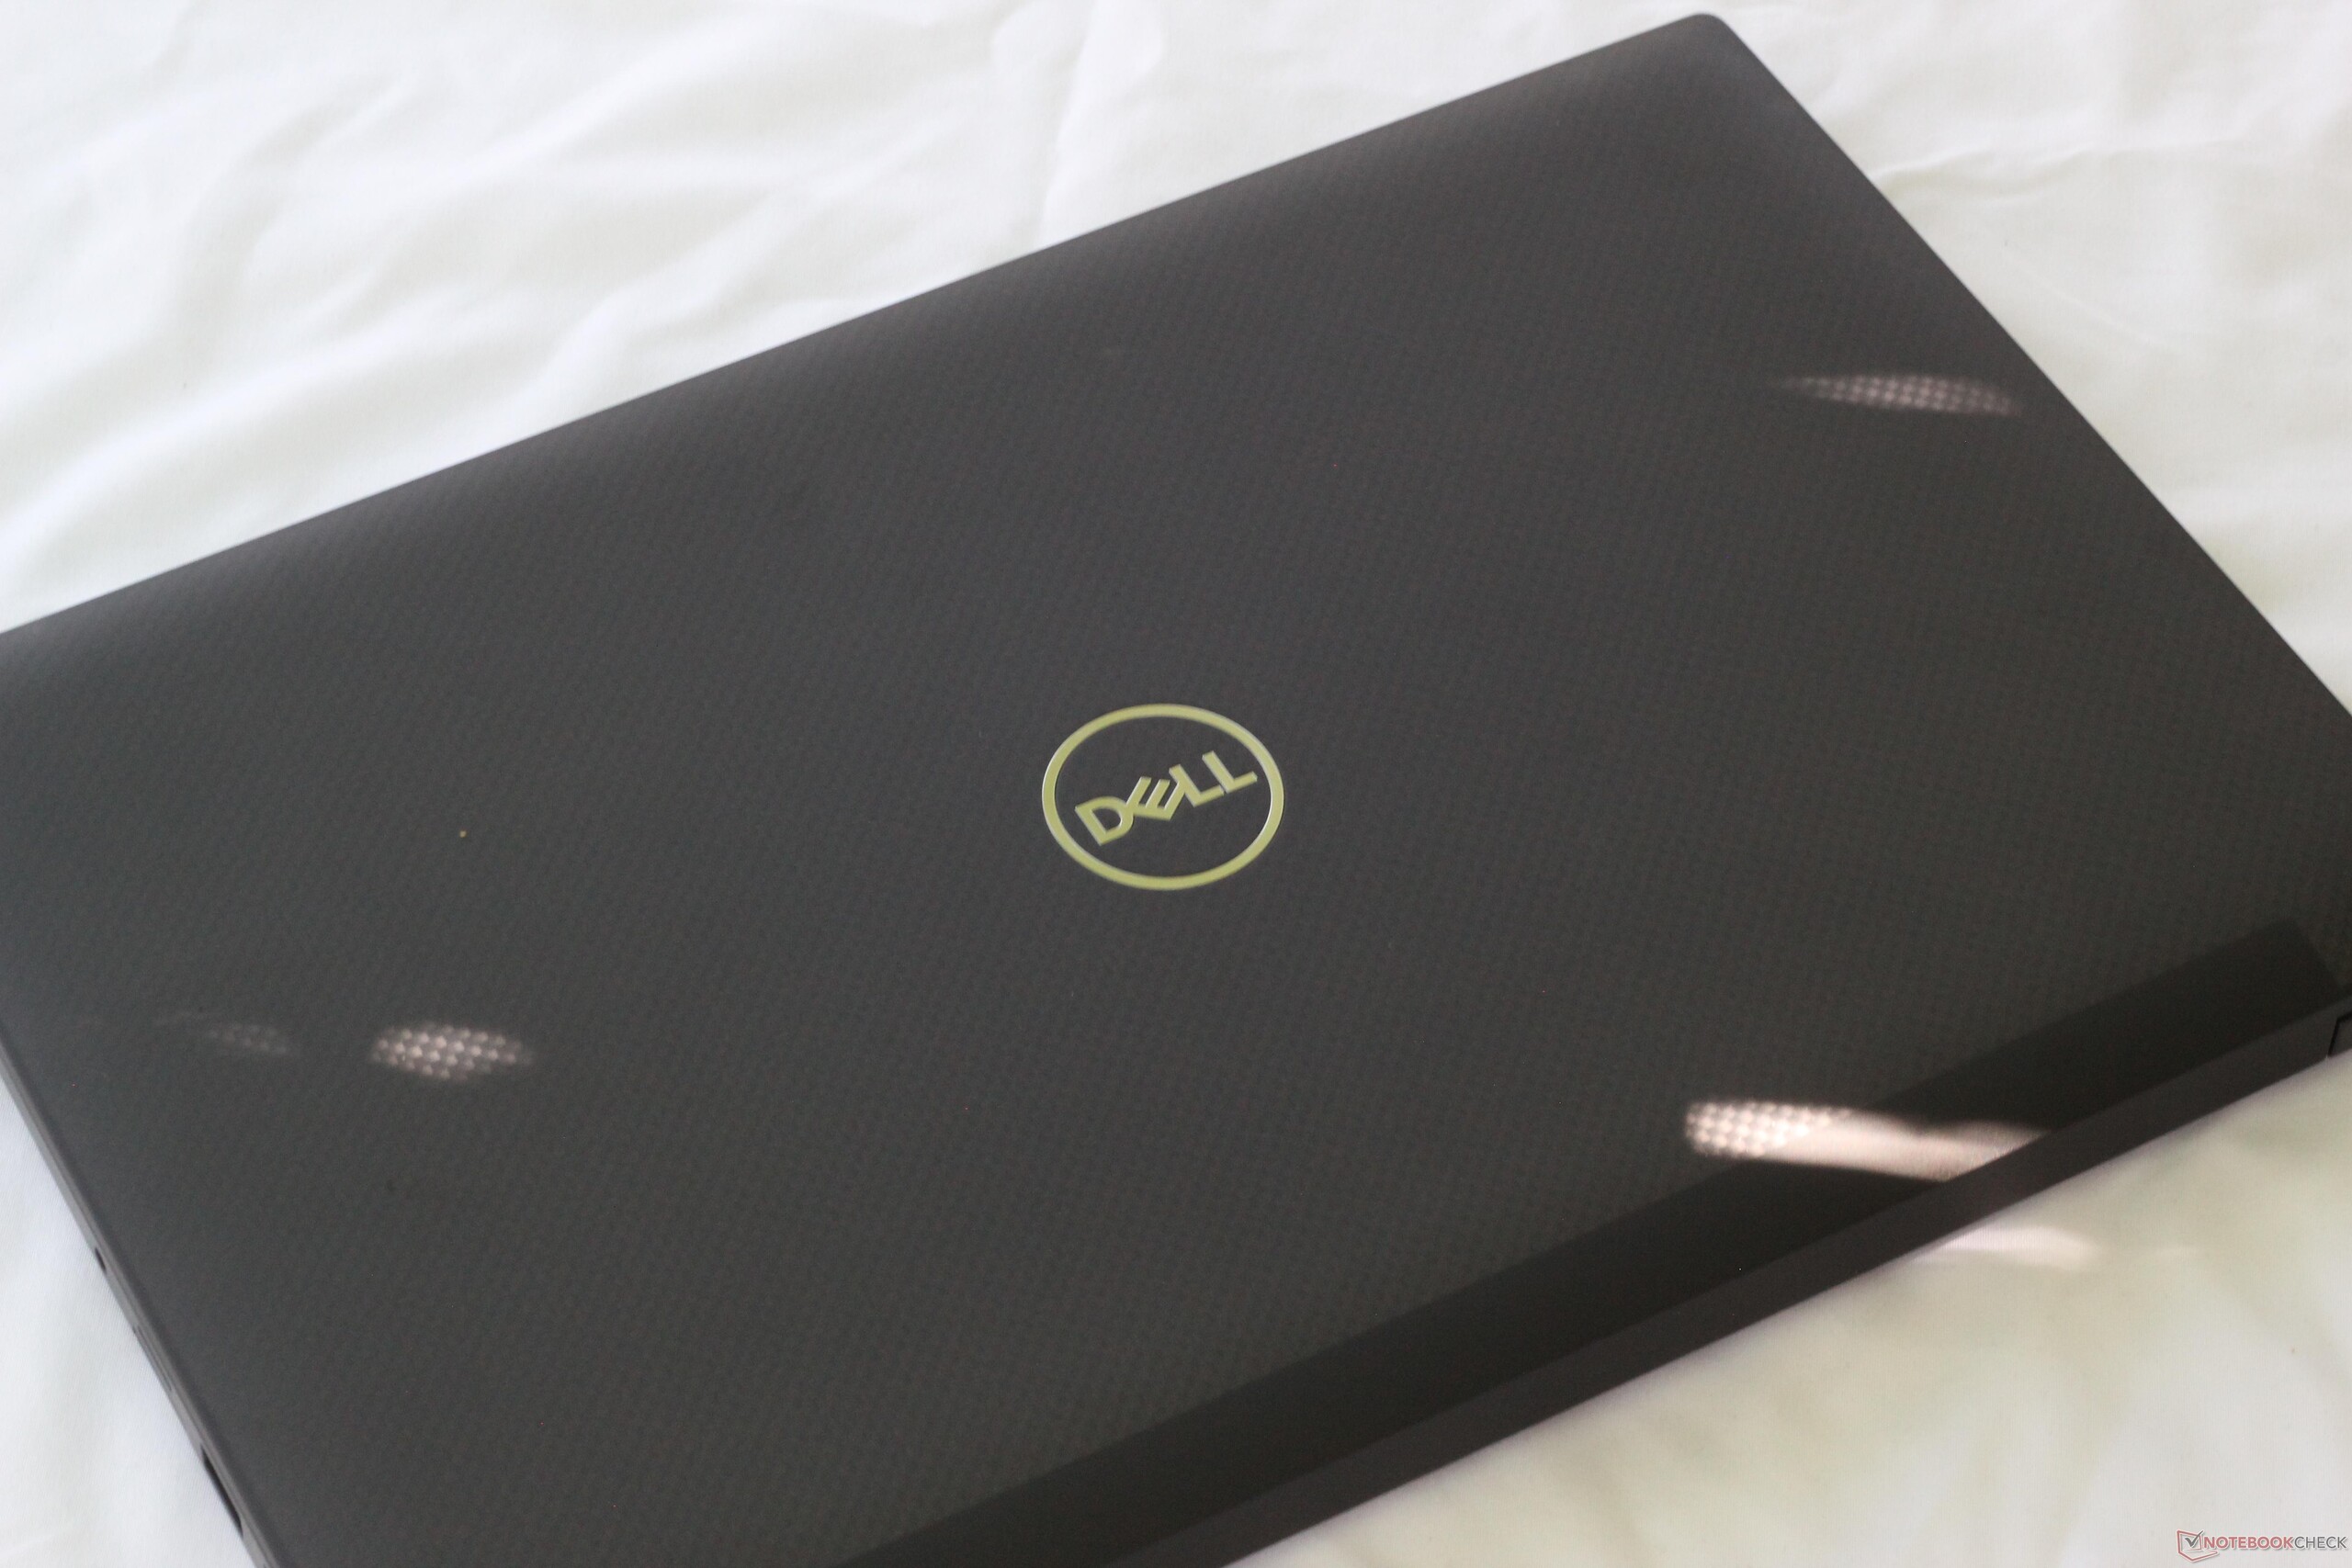
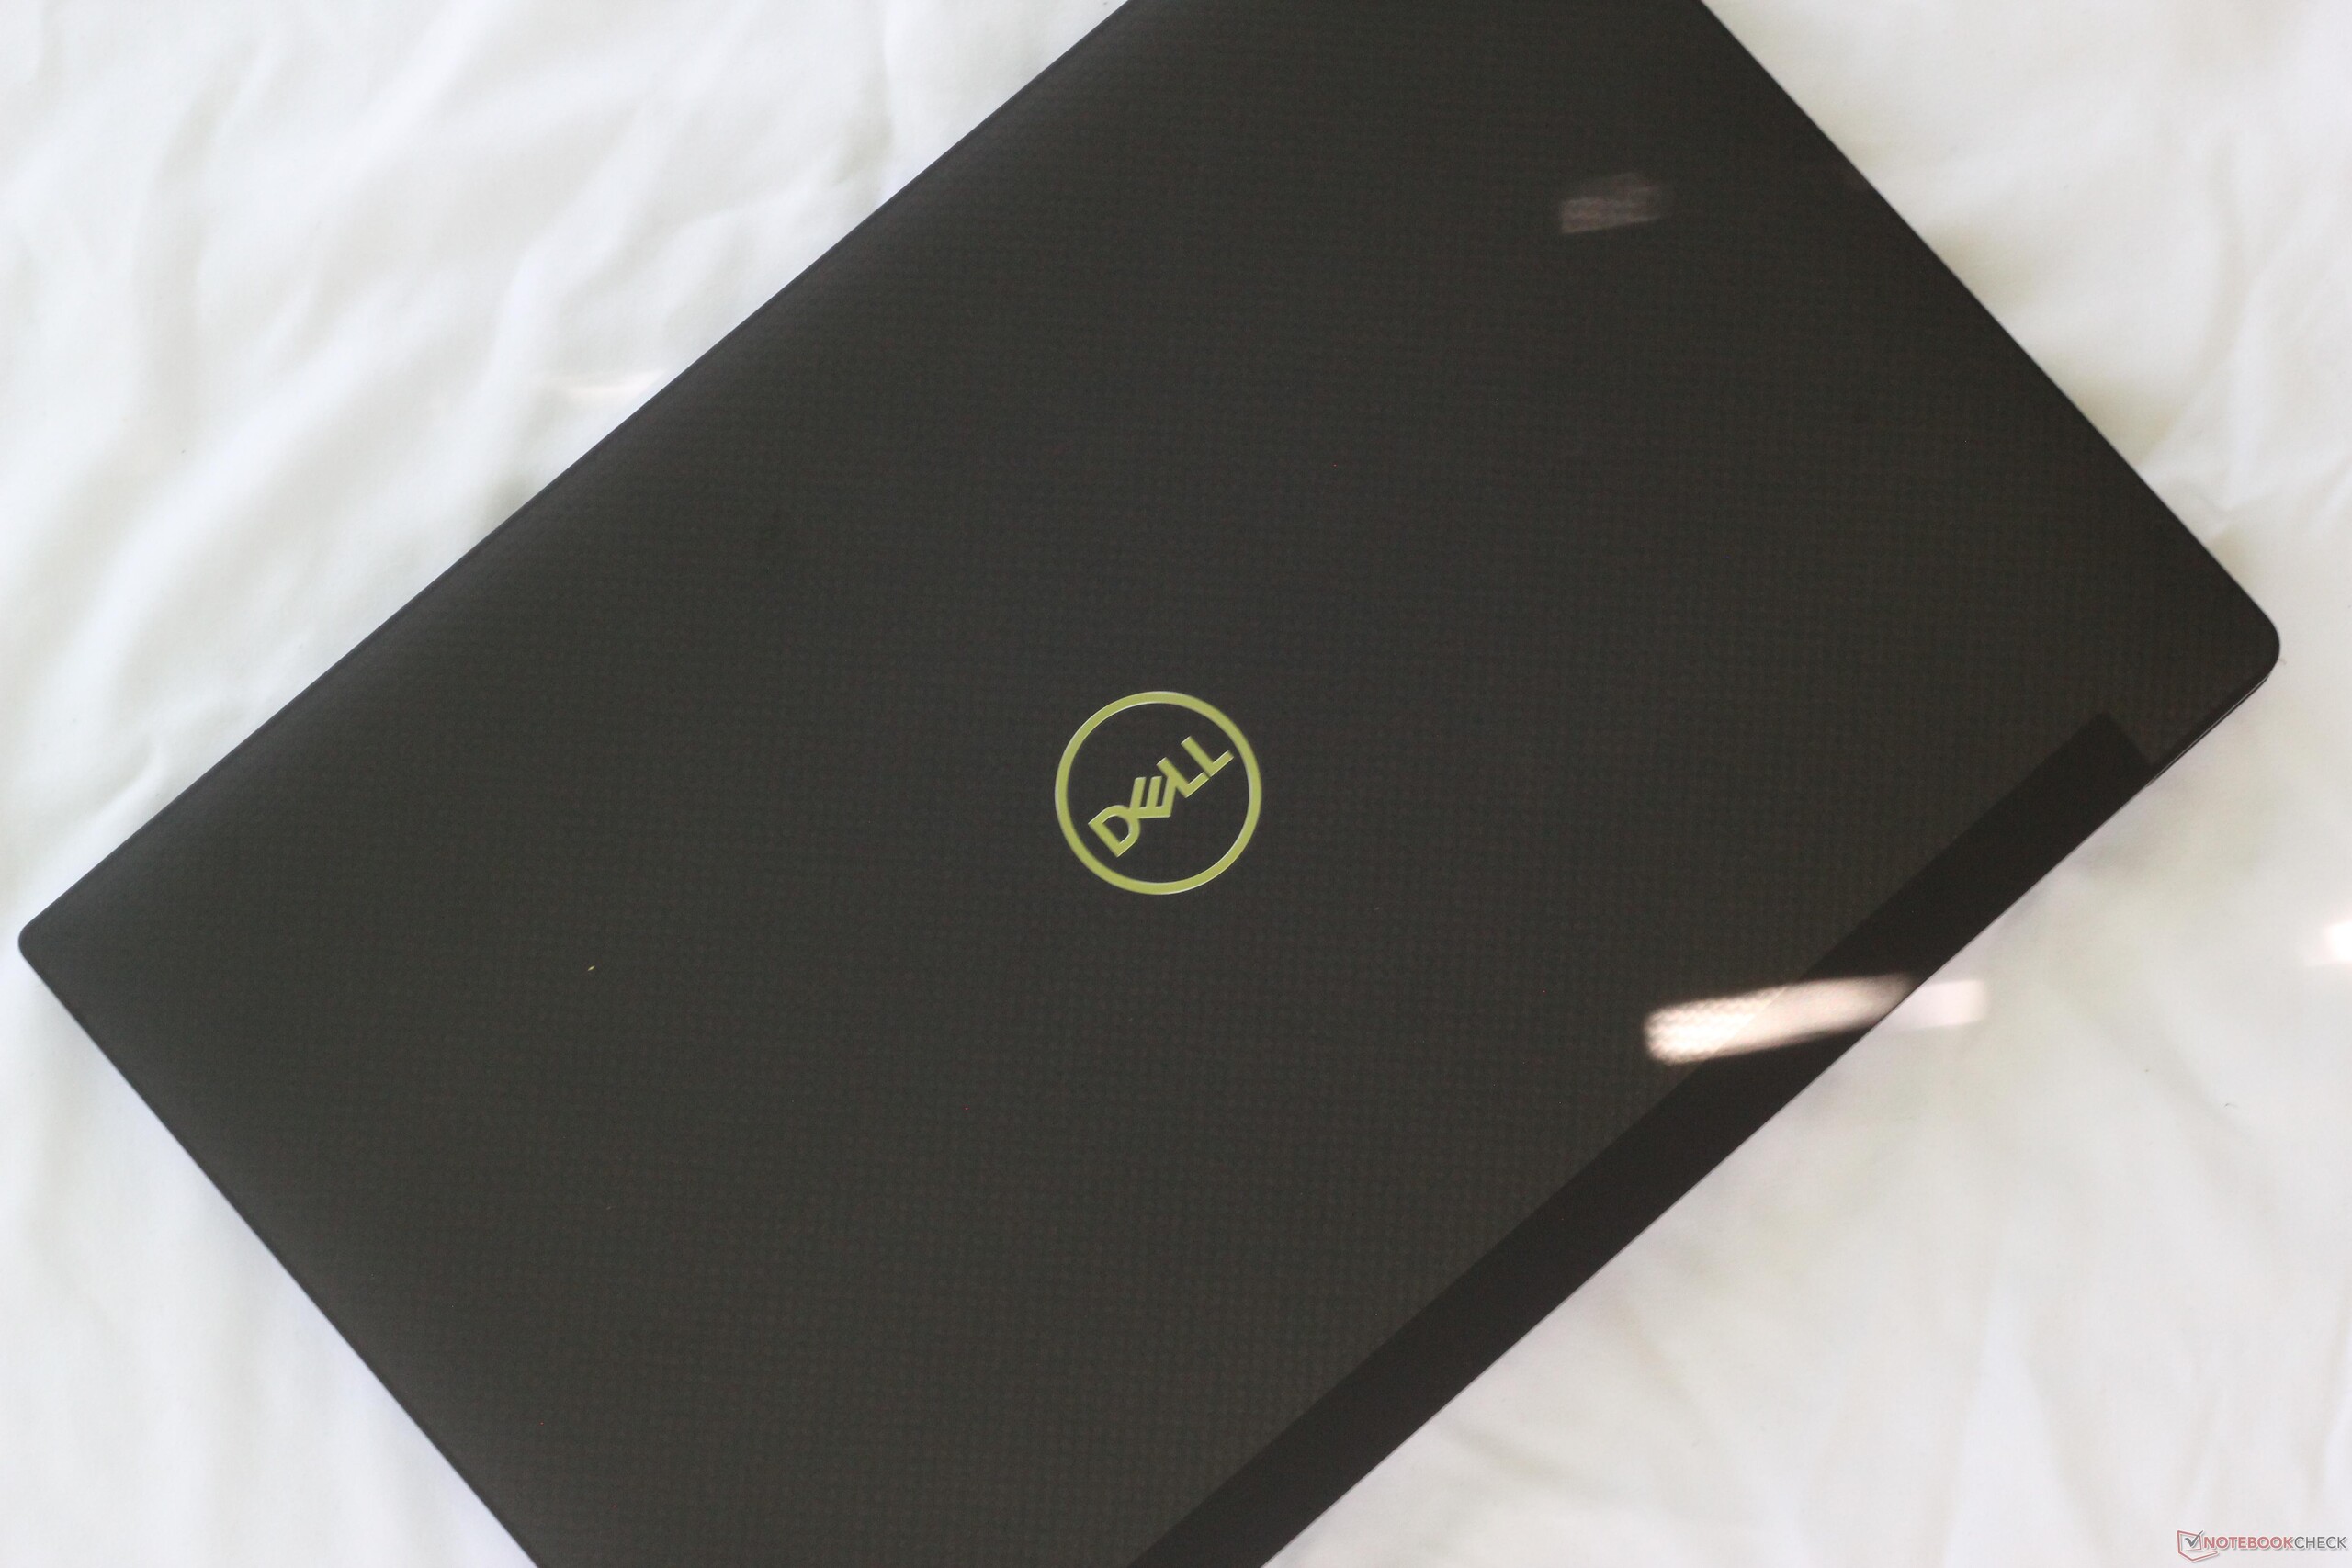
Case
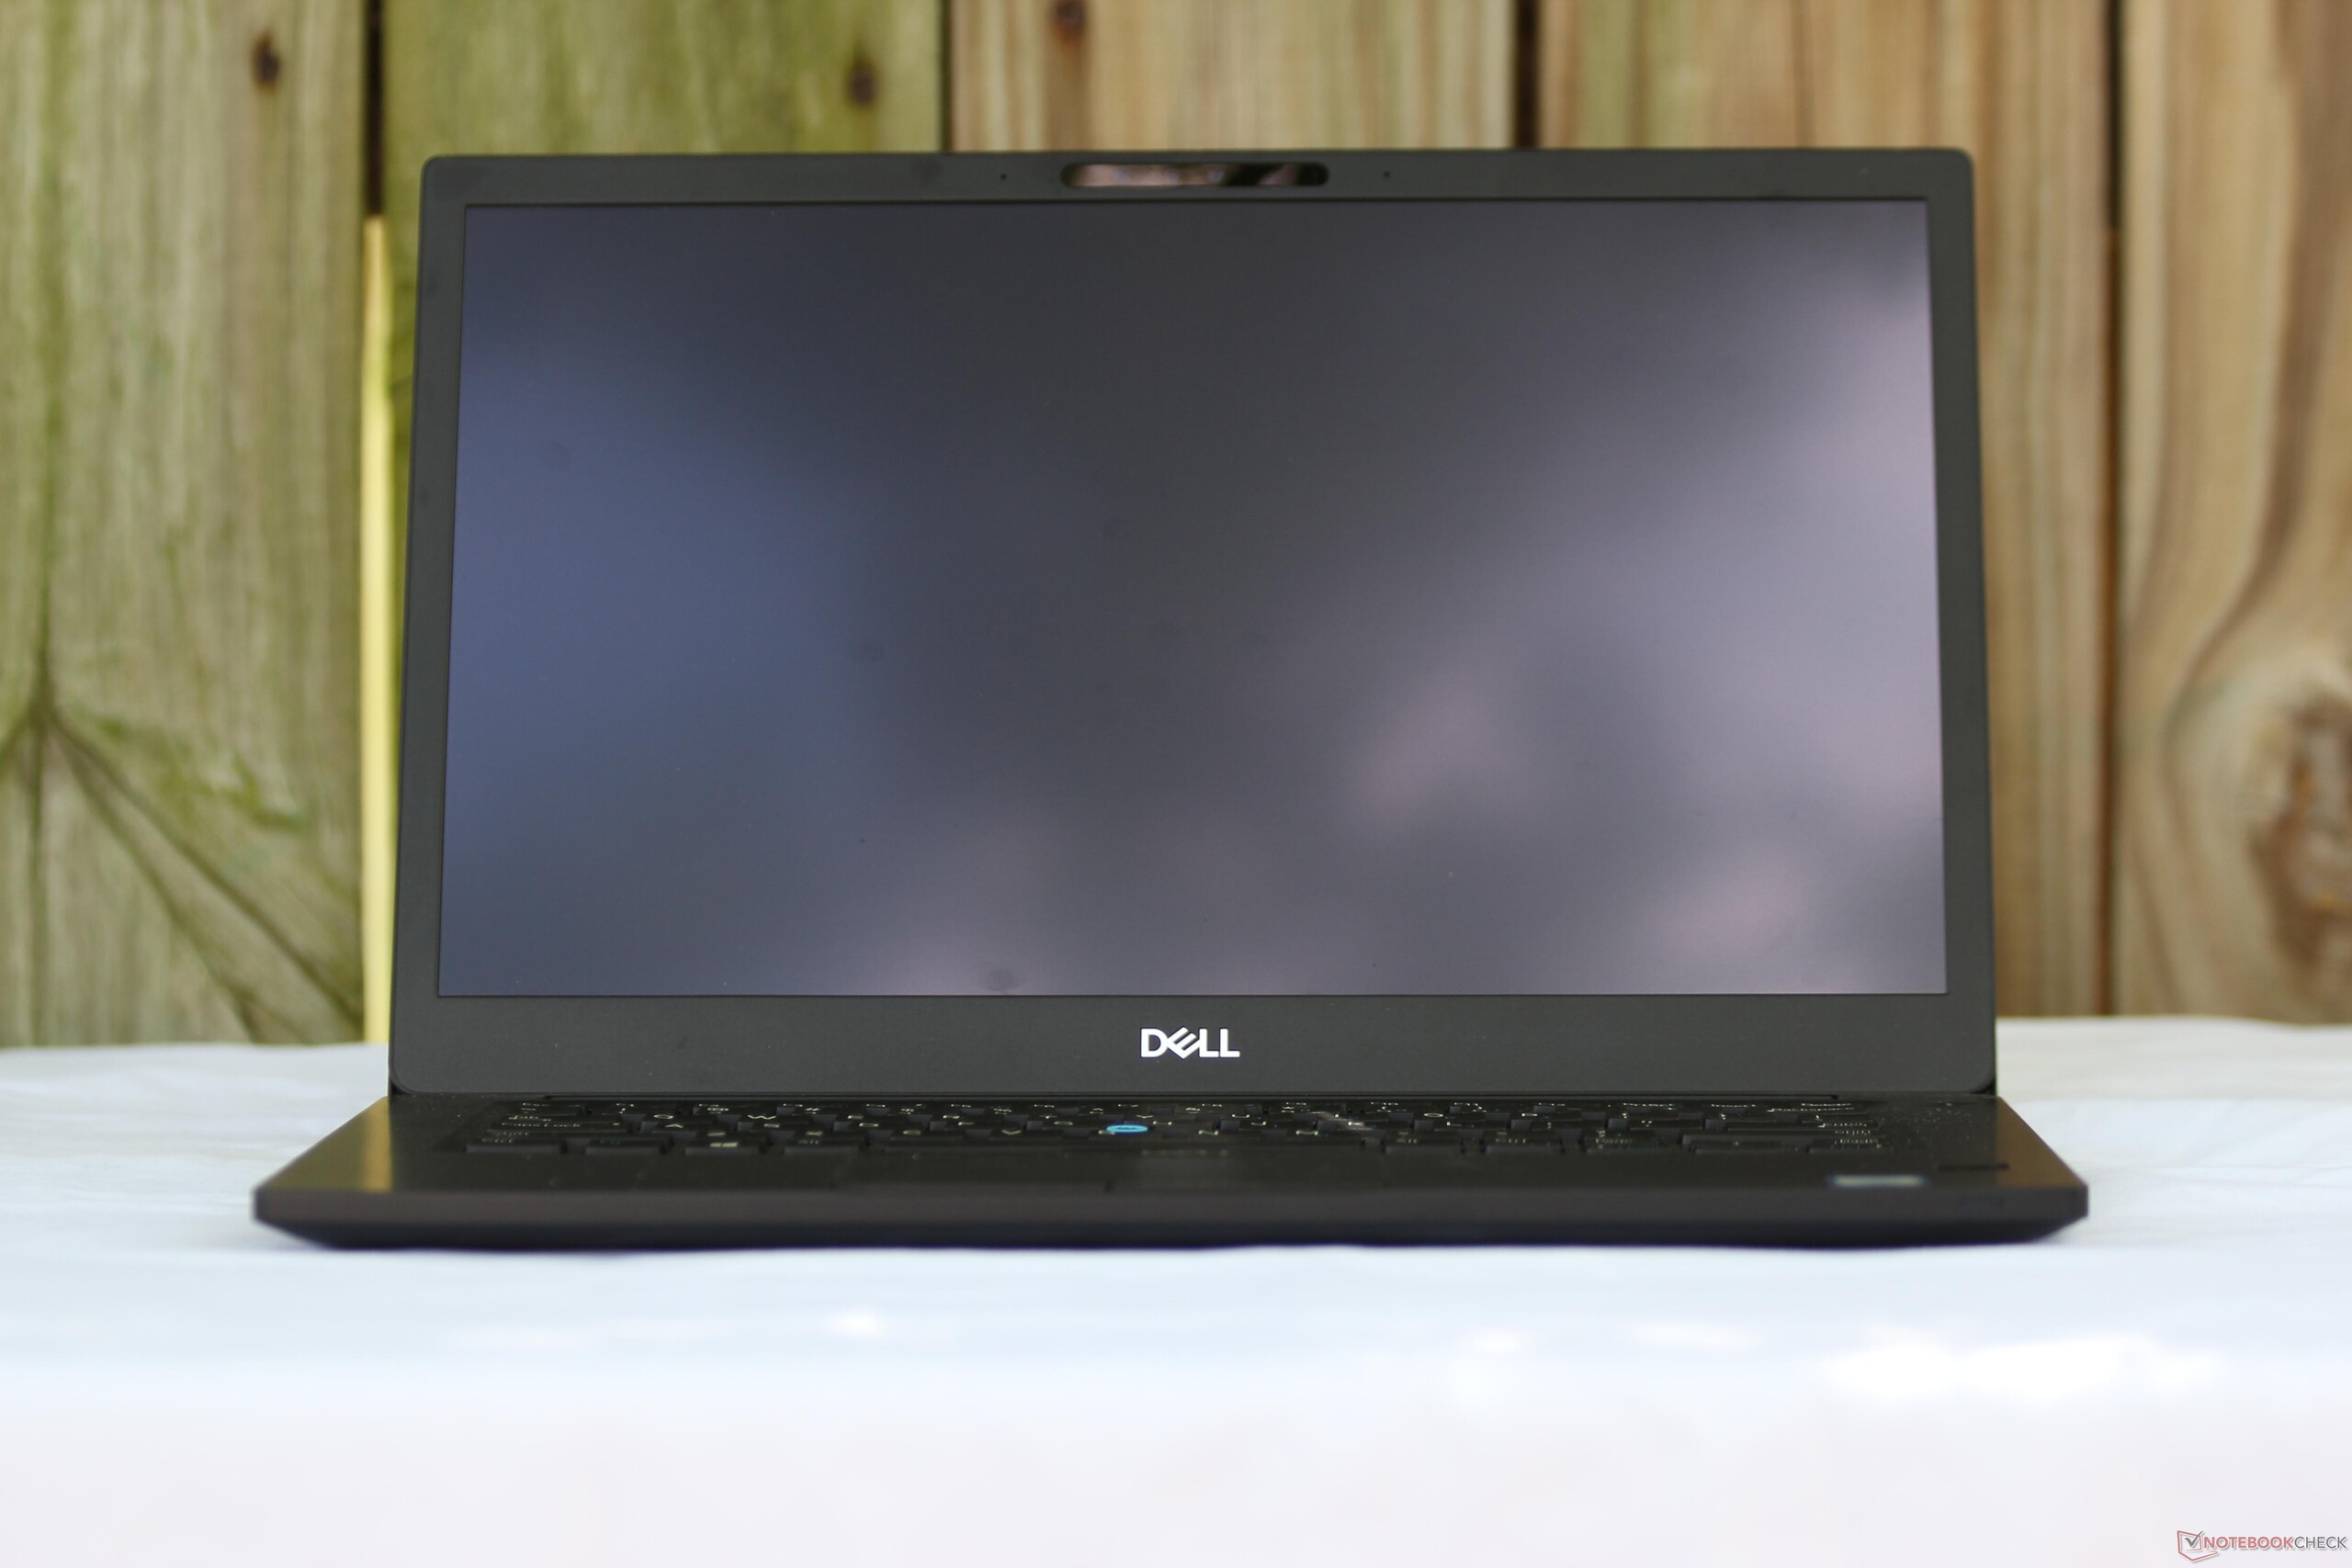
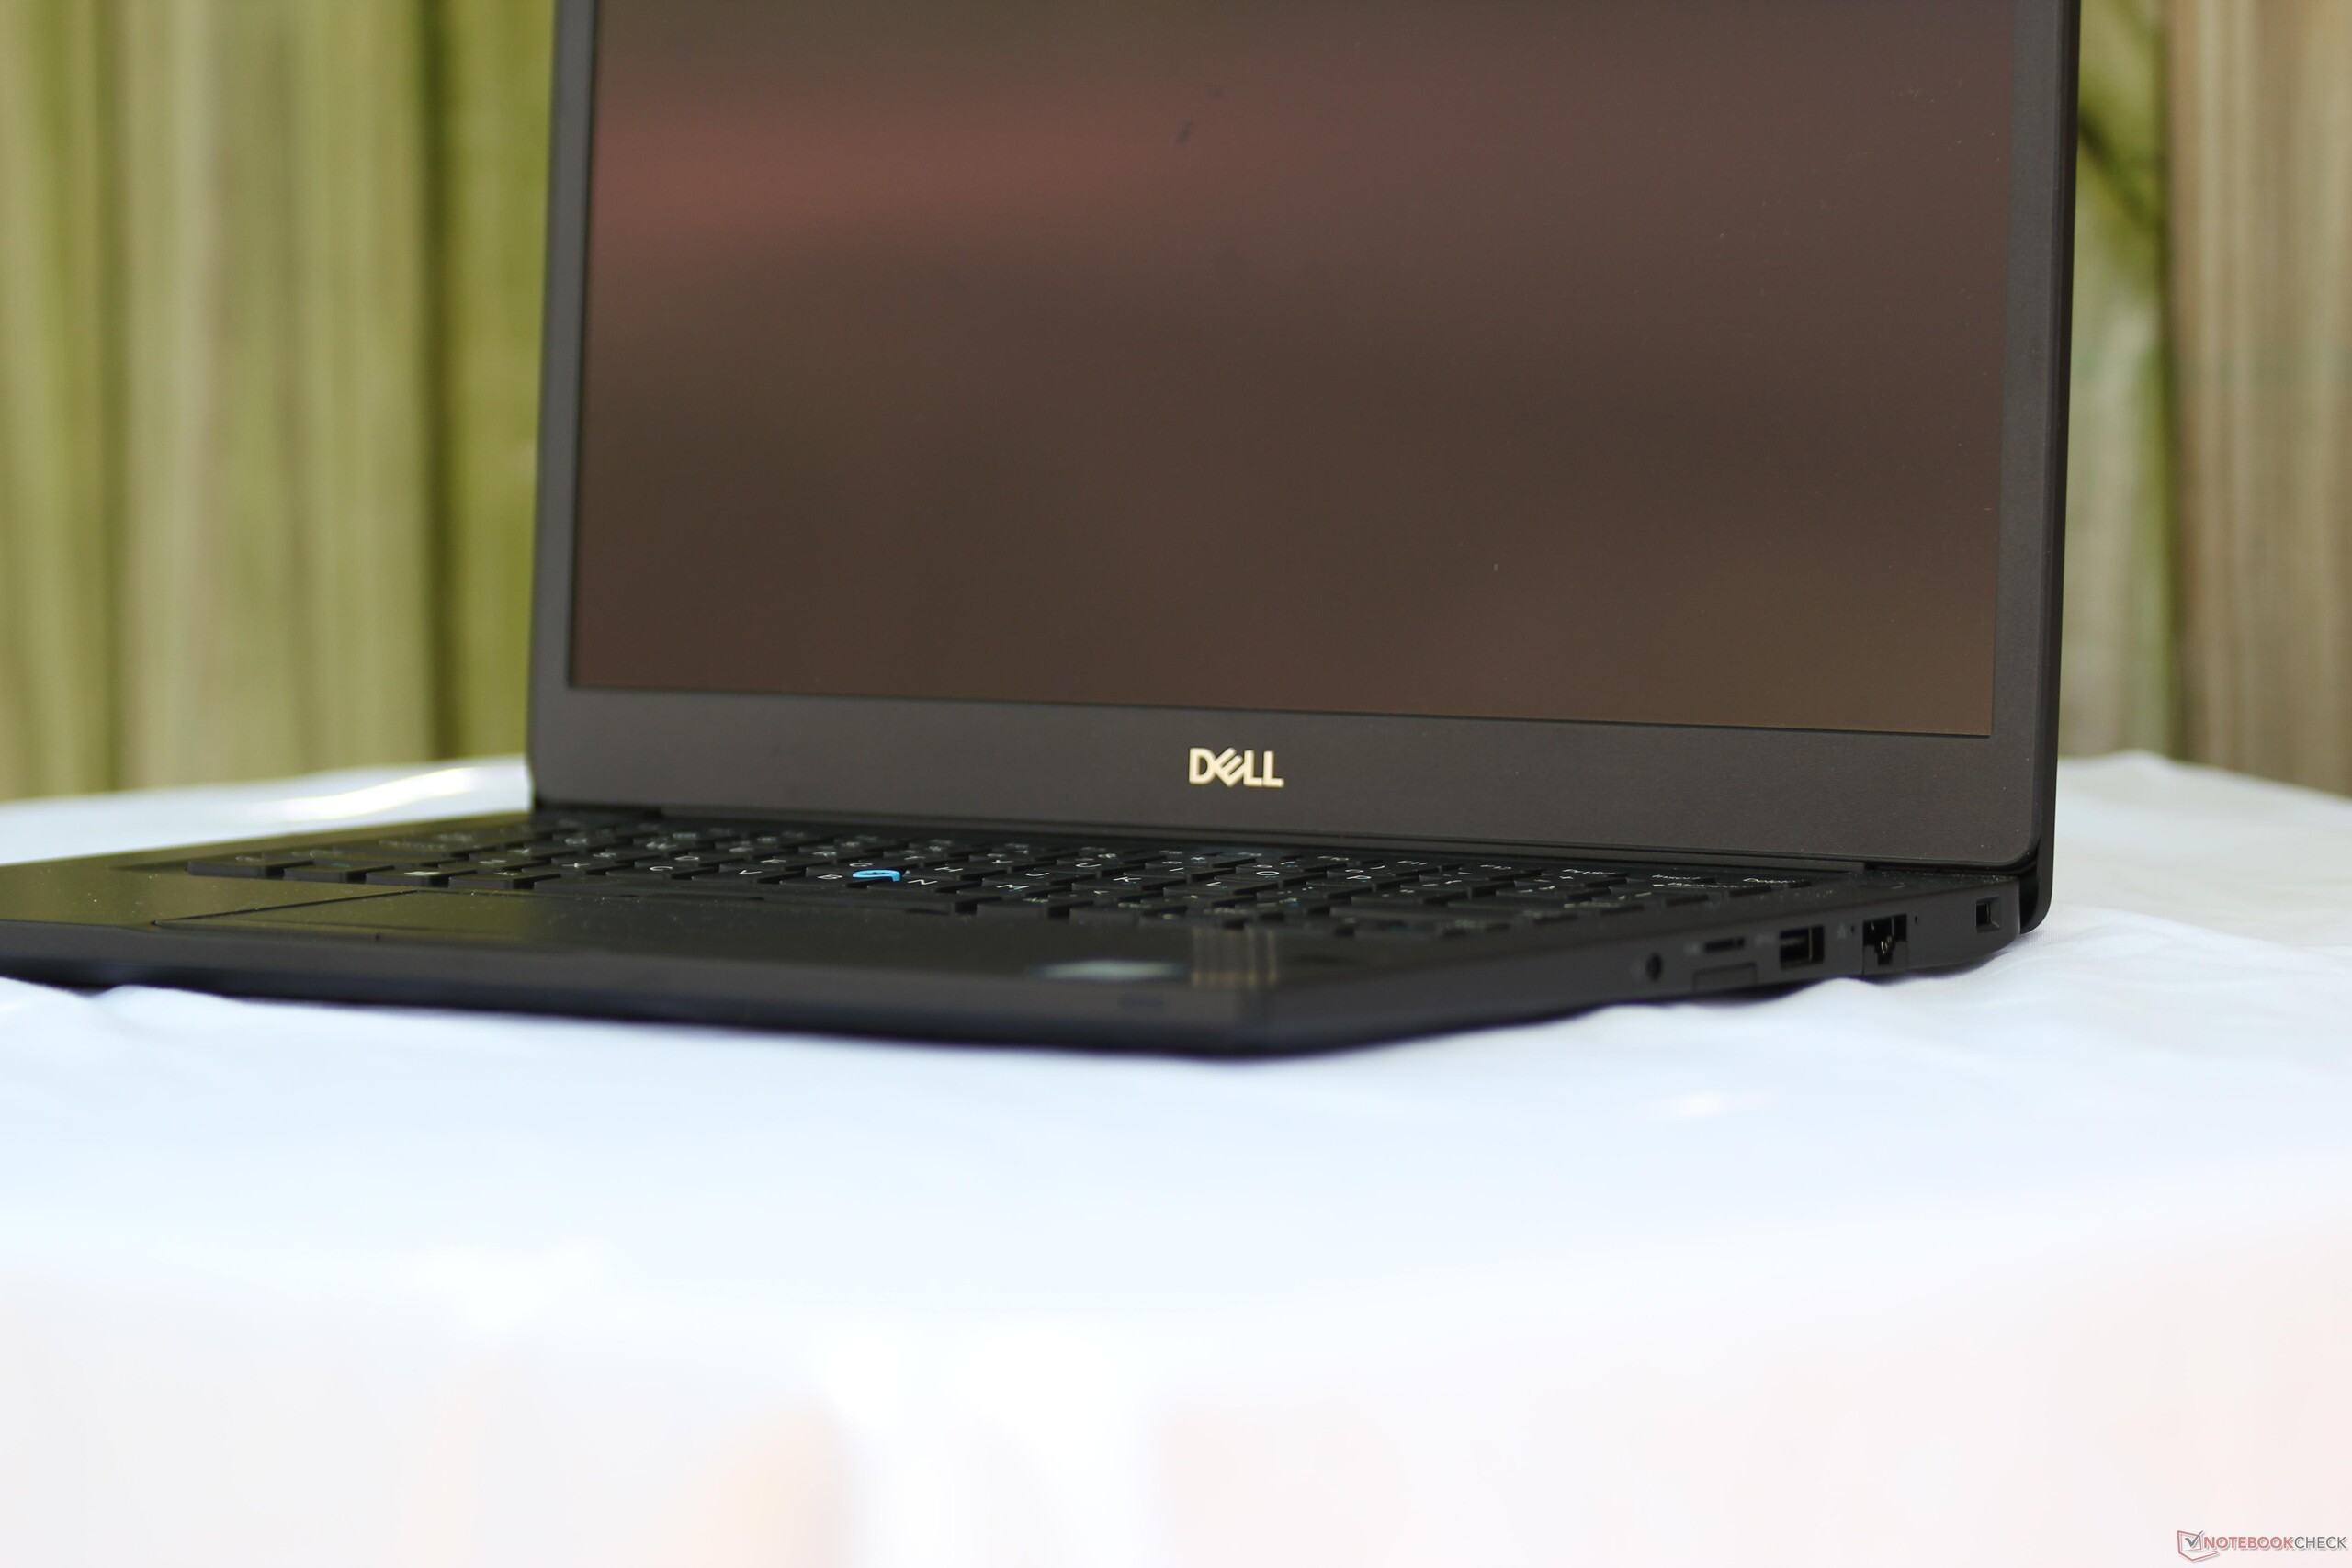
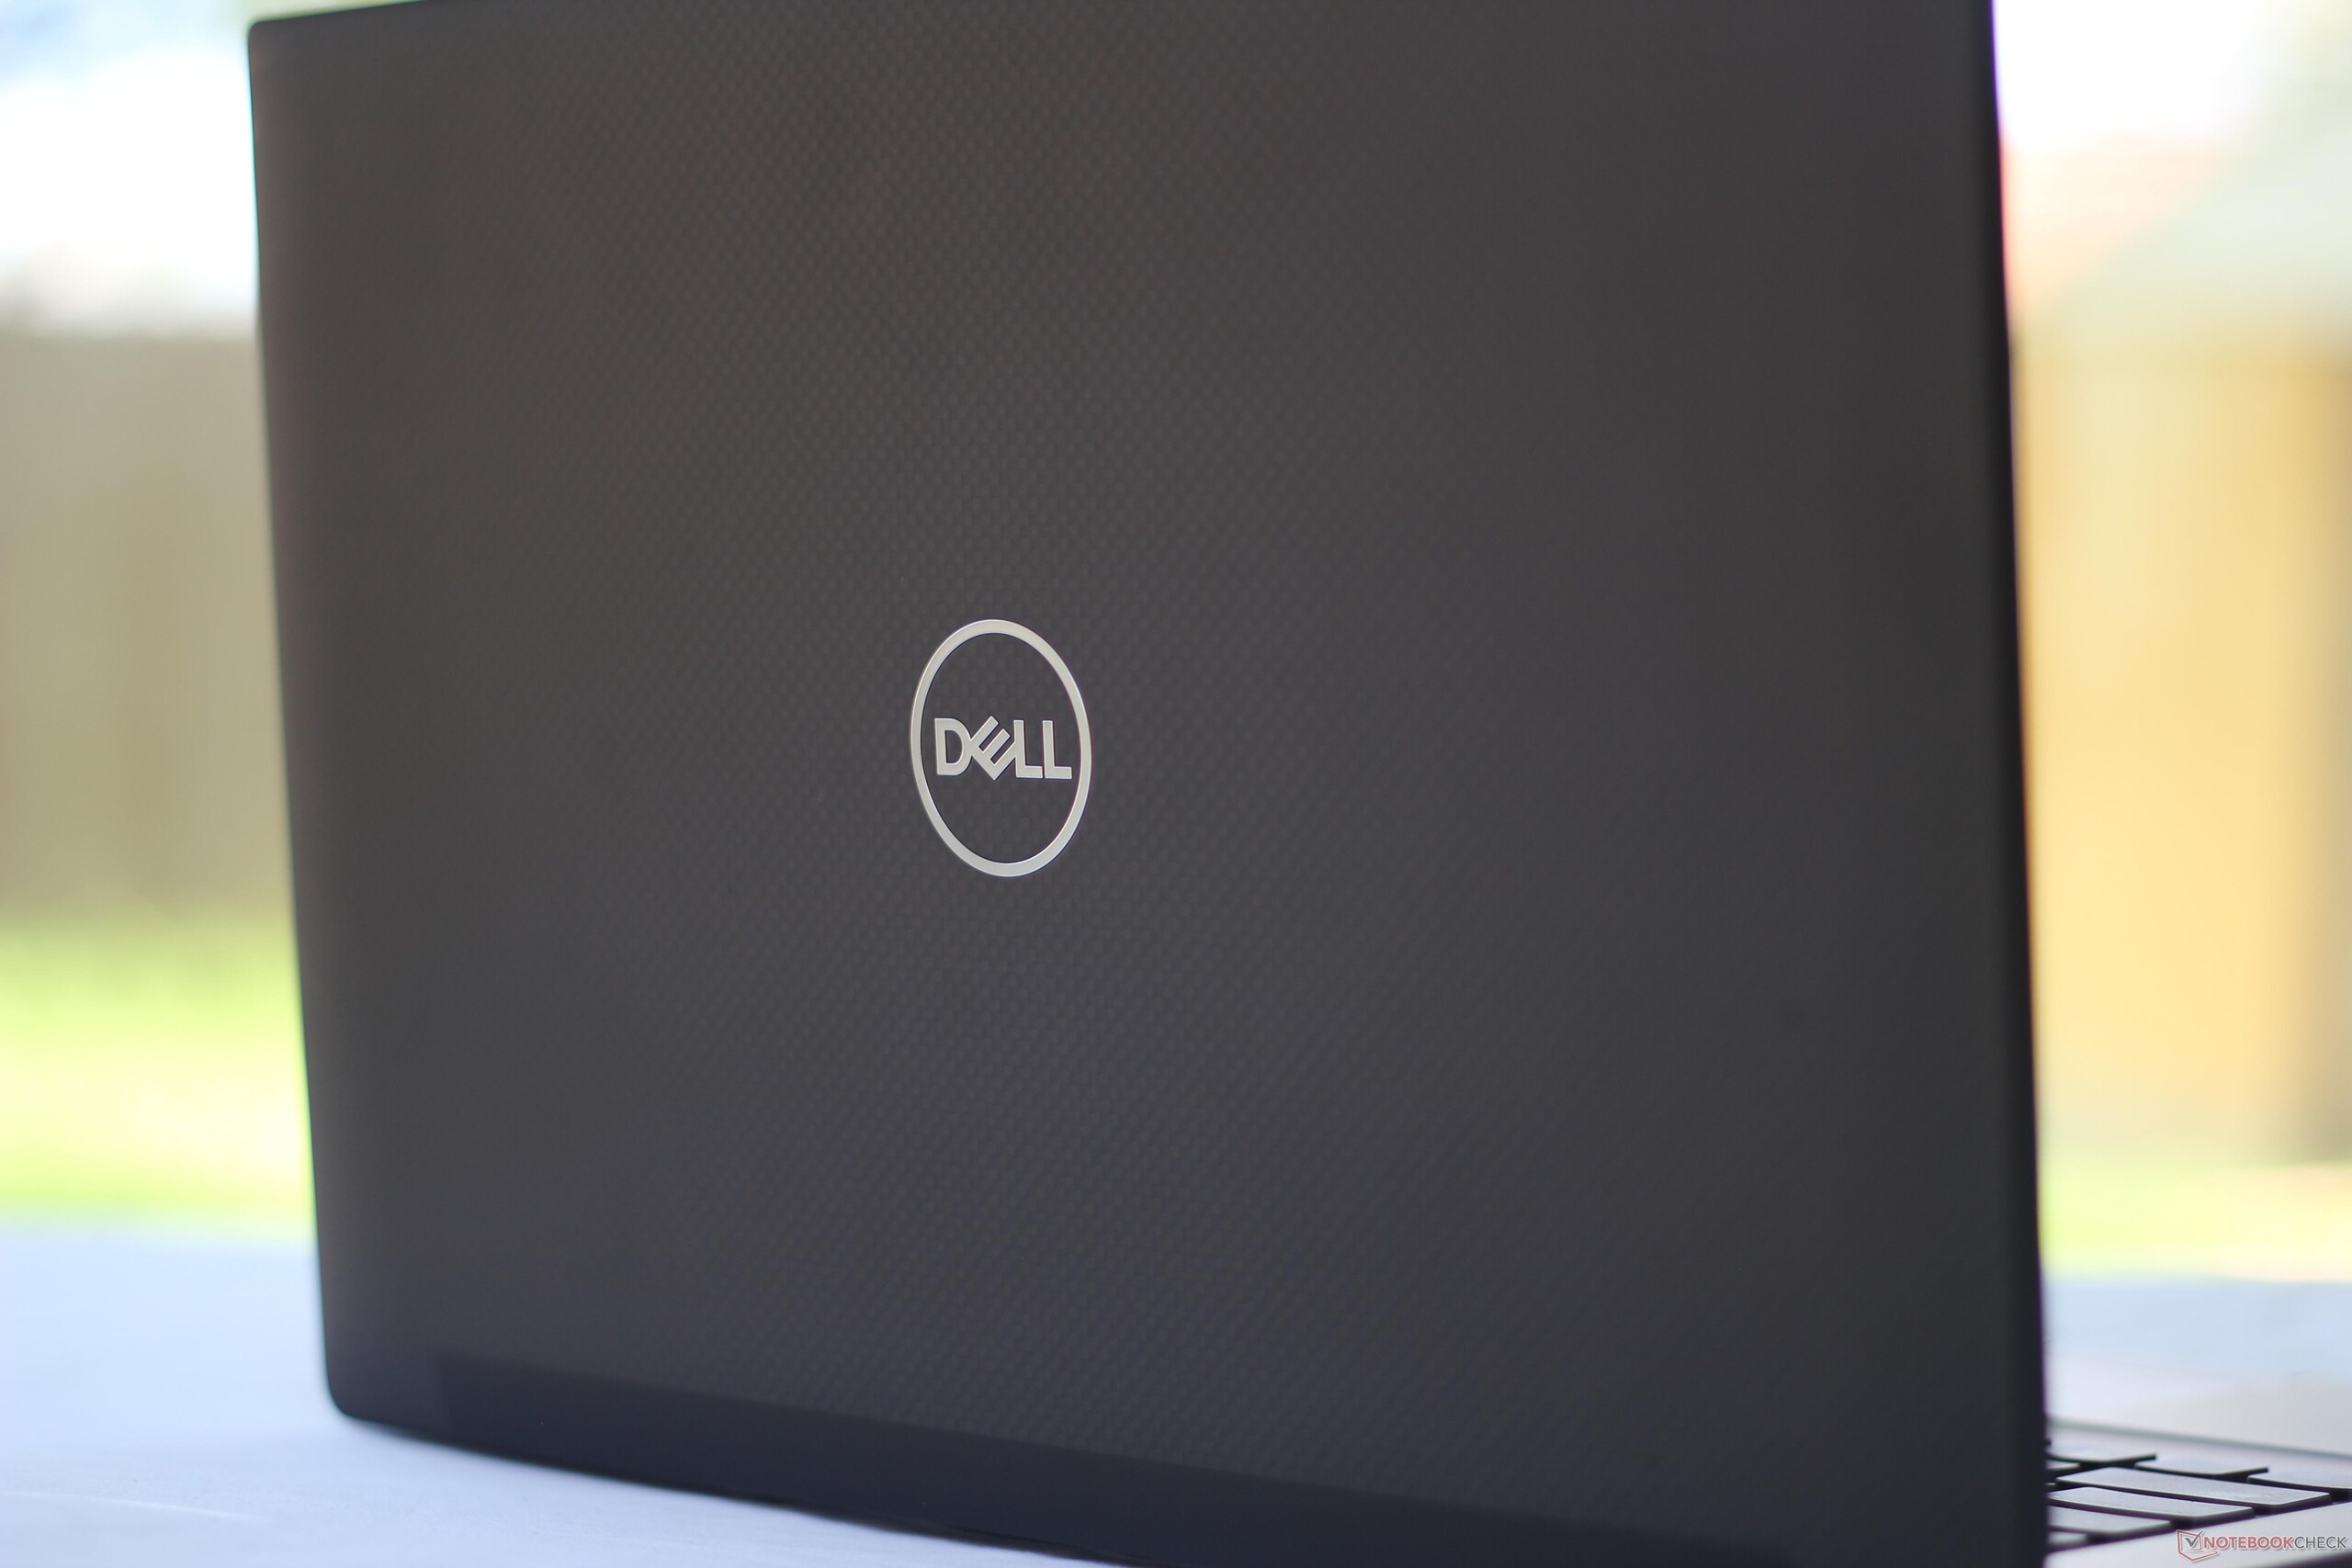
The carbon fiber finish across the back of the lid adds some panache to the device. The look and feel are highly reminiscent of Dell's own XPS line. The result is a laptop that stands out from the sea of "black-suit" devices. As with the 7480, this carbon fiber backing is available only on select configurations at an additional cost. The 7490's chassis remains unchanged from the Latitude 7480, but this isn't a bad thing. The soft touch coat across the palm rests feels just as premium but has the same problems with showing fingerprints and dust. The case is fairly rigid across the keyboard deck and exhibits only minimal flex under directed pressure, as does the bottom panel. The lid is thick and sturdy; only slight torsion is possible.
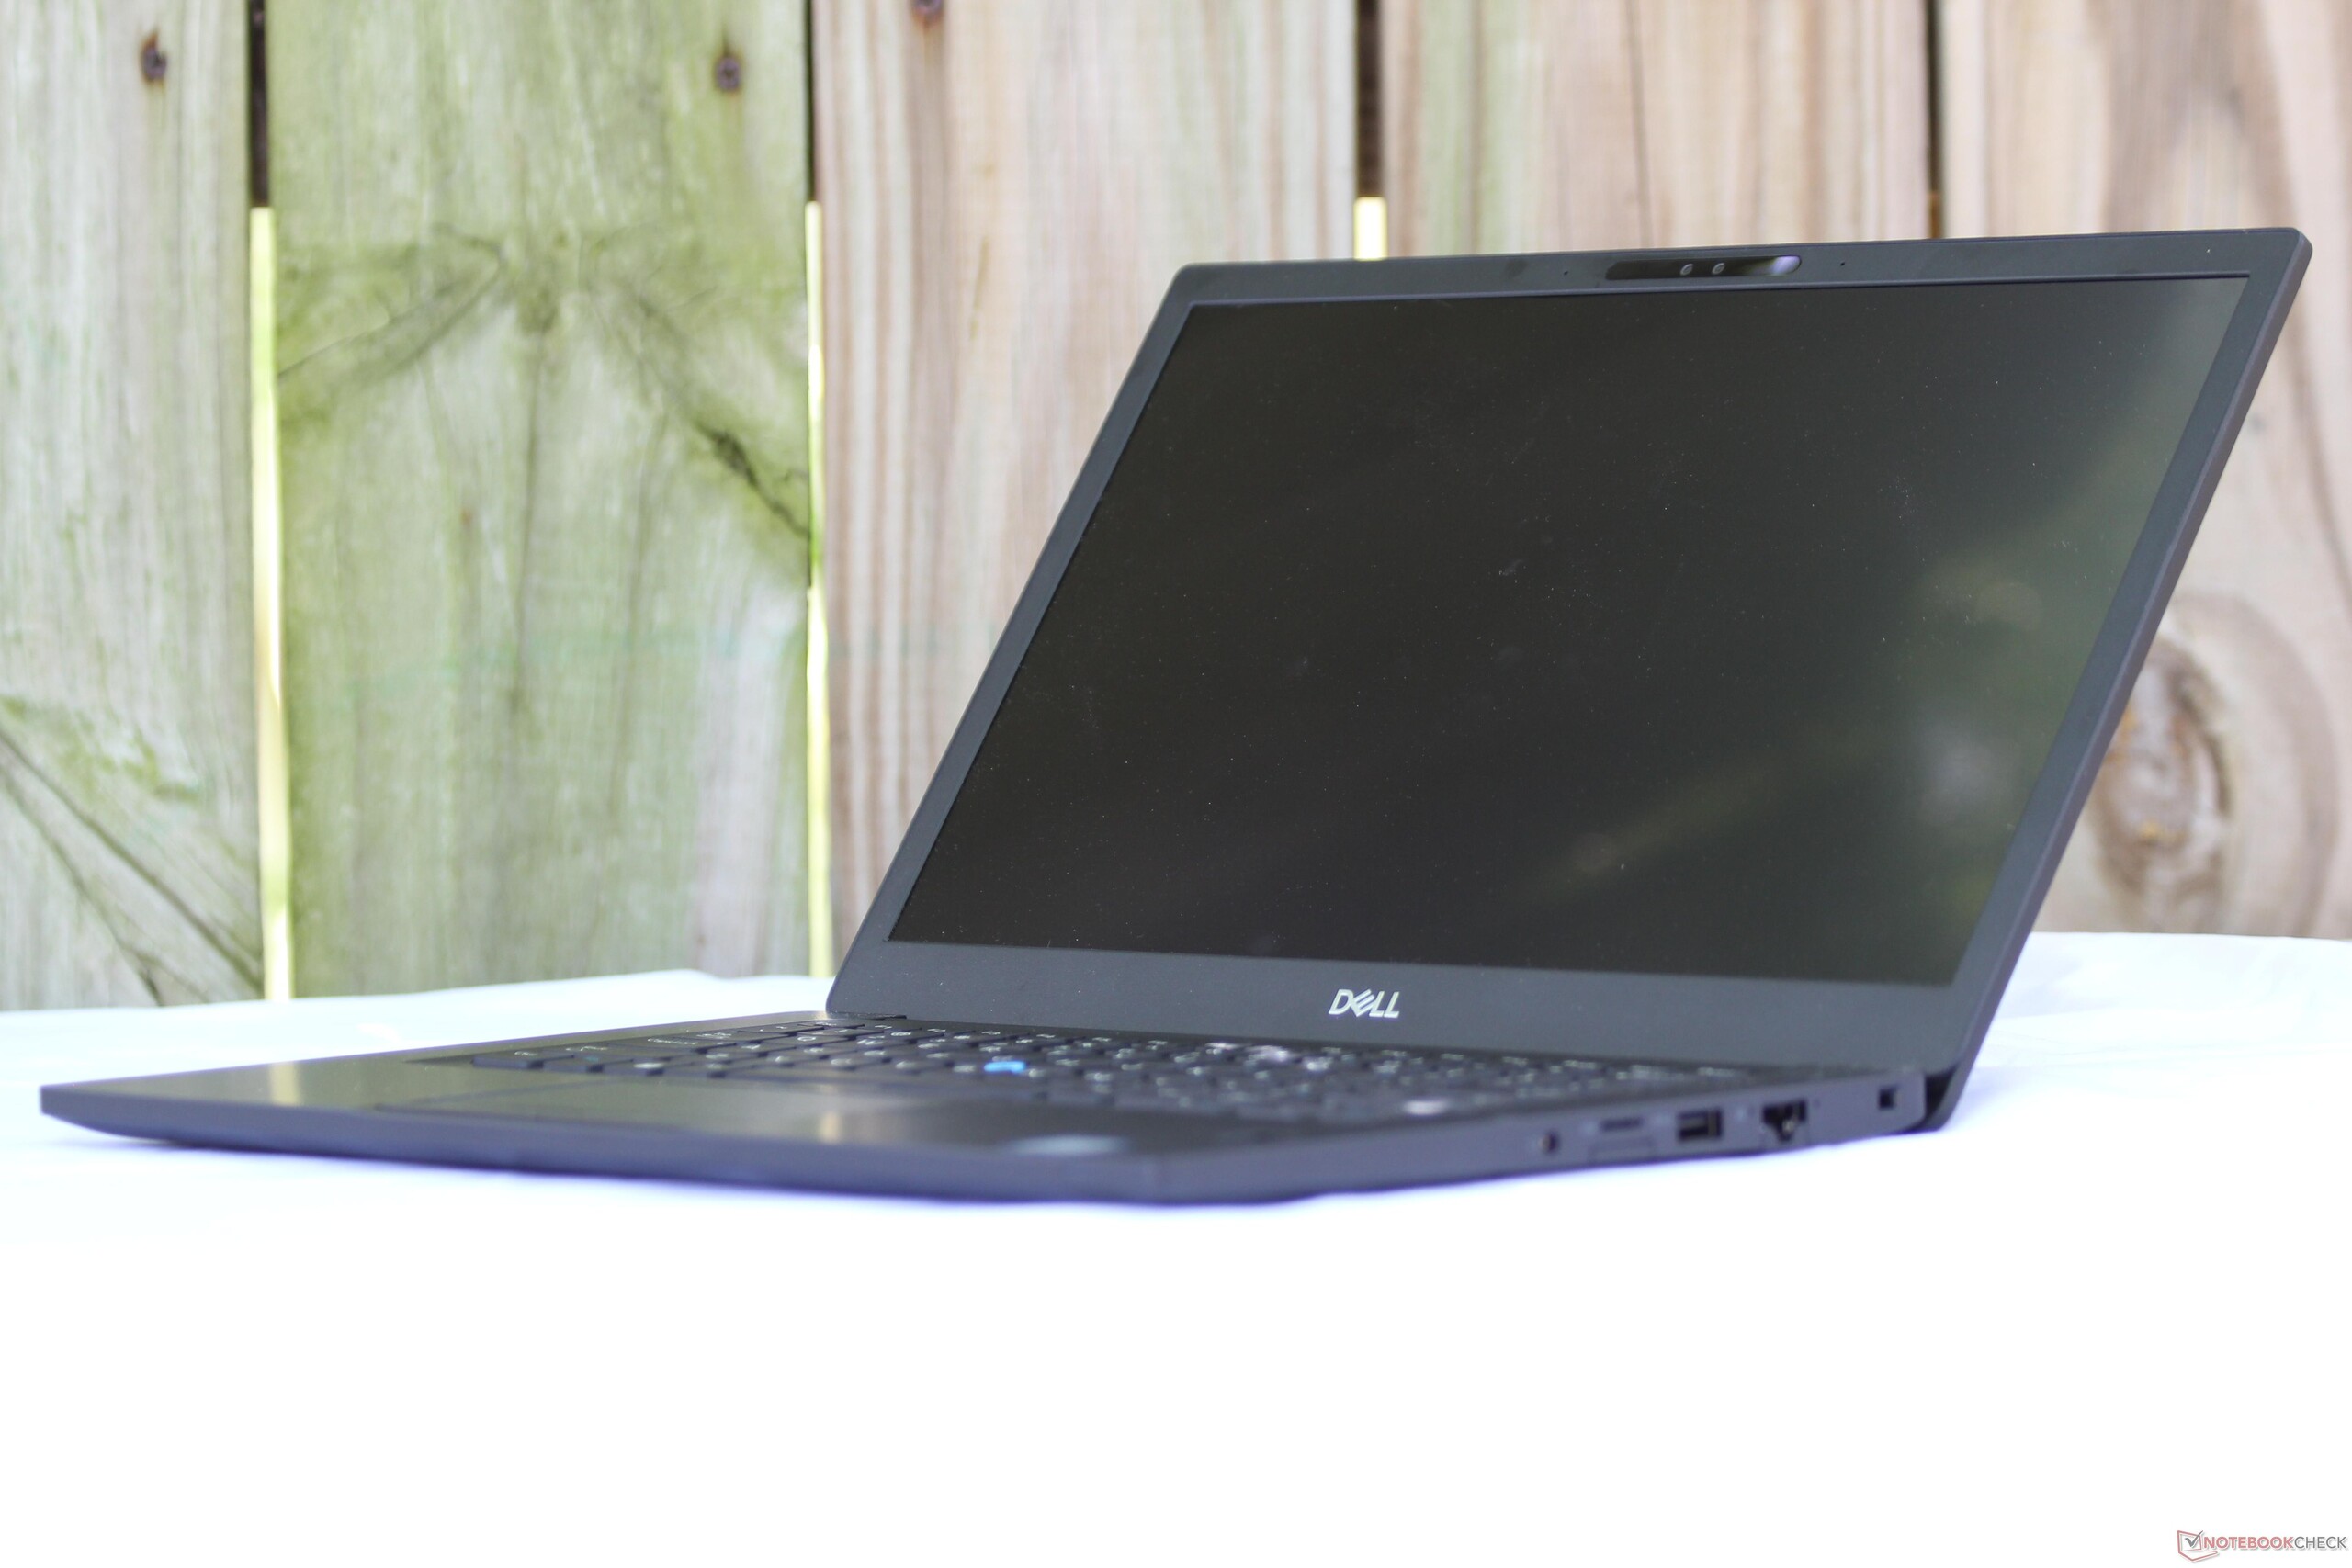
The single long hinge is also held over from last year's model, as is its 180-degree rotation. The hinge is too stiff for one-handed opening but holds the display steady under normal use (typing, etc.). Touching the display results in some slight bobbling that quickly stops. Overall, the build quality is respectable and remains constant from the 7480; if you've handled that machine, you already know what the Latitude 7490 feels like.


The dimensions of the 7490 are identical to those of the Latitude 7480, which isn't surprising. The 7490 is about the same size as the ThinkPad T480s and strikes a good balance between portability and usability. It easily fits into a pack and is light enough to haul around all day, but there are smaller and lighter 14-inch notebooks, particularly the X1 Carbon and ASUSPRO B9440UA.
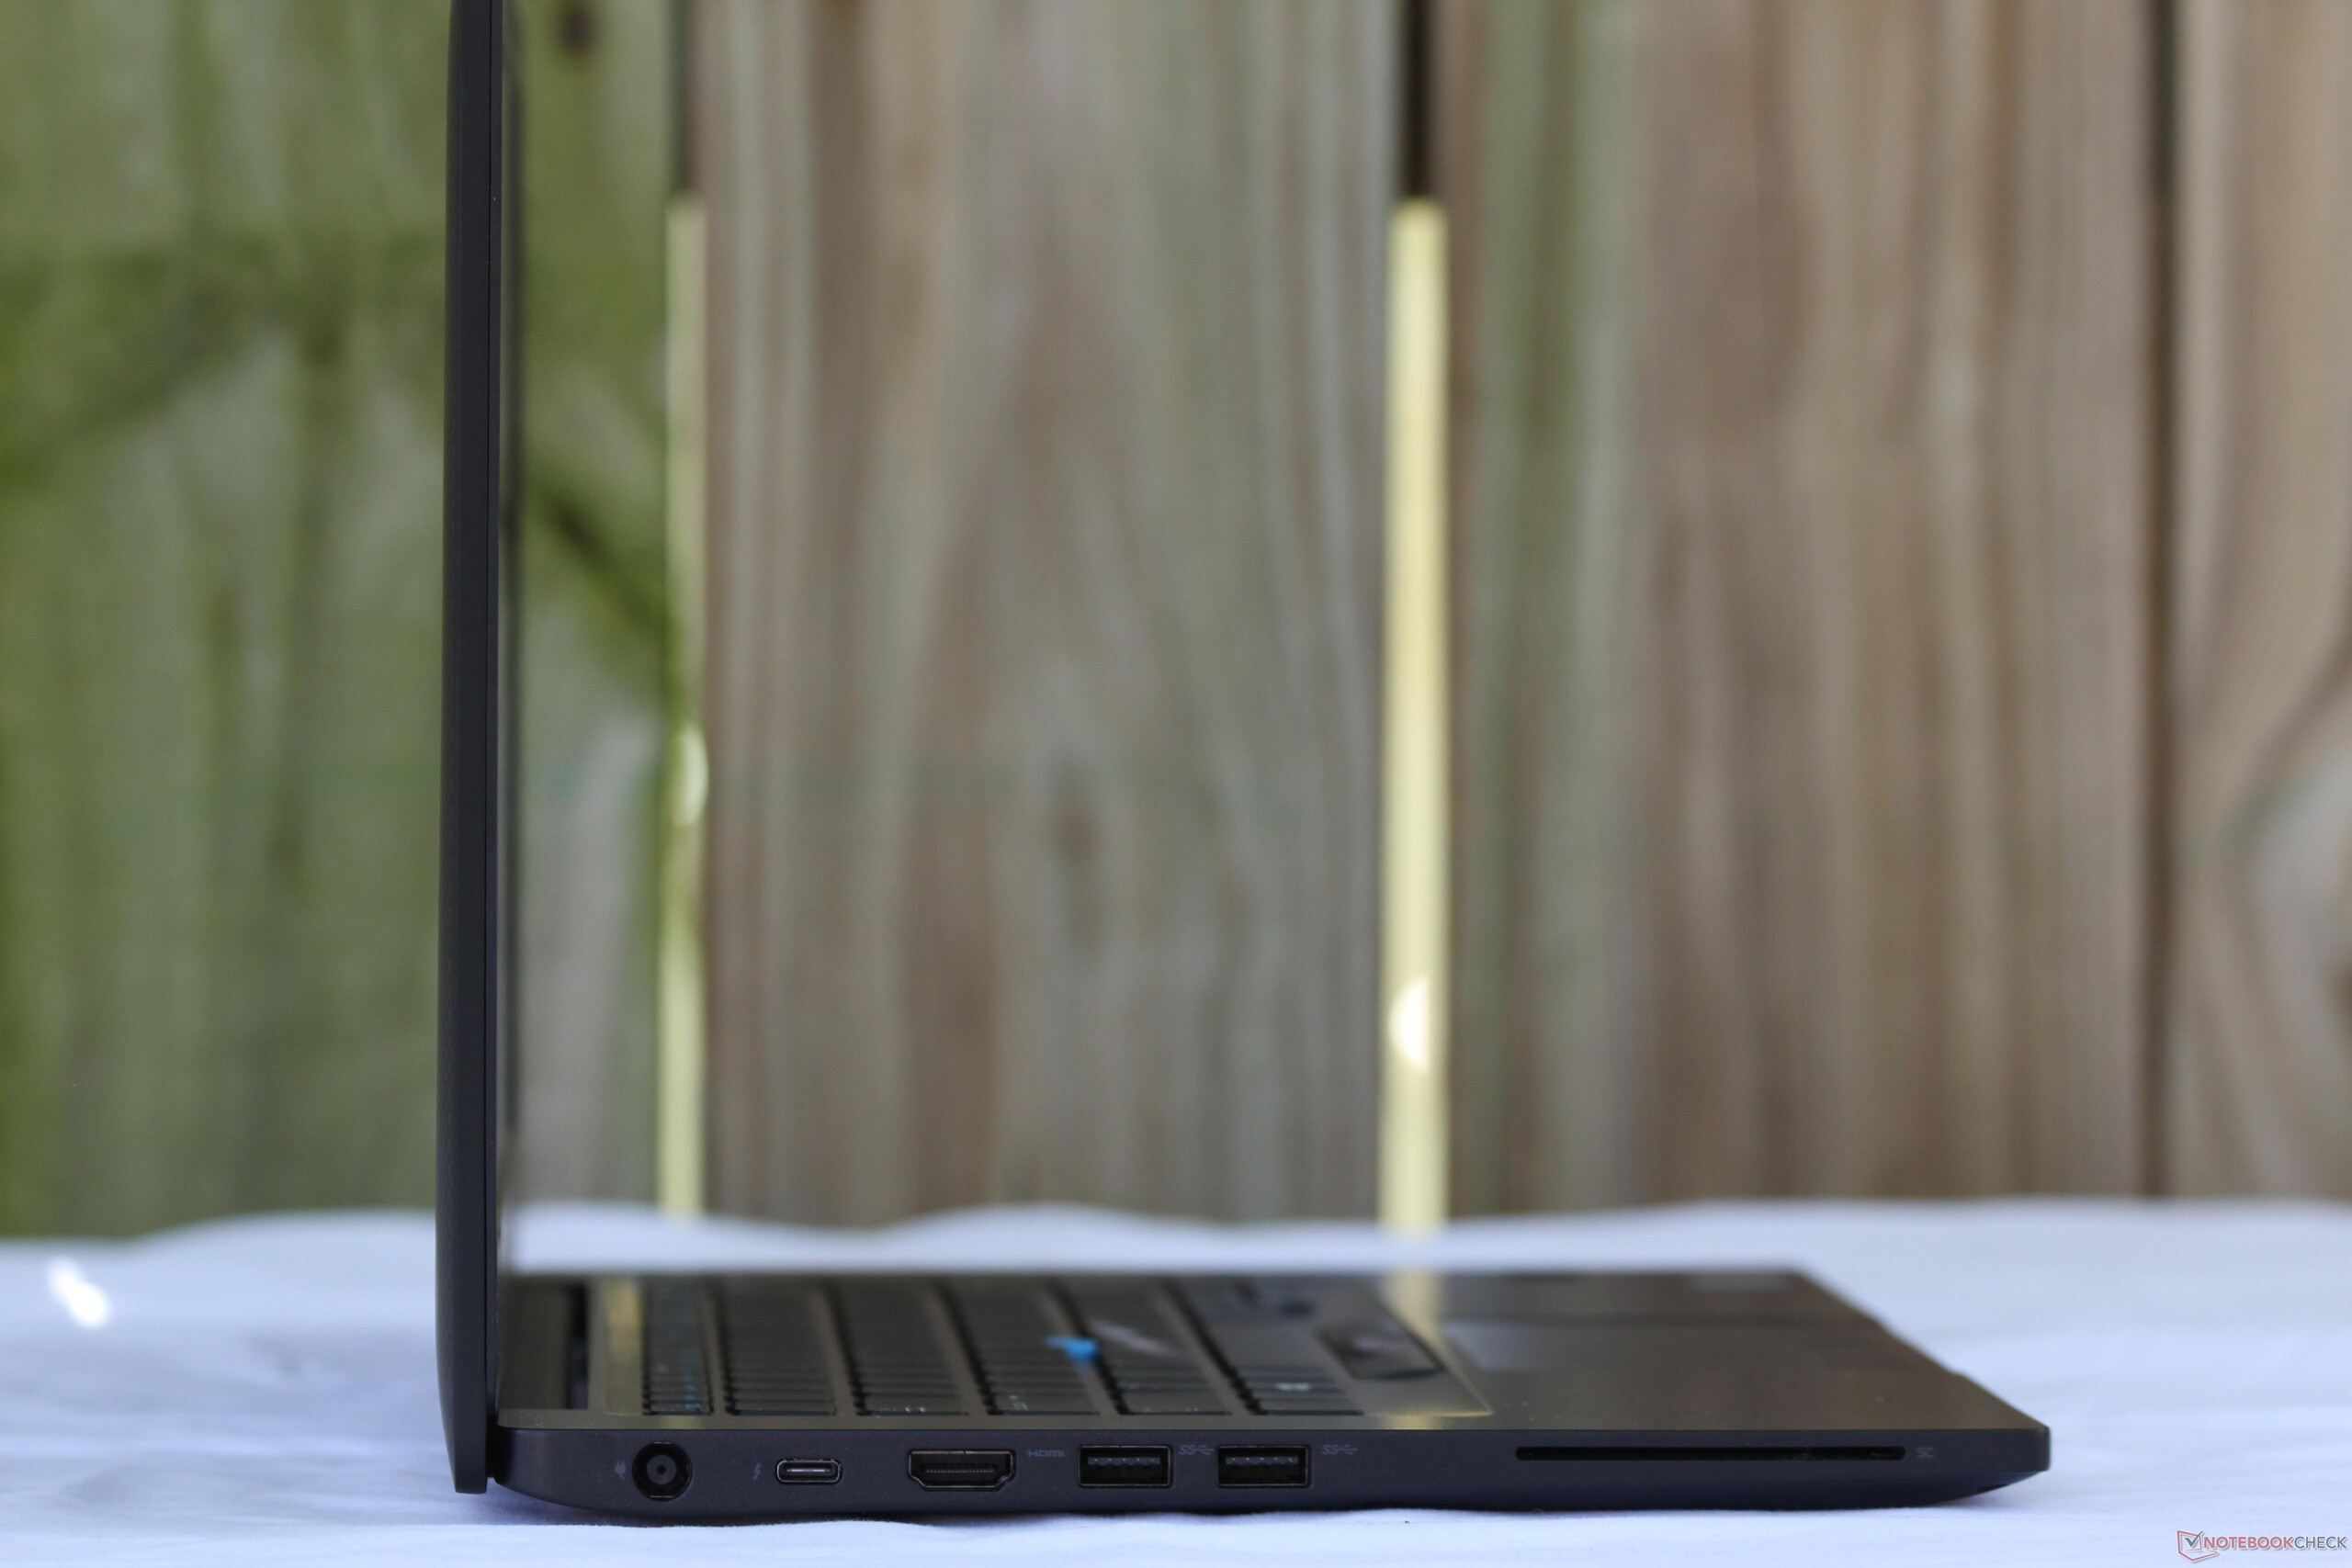
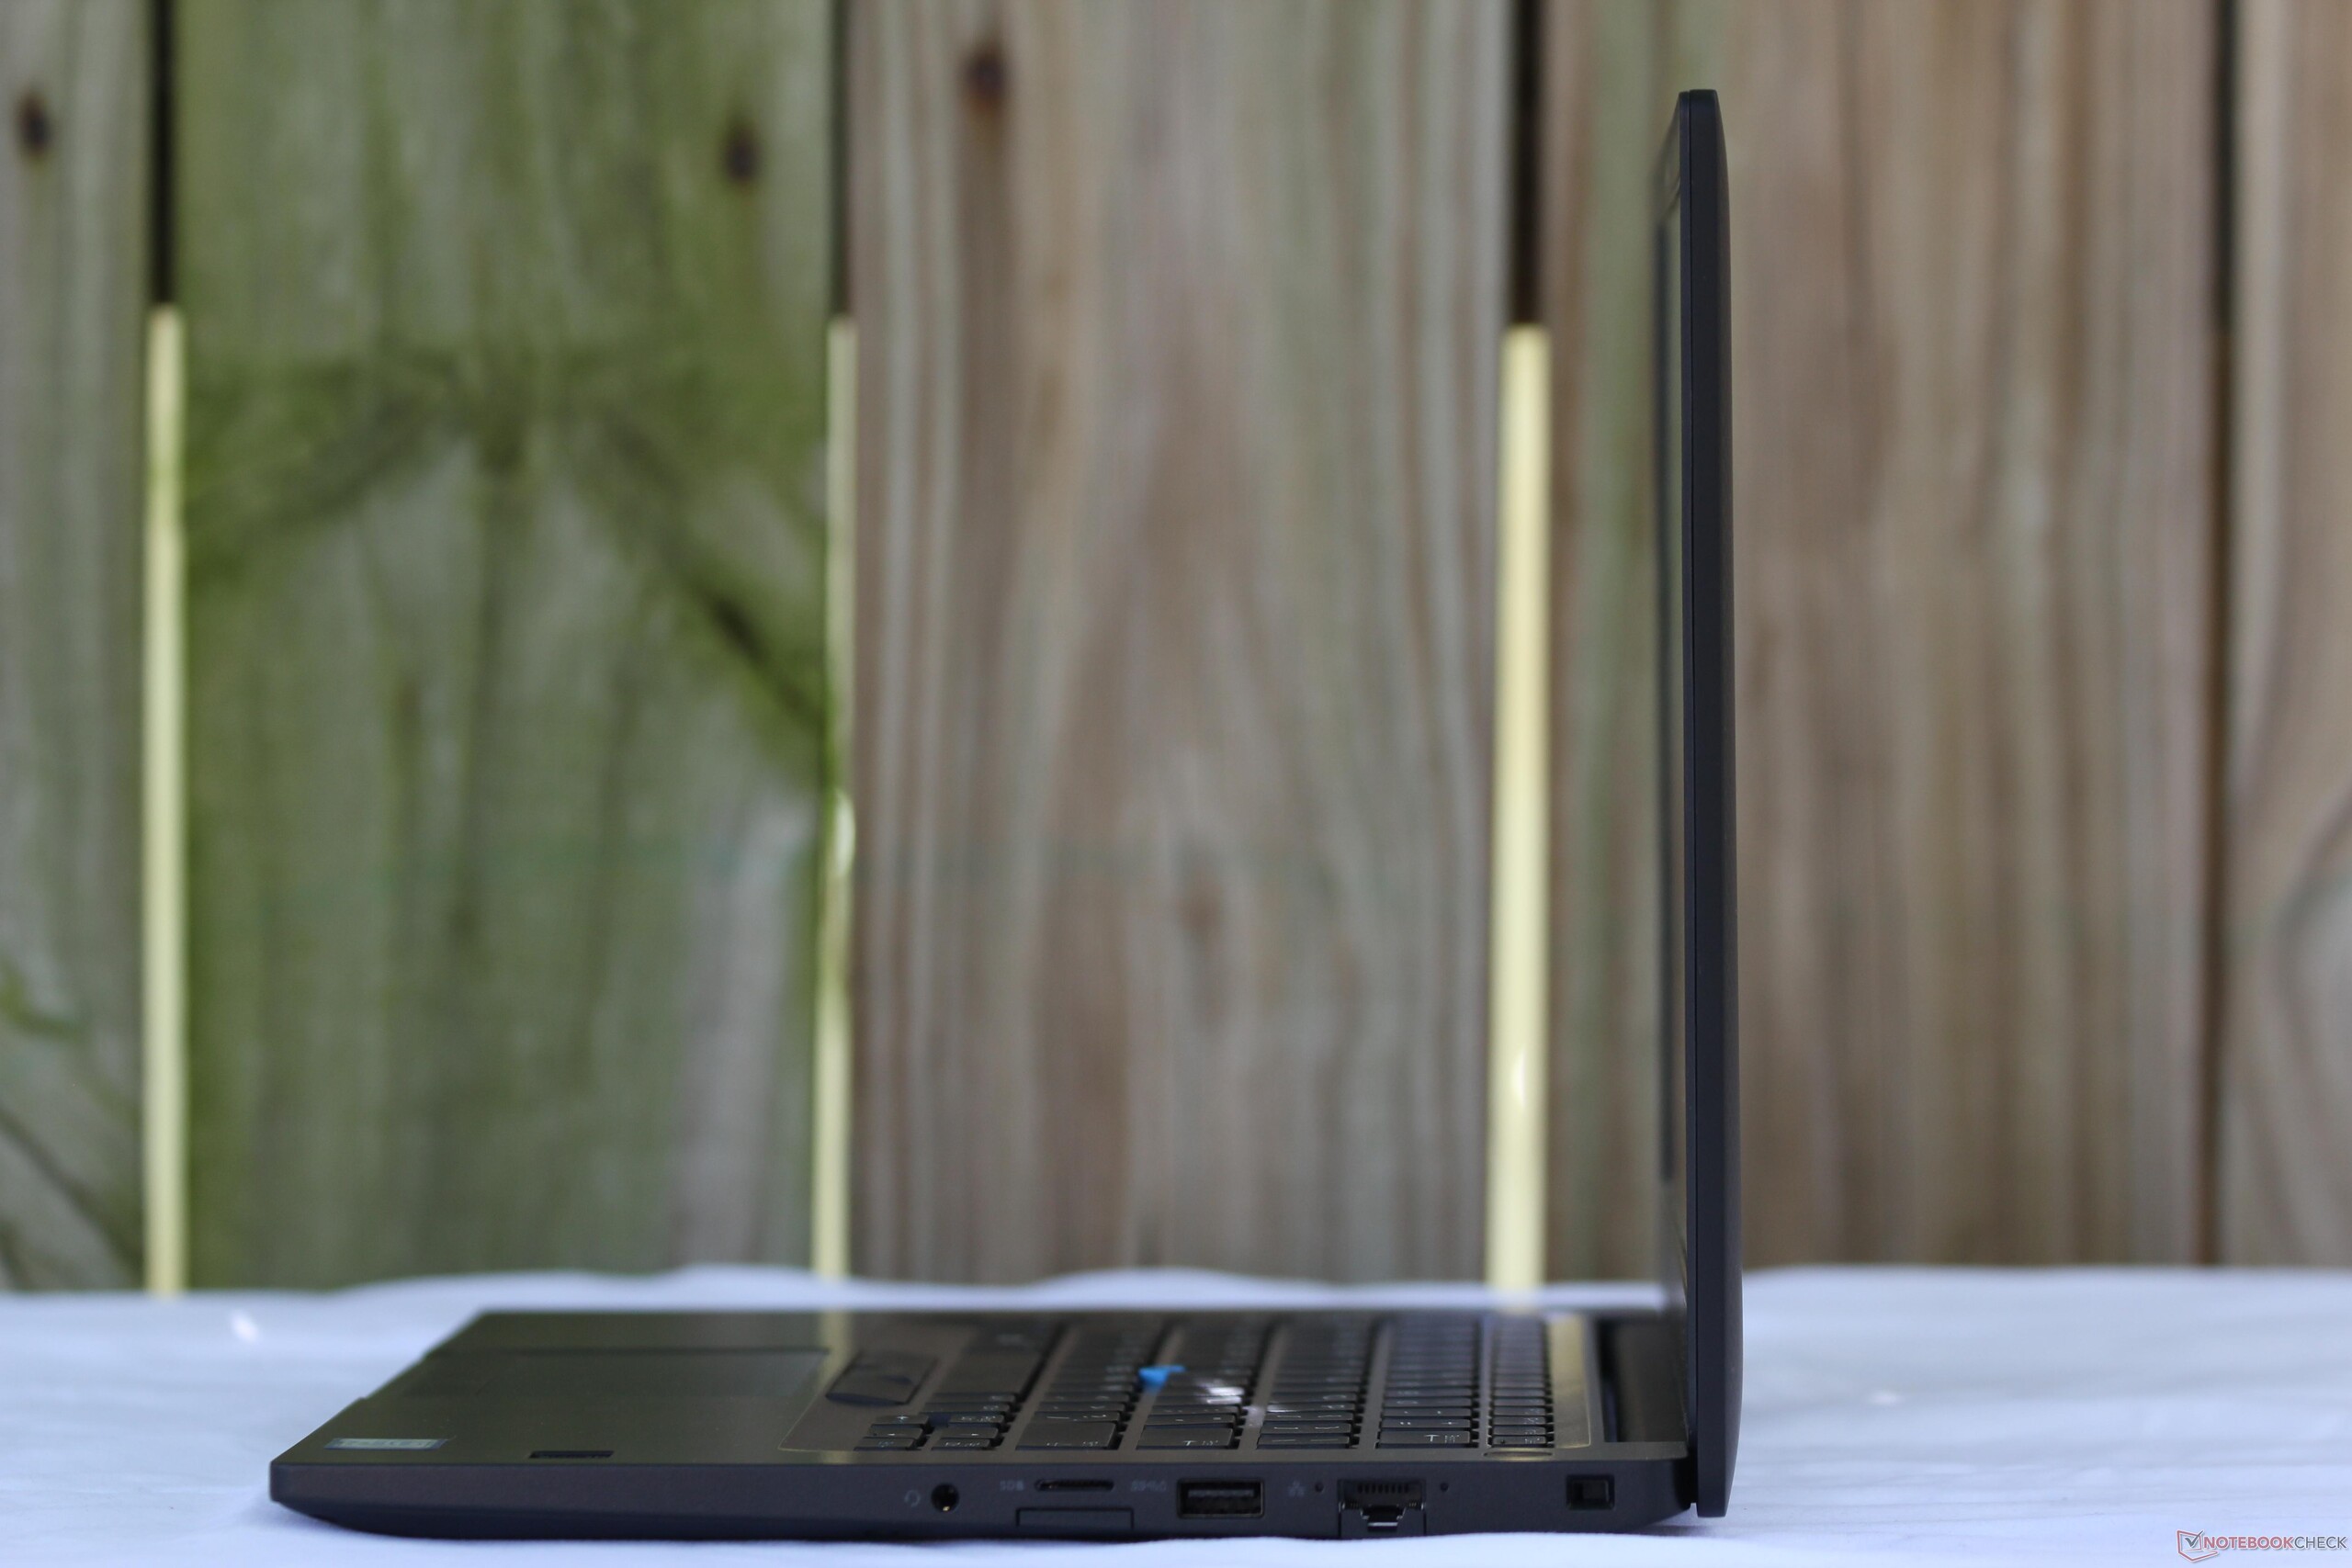
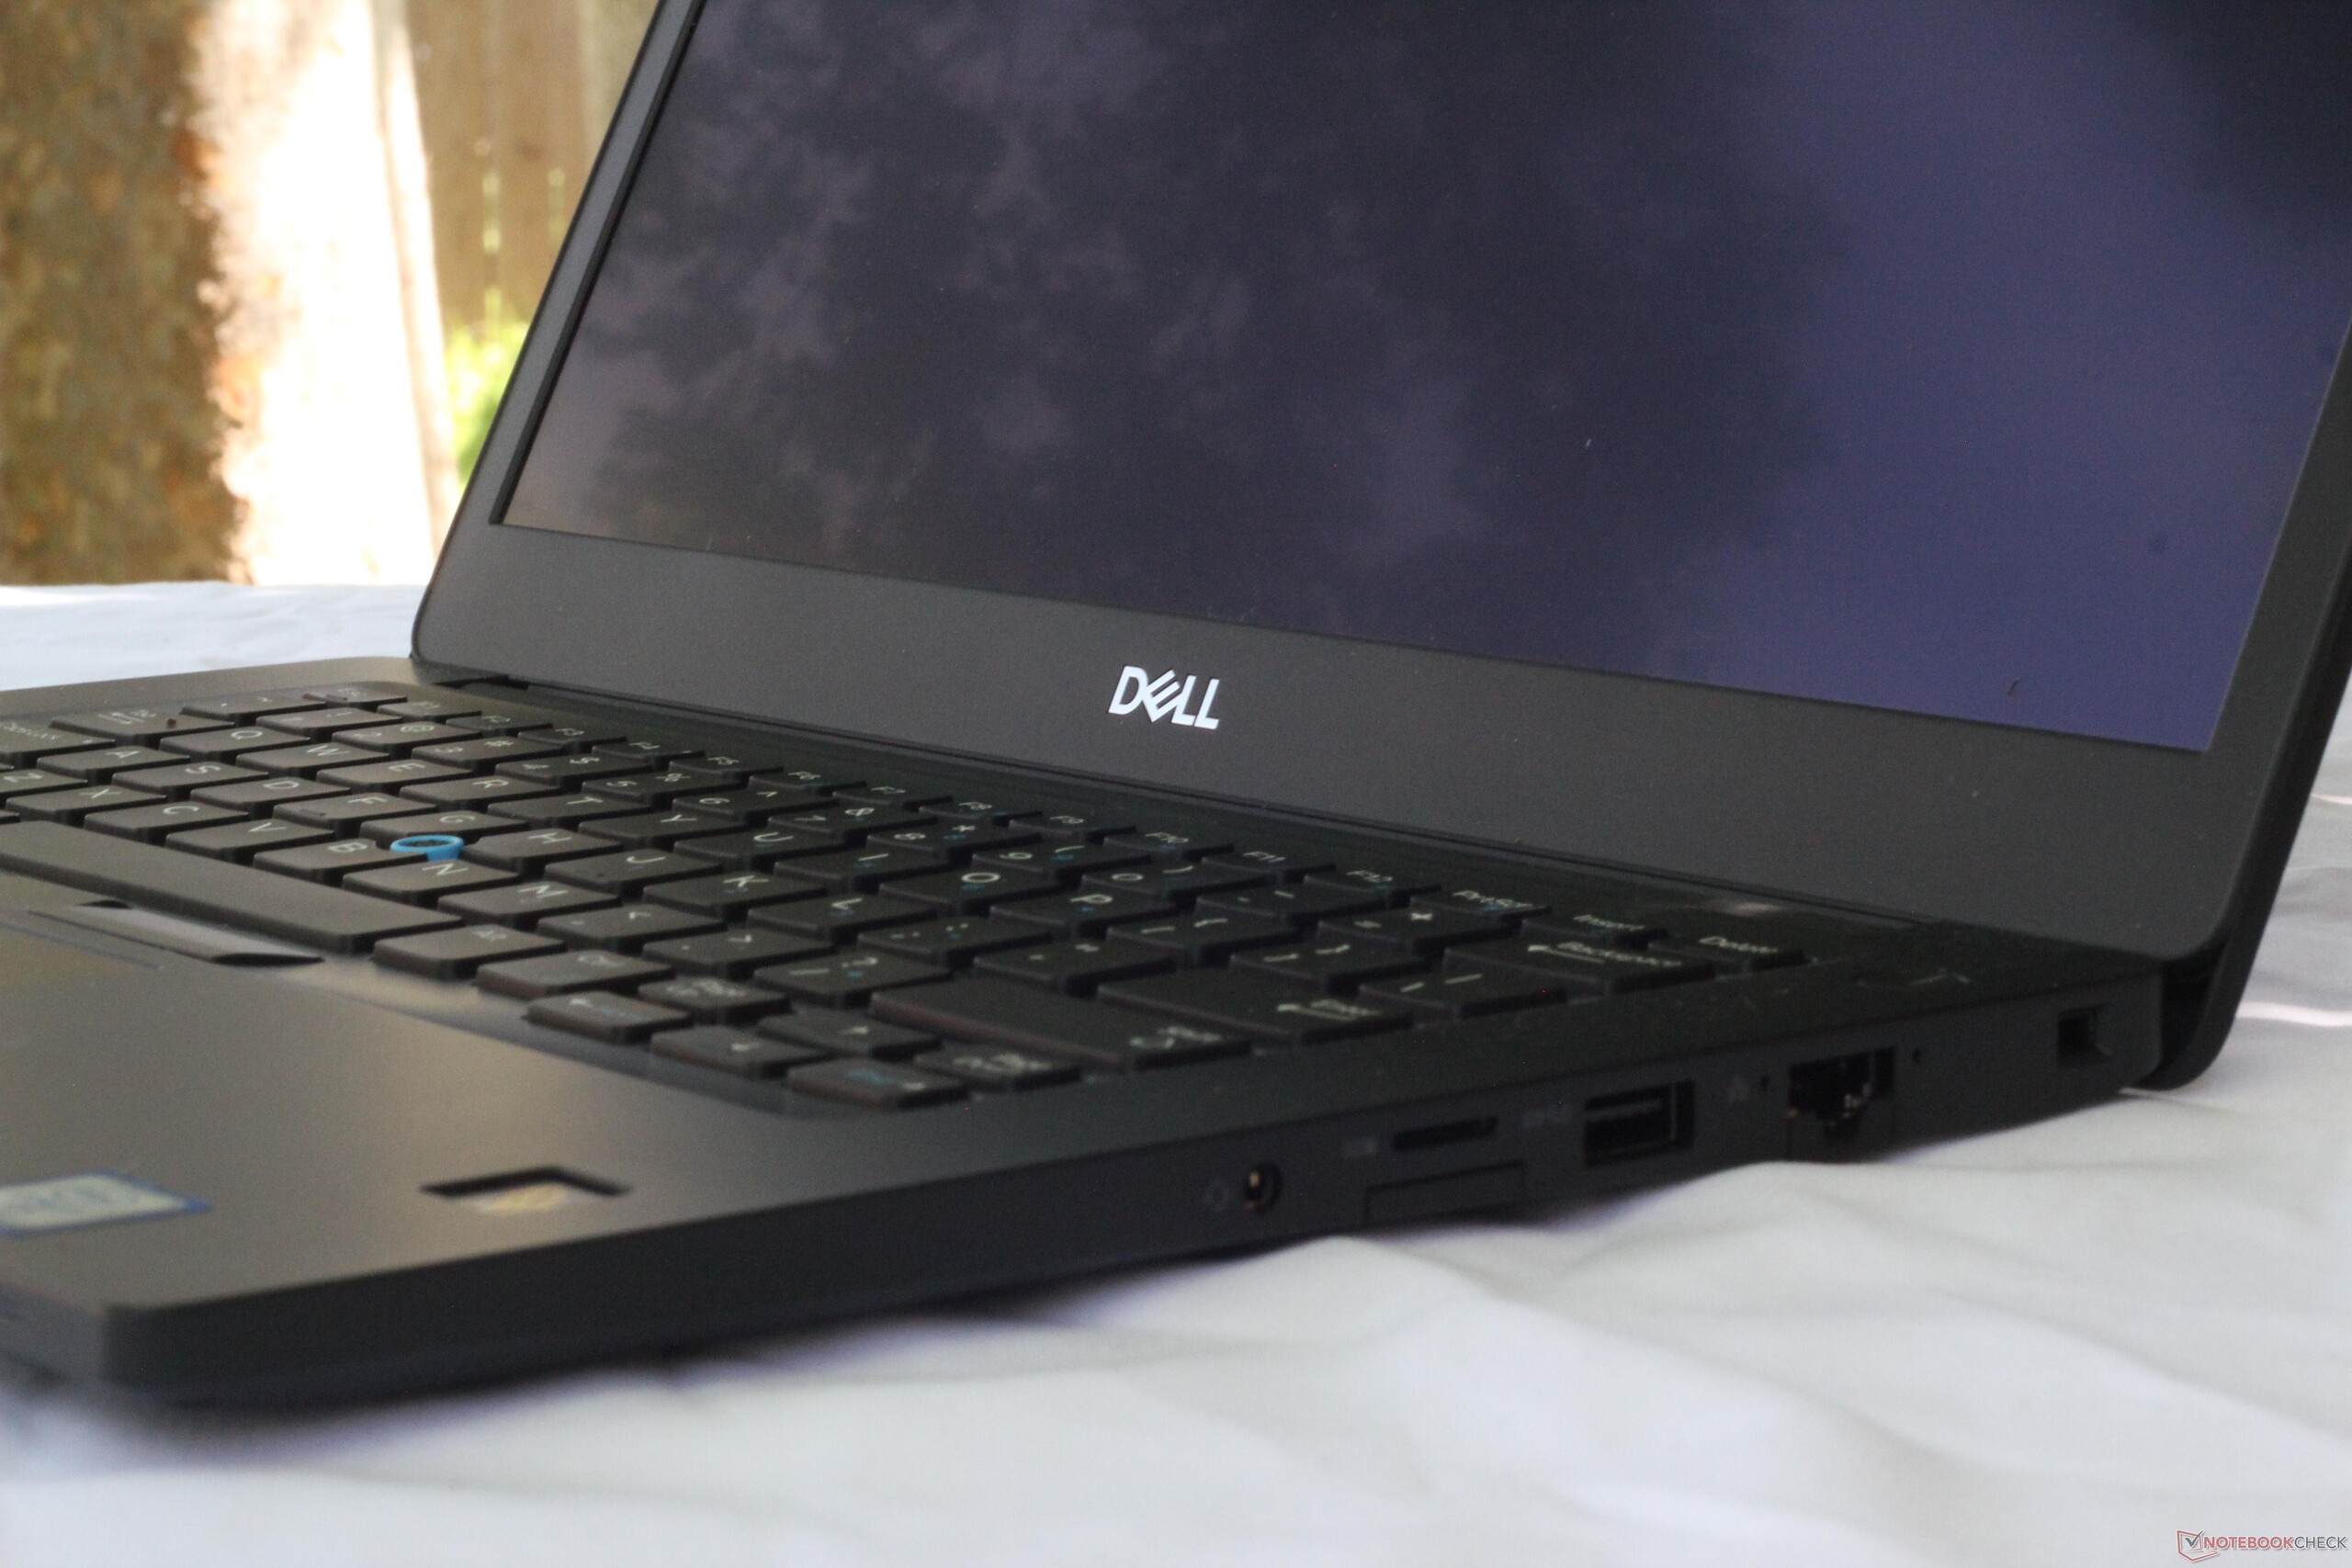
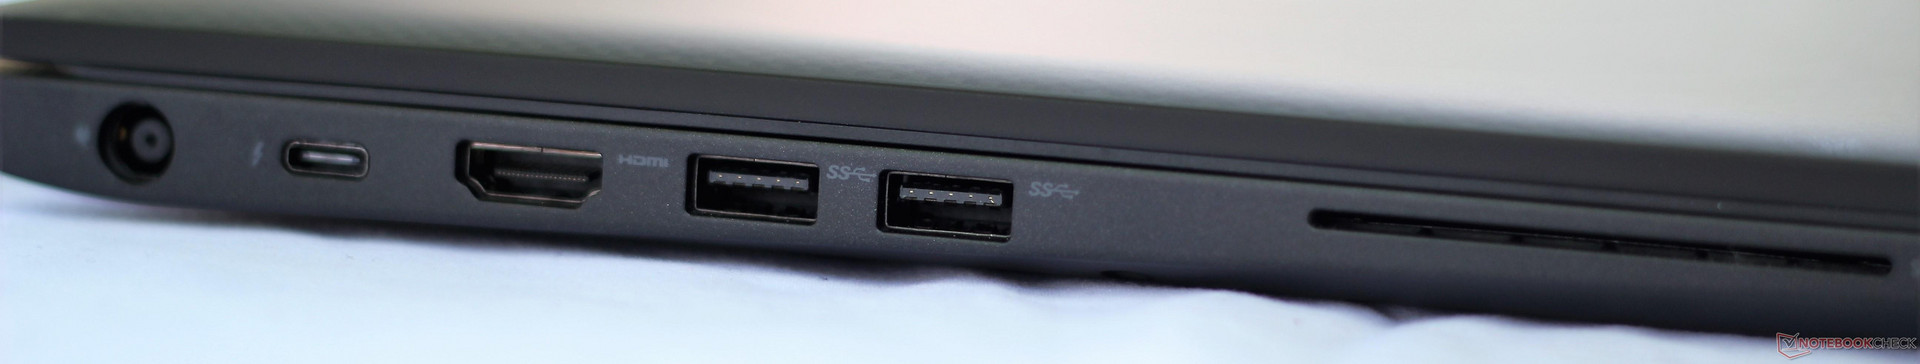
Connectivity
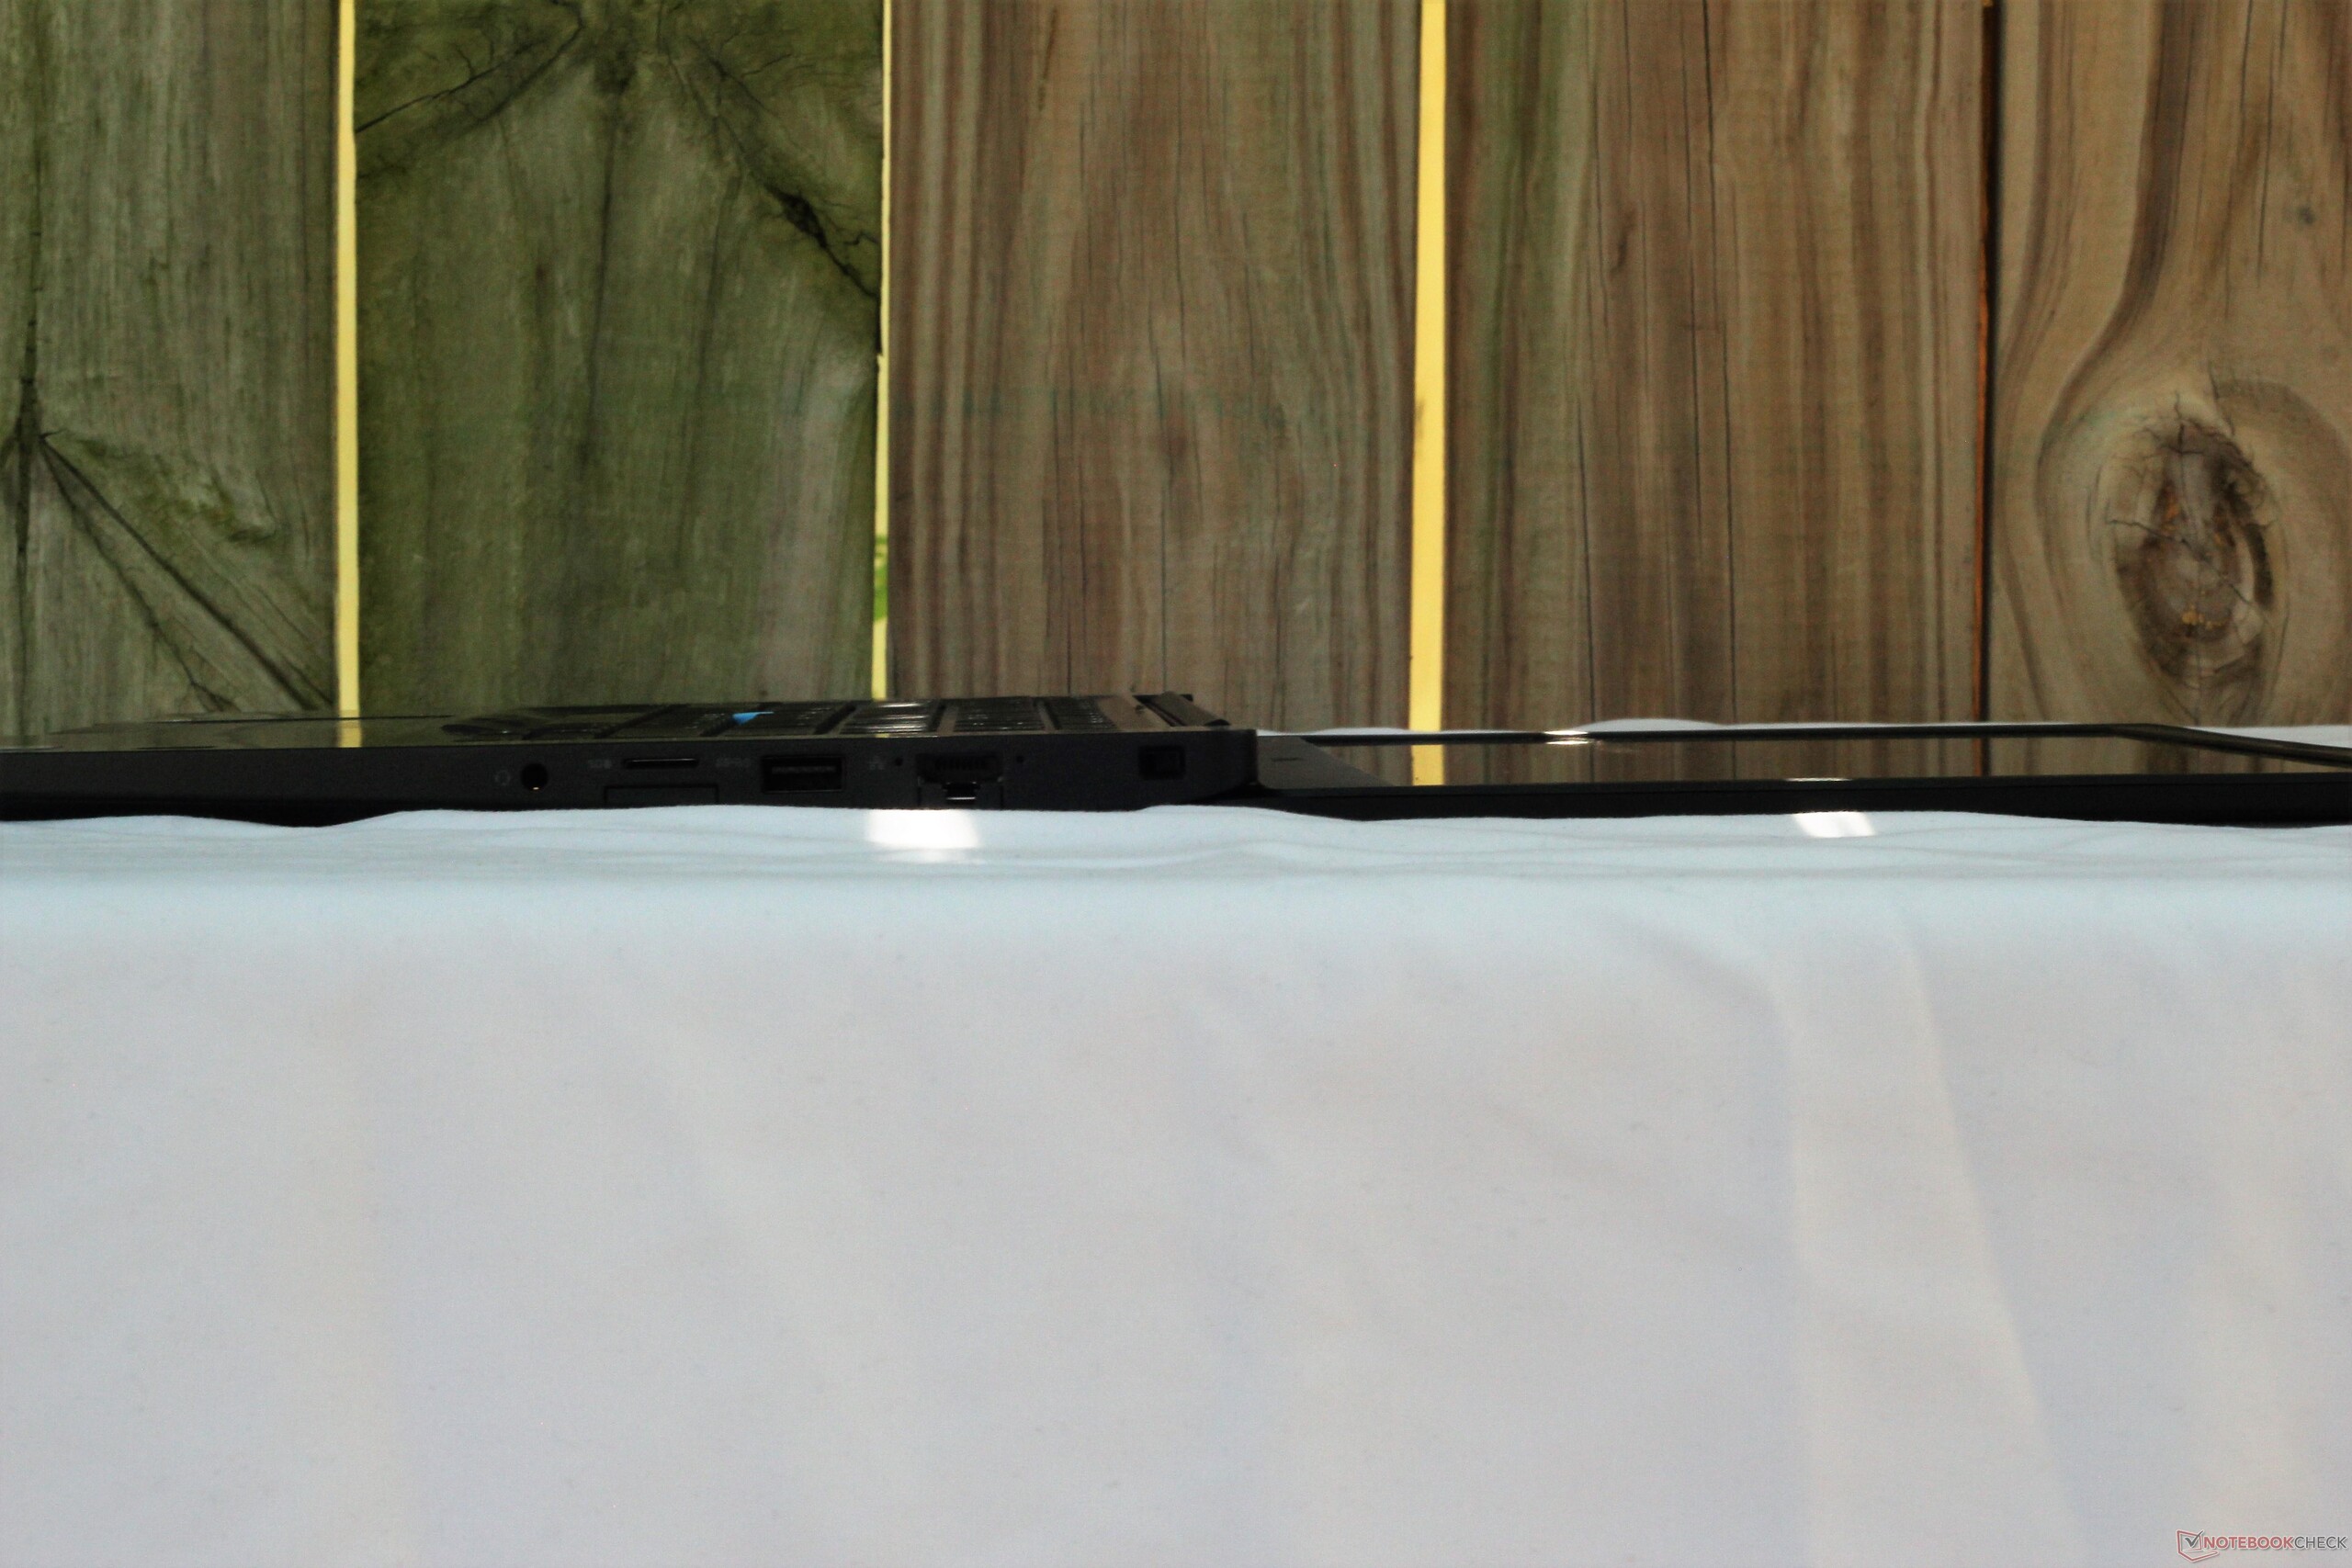
Port selection mirrors that of the 7480. The three USB 3.1 (Gen 1) Type-A ports and a Thunderbolt 3 (USB Type-C) port should handle any peripheral needs from users. The Thunderbolt 3 port also supports DisplayPort 1.2. With this and the HDMI port, the Latitude 7490 can theoretically support up to 3 displays (including the laptop's screen). The SIM tray is compatible with 4G LTE networks. It should be noted that physically security is handled by a Noble lock slot rather than the more popular Kensington standard.

SD Card Reader
Using our Toshiba Exceria ProM501 UHS-II microSD card, we recorded read speeds of 218 MB/s in AS SSD. This is exceptional, even among premium business laptops; most devices in this segment only manage between 80-100 MB/s. The only downside to the card reader is its form factor; most professionals that would appreciate this performance will likely use full-sized SD cards.
| SD Card Reader | |
| average JPG Copy Test (av. of 3 runs) | |
| Lenovo ThinkPad X1 Carbon 2018-20KGS03900 (Toshiba Exceria Pro M501) | |
| Dell Latitude 7490 (Toshiba Exceria Pro M501 UHS-II) | |
| Lenovo ThinkPad T480-20L6S01V00 (Toshiba Exceria Pro SDXC 64 GB UHS-II) | |
| Dell Latitude 7480 (Toshiba (Exceria Pro SDXC UHS-II 64 GB) | |
| Toshiba Tecra X40-D | |
| Lenovo ThinkPad T480s-20L8S02E00 (Toshiba Exceria Pro SDXC 64 GB UHS-II) | |
| Average of class Office (8 - 82.7, n=49, last 2 years) | |
| maximum AS SSD Seq Read Test (1GB) | |
| Lenovo ThinkPad X1 Carbon 2018-20KGS03900 (Toshiba Exceria Pro M501) | |
| Dell Latitude 7490 (Toshiba Exceria Pro M501 UHS-II) | |
| Dell Latitude 7480 (Toshiba (Exceria Pro SDXC UHS-II 64 GB) | |
| Lenovo ThinkPad T480s-20L8S02E00 (Toshiba Exceria Pro SDXC 64 GB UHS-II) | |
| Toshiba Tecra X40-D | |
| Lenovo ThinkPad T480-20L6S01V00 (Toshiba Exceria Pro SDXC 64 GB UHS-II) | |
| Average of class Office (25 - 90.5, n=43, last 2 years) | |
Communication
Wireless speeds are fantastic. Transmit performance hovers around 525 MBit/s, while receive speeds are about 635 MBit/s. Most business notebooks offer excellent wireless speeds, but the Latitude 7490 is a leader. During our testing, we were able to maintain connection at distances of about 25-30 m.
The Latitude 7490 also uses Dell's new Active Steering Antenna technology. This feature allows the wireless card to detect the strongest radio signals available and dynamically configure itself to pick up those wavelengths for the most stable connection possible.
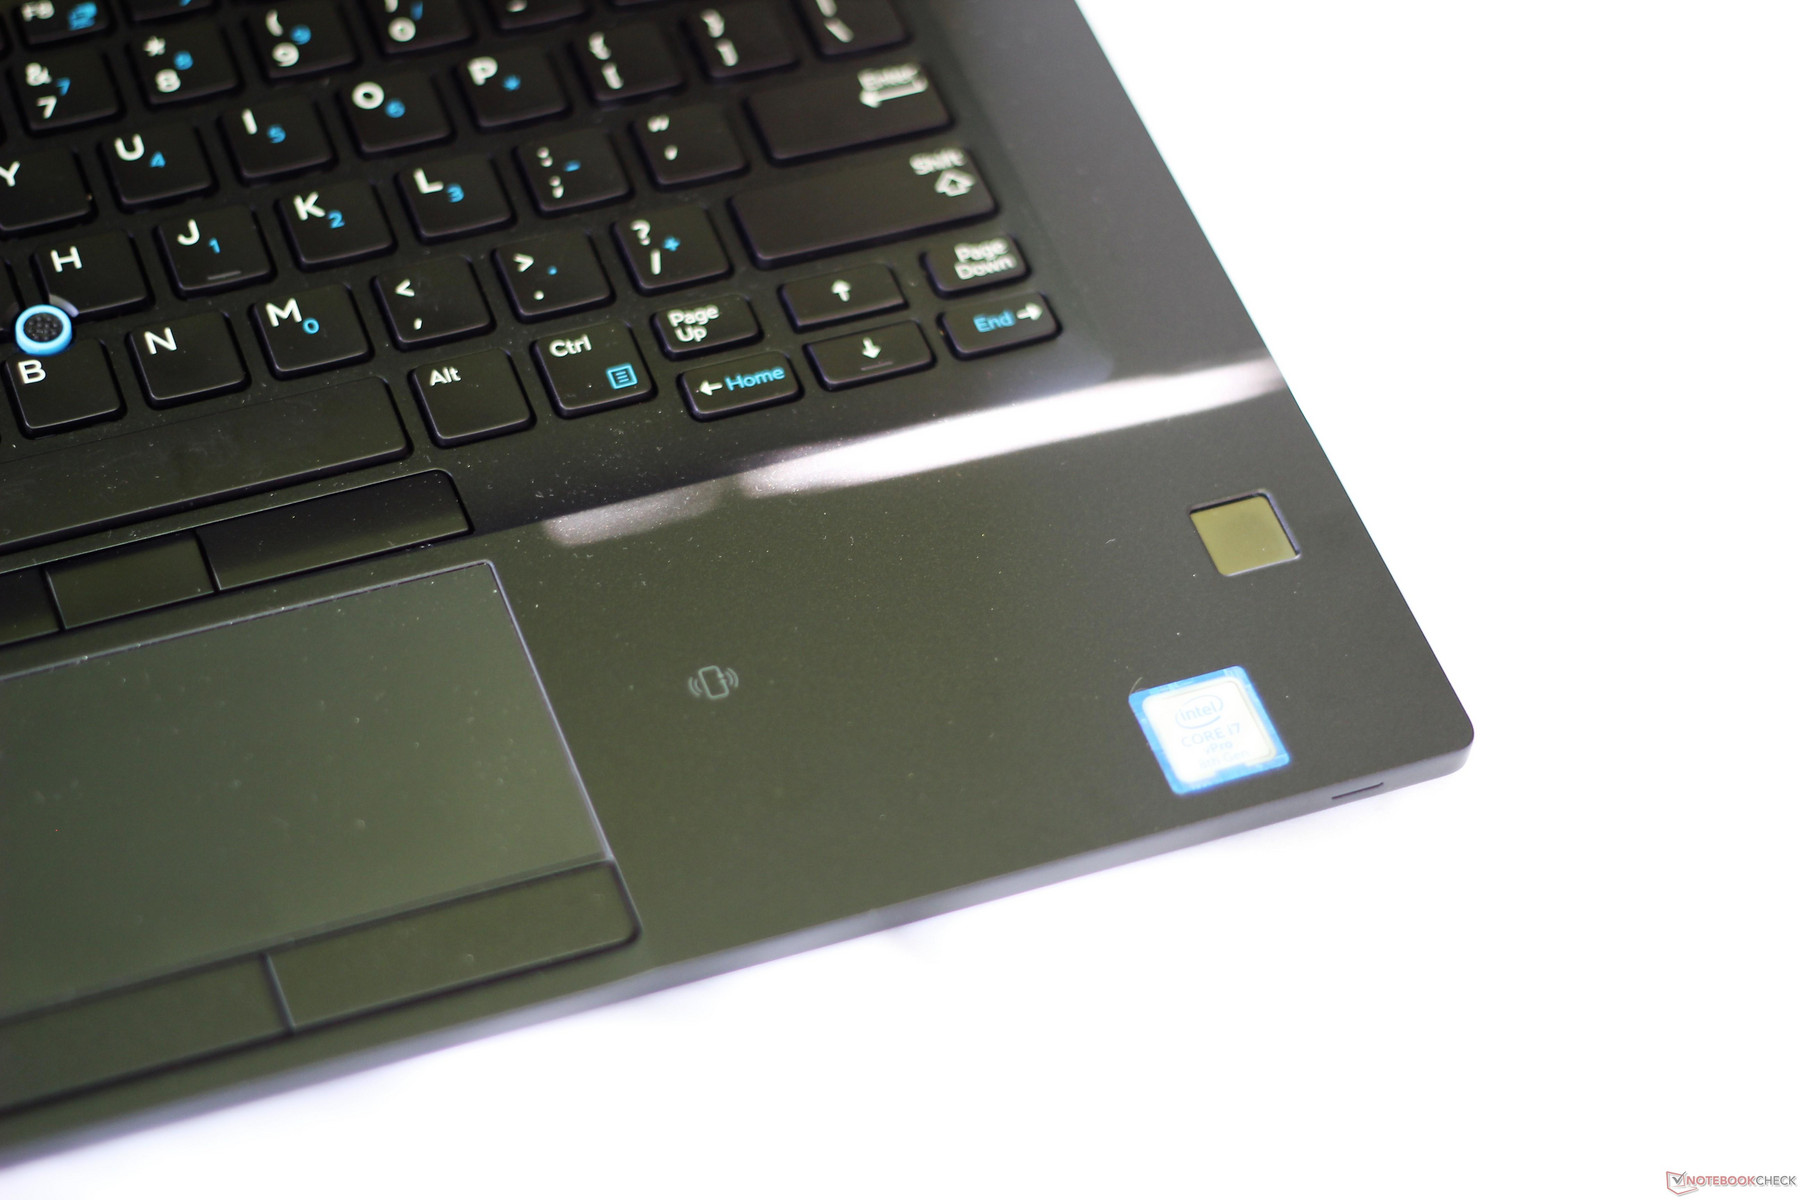
Security
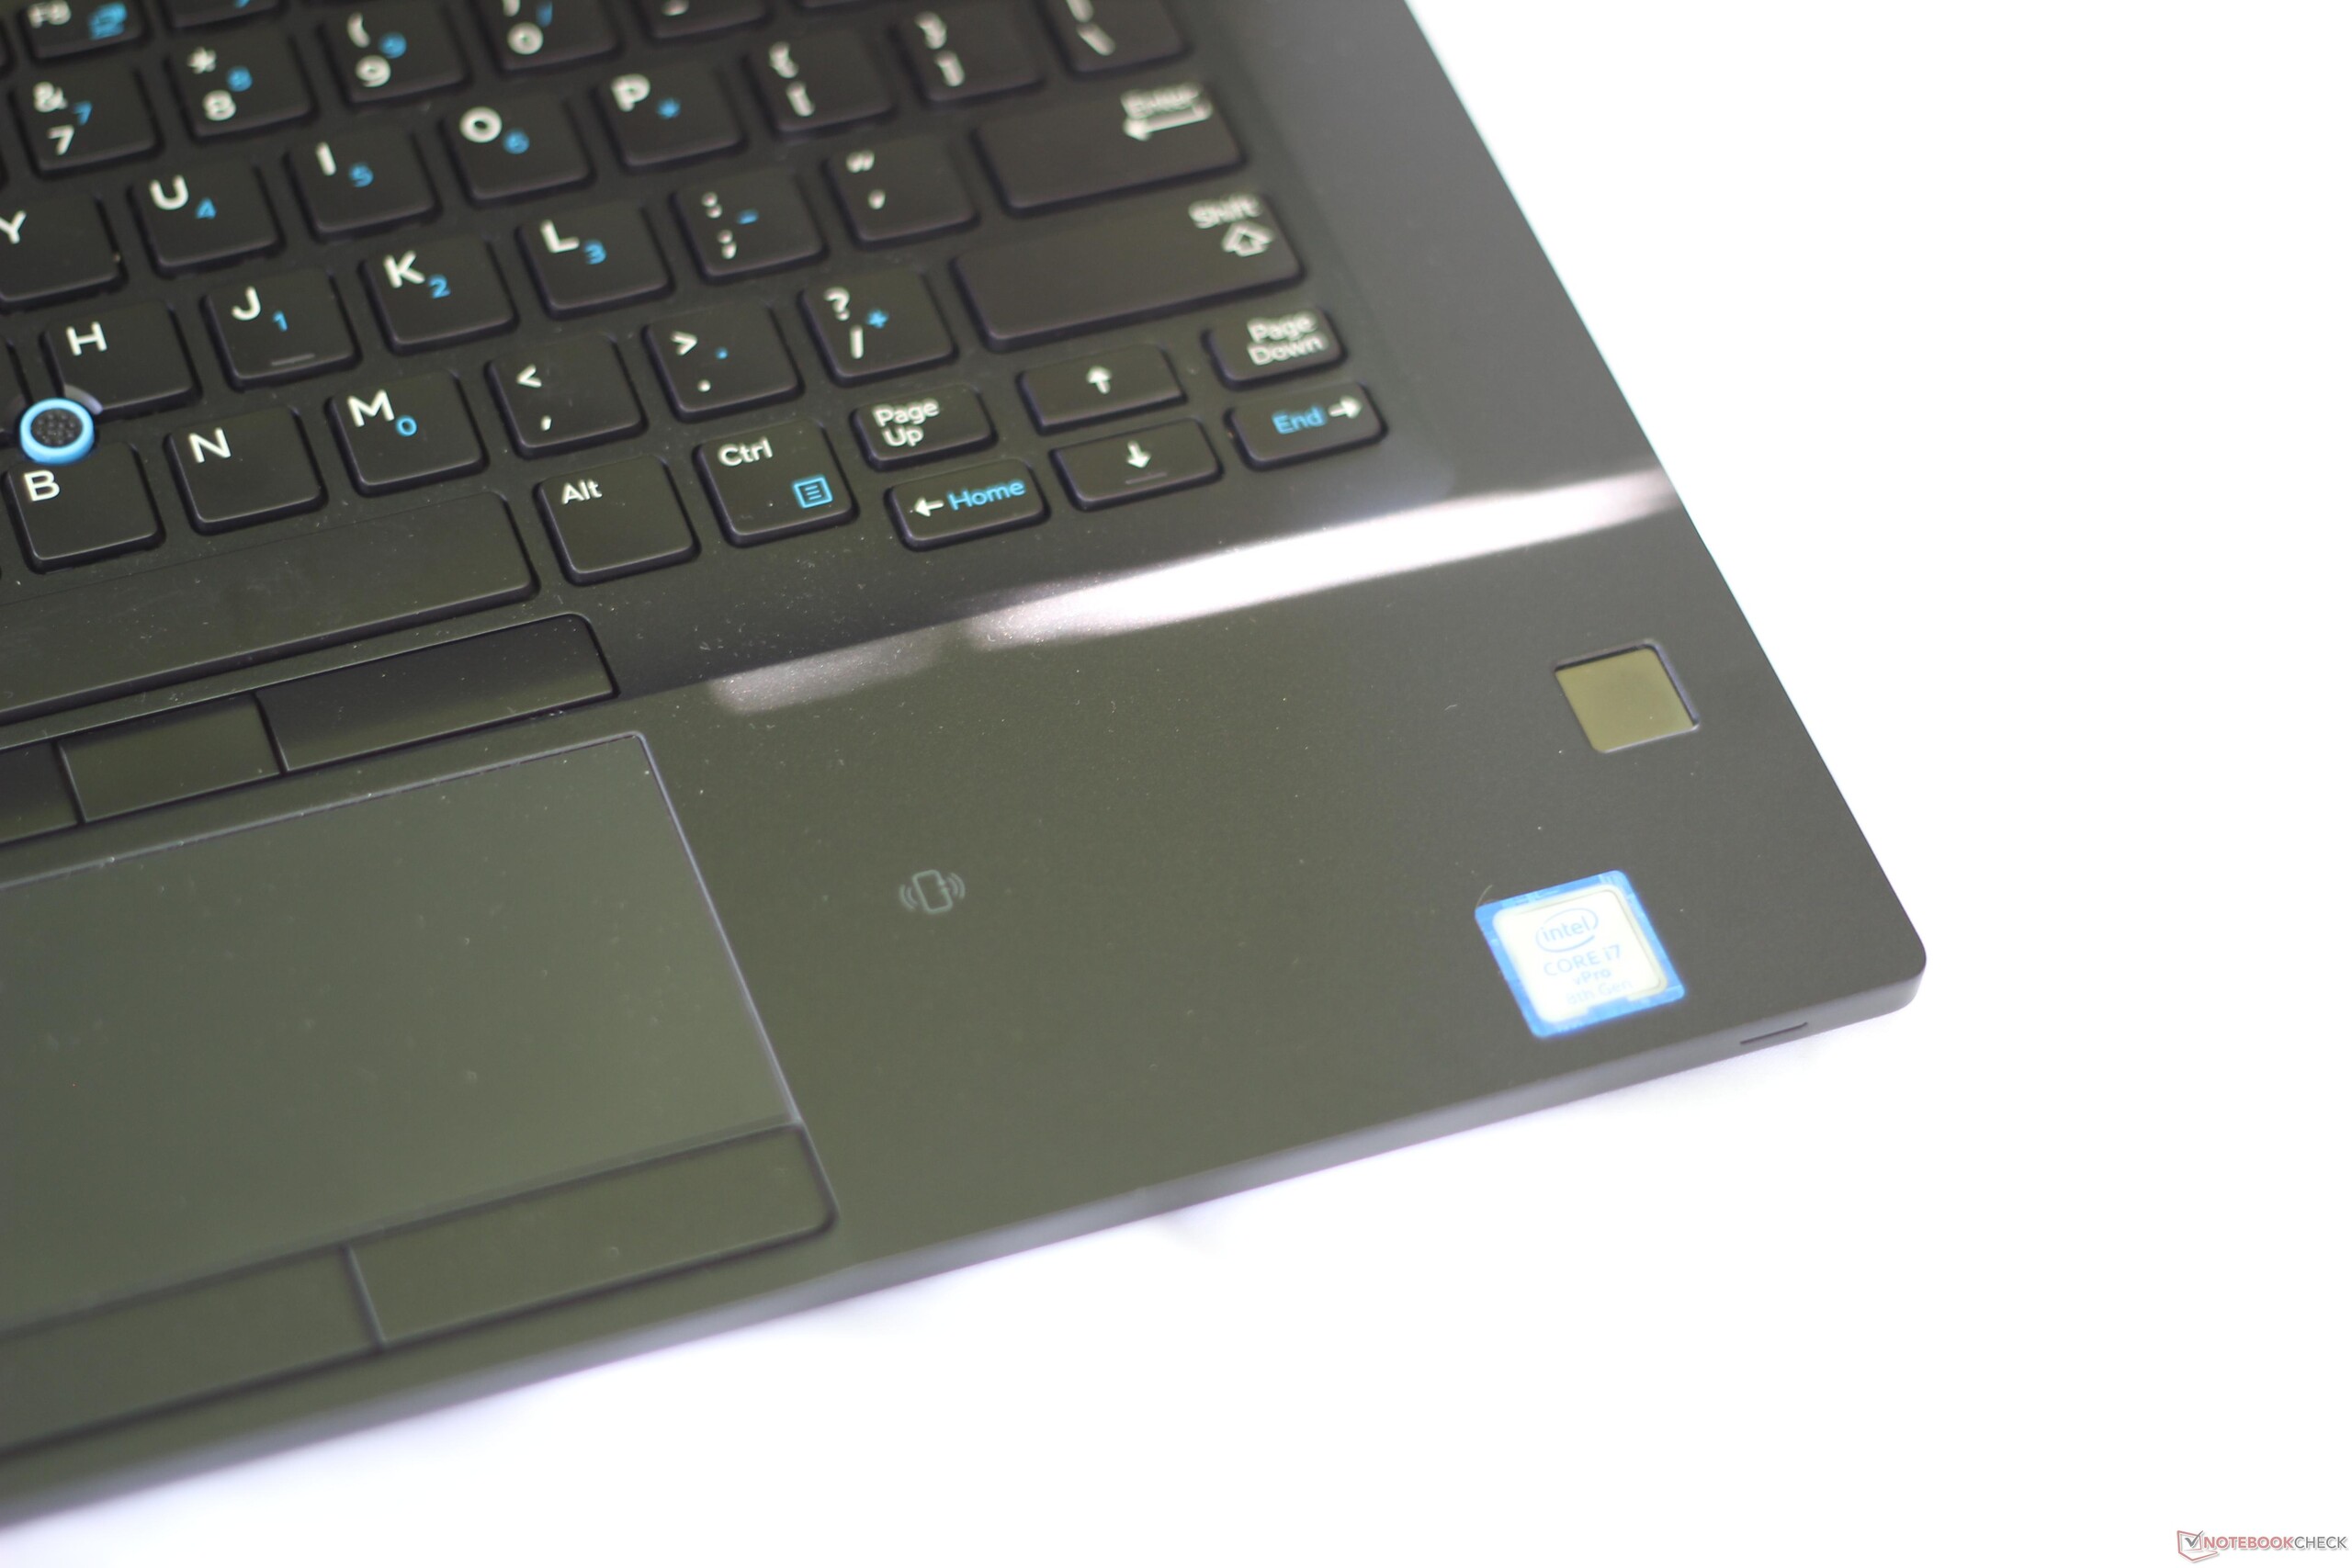
The Latitude 7490 offers a bevy of security options, including a fingerprint reader, an NFC contact point, and Smart Card reader. The fingerprint reader works reliably with infrequent failures; after a misread, lifting and replacing the finger resulted in a success. Our model is also equipped with an optional IR Camera that uses facial recognition instead of iris scanning for quick logins. As such, glasses are able to fool the camera and result in a failure.
Dell packages a slew of security software, including a Client Command Suite and Data Protection collection. These allow for a fairly granular level of control over system access.

Accessories
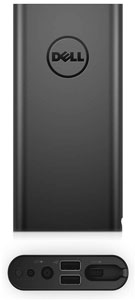
In addition to the TB16 Thunderbolt dock and Wireless Dock, Dell also offers an external laptop battery pack. The Power Bank Plus is available in either 12,000 mAh (USD $100) or 18,000 mAh (USD $120) capacities. The Power Bank Plus has two USB Type-A ports for USB chargers and includes two laptop charging cables that are compatible with most of Dell's catalog. The battery pack itself can be charged by a compatible notebook's charger. A full compatibility list can be found at Dell's site.
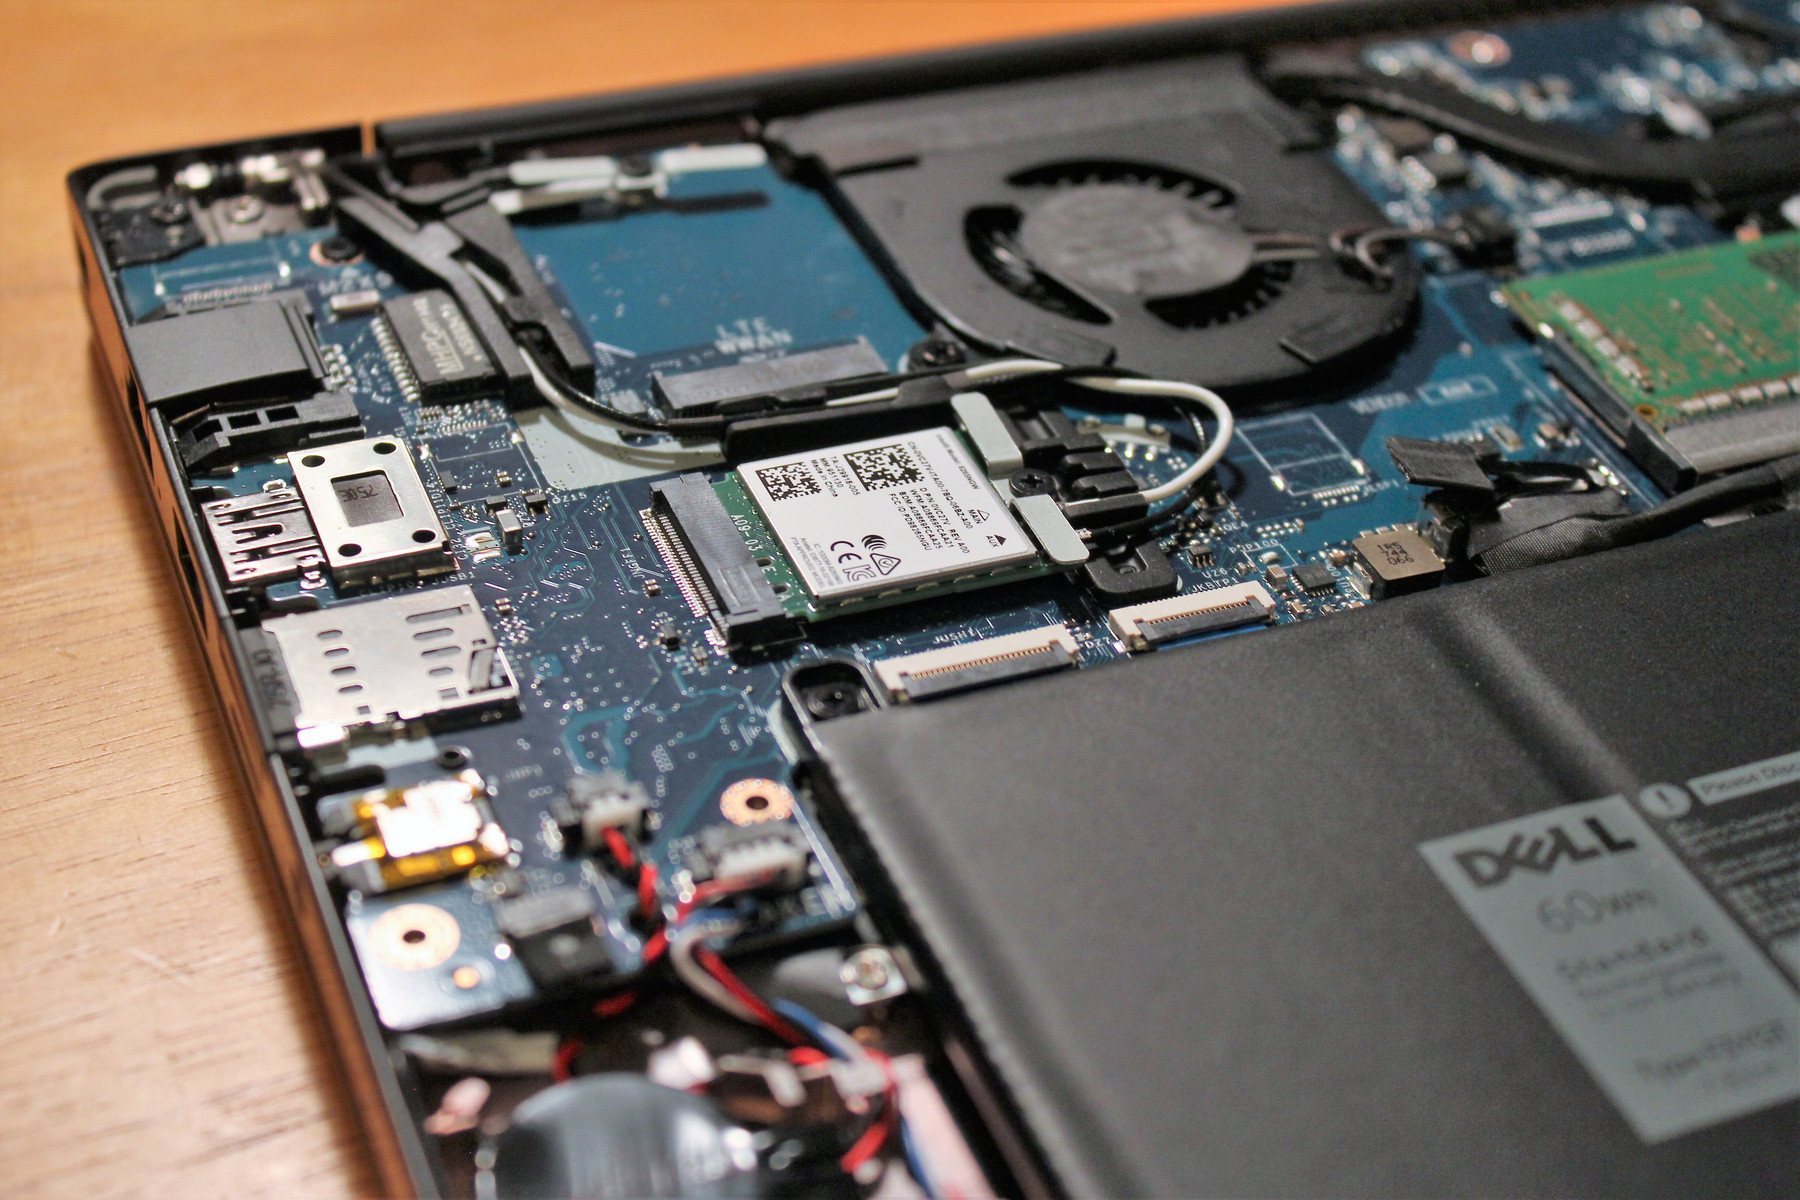
Maintenance
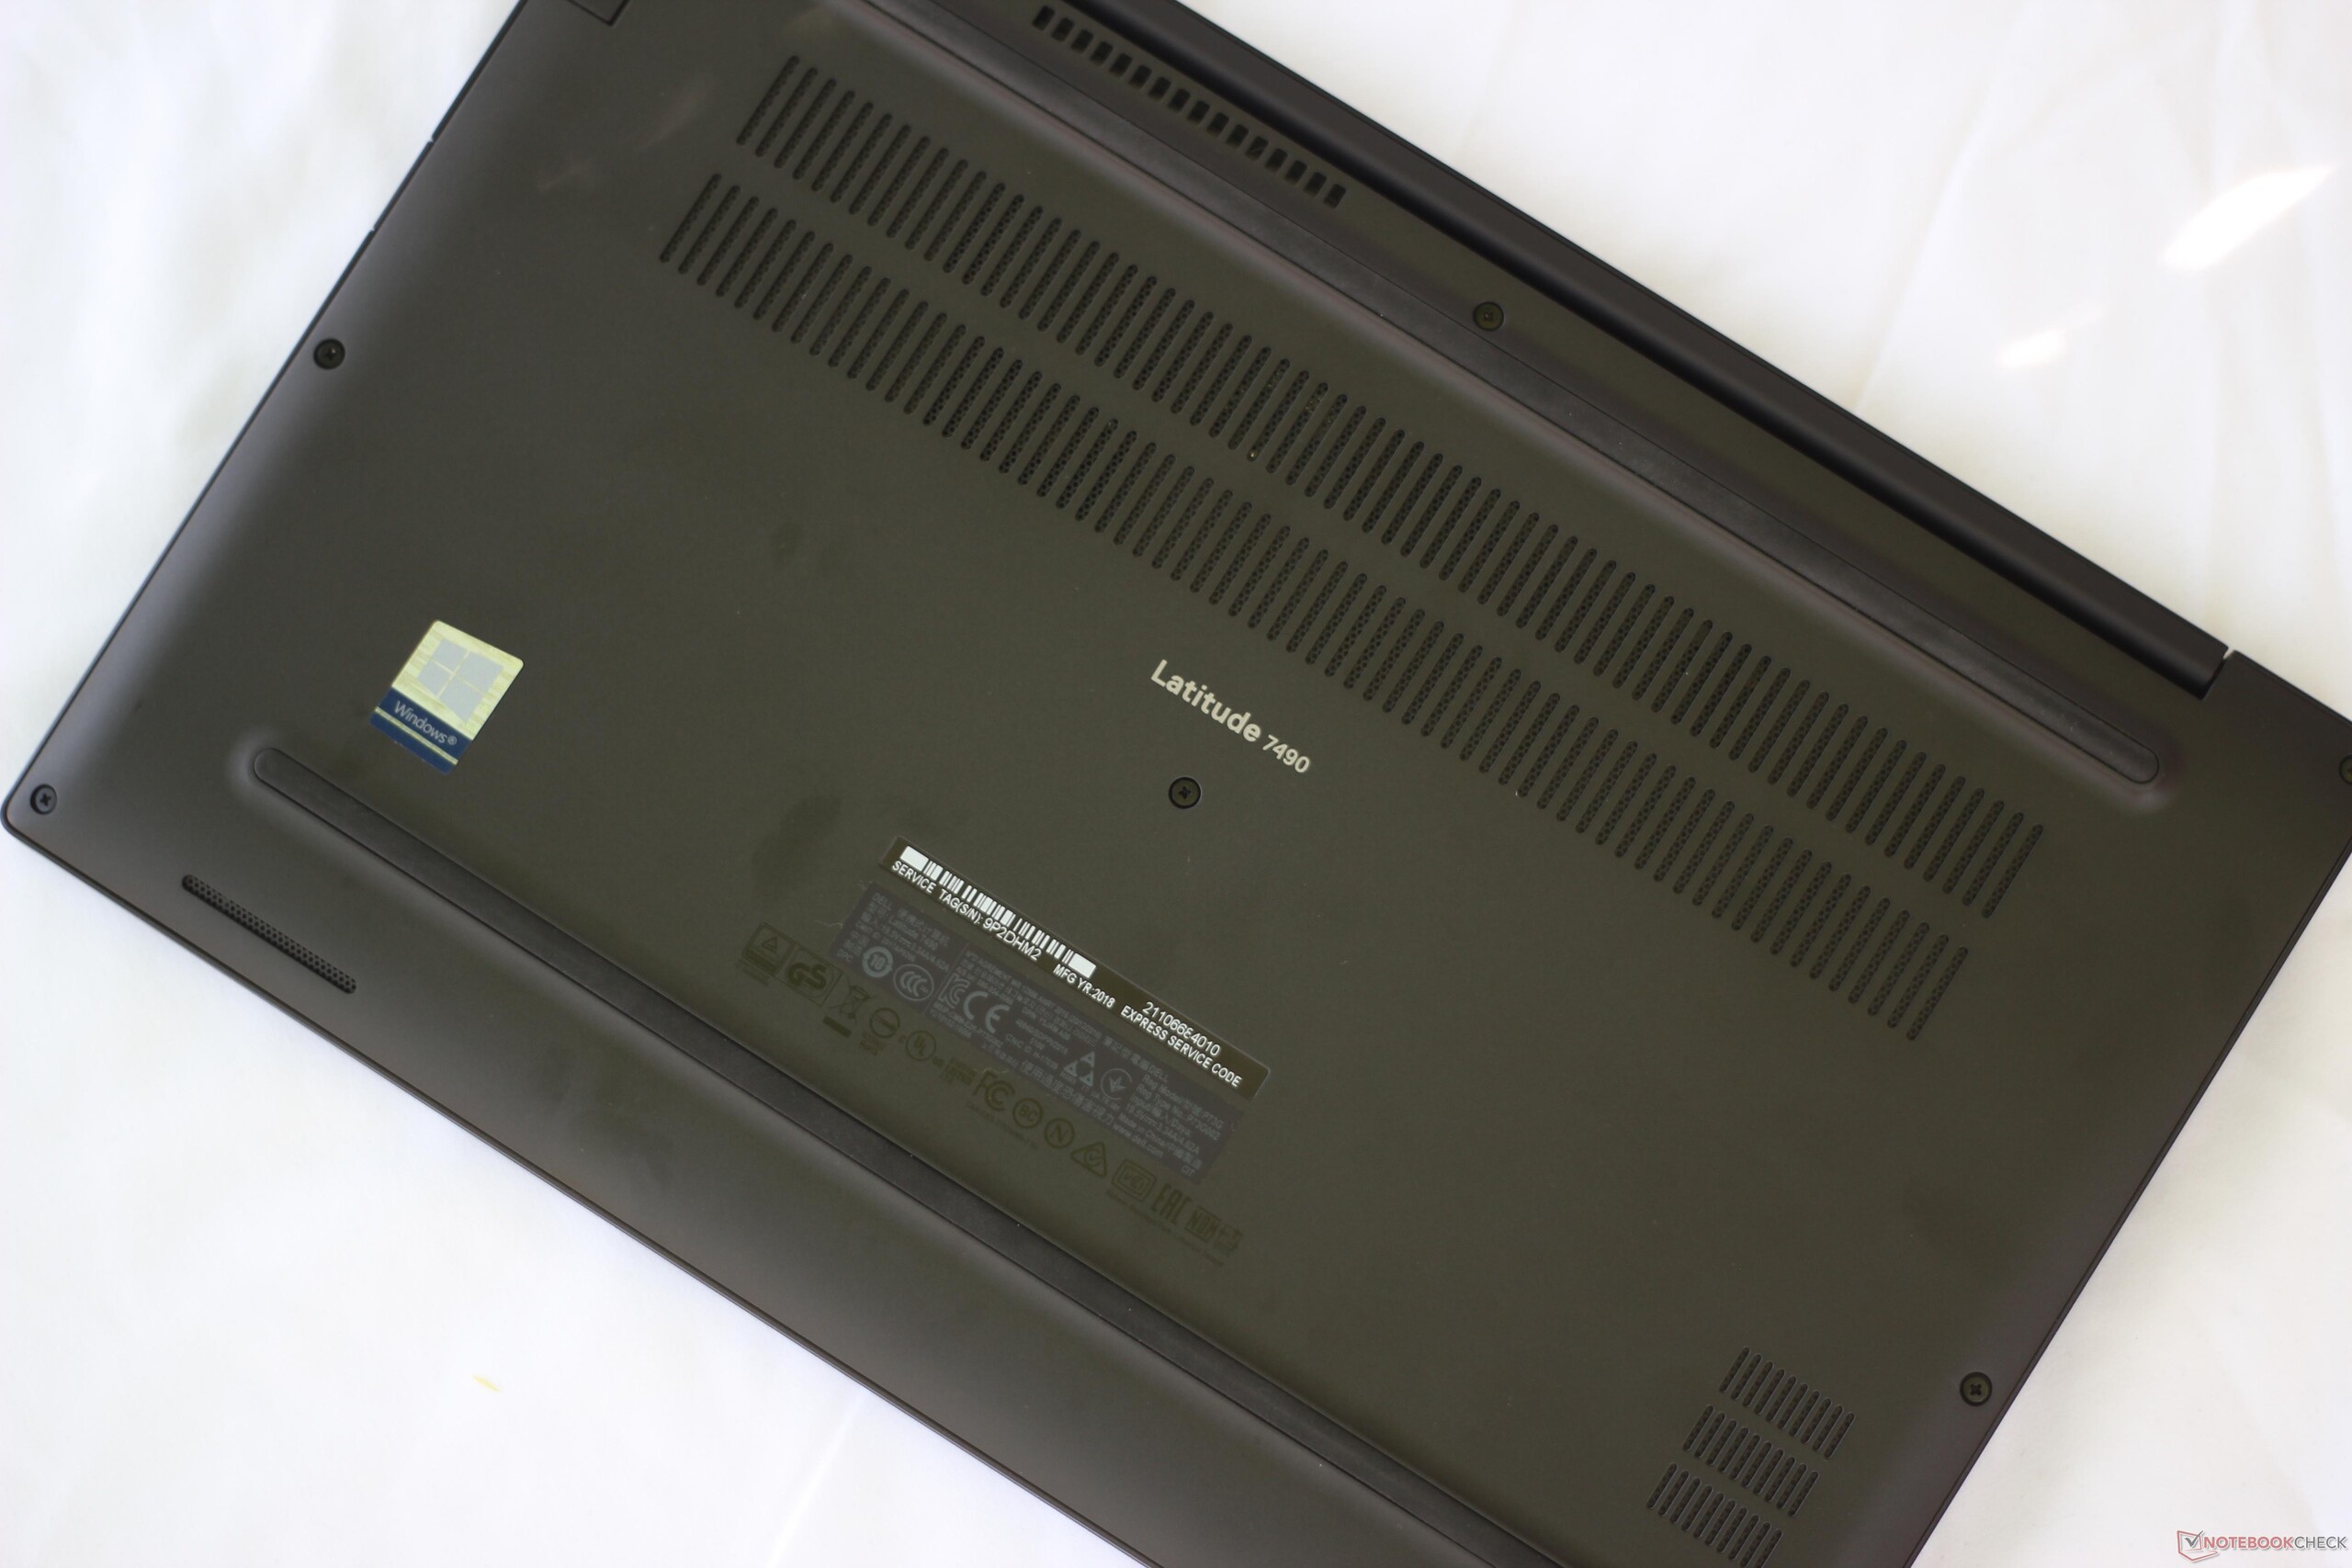
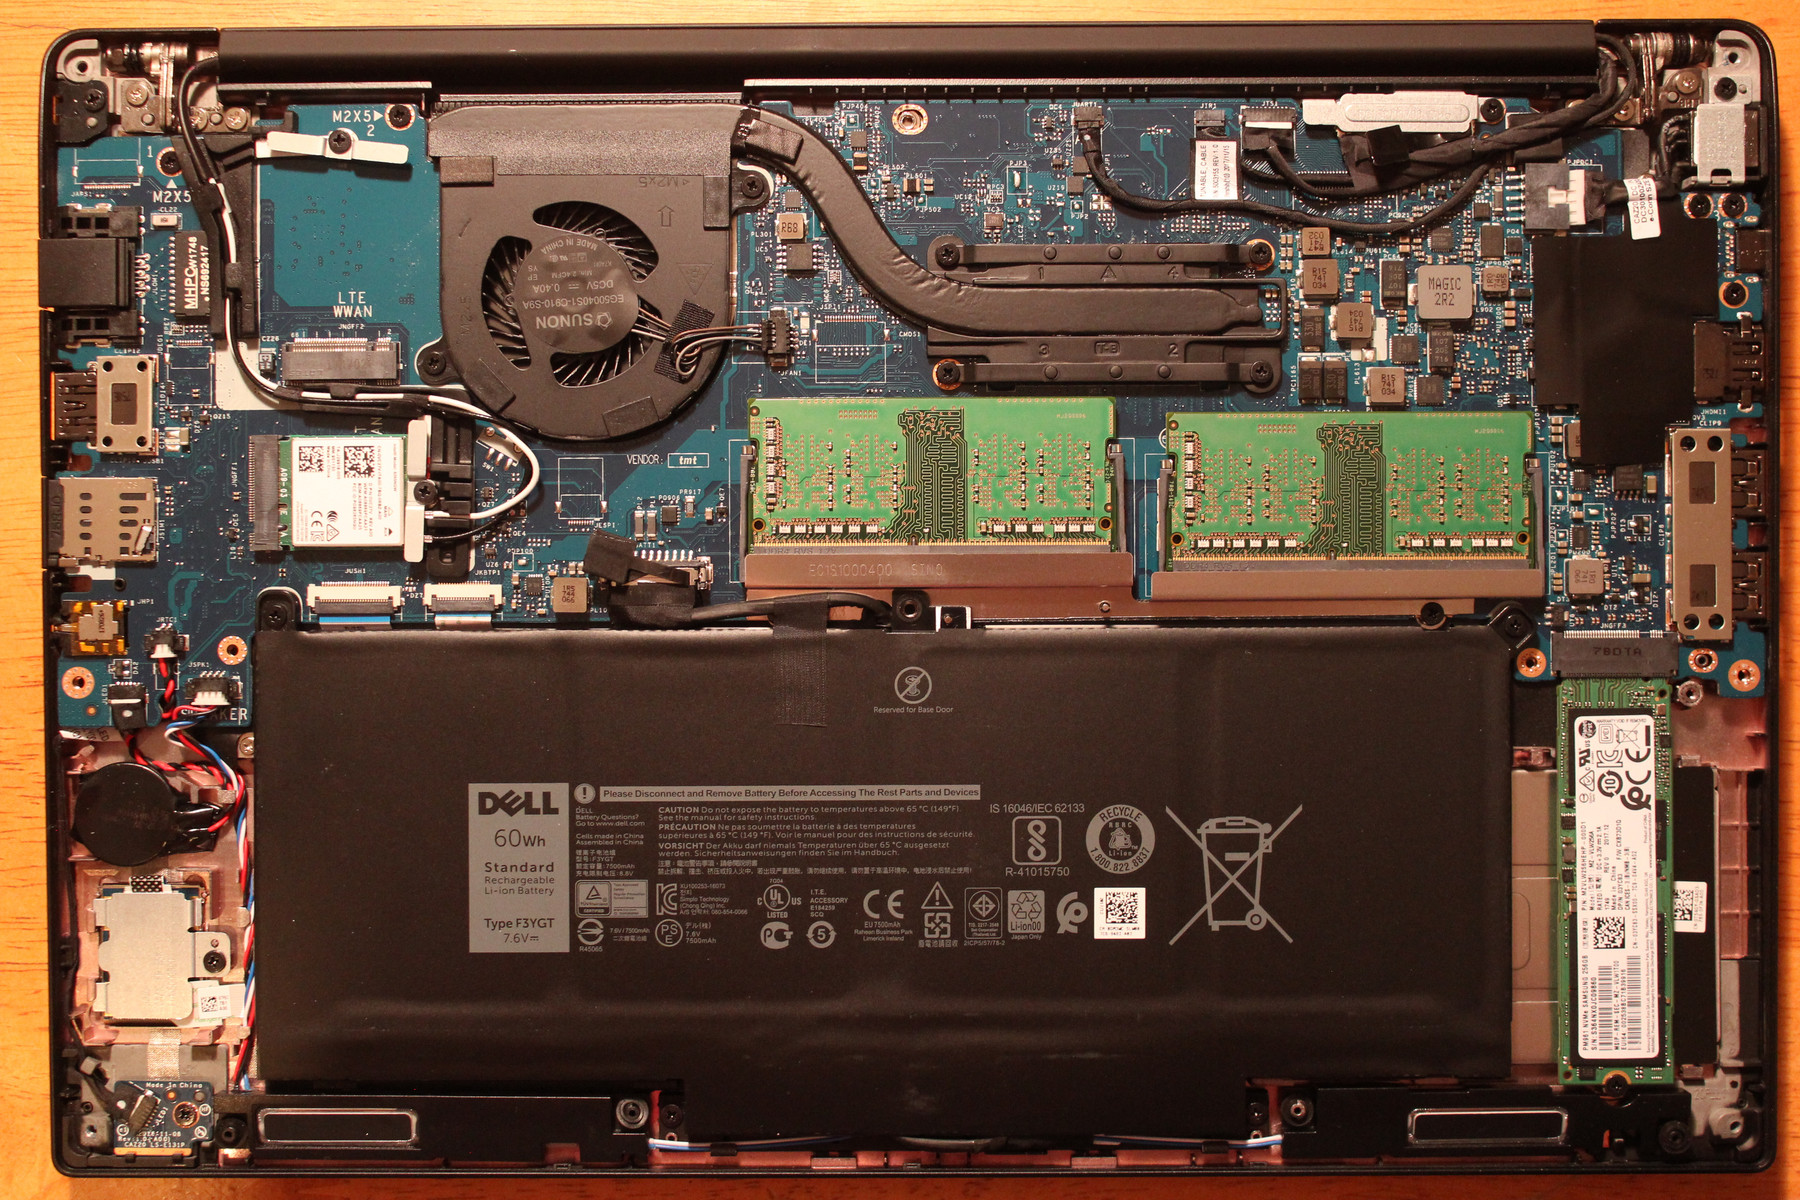
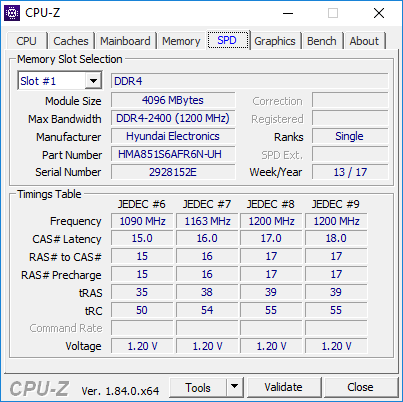
Maintenance is easy. There are eight #00 Phillips Head screws holding the back panel on. These are self-retaining; once loosened, they will hang in their holes in the back panel. The back panel can be unclipped after loosening the screws. We recommend starting at the back of the unit next to the hinge and working around the chassis. Once this panel is removed, users will have access to the two RAM DIMMs, wireless card, M.2 drive, and battery. The CPU is soldered to the mainboard and cannot be replaced, but the heatsink can be removed in order to apply new thermal paste if desired.
Warranty
Dell offers a 3-year warranty for all configurations of the Latitude. This warranty includes onsite or in-home service after a remote diagnosis and can be increased to 4 or 5 years (for $76.30 and $139.30, respectively). Dell also offers ProSupport and ProSupport Plus packages with next business day onsite service at additional costs.
Input Devices
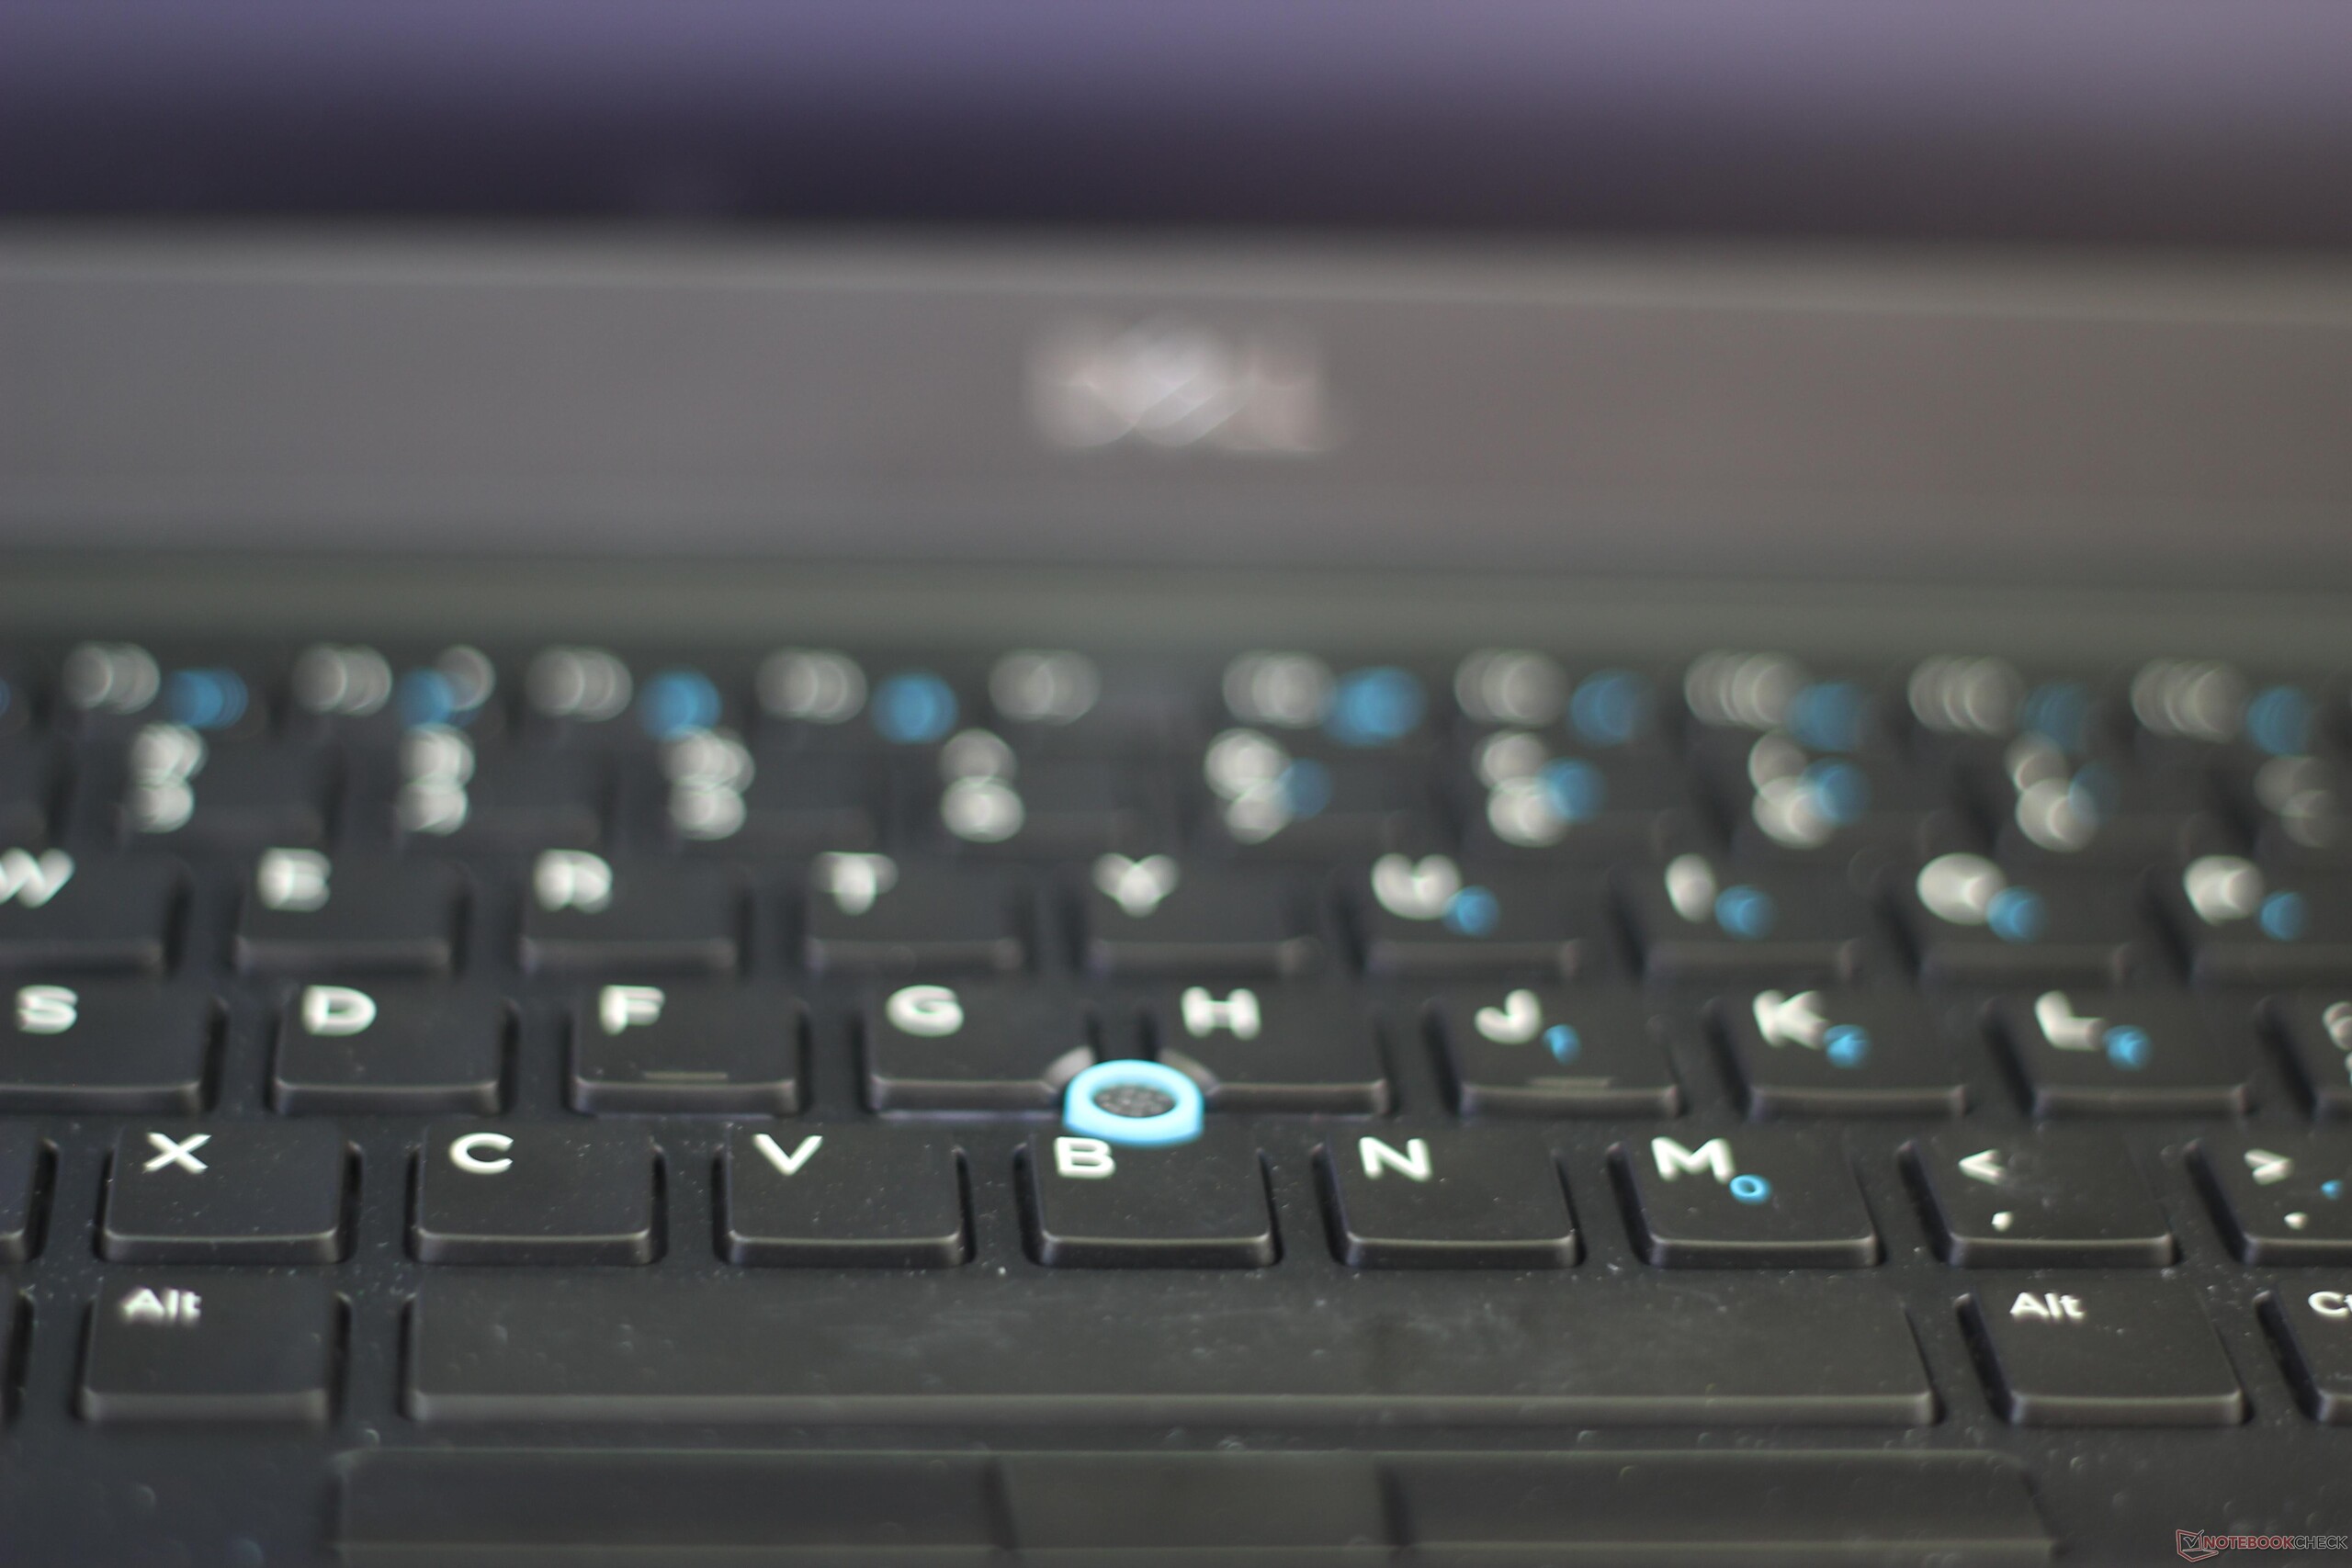
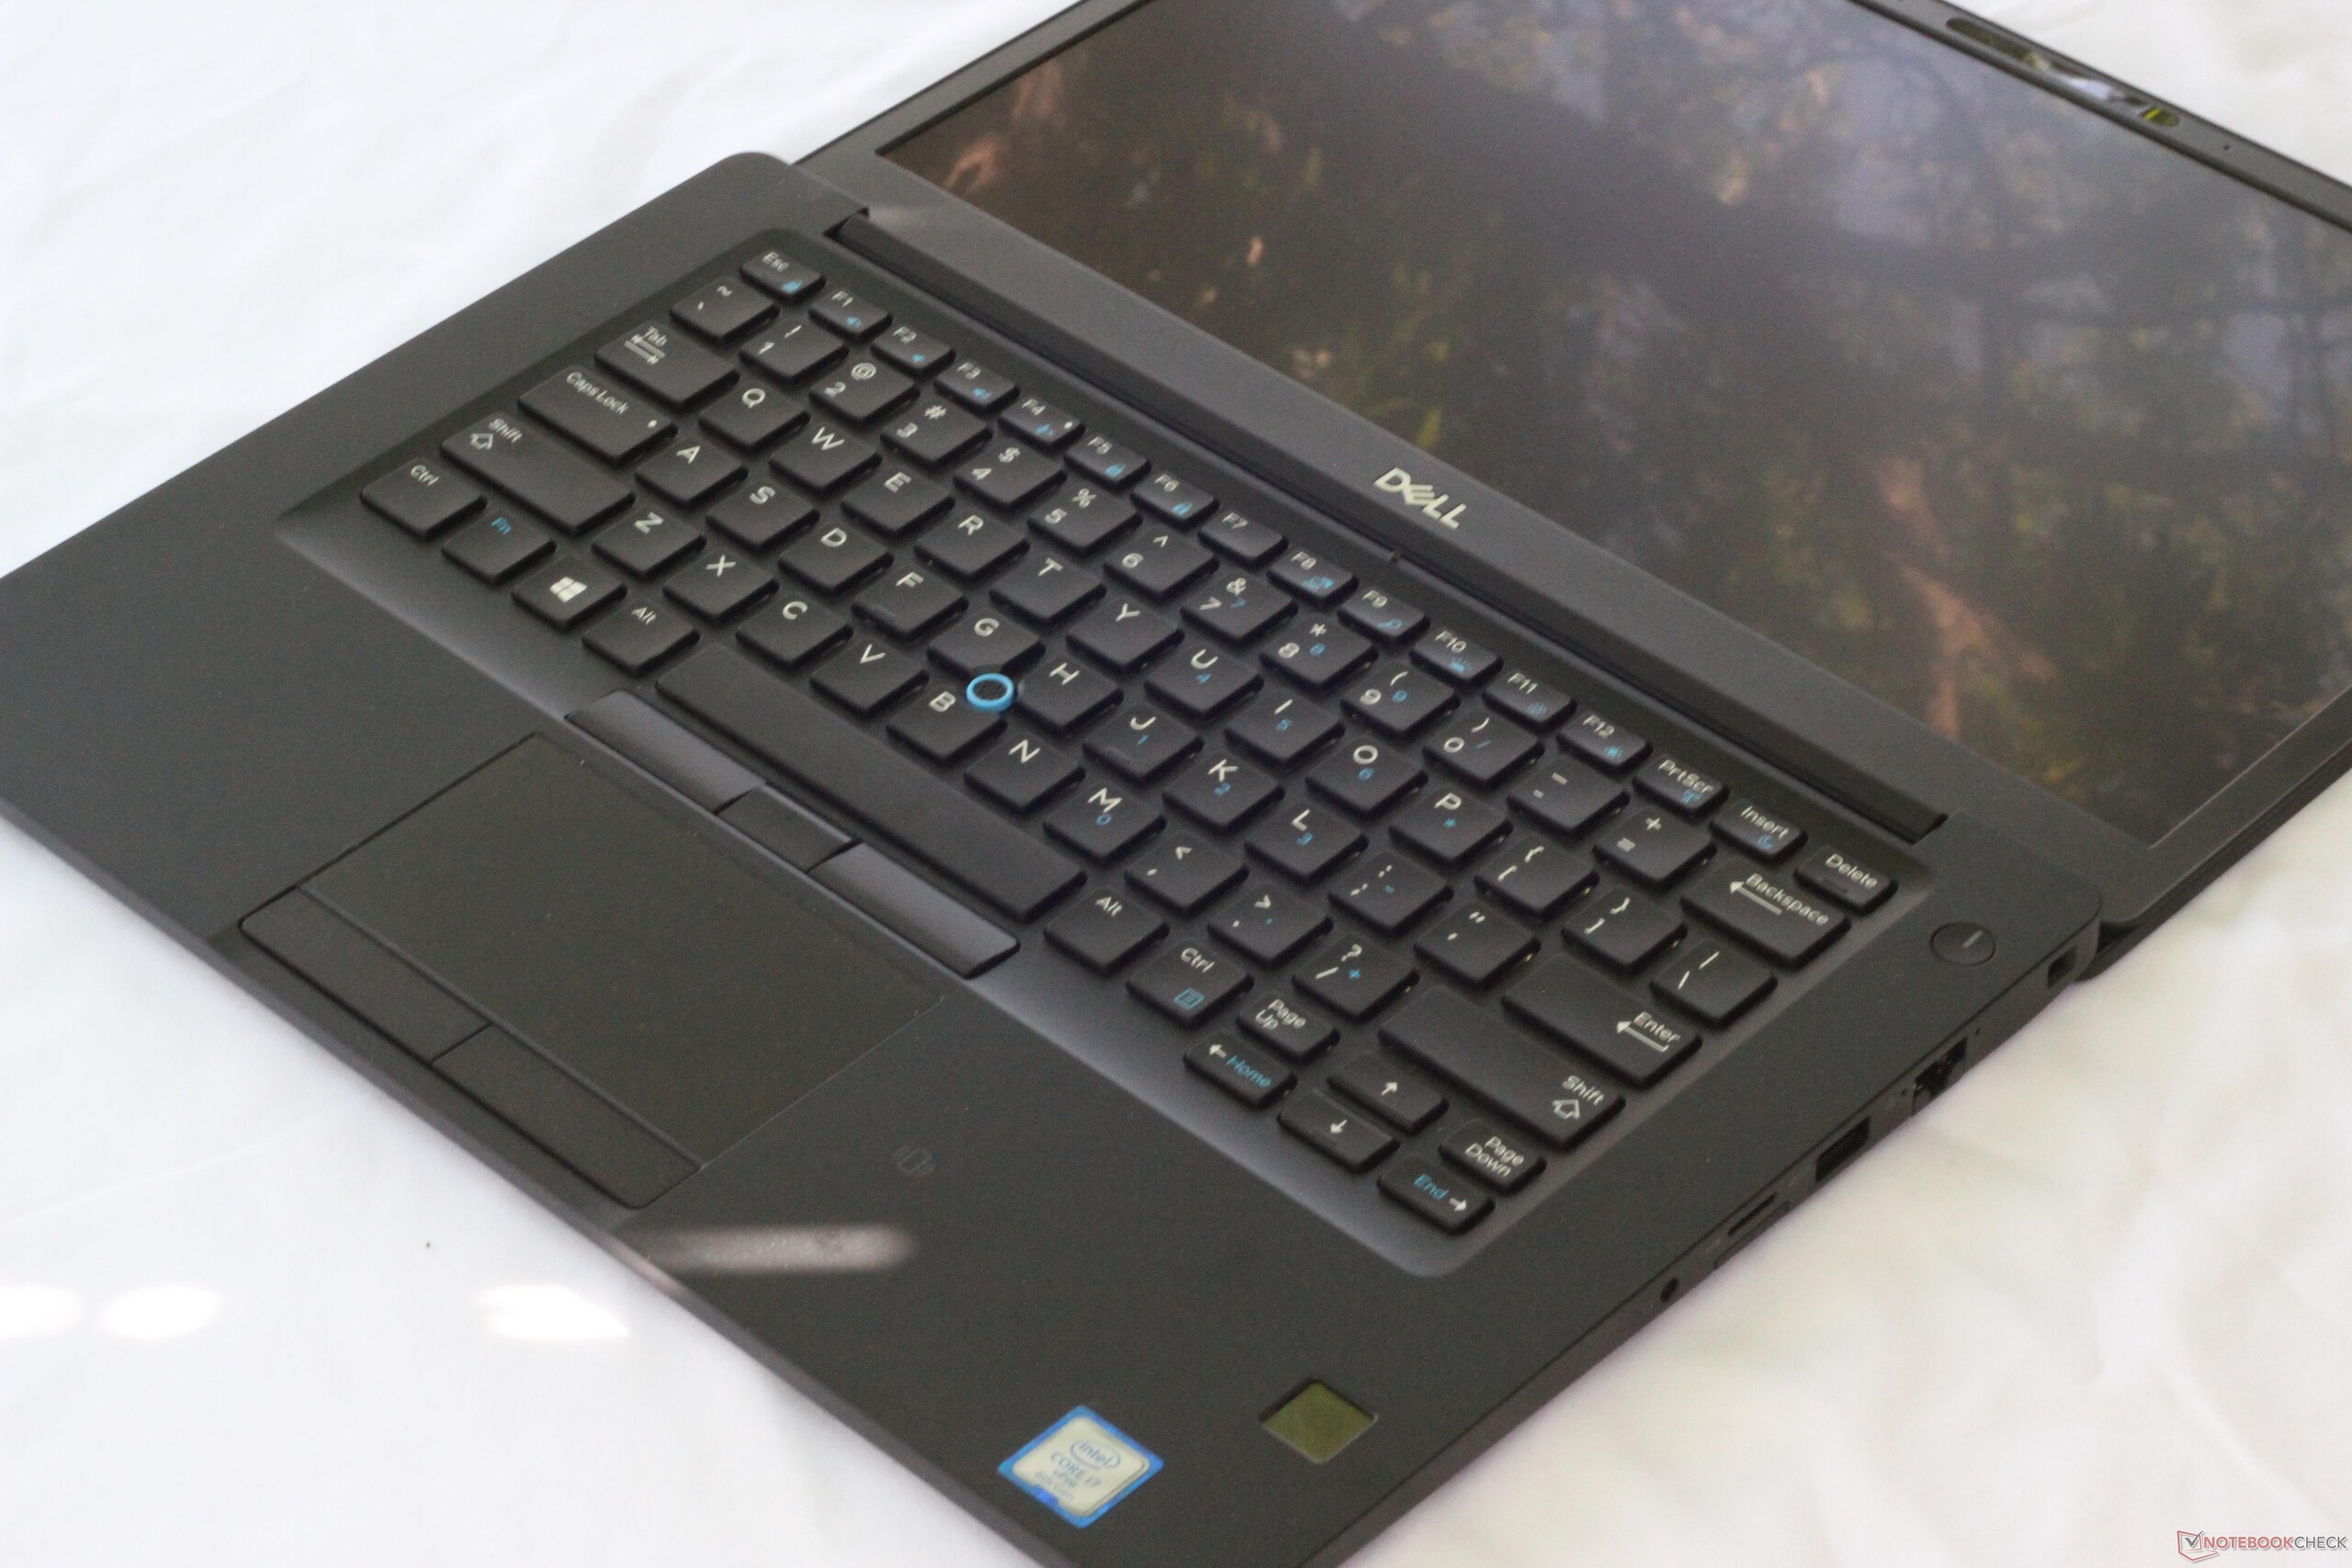
Keyboard
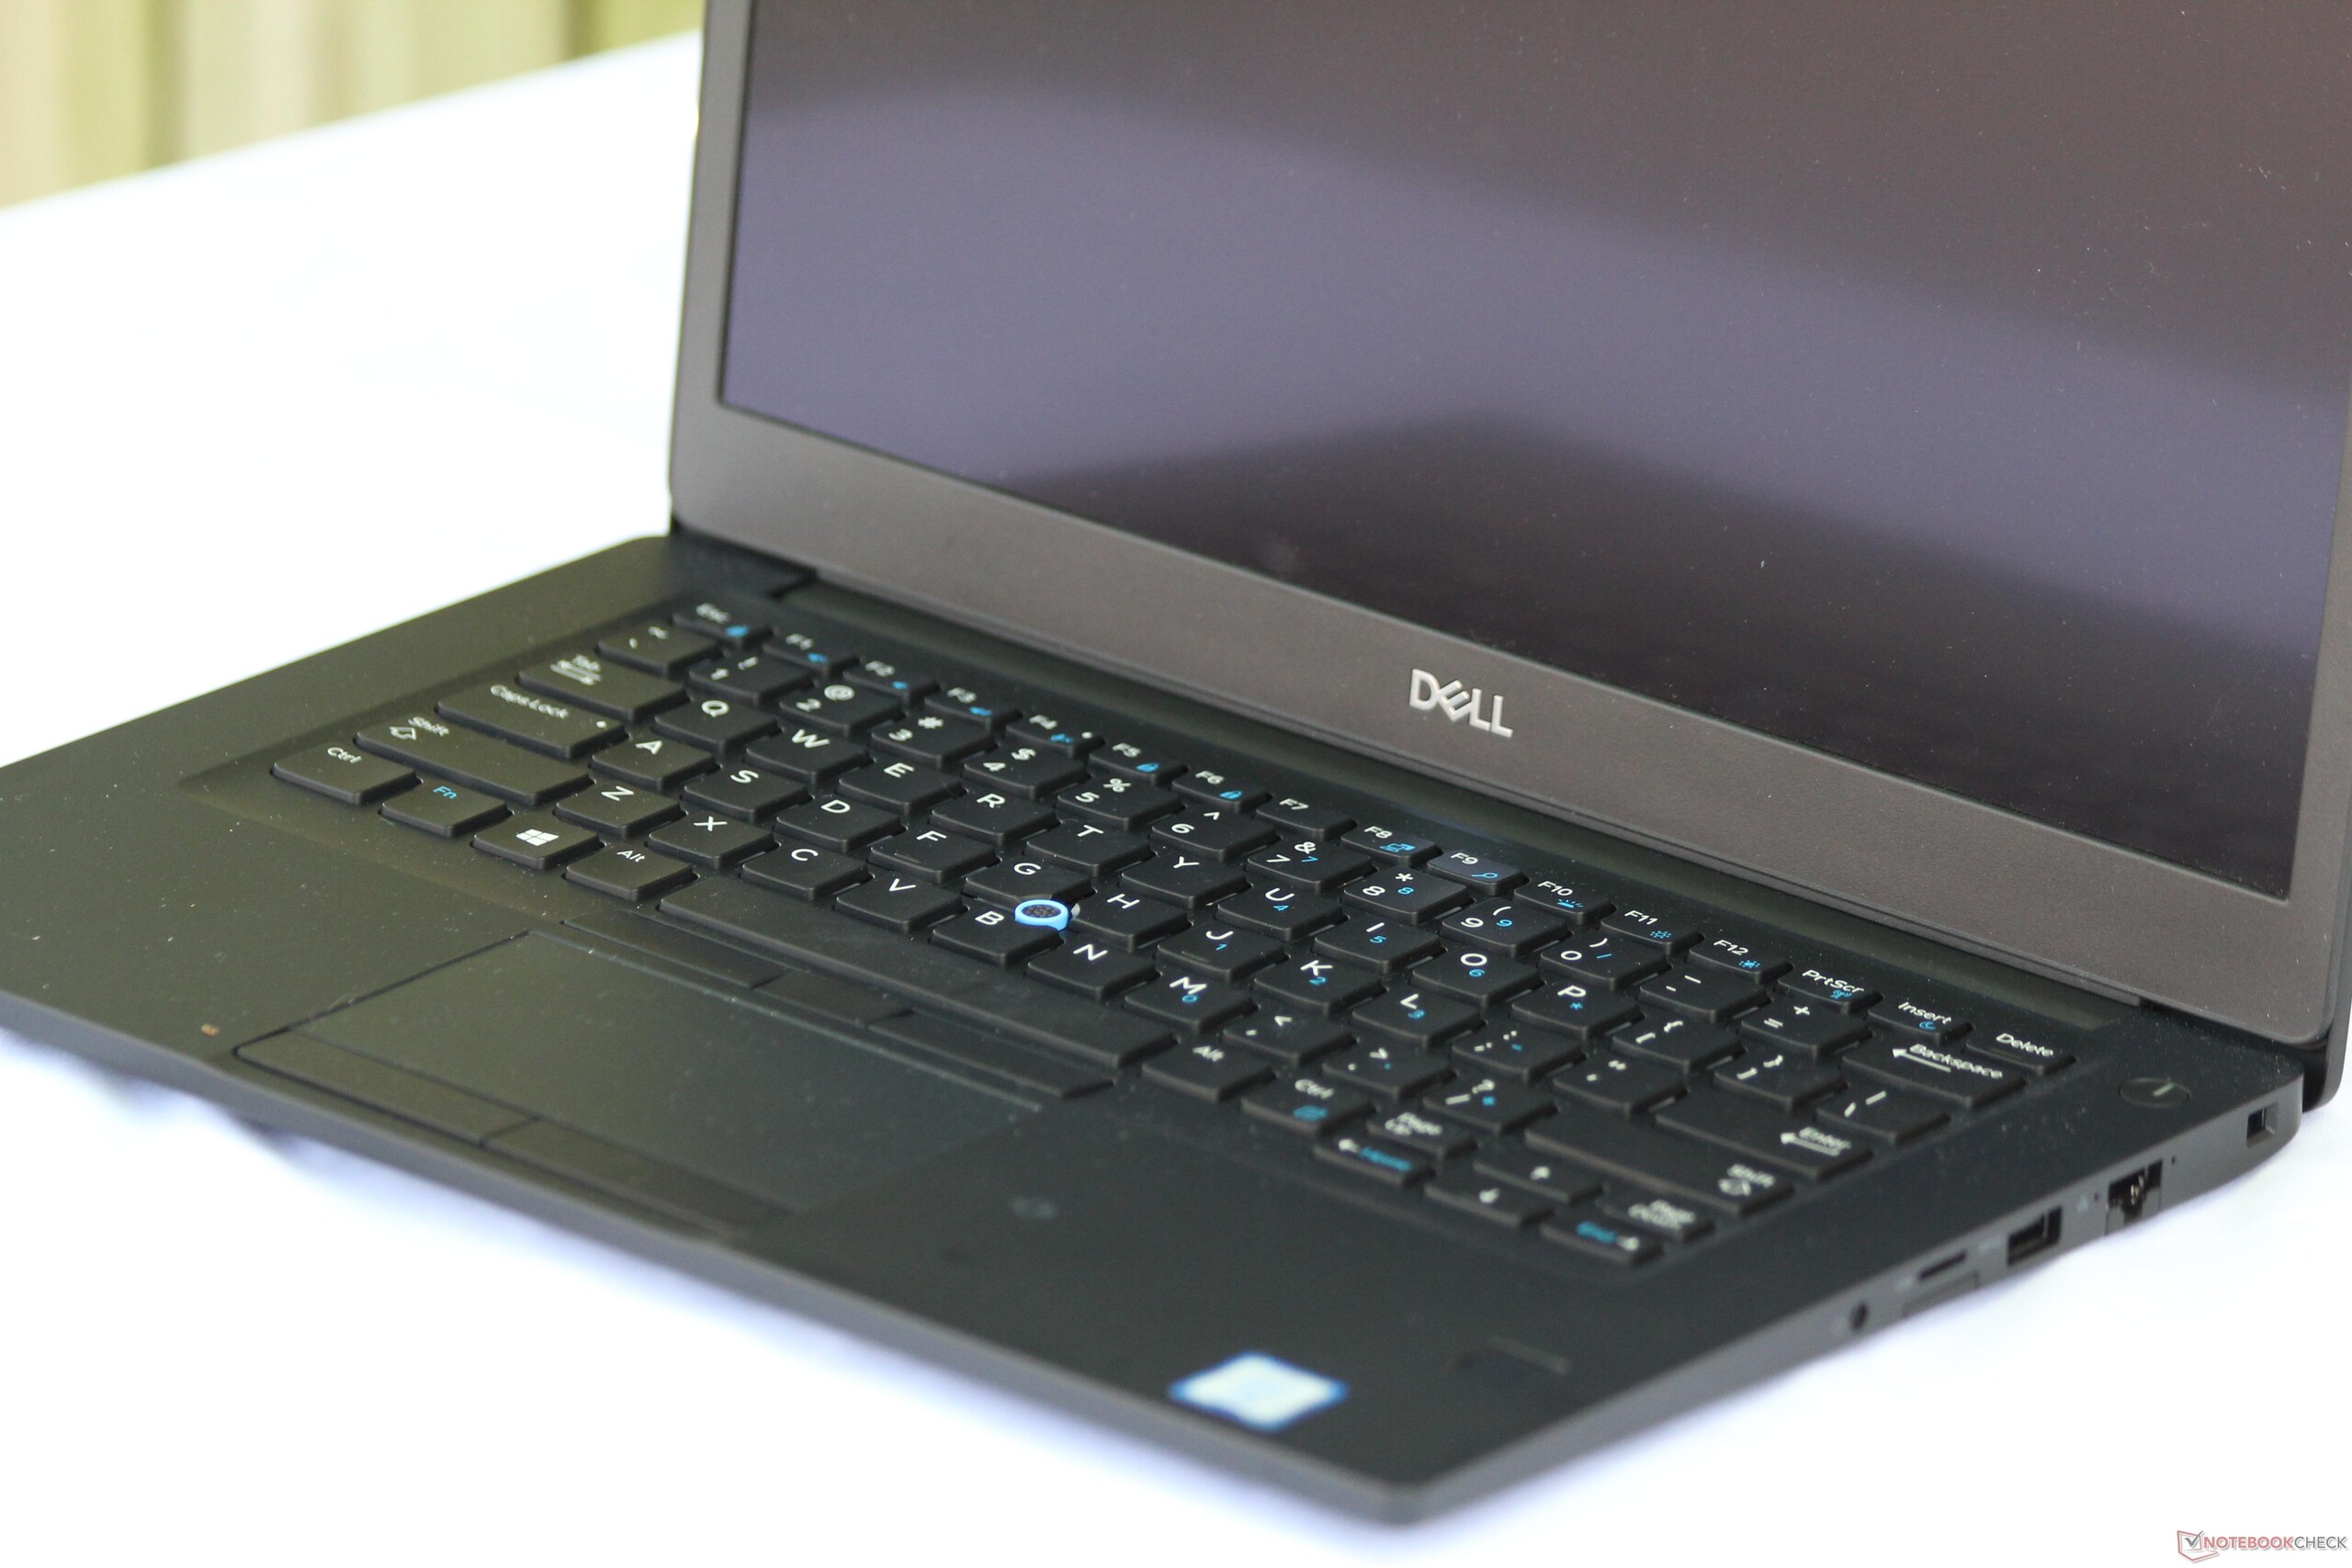
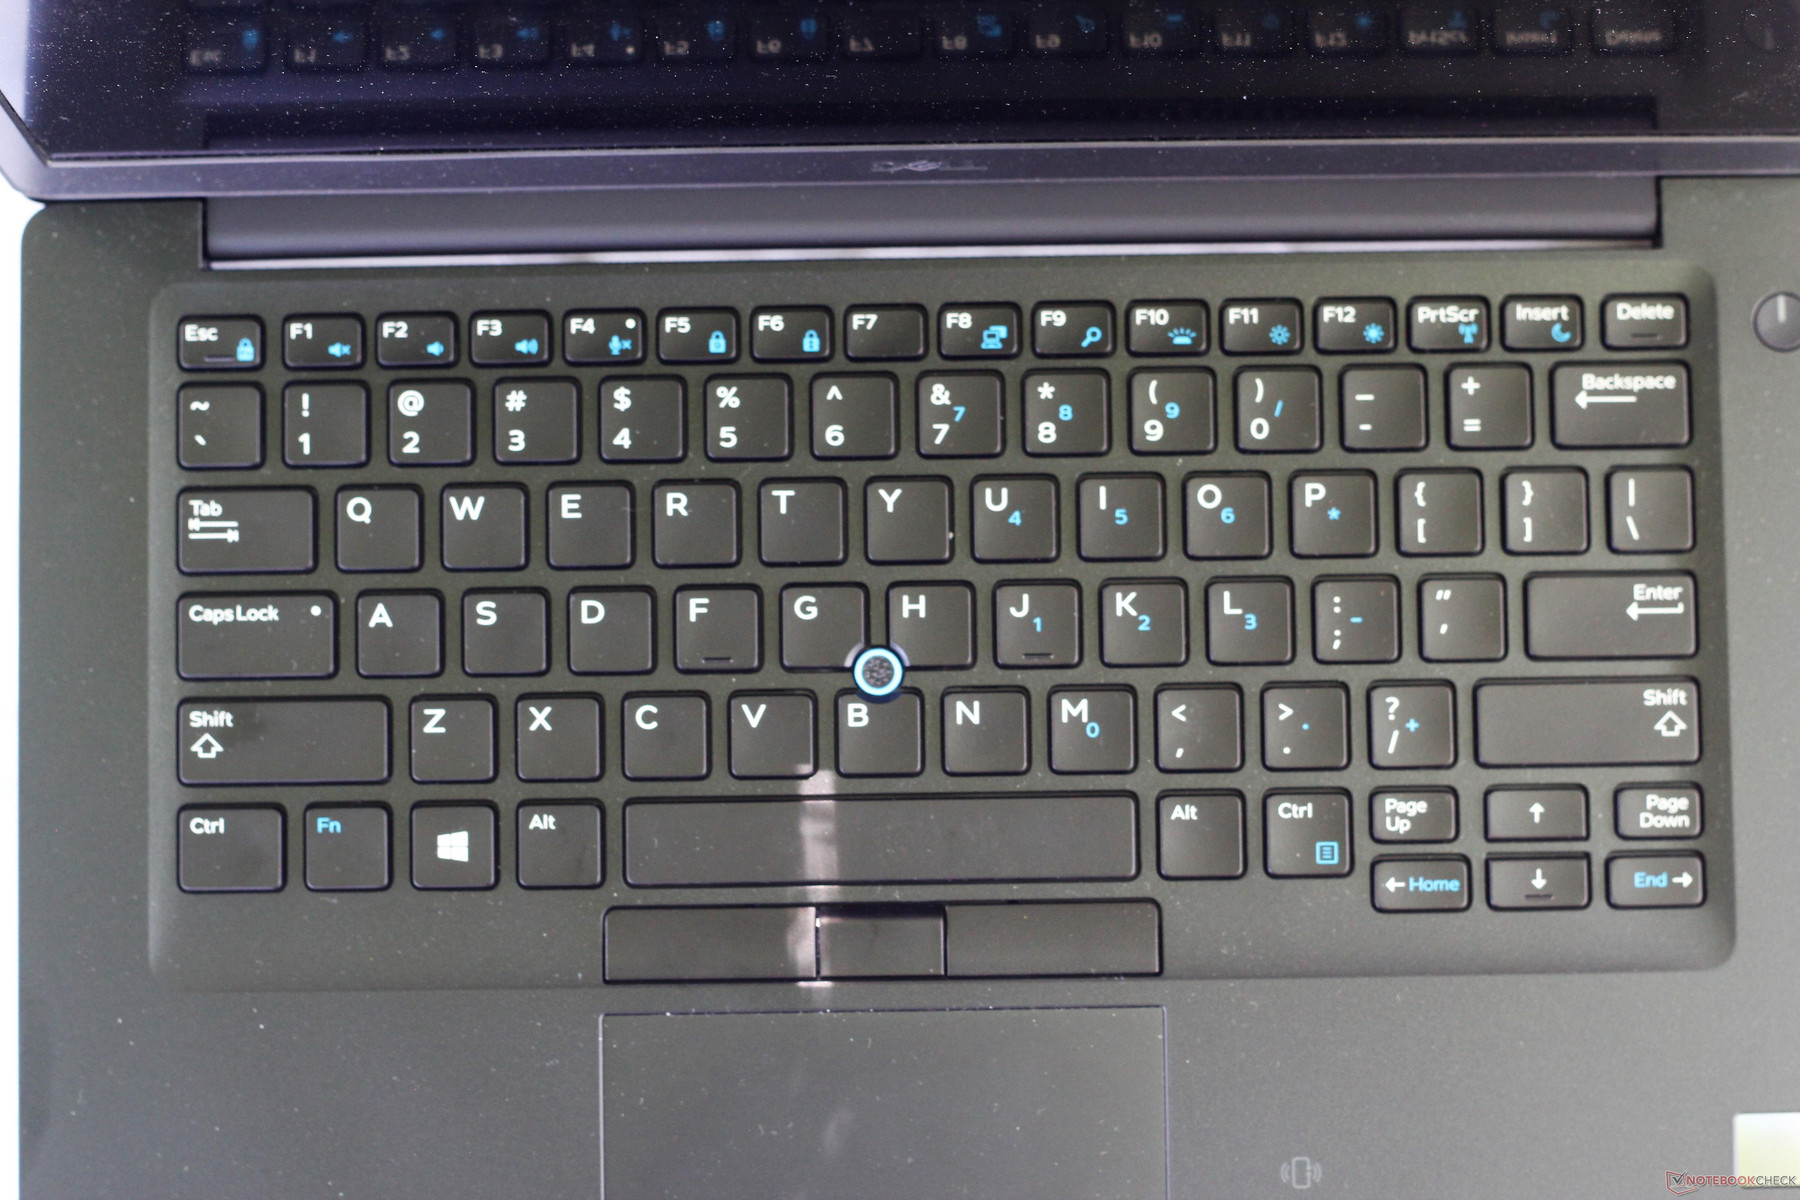
One of the consistent strengths of the Latitude line has been its keyboards. The keyboard deck is firm and the chassis doesn't warp. Typing feels steady as a result. Feedback is also well-tuned; the keys feel springy without being too stiff and are highly responsive. Key travel is generous at about 2 mm. Clatter is non-existent, and the backlight is bright and clear. The biggest problem we can find is that the arrow keys are a bit small, but this comes down to personal preference. Another small quibble is that the keyboard itself is non-replaceable (unlike some other Latitude devices). Overall, the keyboard rivals the best in the business, although the legendary ThinkPads still trump Dell in ergonomics and response.
Touchpad & Trackpoint
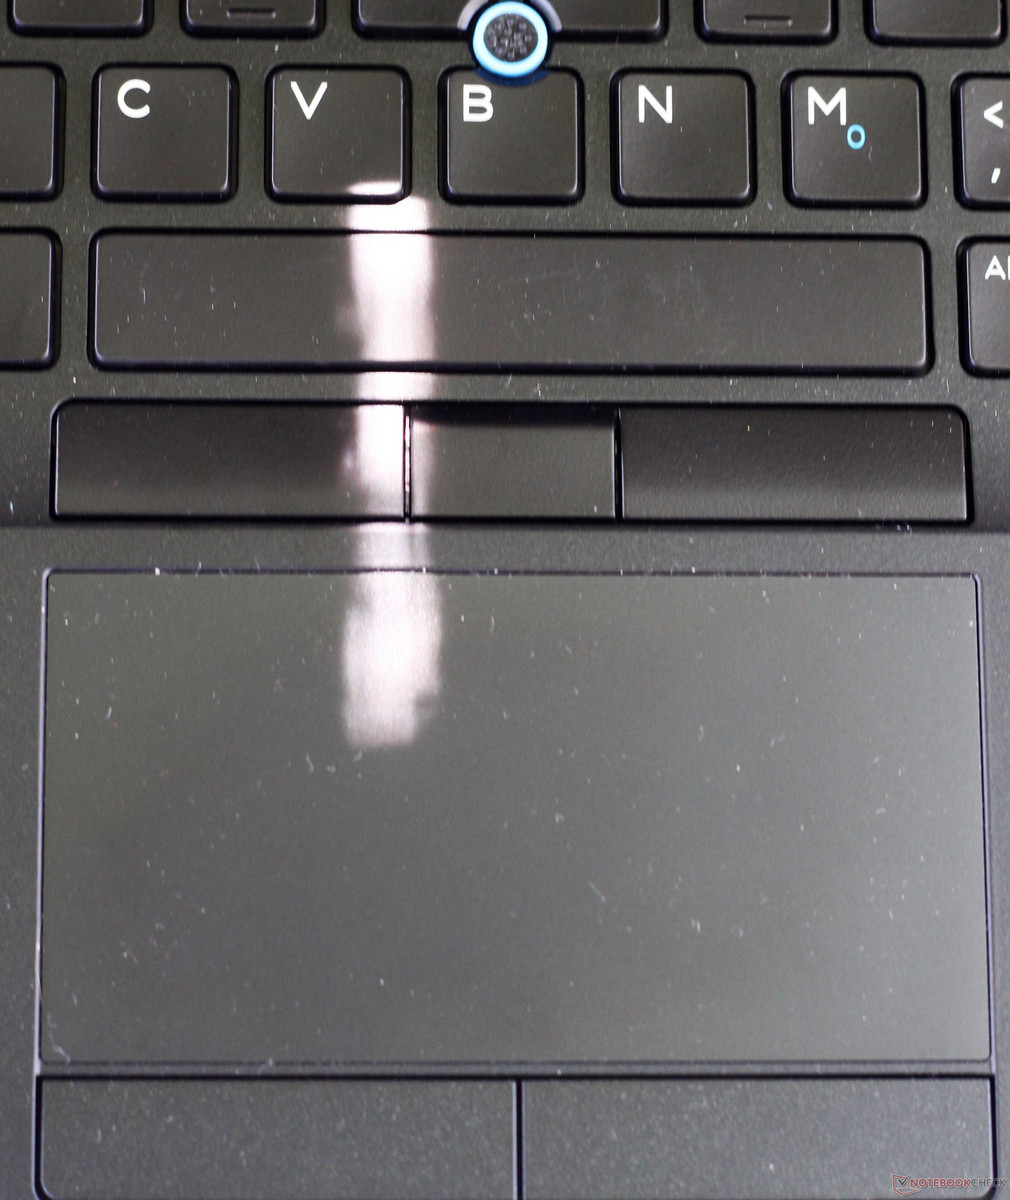
The touchpad (10 cm x 5.5 cm) is good. The lightly-textured surface feels nice underhand, and glide is easy. The pad itself is responsive and tracks well. Gestures reliably register. The inclusion of Windows Precision Drivers makes for an excellent overall experience. The trackpoint, situated in the middle of the keyboard, is adequate. Out of the box, the nub is far too sensitive; the slightest pressure will send the cursor flying across the screen or will scroll down a page in the blink of an eye. Thankfully, this can be adjusted in software. The dedicated click buttons above and below the touchpad mirror the keyboard in excellence. Travel is good and the buttons are responsive. Each button is also firm enough that they do not flex if clicked off-center. Dell has done a good job here and tangents perfection.

Display
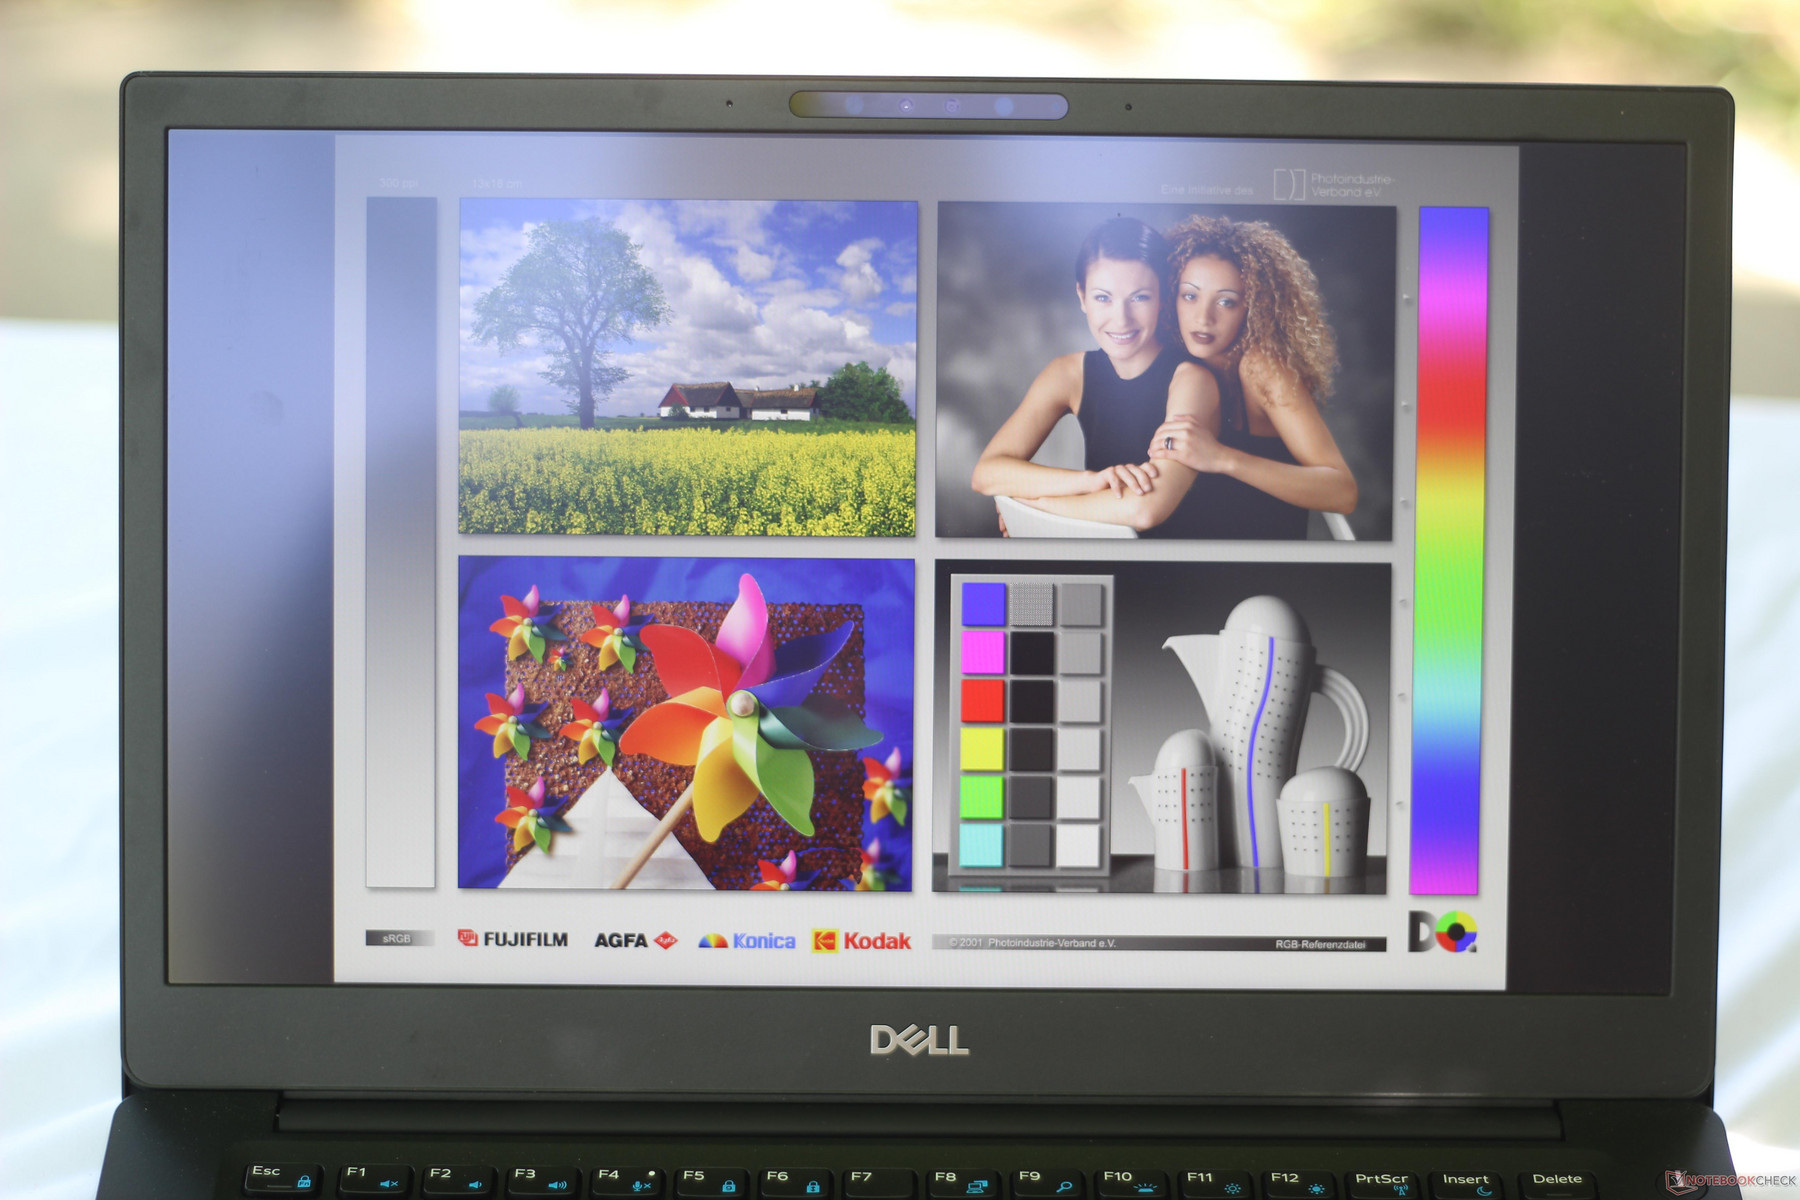
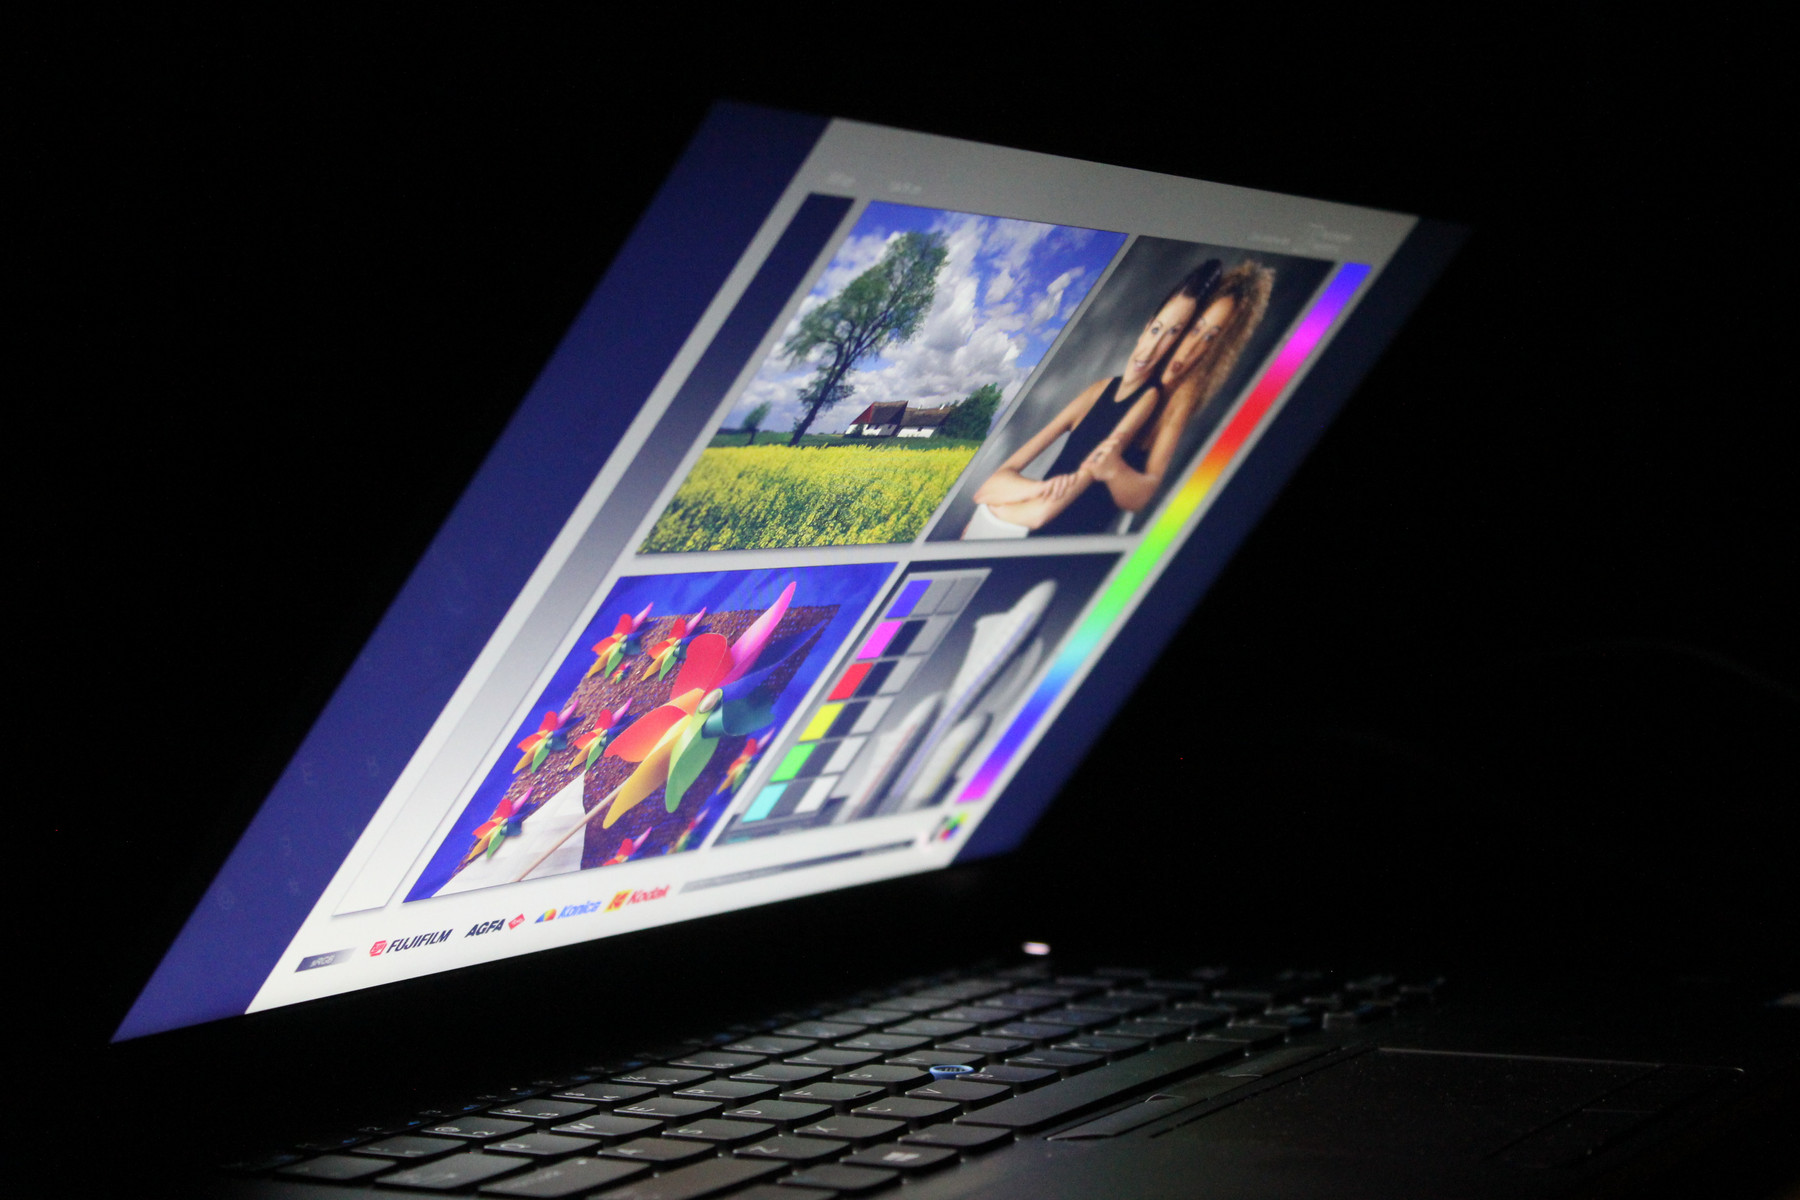
The 14-inch Full HD display from AU Optronics hits several high points. Response times are a bit on the slow side, even for an IPS panel, but the complete absence of PWM is a major plus. The screen is also fairly bright, averaging about 305 nits across the panel. The touchscreen model we have uses an anti-glare coating that works to reduce, but not eliminate, glare. Contrast is good, and the screen is vibrant overall. The 7490's screen is bright enough for office and outdoor use, but users in need of a brighter screen should consider the Lenovo ThinkPad X1 Carbon, which shines at about 533 nits, 75% higher than the 7490.
| |||||||||||||||||||||||||
Brightness Distribution: 87 %
Center on Battery: 328.2 cd/m²
Contrast: 887:1 (Black: 0.37 cd/m²)
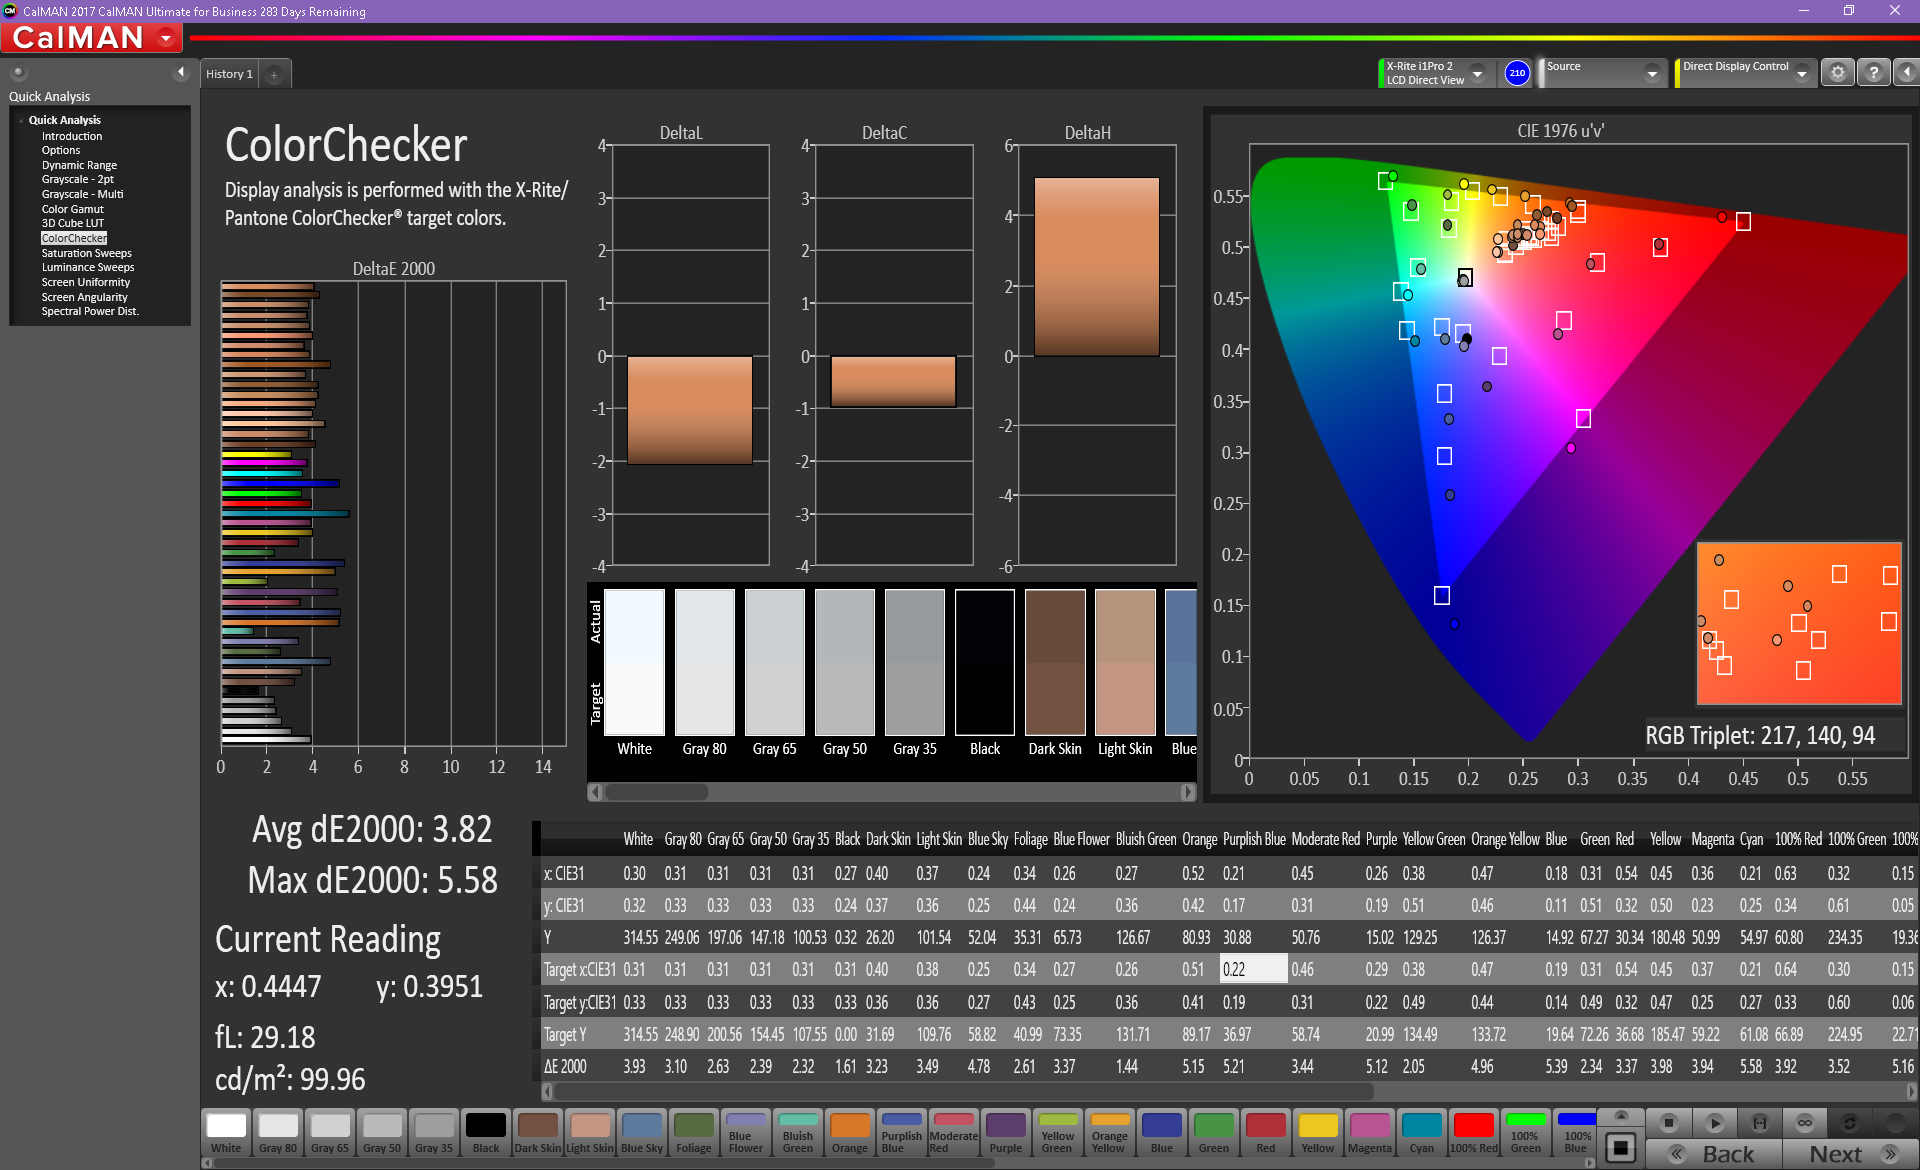
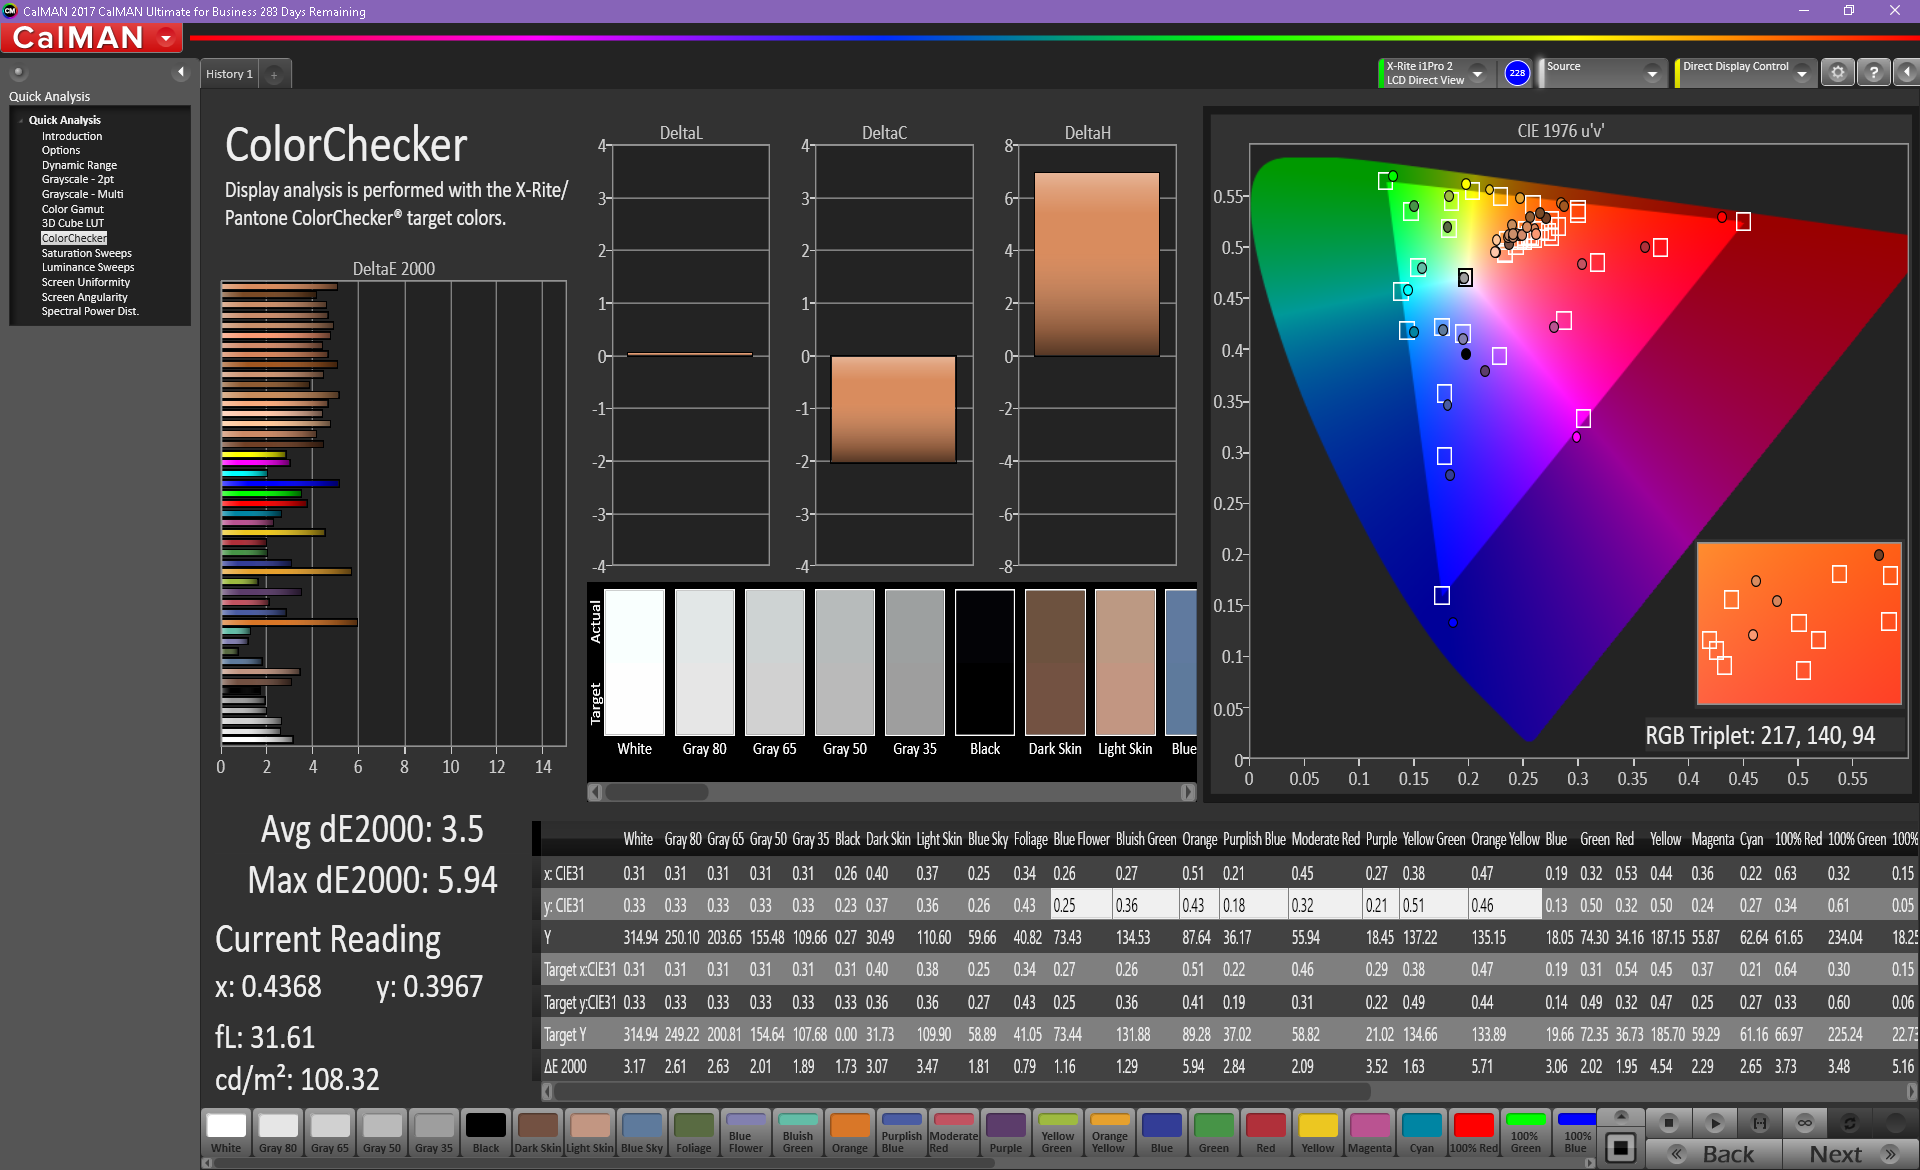
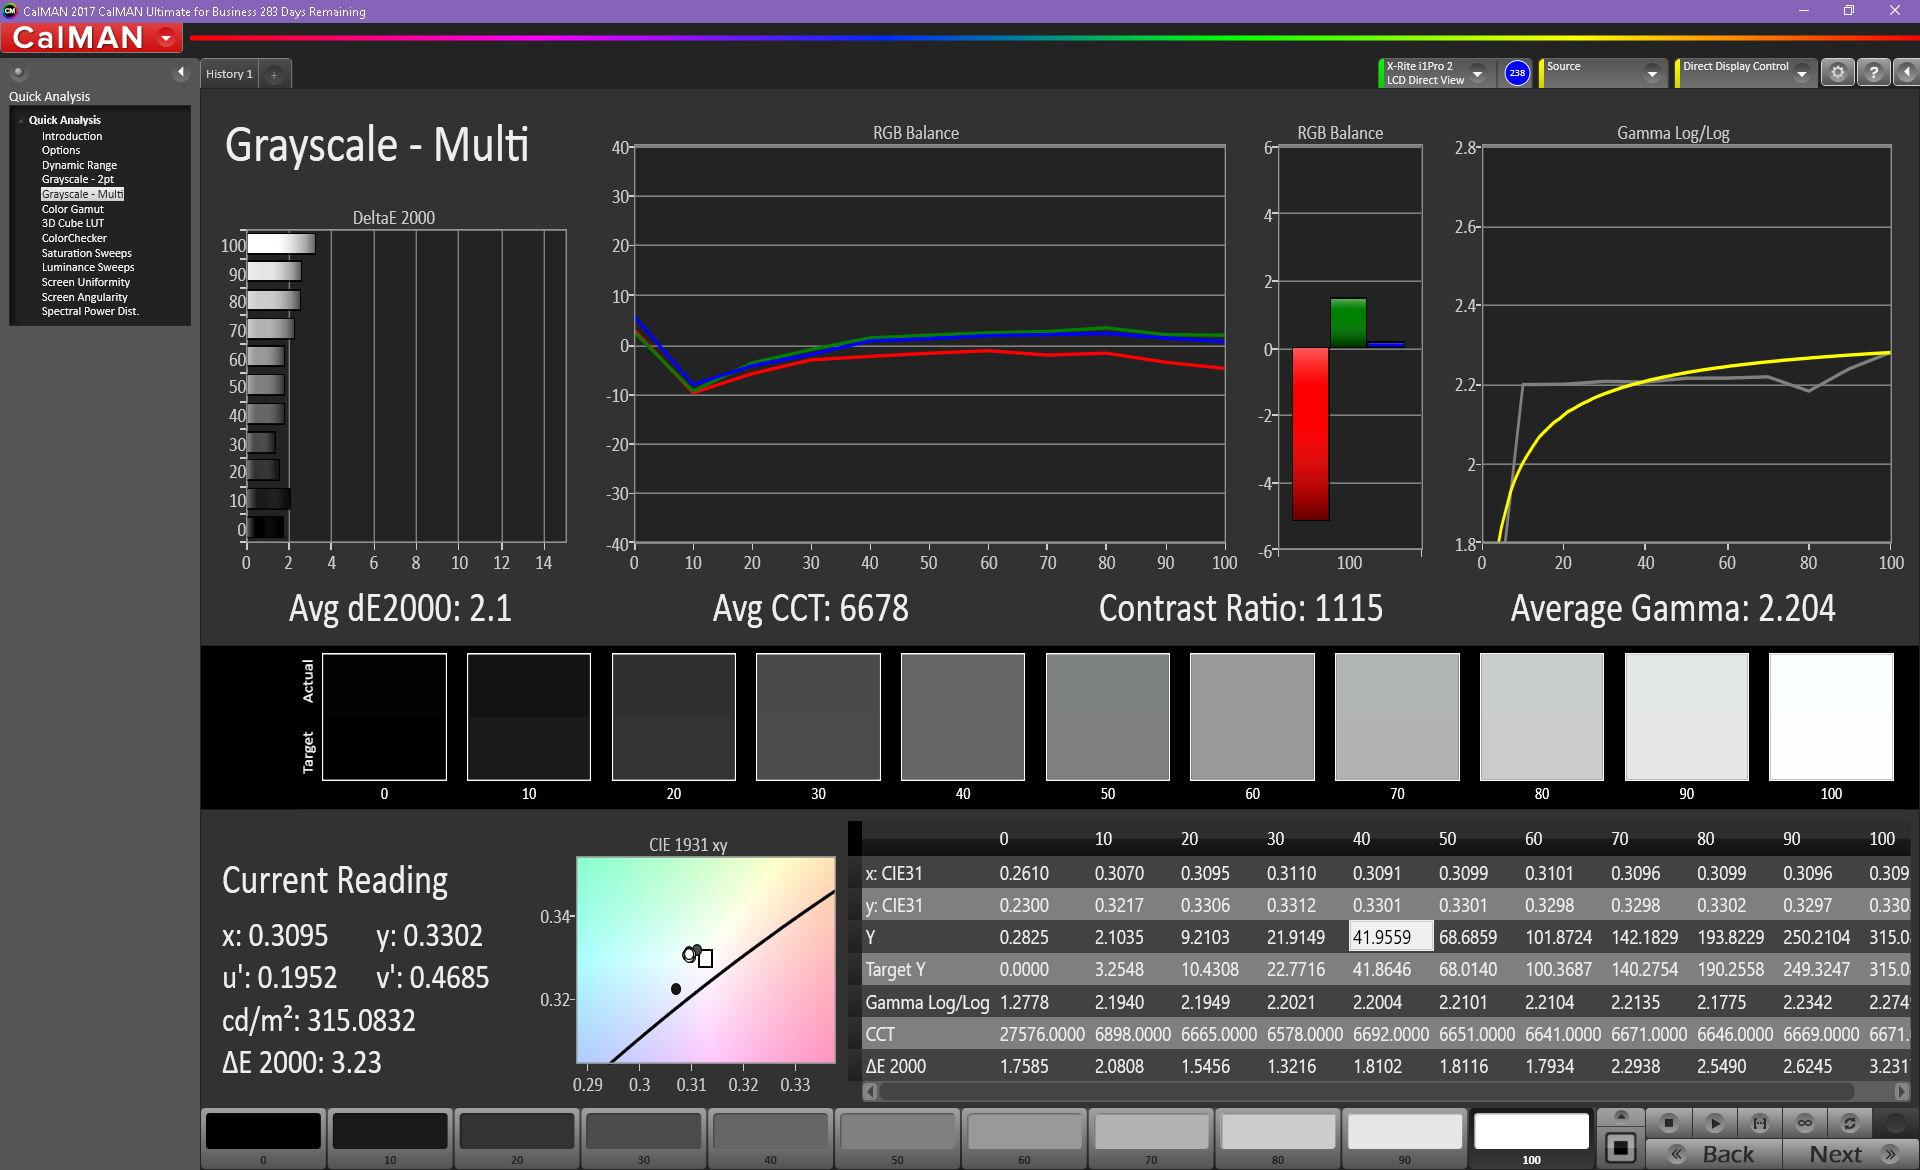
ΔE Color 3.82 | 0.5-29.43 Ø5, calibrated: 3.5
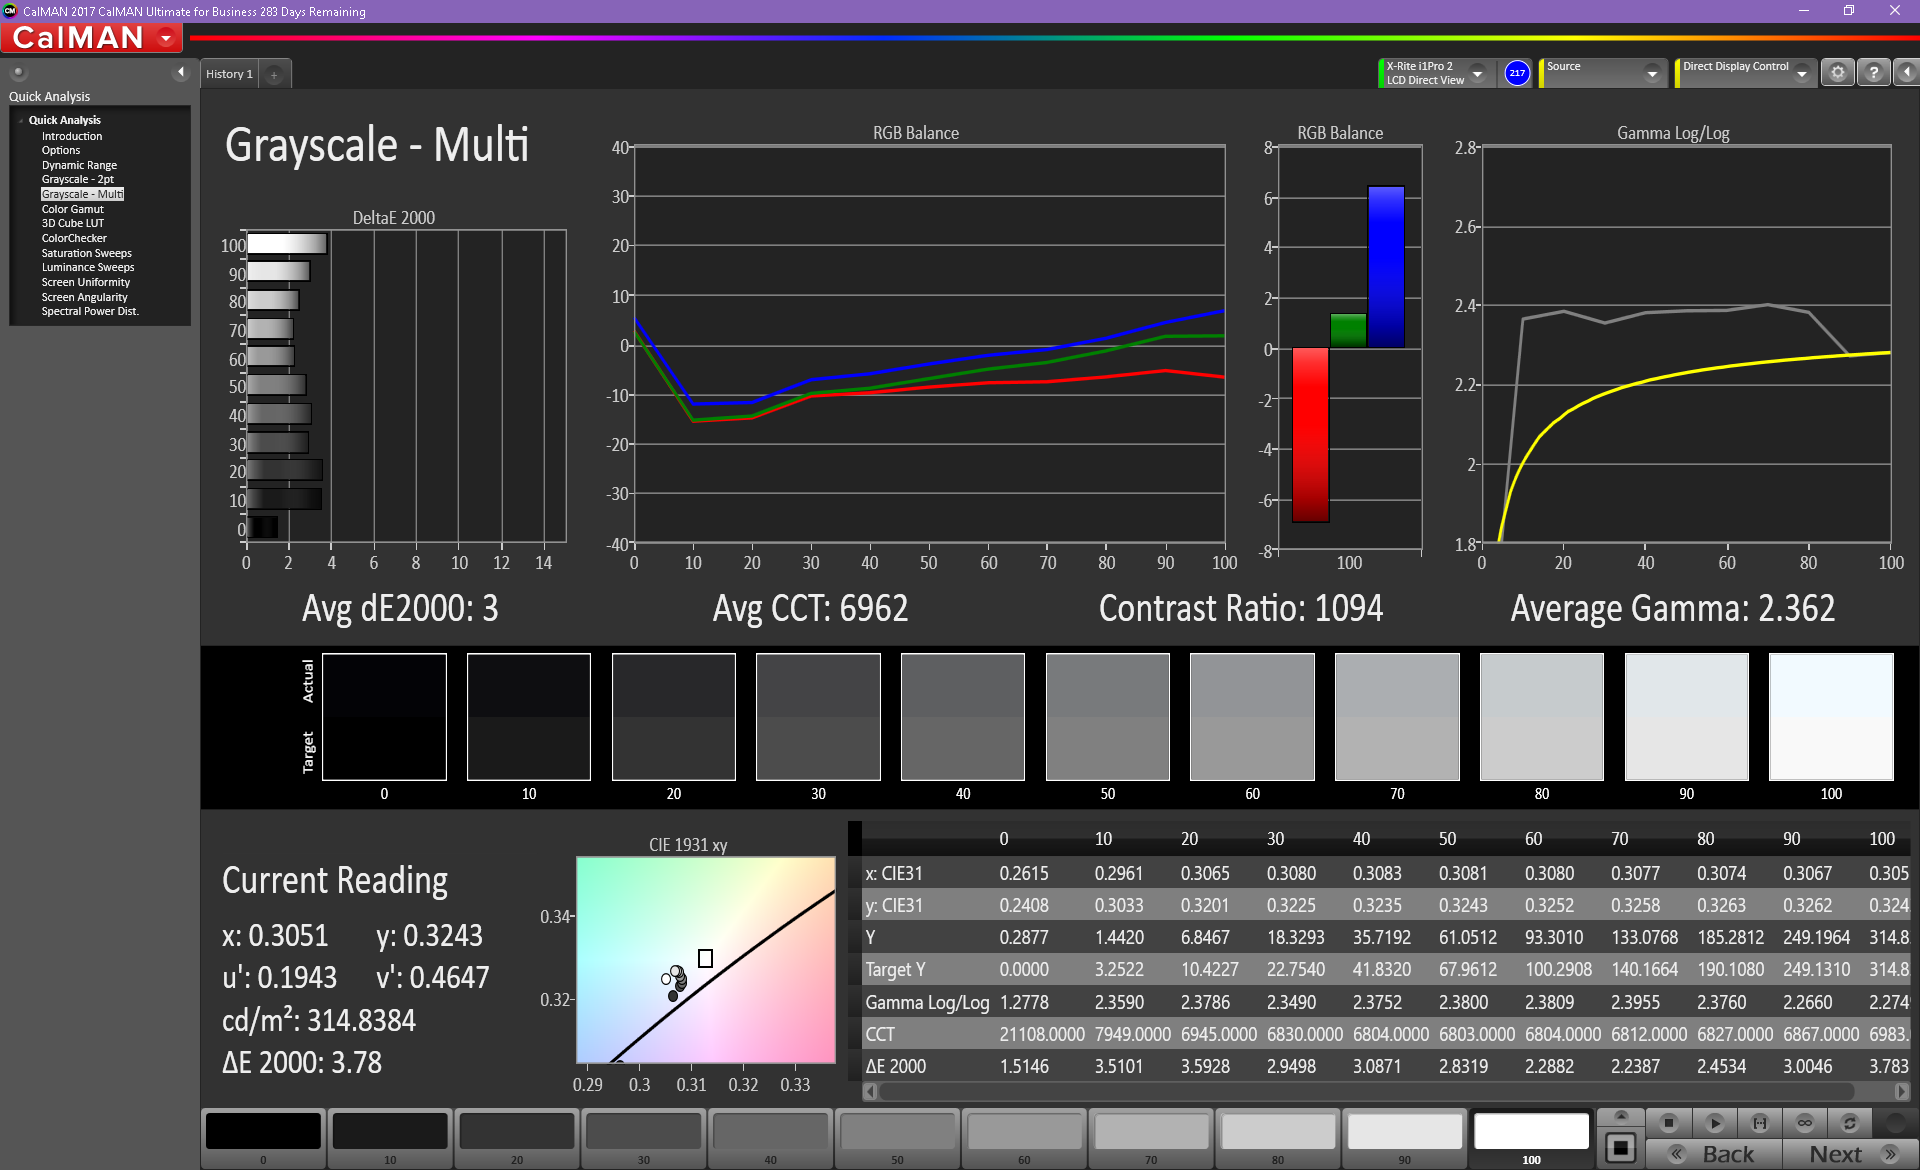
ΔE Greyscale 3 | 0.57-98 Ø5.3
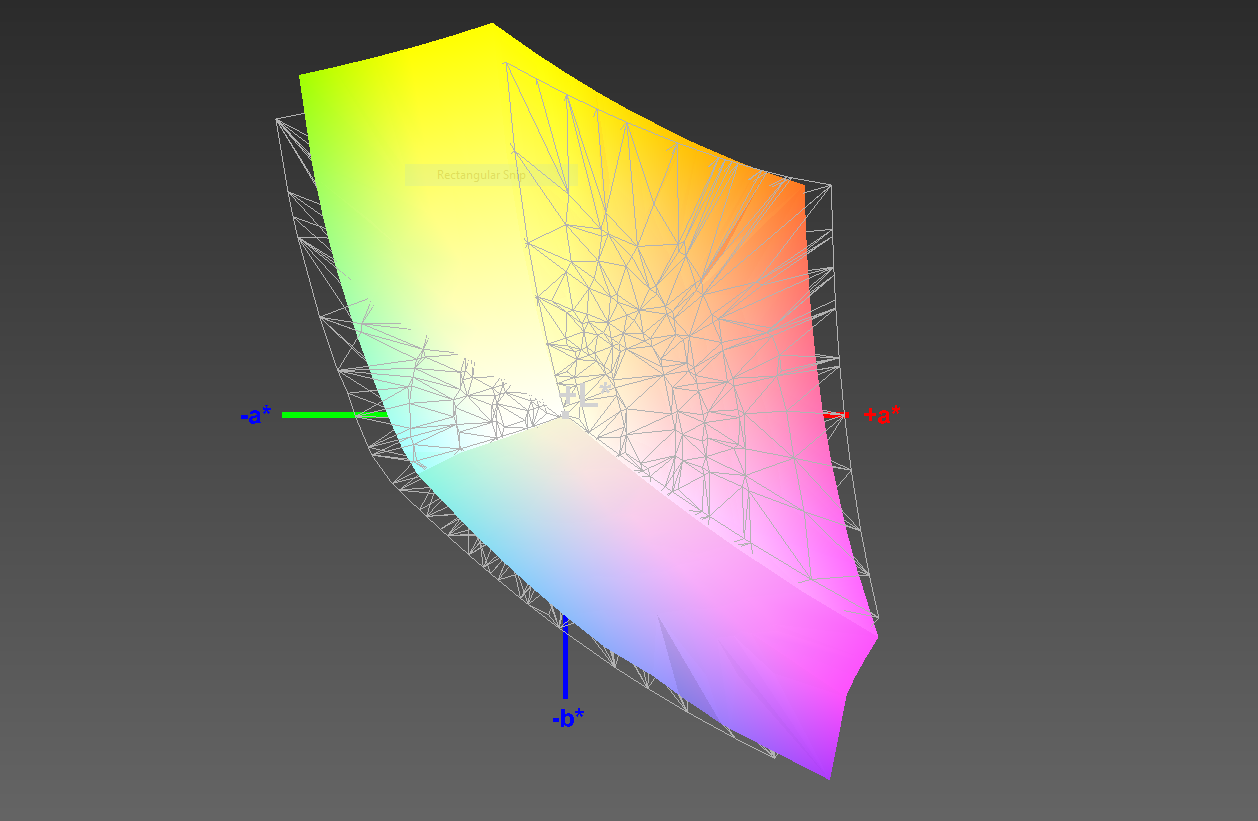
88% sRGB (Argyll 1.6.3 3D)
58% AdobeRGB 1998 (Argyll 1.6.3 3D)
64.8% AdobeRGB 1998 (Argyll 2.2.0 3D)
88.8% sRGB (Argyll 2.2.0 3D)
63.6% Display P3 (Argyll 2.2.0 3D)
Gamma: 2.36
| Dell Latitude 7490 AU Optronics AU0223D, IPS, 14.00, 1920x1080 | Dell Latitude 7480 LG Philips LGD0557, IPS, 14.00, 1920x1080 | Lenovo ThinkPad T480-20L6S01V00 Lenovo LP140WF6-SPB7, IPS, 14.00, 1920x1080 | Lenovo ThinkPad T480s-20L8S02E00 LP140QH2-SPB1, IPS LED, 14.00, 2560x1440 | Lenovo ThinkPad X1 Carbon 2018-20KGS03900 B140QAN02.0, IPS, 14.00, 2560x1440 | Toshiba Tecra X40-D Toshiba TOS508F, IPS, 14.00, 1920x1080 | Asus ASUSPRO B9440UA-GV0100T AU Optronics AUO353D / B140HAN03.5, IPS, 14.00, 1920x1080 | HP Elitebook 1040 G4-2XU40UT Chi Mei CMN14D7, IPS, 14.00, 1920x1080 | |
|---|---|---|---|---|---|---|---|---|
| Display | 3% | -36% | 11% | 35% | -34% | 1% | 7% | |
| Display P3 Coverage | 63.6 | 65.4 3% | 39.24 -38% | 71.4 12% | 87.7 38% | 40.55 -36% | 64 1% | 66.8 5% |
| sRGB Coverage | 88.8 | 92.3 4% | 58.8 -34% | 96.6 9% | 100 13% | 61 -31% | 89.1 0% | 97.1 9% |
| AdobeRGB 1998 Coverage | 64.8 | 65.8 2% | 40.56 -37% | 72.1 11% | 99.9 54% | 41.89 -35% | 65.2 1% | 69 6% |
| Response Times | 10% | 25% | 20% | -14% | 19% | 2% | 18% | |
| Response Time Grey 50% / Grey 80% * | 48.4 ? | 40.8 ? 16% | 35.6 ? 26% | 36 ? 26% | 59.2 ? -22% | 38 ? 21% | 48.8 ? -1% | 34.4 ? 29% |
| Response Time Black / White * | 32.4 ? | 31.2 ? 4% | 24.8 ? 23% | 28 ? 14% | 34.4 ? -6% | 26.8 ? 17% | 30.8 ? 5% | 30 ? 7% |
| PWM Frequency | 20410 ? | 26040 ? | ||||||
| Screen | 7% | -36% | 5% | 40% | -45% | -40% | 1% | |
| Brightness middle | 328.2 | 344 5% | 307 -6% | 311 -5% | 578 76% | 283.9 -13% | 319 -3% | 295.9 -10% |
| Brightness | 305 | 321 5% | 295 -3% | 302 -1% | 533 75% | 261 -14% | 294 -4% | 287 -6% |
| Brightness Distribution | 87 | 85 -2% | 90 3% | 91 5% | 84 -3% | 85 -2% | 87 0% | 87 0% |
| Black Level * | 0.37 | 0.32 14% | 0.25 32% | 0.36 3% | 0.38 -3% | 0.25 32% | 0.26 30% | 0.23 38% |
| Contrast | 887 | 1075 21% | 1228 38% | 864 -3% | 1521 71% | 1136 28% | 1227 38% | 1287 45% |
| Colorchecker dE 2000 * | 3.82 | 2.6 32% | 5.7 -49% | 3 21% | 1.9 50% | 6.4 -68% | 7.1 -86% | 2.83 26% |
| Colorchecker dE 2000 max. * | 5.58 | 7.8 -40% | 21.3 -282% | 6.1 -9% | 3.8 32% | 18.7 -235% | 13.7 -146% | 7.34 -32% |
| Colorchecker dE 2000 calibrated * | 3.5 | 4.7 -34% | 1.7 51% | 0.8 77% | ||||
| Greyscale dE 2000 * | 3 | 2.6 13% | 3.7 -23% | 4 -33% | 3 -0% | 6.3 -110% | 9.61 -220% | 5.2 -73% |
| Gamma | 2.36 93% | 2.28 96% | 2.11 104% | 2.17 101% | 2.14 103% | 2.39 92% | 2.33 94% | 2.28 96% |
| CCT | 6962 93% | 7050 92% | 7353 88% | 6961 93% | 6377 102% | 6511 100% | 6021 108% | 7056 92% |
| Color Space (Percent of AdobeRGB 1998) | 58 | 65.82 13% | 37.4 -36% | 66.7 15% | 88.8 53% | 38 -34% | 54.01 -7% | 63 9% |
| Color Space (Percent of sRGB) | 88 | 92.27 5% | 58.7 -33% | 96.7 10% | 100 14% | 60 -32% | 83.02 -6% | 97 10% |
| Total Average (Program / Settings) | 7% /
6% | -16% /
-28% | 12% /
8% | 20% /
32% | -20% /
-34% | -12% /
-27% | 9% /
4% |
* ... smaller is better
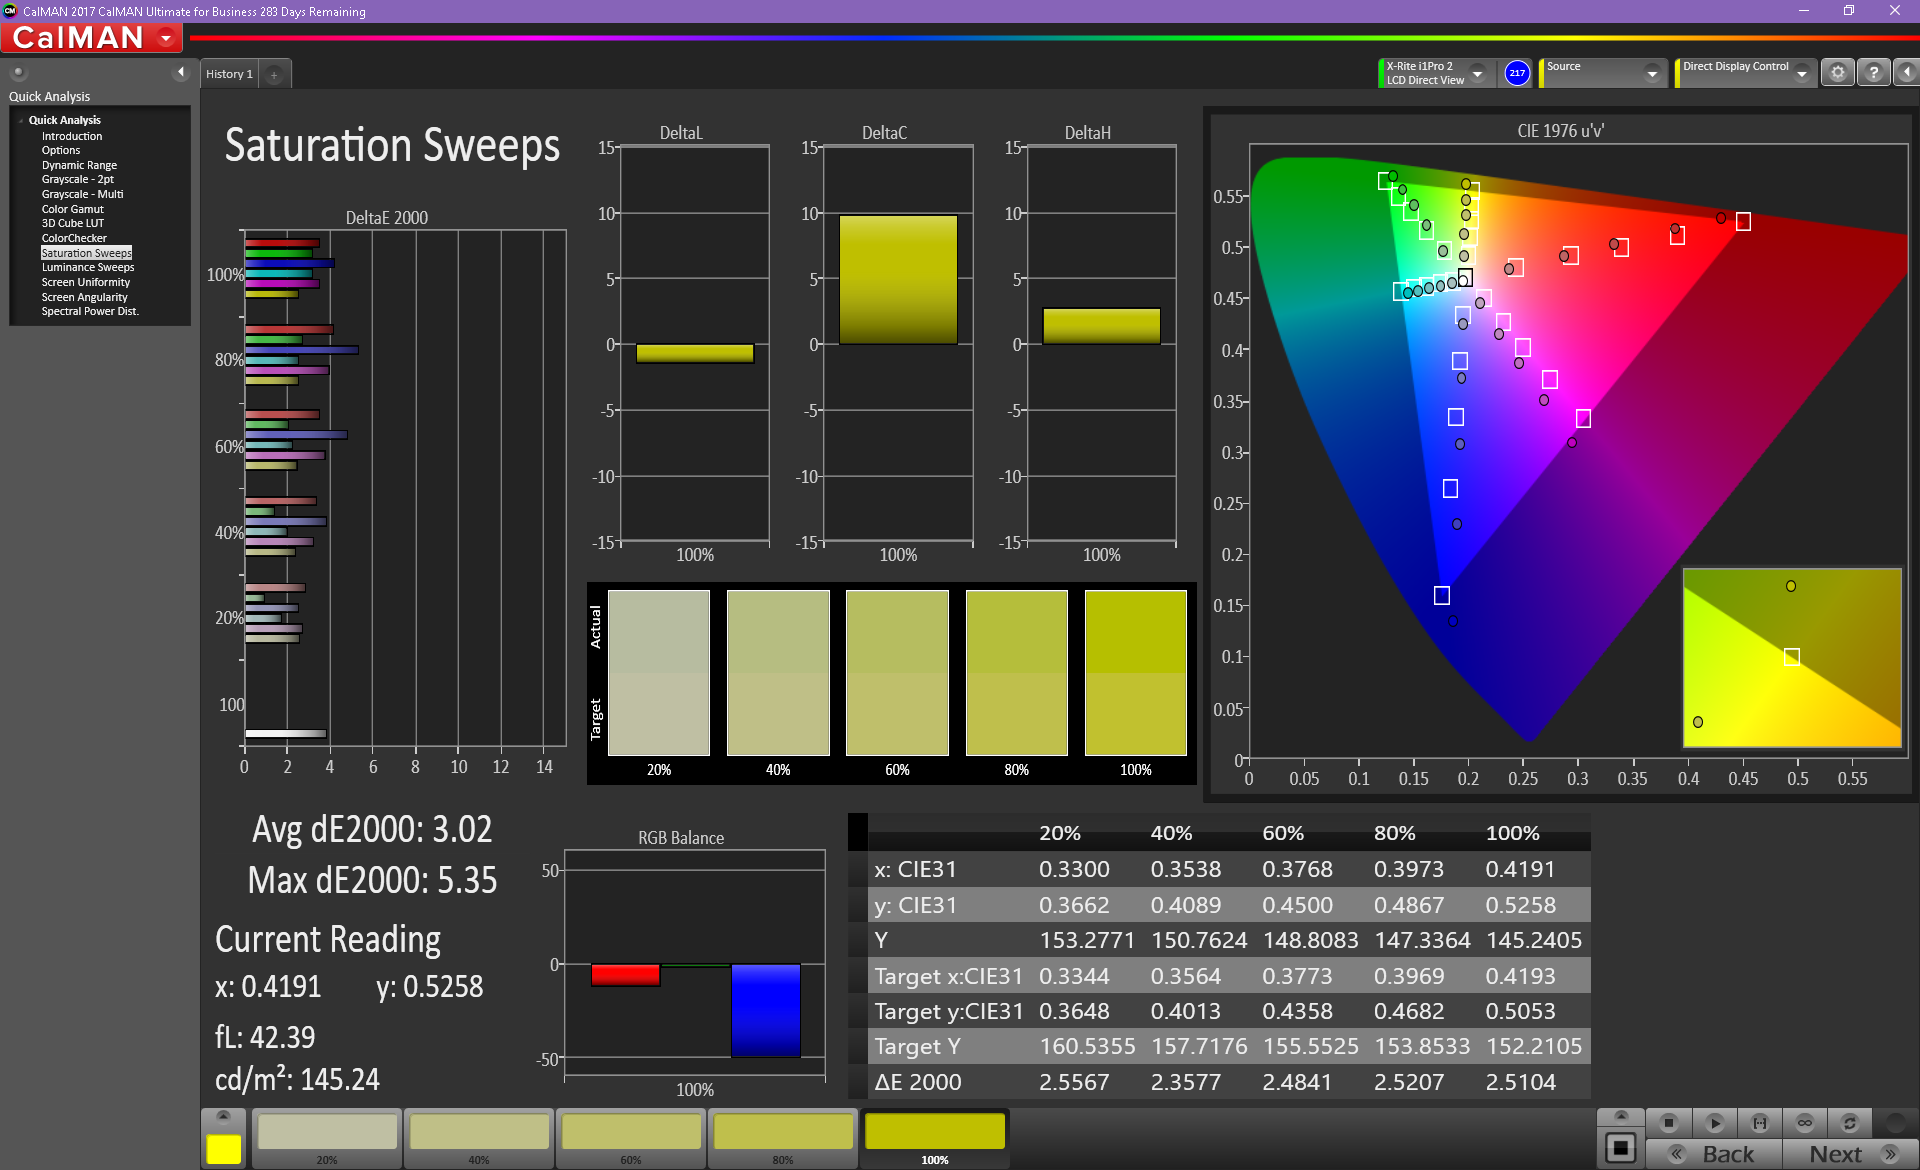
Colors are fairly accurate without any adjustment; DeltaE2000 for color sits at about 3.82 and 3 for grays. (DeltaE2000 scores of 3 or less are generally considered acceptable for professional color work). Calibration improves these numbers a small amount. An interesting note is the tight variance in color accuracy; while some devices have a lower average DeltaE2000 score, the maximum DeltaE2000 score for color can be relatively high, which makes for a wide window in color accuracy. This is evident with the HP Elitebook 1040 G4 (max DeltaE2000 is 7.34). The Latitude 7490, conversely, has a lower maximum DeltaE2000 score at 5.58.
Color space coverage is good at 88% for sRGB and 58% for AdobeRGB. Overall, colors should be accurate and numerous enough for amateur videography and photography work, but professionals may steer toward the MacBook Pro or ThinkPad X1 Carbon, both of which have much better screens.


Viewing angles are excellent. Images and text remain clear at 45° and beyond. Outdoor visibility is also good; under shade, the screen is completely usable. Even under direct sunlight, the display is legible, but some softer or darker colors may wash out. Backlight bleed is non-existent save for small spots along the bottom bezel. The bleed in these areas is only noticeable under close scrutiny and isn't visible under normal use.


Display Response Times
| ↔ Response Time Black to White | ||
|---|---|---|
| 32.4 ms ... rise ↗ and fall ↘ combined | ↗ 18.8 ms rise | 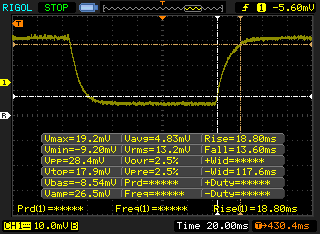 |
| ↘ 13.6 ms fall | ||
| The screen shows slow response rates in our tests and will be unsatisfactory for gamers. In comparison, all tested devices range from 0.1 (minimum) to 240 (maximum) ms. » 86 % of all devices are better. This means that the measured response time is worse than the average of all tested devices (21.5 ms). | ||
| ↔ Response Time 50% Grey to 80% Grey | ||
| 48.4 ms ... rise ↗ and fall ↘ combined | ↗ 27.6 ms rise |  |
| ↘ 20.8 ms fall | ||
| The screen shows slow response rates in our tests and will be unsatisfactory for gamers. In comparison, all tested devices range from 0.2 (minimum) to 636 (maximum) ms. » 82 % of all devices are better. This means that the measured response time is worse than the average of all tested devices (33.7 ms). | ||
Screen Flickering / PWM (Pulse-Width Modulation)
| Screen flickering / PWM not detected |  | ||
In comparison: 53 % of all tested devices do not use PWM to dim the display. If PWM was detected, an average of 17900 (minimum: 5 - maximum: 3846000) Hz was measured. | |||
Performance
Herein lies the biggest change. The Latitude 7490 opts for Intel's 8th generation ULV processors, which boast twice as many cores as their Kaby Lake counterparts (4 vs. 2). Theoretically, this should result in double the performance in CPU-intensive tasks, and this is almost the case. Combined with a fast Samsung PM961 NVMe SSD, an adequate amount of (upgradeable) RAM, and an iGPU that supports multiple monitors and 4K streaming, the Latitude 7490 makes for a strong option in the business segment.


Processor
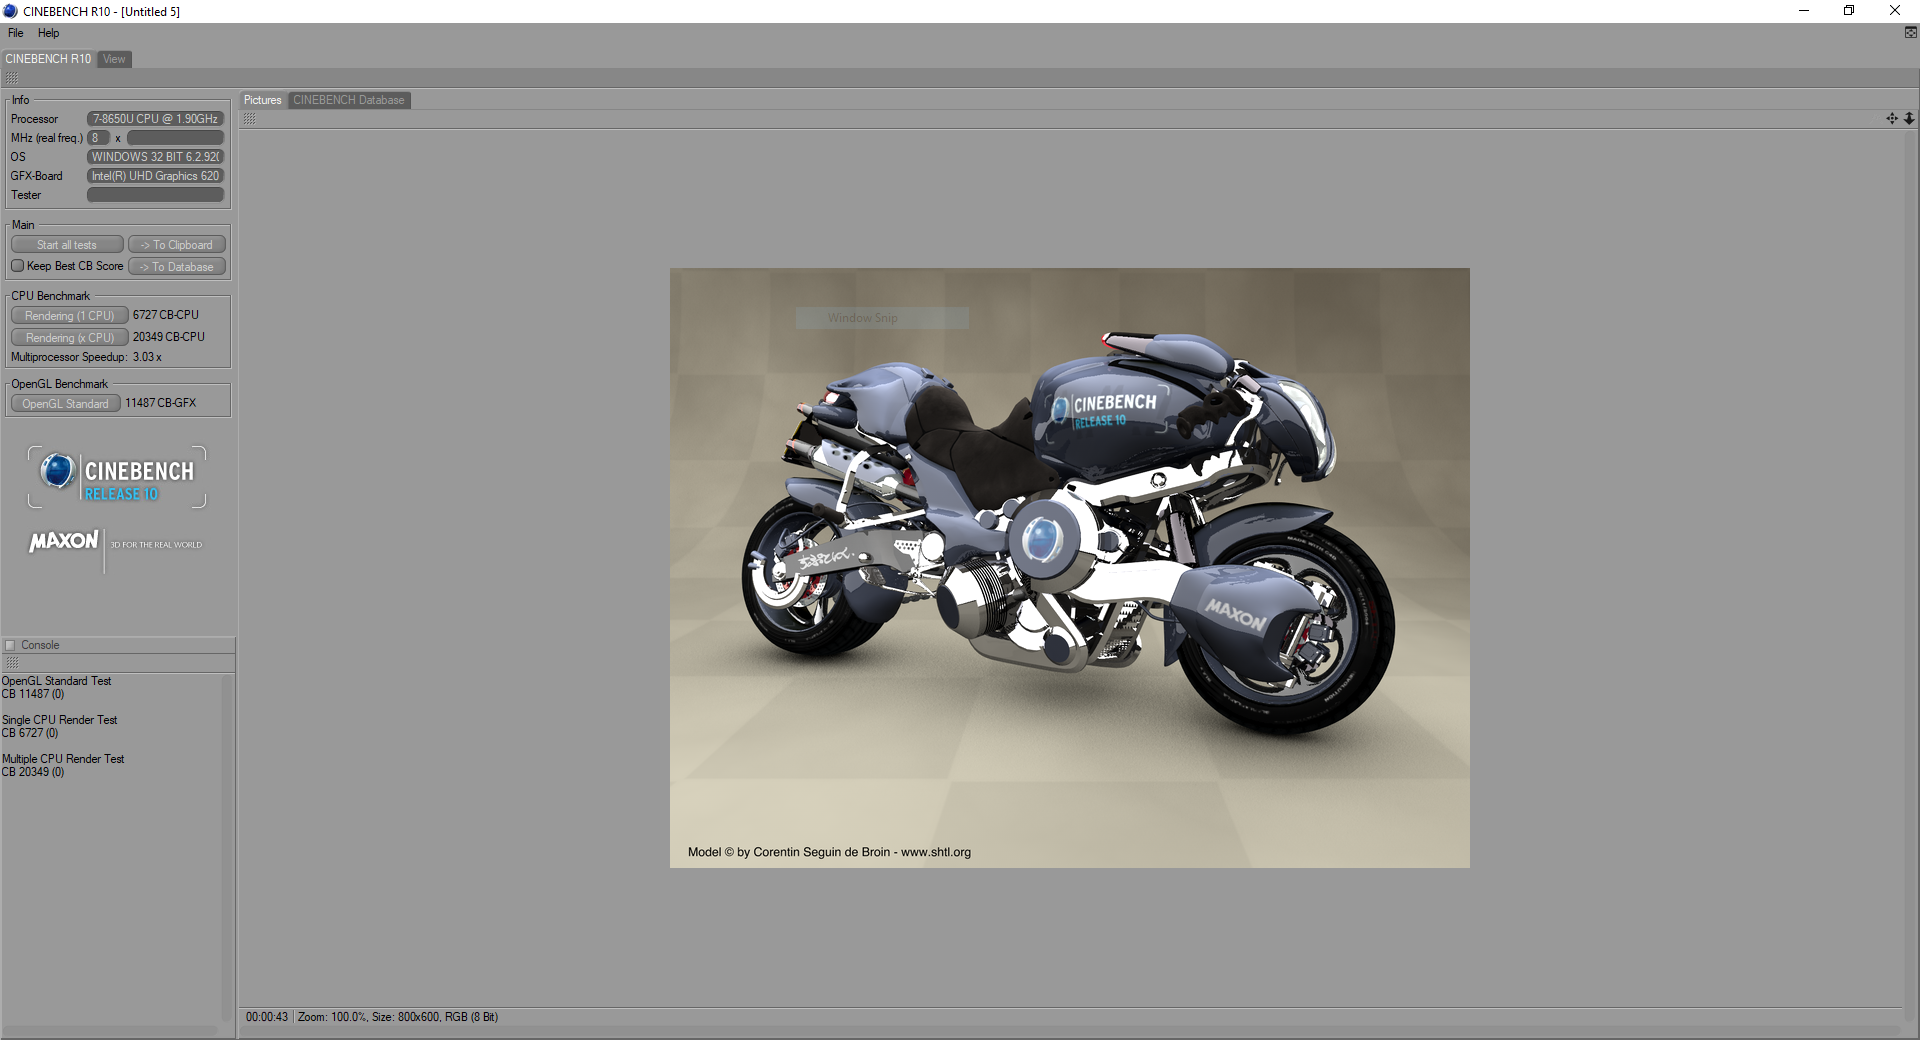
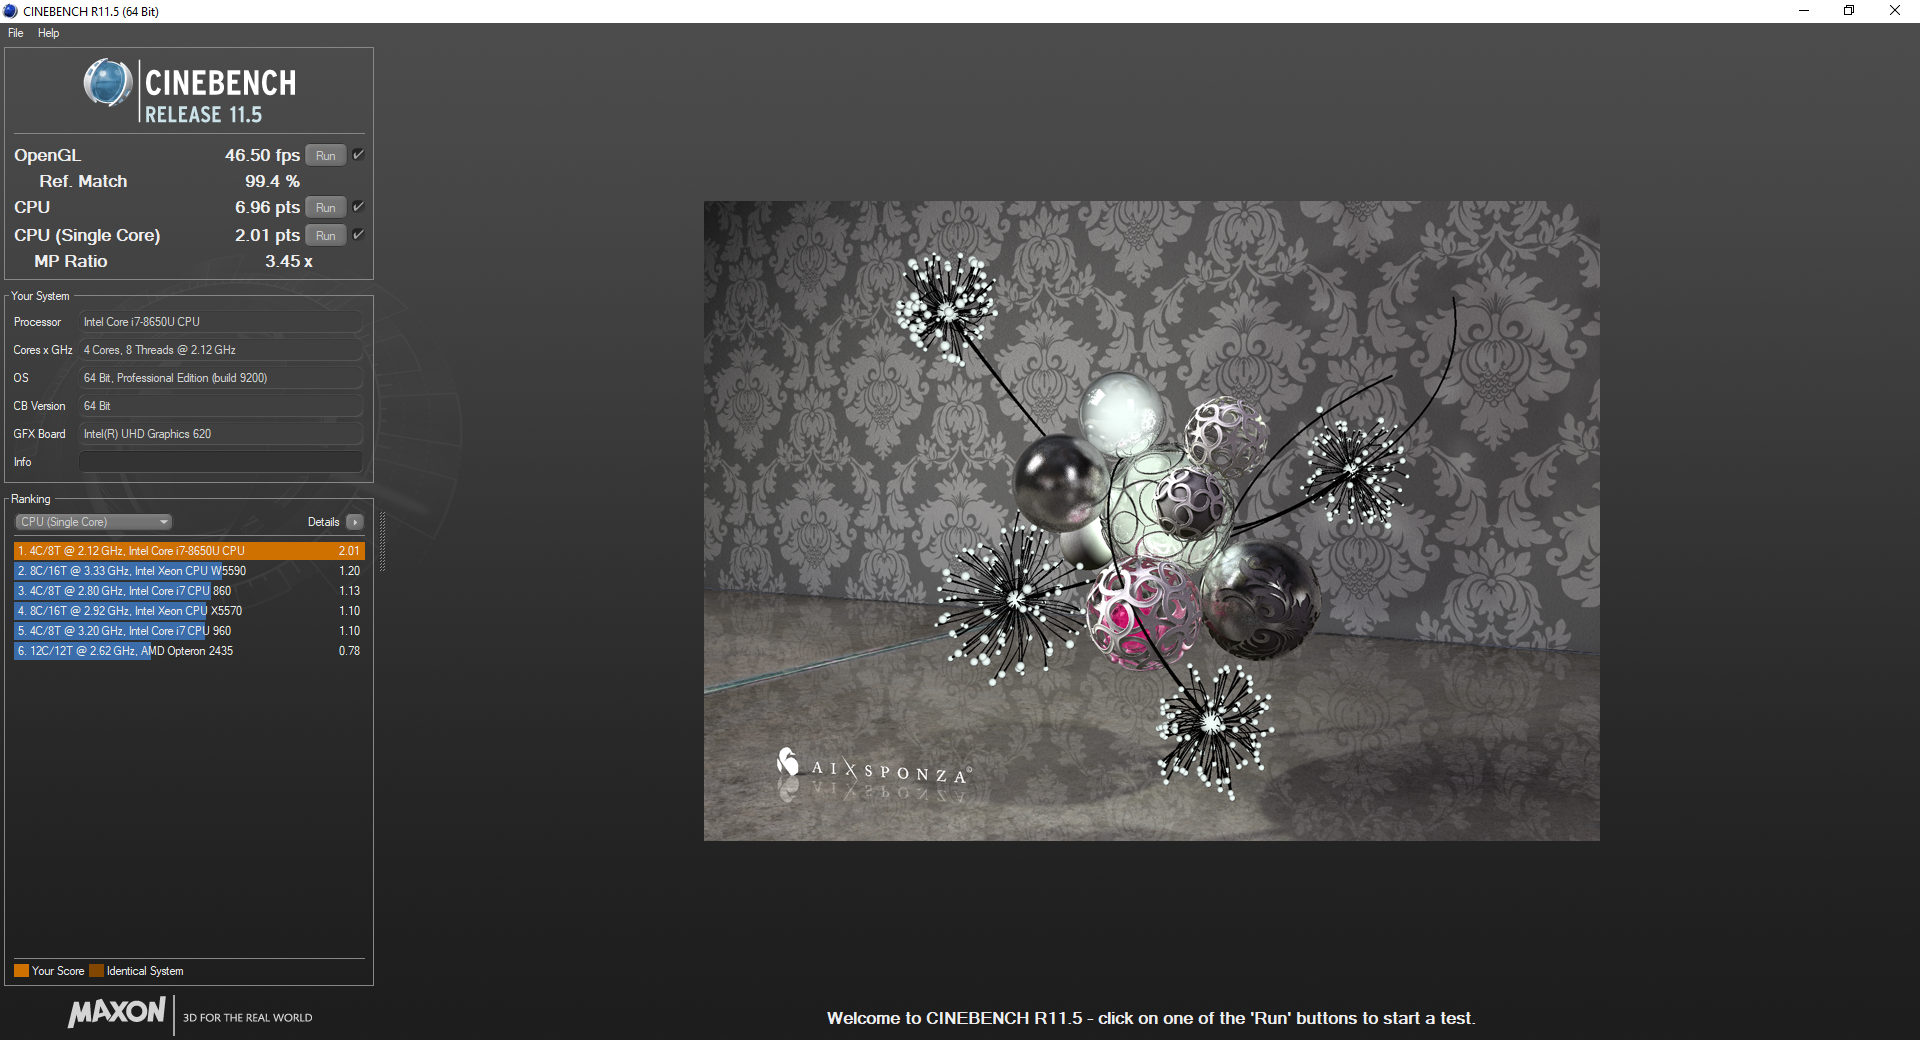
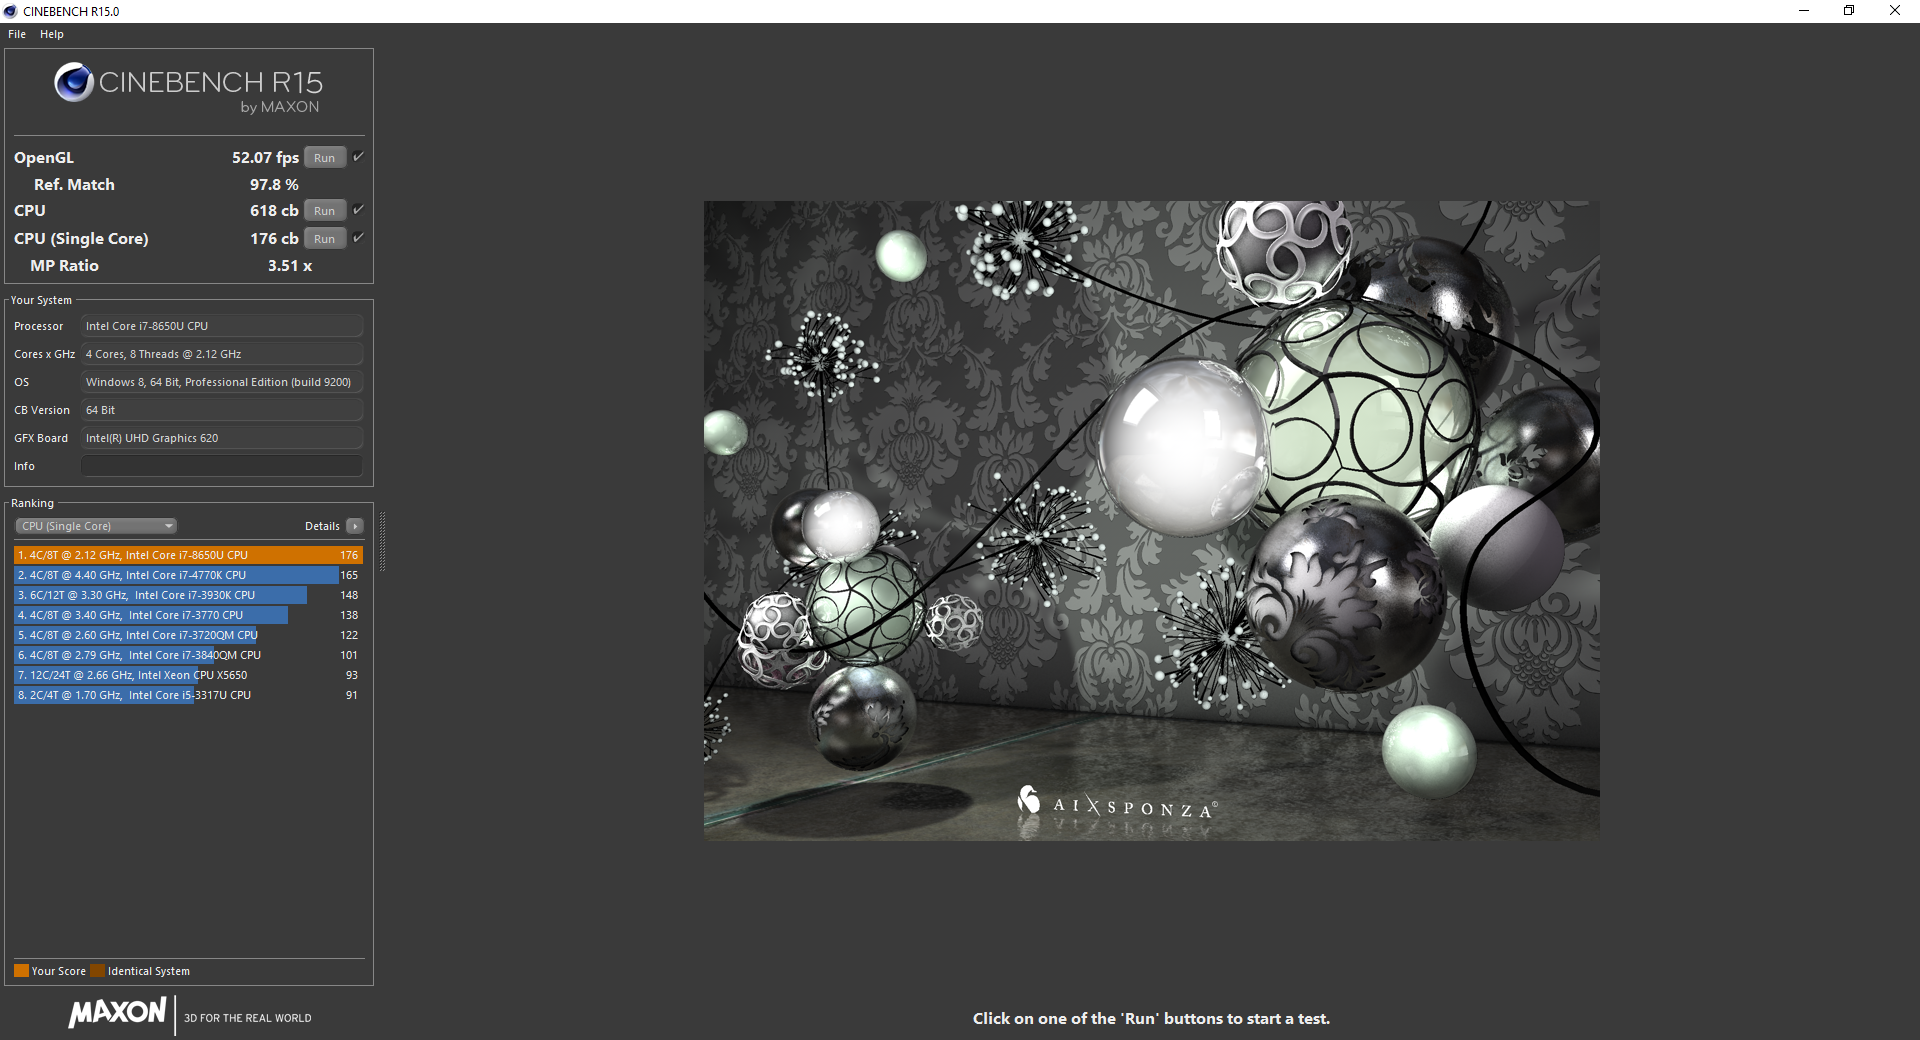
The focal point of the Latitude 7490 is undoubtedly its upgraded CPU. Intel's Core i7-8650U is the leader in the ULV Kaby Lake R line and best represents the massive performance gains the 8th generation brings. The Core i7-8650U packs four cores into the same 15 W TDP design, and the improvement is apparent. The processor's base clock is significantly lower than the Core i7-7600U (1.9 GHz vs. 2.8 GHz, respectively), but its boost clock of 4.2 GHz (on a single core) is about 8% higher than the 7600U.
In Cinebench, these improved specs result in about an 80% bump in multi-threaded performance, which is impressive. Two more cores go a long way, but other quad-core CPUs beat out the 15 W processor. For instance, the HP Elitebook 1040 G4's Core i7-7820HQ, which is uncommon for a business laptop, edges out the i7-8650U by about 7%. Interestingly, the i7-8550U in the ThinkPad T480s is better still, beating the 8650U by about 17% despite its lower boost clock speed.
Long-term testing is not as favorable to the Core i7-8650U. Running Cinebench R15 in a loop sees the CPU continuously throttle before settling at about 90% of its single-run scores. On battery, the CPU operates at about 90% of its plugged-in performance.
* ... smaller is better
System Performance
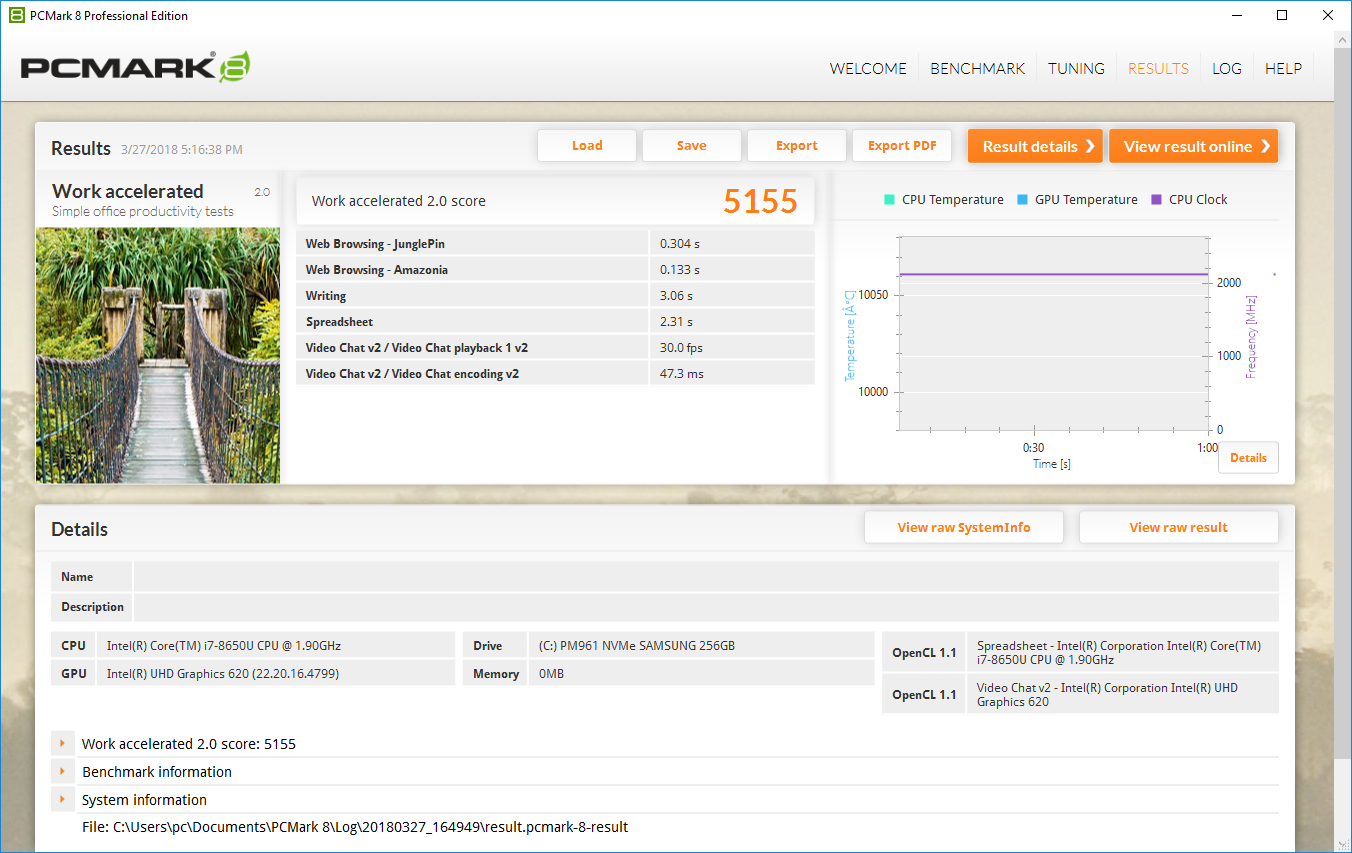
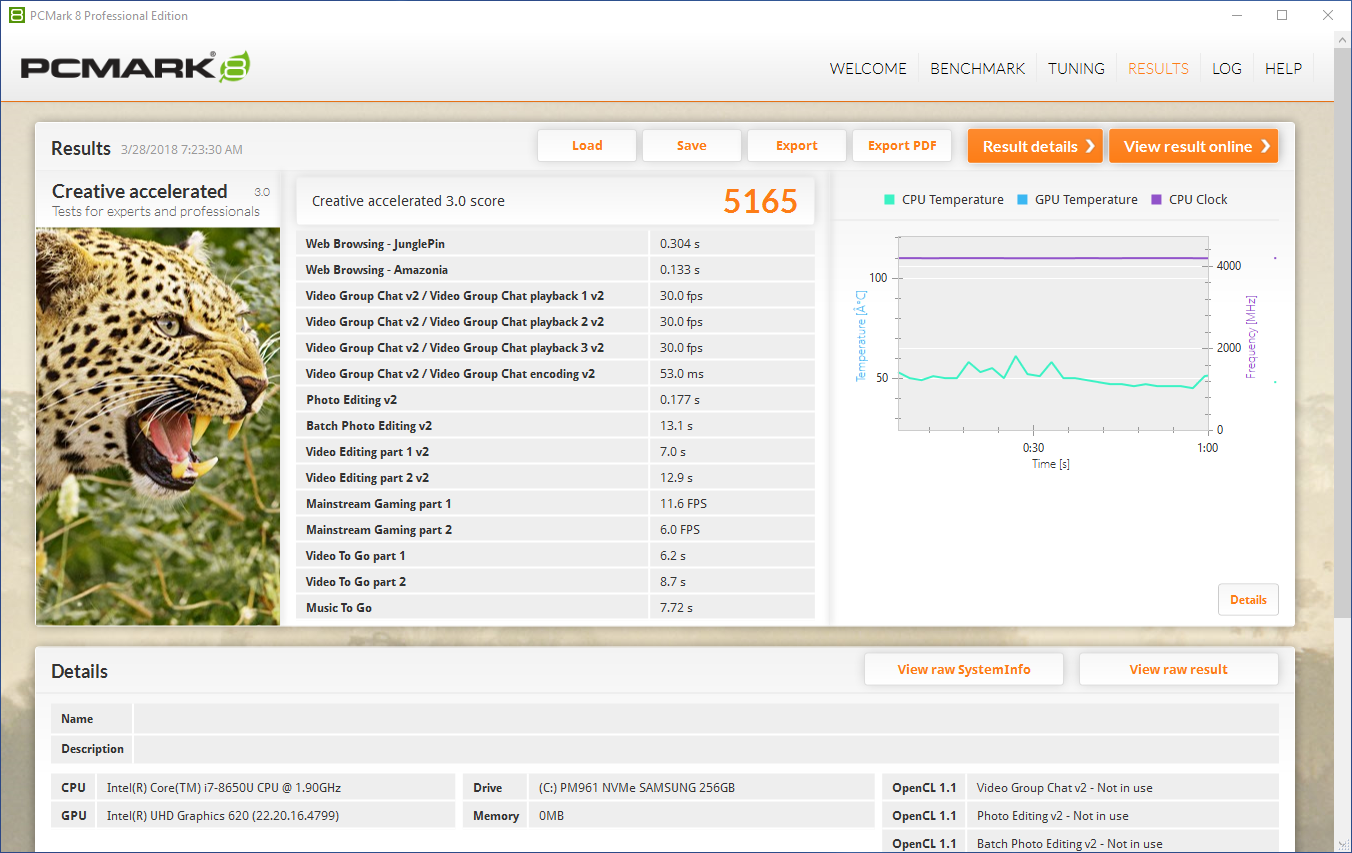
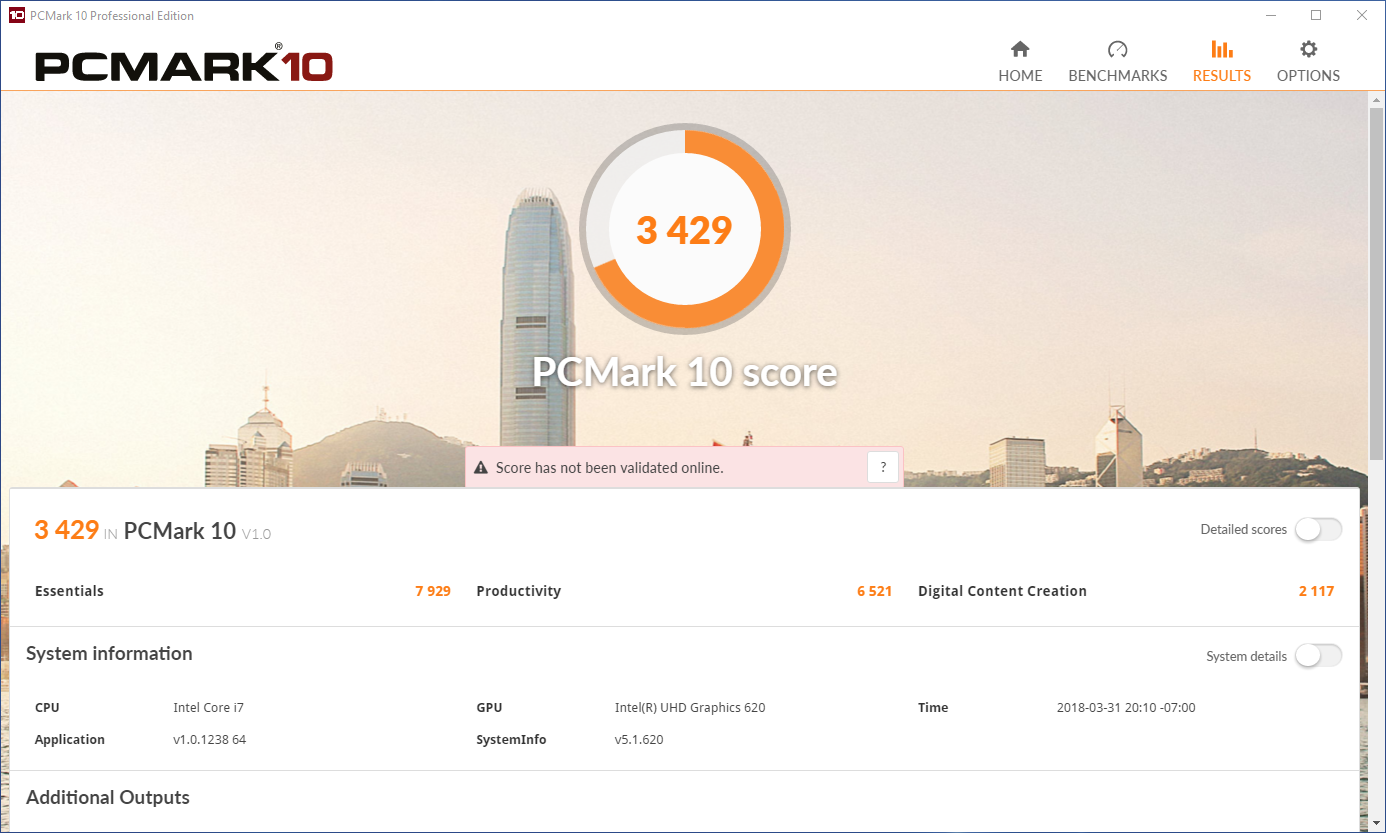
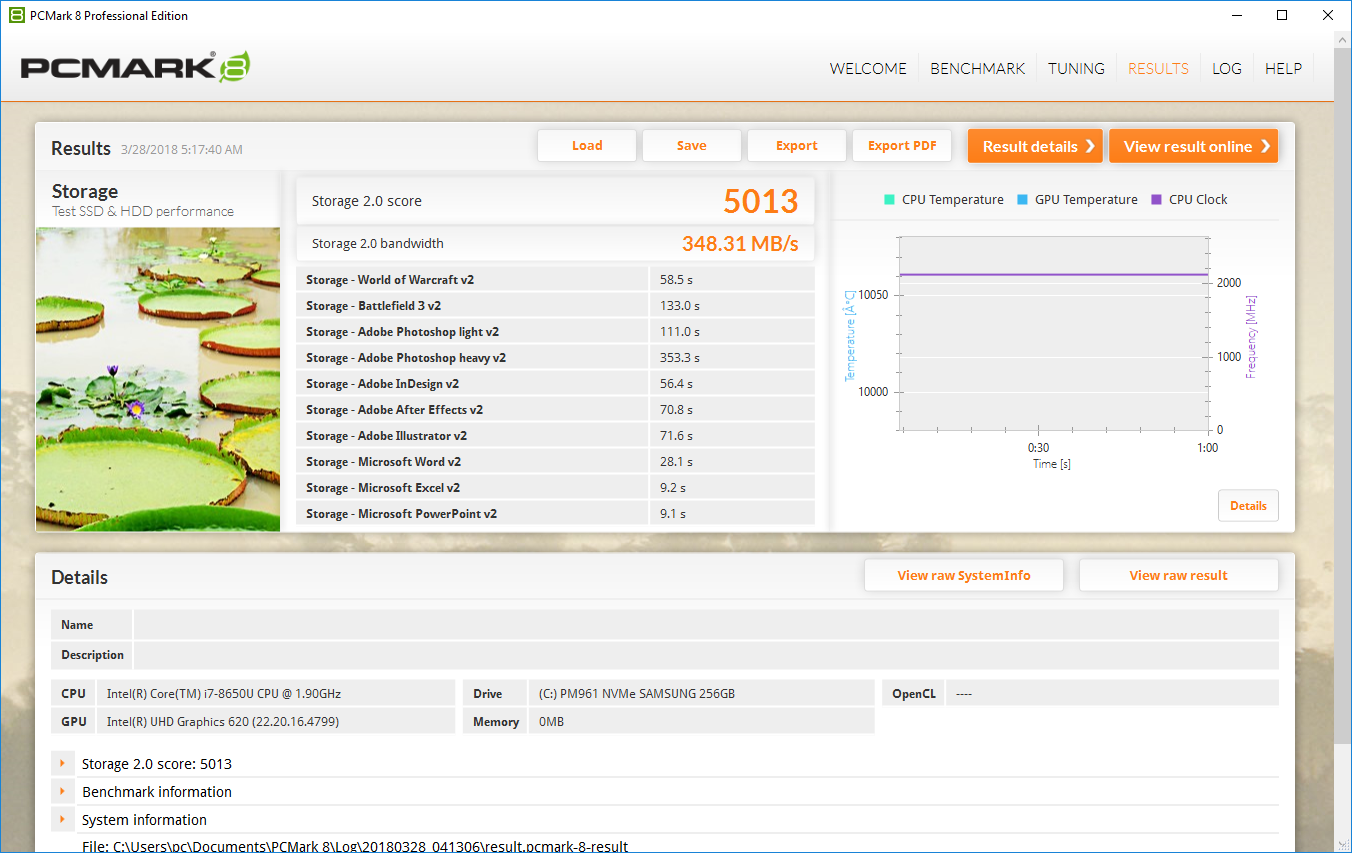
Overall system performance is excellent. Due to the quad-core CPU and Samsung PM961 NVMe SSD, the Latitude 7490 scores well in PCMark 8 and PCMark 10. It consistently ranks above its business-class competitors in this round-up and is ousted only by the Elitebook 1040 G4 and Asus Zephyrus GM501, both of which are equipped with more powerful hardware.

| PCMark 8 Home Score Accelerated v2 | 4029 points | |
| PCMark 8 Creative Score Accelerated v2 | 5165 points | |
| PCMark 8 Work Score Accelerated v2 | 5155 points | |
| PCMark 10 Score | 3429 points | |
Help | ||
Storage Devices
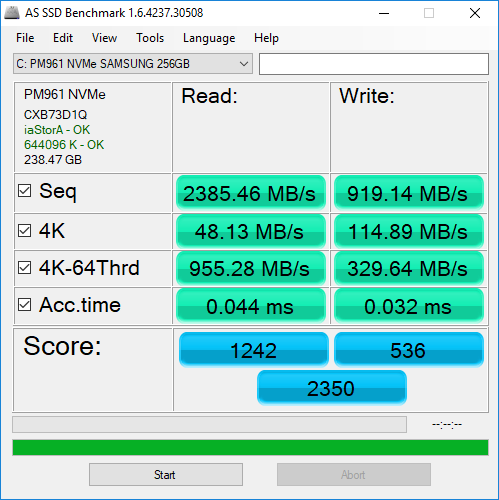
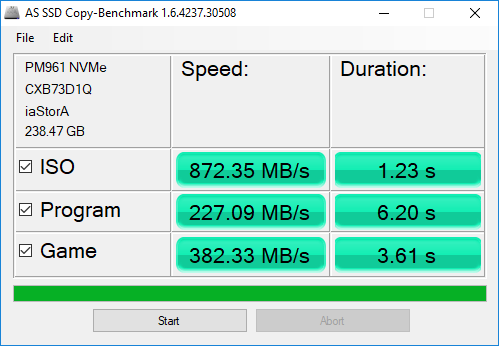
The Samsung PM961 PCIe NVMe SSD has proved itself time and again in our tests, and it is no different here. Access times are lightning fast and read and write speeds (with both large files and groups of smaller chunks) are very good. The updated PM981, found in the ThinkPad X1 Carbon, is a significant improvement over the PM961, however. Users in need of a faster drive should look to Lenovo, but most consumers will be more than happy with the storage options on the Latitude 7490. The SSD can be upgraded with any other M.2 form factor drive.

| Dell Latitude 7490 Samsung PM961 MZVLW256HEHP | Dell Latitude 7480 Intel SSDSCKKF256H6 | Lenovo ThinkPad T480-20L6S01V00 Samsung SSD PM981 MZVLB512HAJQ | Lenovo ThinkPad T480s-20L8S02E00 Samsung SSD PM981 MZVLB512HAJQ | Lenovo ThinkPad X1 Carbon 2018-20KGS03900 Samsung SSD PM981 MZVLB512HAJQ | Toshiba Tecra X40-D Samsung PM961 MZVLW256HEHP | Asus ASUSPRO B9440UA-GV0100T Micron SSD 1100 (MTFDDAV256TBN) | HP Elitebook 1040 G4-2XU40UT Toshiba XG4 NVMe (THNSN5512GPUK) | Average Samsung PM961 MZVLW256HEHP | |
|---|---|---|---|---|---|---|---|---|---|
| AS SSD | -59% | -603% | 76% | 78% | 22% | -62% | -16% | -98% | |
| Copy Game MB/s | 382.3 | 228.1 -40% | 676 77% | 1110 190% | 1107 190% | 394.2 3% | 537 ? 40% | ||
| Copy Program MB/s | 227.1 | 148.2 -35% | 254.8 12% | 387.5 71% | 460.2 103% | 133.7 -41% | 343 ? 51% | ||
| Copy ISO MB/s | 872 | 262.3 -70% | 921 6% | 1412 62% | 1247 43% | 534 -39% | 1004 ? 15% | ||
| Score Total | 2350 | 764 -67% | 2348 0% | 4115 75% | 3529 50% | 3576 52% | 842 -64% | 2299 -2% | 2565 ? 9% |
| Score Write | 536 | 249 -54% | 147 -73% | 1708 219% | 1801 236% | 675 26% | 372 -31% | 848 58% | 587 ? 10% |
| Score Read | 1242 | 338 -73% | 1480 19% | 1623 31% | 1168 -6% | 1963 58% | 307 -75% | 979 -21% | 1378 ? 11% |
| Access Time Write * | 0.03 | 0.042 -40% | 2.515 -8283% | 0.033 -10% | 0.027 10% | 0.028 7% | 0.054 -80% | 0.038 -27% | 0.4637 ? -1446% |
| Access Time Read * | 0.04 | 0.082 -105% | 0.041 -3% | 0.045 -13% | 0.029 27% | 0.061 -53% | 0.088 -120% | 0.105 -163% | 0.06777 ? -69% |
| 4K-64 Write | 329.6 | 125.4 -62% | 96.2 -71% | 1456 342% | 1529 364% | 438.4 33% | 252.9 -23% | 662 101% | 419 ? 27% |
| 4K-64 Read | 955 | 260 -73% | 1278 34% | 1329 39% | 876 -8% | 1663 74% | 234 -75% | 782 -18% | 1112 ? 16% |
| 4K Write | 114.9 | 86.6 -25% | 1.76 -98% | 114.4 0% | 134.3 17% | 124.8 9% | 77.5 -33% | 100.1 -13% | 91.6 ? -20% |
| 4K Read | 48.13 | 28.89 -40% | 58 21% | 49.81 3% | 52.4 9% | 51.6 7% | 24.21 -50% | 38.49 -20% | 45.1 ? -6% |
| Seq Write | 919 | 367.5 -60% | 487.1 -47% | 1382 50% | 1376 50% | 1117 22% | 419.6 -54% | 863 -6% | 960 ? 4% |
| Seq Read | 2385 | 492.8 -79% | 1441 -40% | 2440 2% | 2396 0% | 2479 4% | 490.2 -79% | 1585 -34% | 2019 ? -15% |
* ... smaller is better

GPU Performance
The Intel UHD Graphics 620 integrated GPU is not meant for heavy graphical workloads, but it performs well for most business needs. The Latitude 7490 performs about 10-20% better in Fire Strike than most other business notebooks, and the support for H.265/HEVC Main10 will be satisfactory for most media consumption, including 4K video streaming. The iGPU can support resolutions of 3840x2160 at 60 Hz (via DisplayPort) and can run up to 3 displays at once (albeit not at 4K).
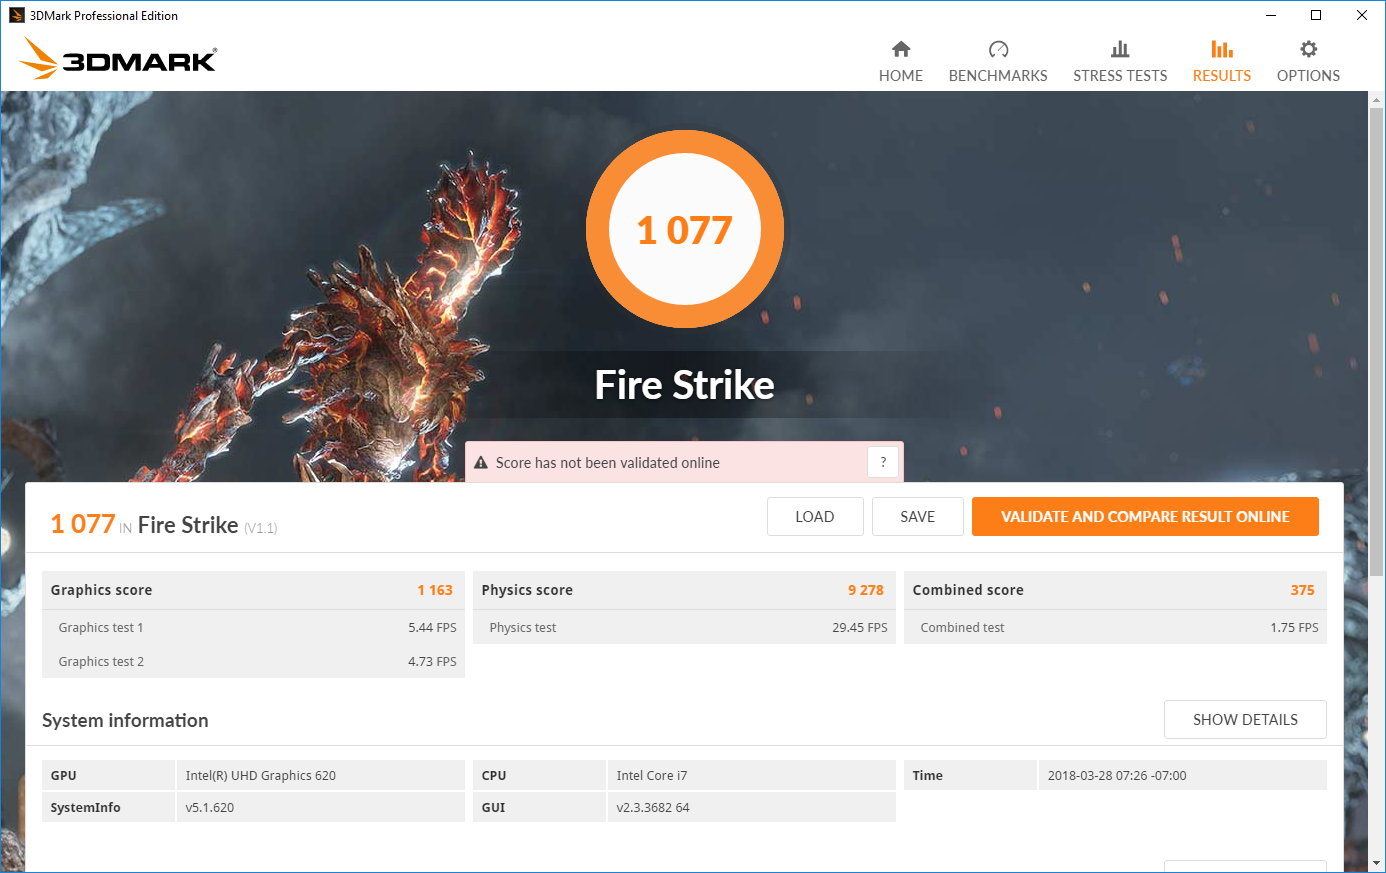
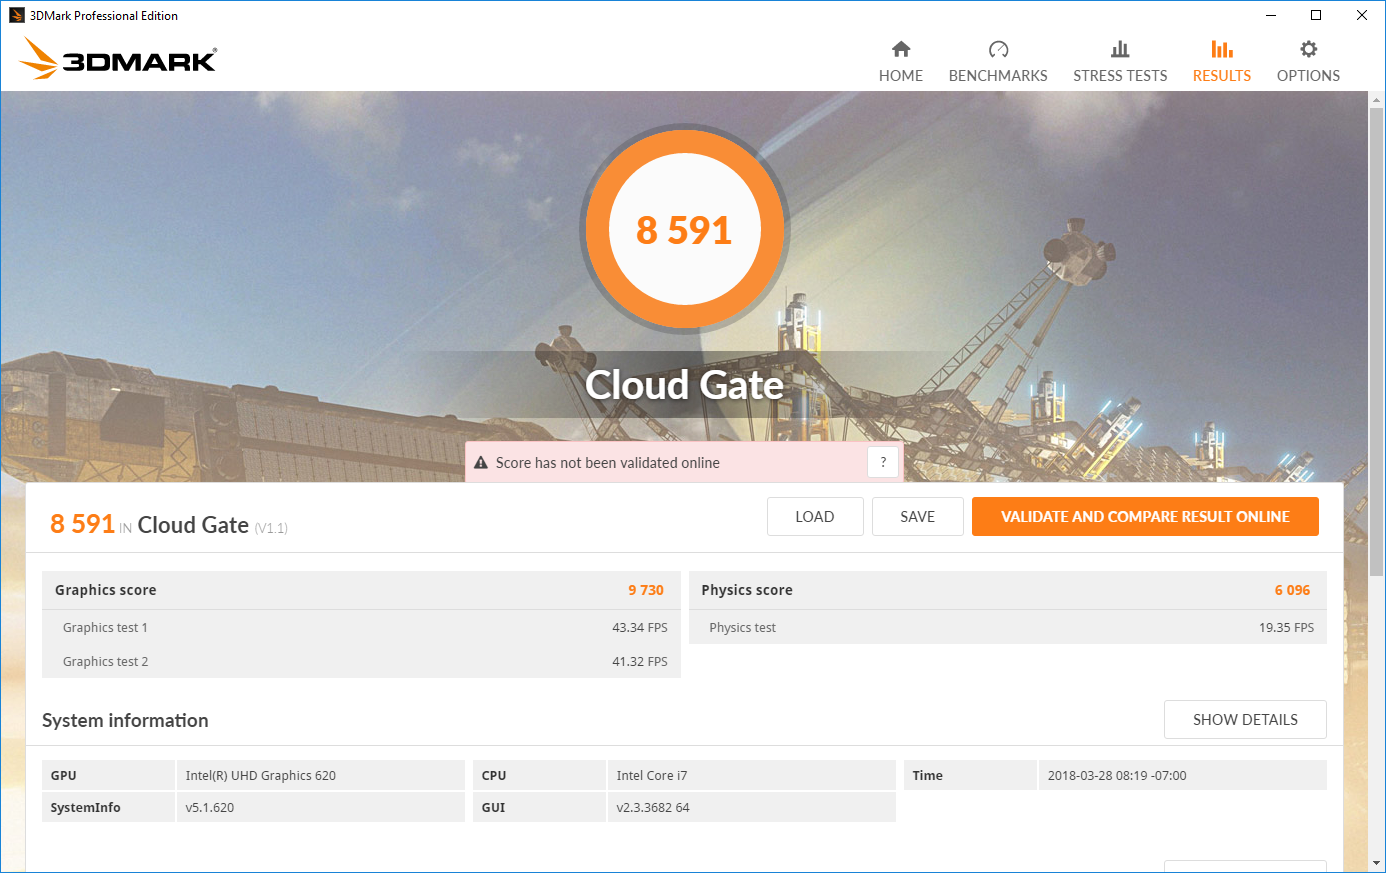
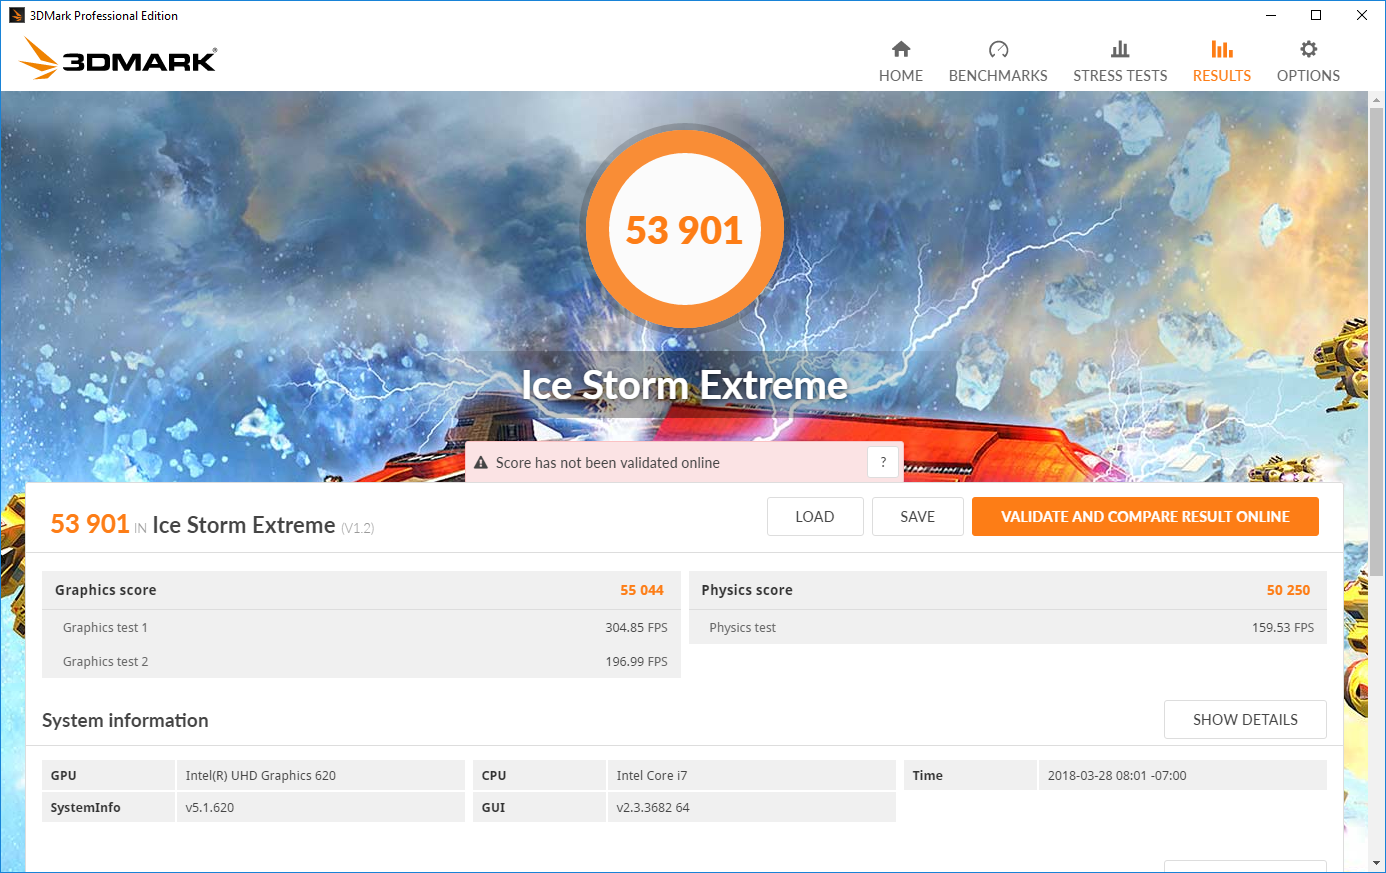
| 3DMark Cloud Gate Standard Score | 8591 points | |
| 3DMark Fire Strike Score | 1077 points | |
Help | ||
Gaming Performance
As mentioned, the iGPU is not suitable for heavy 3D workloads, so intense games are off the table. However, the Latitude 7490 can handle a few rounds of Rocket League, so long as details are turned down. Other titles, such as Civilization VI, will need to be run at low resolutions and minimal graphics settings for a playable experience. Anything more demanding is not viable.
| Civilization VI | |
| 1920x1080 Ultra Preset AA:4xMS (sort by value) | |
| Dell Latitude 7490 | |
| Lenovo ThinkPad T580-20LAS01H00 | |
| Average Intel UHD Graphics 620 (5 - 6, n=2) | |
| 1920x1080 High Preset (sort by value) | |
| Dell Latitude 7490 | |
| Lenovo ThinkPad T580-20LAS01H00 | |
| Average Intel UHD Graphics 620 (5.9 - 7, n=3) | |
| 1366x768 Medium Preset (sort by value) | |
| Dell Latitude 7490 | |
| HP Elitebook 1040 G4-2XU40UT | |
| Lenovo ThinkPad T580-20LAS01H00 | |
| Average Intel UHD Graphics 620 (11.5 - 20.3, n=13) | |
| 1024x768 Minimum Preset (sort by value) | |
| Dell Latitude 7490 | |
| HP Elitebook 1040 G4-2XU40UT | |
| Lenovo ThinkPad T580-20LAS01H00 | |
| Average Intel UHD Graphics 620 (27.8 - 54.4, n=13) | |
| Rocket League | |
| 1280x720 Performance (sort by value) | |
| Dell Latitude 7490 | |
| Average Intel UHD Graphics 620 (20.1 - 95, n=26) | |
| 1920x1080 Performance (sort by value) | |
| Dell Latitude 7490 | |
| Average Intel UHD Graphics 620 (17.1 - 78.4, n=13) | |
| 1920x1080 Quality AA:Medium FX (sort by value) | |
| Dell Latitude 7490 | |
| Average Intel UHD Graphics 620 (13.1 - 43, n=24) | |
| 1920x1080 High Quality AA:High FX (sort by value) | |
| Dell Latitude 7490 | |
| Asus Zephyrus M GM501 | |
| Average Intel UHD Graphics 620 (13.2 - 24.7, n=21) | |
| low | med. | high | ultra | |
| BioShock Infinite (2013) | 53 | 35 | 30 | 10 |
| Civilization VI (2016) | 33 | 15 | 6 | 5 |
| Rocket League (2017) | 50 | 32 | 20 |
Stress Test
Stress testing confirms the results observed in our Cinebench R15 testing. After running Prime95 for an hour, the CPU is able to boost to 4.2 GHz on two of its four cores, but this forces temperatures across the package to rise to 95° C or higher. Thus, the CPU throttles back to about 2.56 GHz in order to keep temperatures under control at about 78° C. FurMark is well managed; the iGPU can boost to 1150 MHz intermittently and settles at about 1000 MHz while temperatures remain reasonable at 83° C. The CPU boosts as needed during this test to 4.2 GHz and settles in at about 1.7 GHz. Running Prime95 and FurMark together creates a bit of trouble for the CPU. While each core can separately boost to 3.9 GHz, the system is throttled back to about 1.4 GHz for most of the test, likely to keep temperatures down. The GPU is able to boost as before, but it held back a bit to 850 MHz. Temperatures remain steady at 73° C with spikes up to 88° C. The spikes occur immediately after a CPU core enables its turbo boost.
While these synthetic tests show some throttling, they place a complete load on the system and aren't quite representative of normal workloads. Unigine Valley is a more realistic graphical rendering test, and the 7490 does well. Again, CPU cores can boost to their rated maximum of 4.2 GHz, but this causes temperatures to spike. Core temperatures approach Intel's suggested thermal limit of 100° C, but speeds are quickly pulled back to contain the heat. The iGPU performs well, averaging about 1,030 MHz, and the CPU can engage when needed, albeit for a short time lest temperatures remain too high for too long.

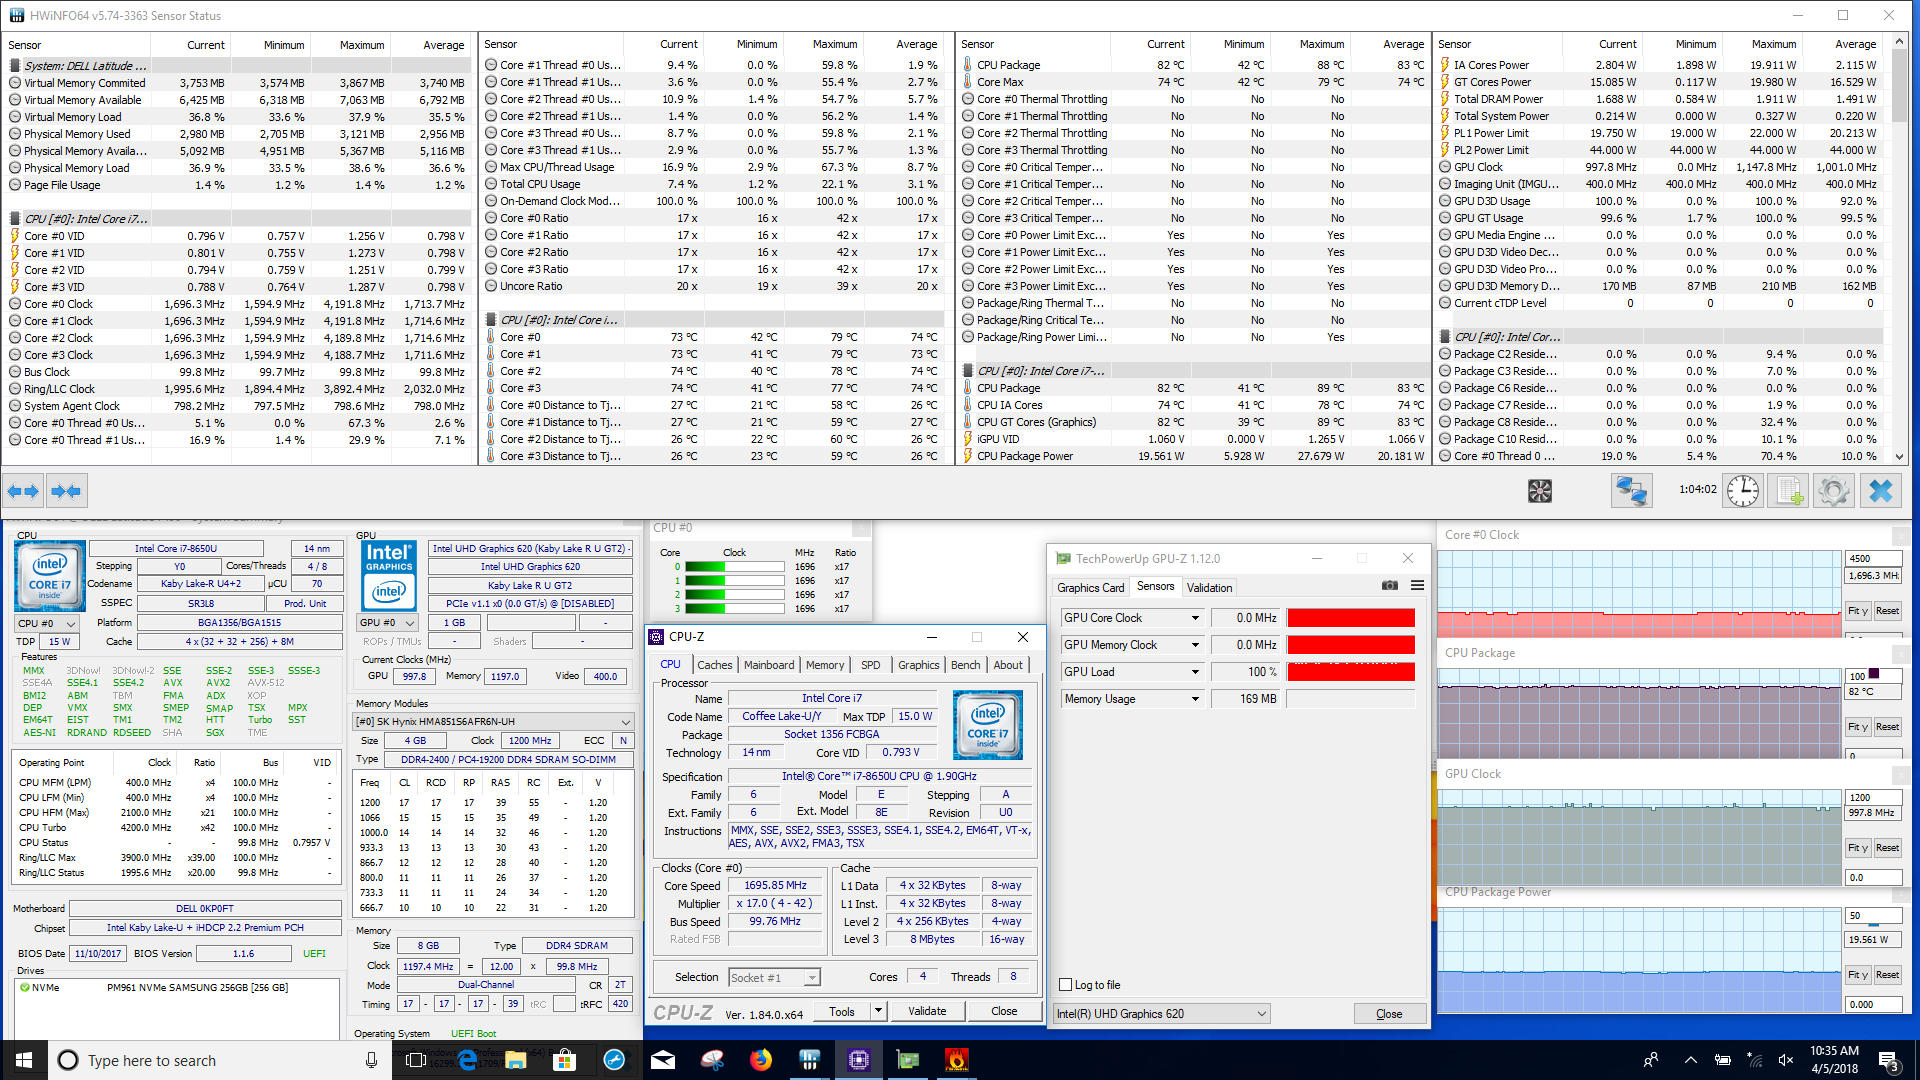


| CPU Clock (GHz) | GPU Clock (MHz) | Average CPU Temperature (°C) | Average GPU Temperature (°C) | |
| Prime95 Stress | 2.6 | - | 78 | - |
| FurMark Stress | 1.7 | 1001 | 83 | 83 |
| Prime95 + FurMark Stress | 1.45 | 866 | 76 | 76 |
| Unigine Valley | 1.8 | 1032 | 82 | 82 |
Emissions
System Noise
The single system fan is well-tuned and remains fairly quiet. When idle, the system is completely silent; the fan doesn't spin (or spins so slowly it remains undetected). Under load, the fan averages about 32 dB(A), which sits at about the level of ambient noise in an office. Even under extreme loads, such as when the CPU is fully engaged, fans spike at only 41 dB(A). This is audible above normal room noise, but the level pitch of the fan makes for a humming whir rather than a high-pitched whine. The fan will be heard but shouldn't grate on the ears. Thankfully, the coil whine that plagued the Latitude 7480 is absent in this year's model.
Noise Level
| Idle |
| 28.2 / 28.2 / 31.4 dB(A) |
| Load |
| 31.7 / 41.2 dB(A) |
 | ||
30 dB silent 40 dB(A) audible 50 dB(A) loud |
||
min: | ||
| Dell Latitude 7490 UHD Graphics 620, i7-8650U, Samsung PM961 MZVLW256HEHP | Dell Latitude 7480 HD Graphics 620, i7-7600U, Intel SSDSCKKF256H6 | Lenovo ThinkPad T480-20L6S01V00 GeForce MX150, i5-8550U, Samsung SSD PM981 MZVLB512HAJQ | Lenovo ThinkPad T480s-20L8S02E00 GeForce MX150, i5-8550U, Samsung SSD PM981 MZVLB512HAJQ | Lenovo ThinkPad X1 Carbon 2018-20KGS03900 UHD Graphics 620, i5-8550U, Samsung SSD PM981 MZVLB512HAJQ | Toshiba Tecra X40-D HD Graphics 620, i7-7600U, Samsung PM961 MZVLW256HEHP | Asus ASUSPRO B9440UA-GV0100T HD Graphics 620, i5-7200U, Micron SSD 1100 (MTFDDAV256TBN) | HP Elitebook 1040 G4-2XU40UT HD Graphics 630, i7-7820HQ, Toshiba XG4 NVMe (THNSN5512GPUK) | |
|---|---|---|---|---|---|---|---|---|
| Noise | 7% | 0% | -2% | -1% | 2% | -3% | 3% | |
| off / environment * | 28.2 | 29 -3% | 29 -3% | 28.9 -2% | 28 1% | 29 -3% | 28.2 -0% | |
| Idle Minimum * | 28.2 | 28.6 -1% | 29 -3% | 29 -3% | 28.9 -2% | 28 1% | 29 -3% | 28.2 -0% |
| Idle Average * | 28.2 | 28.6 -1% | 29 -3% | 29 -3% | 28.9 -2% | 28 1% | 29 -3% | 28.2 -0% |
| Idle Maximum * | 31.4 | 28.6 9% | 29 8% | 29 8% | 32.5 -4% | 28.2 10% | 29 8% | 28.2 10% |
| Load Average * | 31.7 | 30.2 5% | 35.6 -12% | 36.5 -15% | 35.1 -11% | 33.2 -5% | 36.7 -16% | 33.3 -5% |
| Load Maximum * | 41.2 | 31.2 24% | 35.6 14% | 38.2 7% | 35.1 15% | 39.9 3% | 40.2 2% | 35.3 14% |
| Witcher 3 ultra * | 32.5 | 32.8 |
* ... smaller is better
Temperature
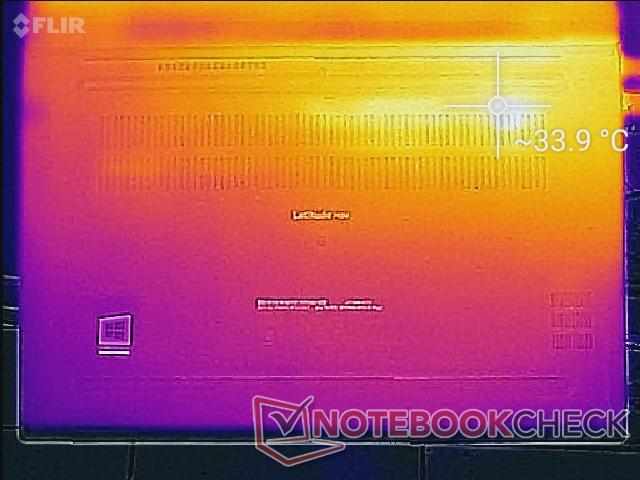
External temperatures are fairly well-managed. When the system is under light load, the chassis barely exceeds room temperature. Under load, the unit remains comfortable for the most part. The keyboard is still usable, but the left side (which is situated over both the CPU and NVMe drive) feels warm to the touch. The main pain point lies on the bottom panel near the center of the hinge, which is where the sole small exhaust vent lies. Temperatures here can climb into the mid-50s centigrade and can cause an uncomfortably warm lap. As such, heavy workloads should be done at a desk.
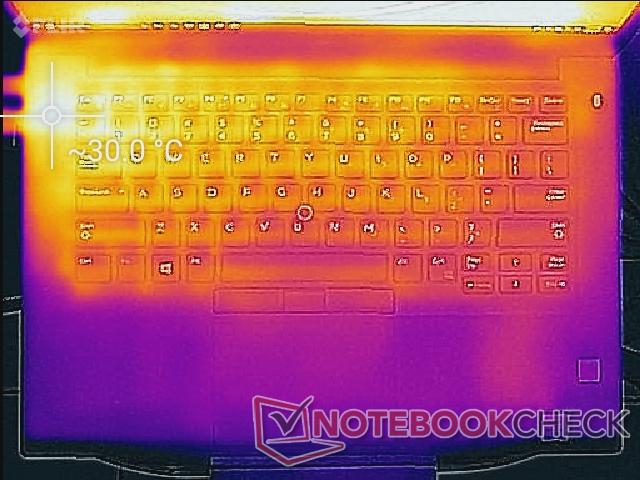
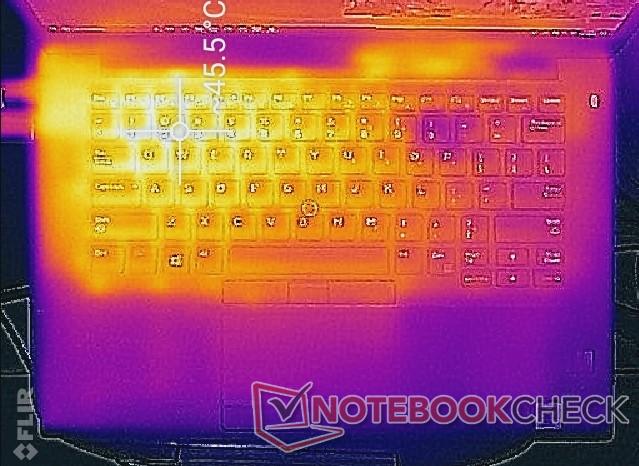

(±) The maximum temperature on the upper side is 45 °C / 113 F, compared to the average of 34.2 °C / 94 F, ranging from 21.2 to 62.5 °C for the class Office.
(-) The bottom heats up to a maximum of 56 °C / 133 F, compared to the average of 36.7 °C / 98 F
(+) In idle usage, the average temperature for the upper side is 25.2 °C / 77 F, compared to the device average of 29.5 °C / 85 F.
(+) The palmrests and touchpad are cooler than skin temperature with a maximum of 28 °C / 82.4 F and are therefore cool to the touch.
(±) The average temperature of the palmrest area of similar devices was 27.7 °C / 81.9 F (-0.3 °C / -0.5 F).
Speakers


The speakers are similar to other premium business notebooks, particularly the Lenovo ThinkPad T480s. The sound profile favors higher registers, which makes the Latitude 7490 well-suited for conference calls and speech. Bass is present but very shallow; percussion will sound more akin to a slap than a full-bodied thump. Mids and highs are full, and the down-firing stereo speakers along the front edge can get fairly loud at about 74 dB. We notice some chassis rattle in particularly heavy music when the speakers are turned all the way up. There is a single combo audio port for connecting headphones or headsets.
Dell includes the WAVES MaxxAudio Pro software with the Latitude 7490. This software allows users to tune the EQ of the speakers or attached headphones and can be used to tweak the microphone for video calls or audio recordings.
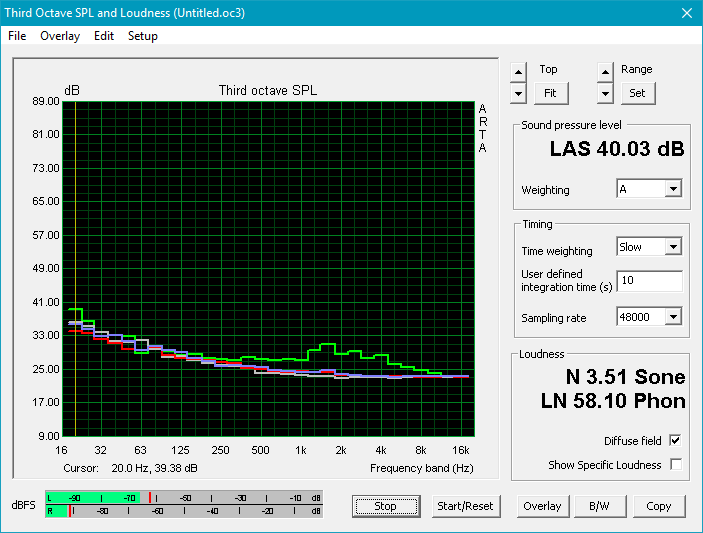
Dell Latitude 7490 audio analysis
(±) | speaker loudness is average but good (73.8 dB)
Bass 100 - 315 Hz
(±) | reduced bass - on average 14.8% lower than median
(±) | linearity of bass is average (9.4% delta to prev. frequency)
Mids 400 - 2000 Hz
(+) | balanced mids - only 4.4% away from median
(±) | linearity of mids is average (8% delta to prev. frequency)
Highs 2 - 16 kHz
(+) | balanced highs - only 4.4% away from median
(±) | linearity of highs is average (8.2% delta to prev. frequency)
Overall 100 - 16.000 Hz
(±) | linearity of overall sound is average (19.9% difference to median)
Compared to same class
» 36% of all tested devices in this class were better, 9% similar, 55% worse
» The best had a delta of 7%, average was 22%, worst was 53%
Compared to all devices tested
» 46% of all tested devices were better, 7% similar, 47% worse
» The best had a delta of 4%, average was 25%, worst was 134%
Lenovo ThinkPad T480s-20L8S02E00 audio analysis
(±) | speaker loudness is average but good (78.9 dB)
Bass 100 - 315 Hz
(-) | nearly no bass - on average 19.4% lower than median
(±) | linearity of bass is average (12.1% delta to prev. frequency)
Mids 400 - 2000 Hz
(±) | higher mids - on average 6.5% higher than median
(±) | linearity of mids is average (9.6% delta to prev. frequency)
Highs 2 - 16 kHz
(+) | balanced highs - only 3.5% away from median
(±) | linearity of highs is average (7.6% delta to prev. frequency)
Overall 100 - 16.000 Hz
(±) | linearity of overall sound is average (22.1% difference to median)
Compared to same class
» 53% of all tested devices in this class were better, 10% similar, 38% worse
» The best had a delta of 7%, average was 22%, worst was 53%
Compared to all devices tested
» 59% of all tested devices were better, 7% similar, 34% worse
» The best had a delta of 4%, average was 25%, worst was 134%
Energy Management
Power Consumption

Power draw is excellent. When idle, the system pulls about 6.5 Watts from the wall, which is a full Watt less than the T480s and almost 2.5 less than the X1 Carbon. Under load, the 7490 draws about 43 Watts, which is a significant bump (almost 50%) over the older Latitude 7480. This might be due to possible throttling of the 7480's CPU. Compared to the ThinkPad T480 and T480s, however, the Latitude 7490 pulls about 50% less. The ThinkPads likely draw more Wattage to power their dedicated MX150 GPUs. Power draw under load is about even with the similarly-specced X1 Carbon.
| Off / Standby | |
| Idle | |
| Load |
|
| Dell Latitude 7490 i7-8650U, UHD Graphics 620, Samsung PM961 MZVLW256HEHP, IPS, 1920x1080, 14.00 | Dell Latitude 7480 i7-7600U, HD Graphics 620, Intel SSDSCKKF256H6, IPS, 1920x1080, 14.00 | Lenovo ThinkPad T480-20L6S01V00 i5-8550U, GeForce MX150, Samsung SSD PM981 MZVLB512HAJQ, IPS, 1920x1080, 14.00 | Lenovo ThinkPad T480s-20L8S02E00 i5-8550U, GeForce MX150, Samsung SSD PM981 MZVLB512HAJQ, IPS LED, 2560x1440, 14.00 | Lenovo ThinkPad X1 Carbon 2018-20KGS03900 i5-8550U, UHD Graphics 620, Samsung SSD PM981 MZVLB512HAJQ, IPS, 2560x1440, 14.00 | Toshiba Tecra X40-D i7-7600U, HD Graphics 620, Samsung PM961 MZVLW256HEHP, IPS, 1920x1080, 14.00 | Asus ASUSPRO B9440UA-GV0100T i5-7200U, HD Graphics 620, Micron SSD 1100 (MTFDDAV256TBN), IPS, 1920x1080, 14.00 | HP Elitebook 1040 G4-2XU40UT i7-7820HQ, HD Graphics 630, Toshiba XG4 NVMe (THNSN5512GPUK), IPS, 1920x1080, 14.00 | |
|---|---|---|---|---|---|---|---|---|
| Power Consumption | 8% | -31% | -31% | -29% | 2% | 11% | -31% | |
| Idle Minimum * | 3.1 | 4.32 -39% | 3.6 -16% | 3.4 -10% | 3.8 -23% | 5.2 -68% | 3.1 -0% | 5.1 -65% |
| Idle Average * | 6.5 | 6.27 4% | 7.1 -9% | 7.5 -15% | 8.9 -37% | 6.9 -6% | 6.1 6% | 7 -8% |
| Idle Maximum * | 7.6 | 6.35 16% | 9.5 -25% | 10.8 -42% | 11.9 -57% | 7 8% | 6.8 11% | 11.7 -54% |
| Load Average * | 43 | 29.82 31% | 63.9 -49% | 55.4 -29% | 47.5 -10% | 24.6 43% | 27.4 36% | 41.2 4% |
| Load Maximum * | 43.8 | 30.64 30% | 67.3 -54% | 70.3 -61% | 52.5 -20% | 30.1 31% | 43.7 -0% | 56.9 -30% |
| Witcher 3 ultra * | 53.9 | 34 |
* ... smaller is better
Battery Life
Battery life is excellent. Under the best conditions (airplane mode, minimum brightness, extremely light work), the Latitude 7490 lasts a respectable 18 hours 36 minutes. Under more standard conditions, like those of our WiFi v1.3 battery test, the 7490 still manages an all-day run of over 9 hours. This should be more than enough to get most users through a workday. However, these numbers are a far cry below the Latitude 7480, which lasted almost 12 hours in our WiFi v1.3 test. Road warriors will also want to look at the ThinkPad T480, which managed to last over 13 hours in this test. The T480 also has a hot-swappable external battery, which allows for an even longer time away from the outlet. The battery takes about 1 hour 45 minutes to fully charge.
| Dell Latitude 7490 i7-8650U, UHD Graphics 620, 60 Wh | Dell Latitude 7480 i7-7600U, HD Graphics 620, 60 Wh | Lenovo ThinkPad T480-20L6S01V00 i5-8550U, GeForce MX150, 72 Wh | Lenovo ThinkPad T480s-20L8S02E00 i5-8550U, GeForce MX150, 57 Wh | Lenovo ThinkPad X1 Carbon 2018-20KGS03900 i5-8550U, UHD Graphics 620, 57 Wh | Toshiba Tecra X40-D i7-7600U, HD Graphics 620, 48 Wh | Asus ASUSPRO B9440UA-GV0100T i5-7200U, HD Graphics 620, 48 Wh | HP Elitebook 1040 G4-2XU40UT i7-7820HQ, HD Graphics 630, 67 Wh | |
|---|---|---|---|---|---|---|---|---|
| Battery Runtime | 55% | 56% | 0% | 9% | -7% | 12% | 15% | |
| Reader / Idle | 1116 | 1662 49% | 1671 50% | 1366 22% | 1328 19% | 876 -22% | 1137 2% | 1349 21% |
| WiFi v1.3 | 561 | 719 28% | 794 42% | 530 -6% | 519 -7% | 357 -36% | 531 -5% | 665 19% |
| Load | 91 | 171 88% | 159 75% | 76 -16% | 106 16% | 126 38% | 126 38% | 96 5% |
Pros
Cons
Verdict
Dell has done an excellent job with the Latitude 7490, but mainly because they did any excellent job with the 7480. Almost everything is simply a carry-over from last year's model. The biggest strength the Latitude 7490 has over the 7480 is the inclusion of Intel's quad-core 8th generation CPUs. Despite maintaining the same 15 W TDP as previous U-series processors, Kaby Lake R CPUs almost double the performance of their respective 7th gen counterparts. The Latitude 7490 is a good example of the gains in application performance to be had by the bump to Kaby Lake R, but it is also an example of some of the sacrifices the new chips make. Thermal throttling is a major issue here. Under heavy loads, the CPU is able to boost to its full potential, but only for brief moments.
We will be frank: if you already own a Latitude 7480, you can overlook the 7490. The additional CPU performance will only be seen in processor-intensive tasks; unless your workflow includes heavy spreadsheet use or other CPU-heavy work, the processor upgrade isn't worth the cost of a new machine. However, if you're looking to purchase a new business laptop or need to replace a machine that is a few years old at this point, the Latitude 7490 should absolutely be considered. Dell has crafted an excellent machine that rivals the other champions of the industry.
Dell Latitude 7490
-
04/08/2018 v6(old)
Sam Medley
Pricecompare
