Apple MacBook Pro 16 2023 Review - M2 Max challenges GeForce RTX 3080 Ti
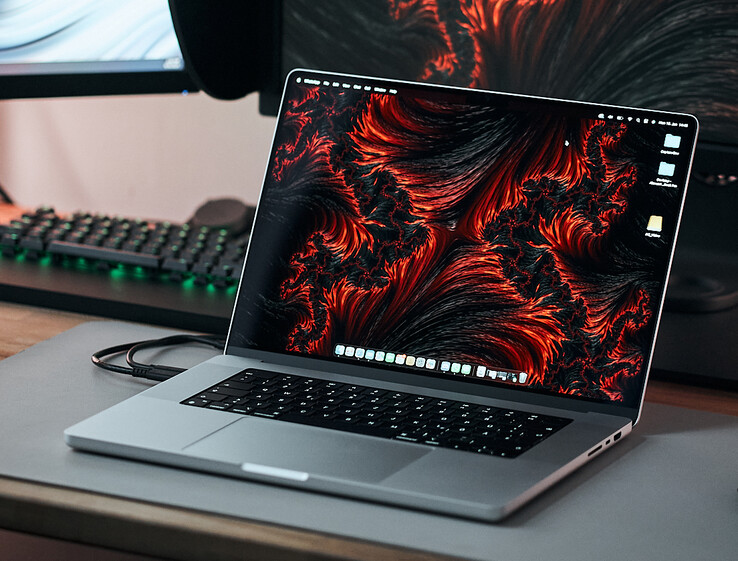
We have already reviewed the new MacBook Pro 14 with the new M2 Pro SoC and now we have a closer look at the larger MacBook Pro 16. You can get it with the same M2 Pro as well as the M2 Max, but we know from the previous generation that only the larger MBP 16 could utilize the full potential of the M1 Max, and Apple promises even more performance for the new M2 Max. We review the high-end model of the new MBP 16 with the M2 Max (38 GPU cores), 64 GB RAM, and 2 TB SSD storage. The price is high at 5069 Euros and the M2 Max in the MBP 16 costs at least 3919 Euros (with 32 GB RAM, 512 GB SSD storage). If you tick all the boxes (M2 Max, 96 GB RAM, 8 TB SSD storage), Apple will charge 7599 Euros. The design of the chassis did not change compared to the 2021 model, so we will keep it short in some sections. Please also see our previous reviews for more information:
Potential Rivals
Rating | Date | Model | Weight | Height | Size | Resolution | Price |
|---|---|---|---|---|---|---|---|
| 93.7 % v7 (old) | 03 / 2023 | Apple MacBook Pro 16 2023 M2 Max M2 Max, M2 Max 38-Core GPU | 2.2 kg | 16.8 mm | 16.20" | 3456x2234 | |
| 92.5 % v7 (old) | 11 / 2021 | Apple MacBook Pro 16 2021 M1 Max M1 Max, M1 Max 32-Core GPU | 2.2 kg | 16.8 mm | 16.20" | 3456x2234 | |
| 88.7 % v7 (old) | 12 / 2022 | Lenovo ThinkPad X1 Extreme G5-21DE003RGE i7-12700H, GeForce RTX 3060 Laptop GPU | 2.1 kg | 17.9 mm | 16.00" | 3840x2400 | |
| 88.4 % v7 (old) | 12 / 2022 | Asus ZenBook Pro 16X OLED UX7602ZM-ME115W i9-12900H, GeForce RTX 3060 Laptop GPU | 2.4 kg | 19.5 mm | 16.00" | 3840x2400 | |
| 87.8 % v7 (old) | 11 / 2022 | Schenker Vision 16 Pro RTX 3070 Ti i7-12700H, GeForce RTX 3070 Ti Laptop GPU | 1.7 kg | 17.1 mm | 16.00" | 2560x1600 | |
| 89.1 % v7 (old) | 12 / 2022 | Dell Precision 7000 7670 Performance i9-12950HX, RTX A5500 Laptop GPU | 2.8 kg | 25.95 mm | 16.00" | 3840x2400 |
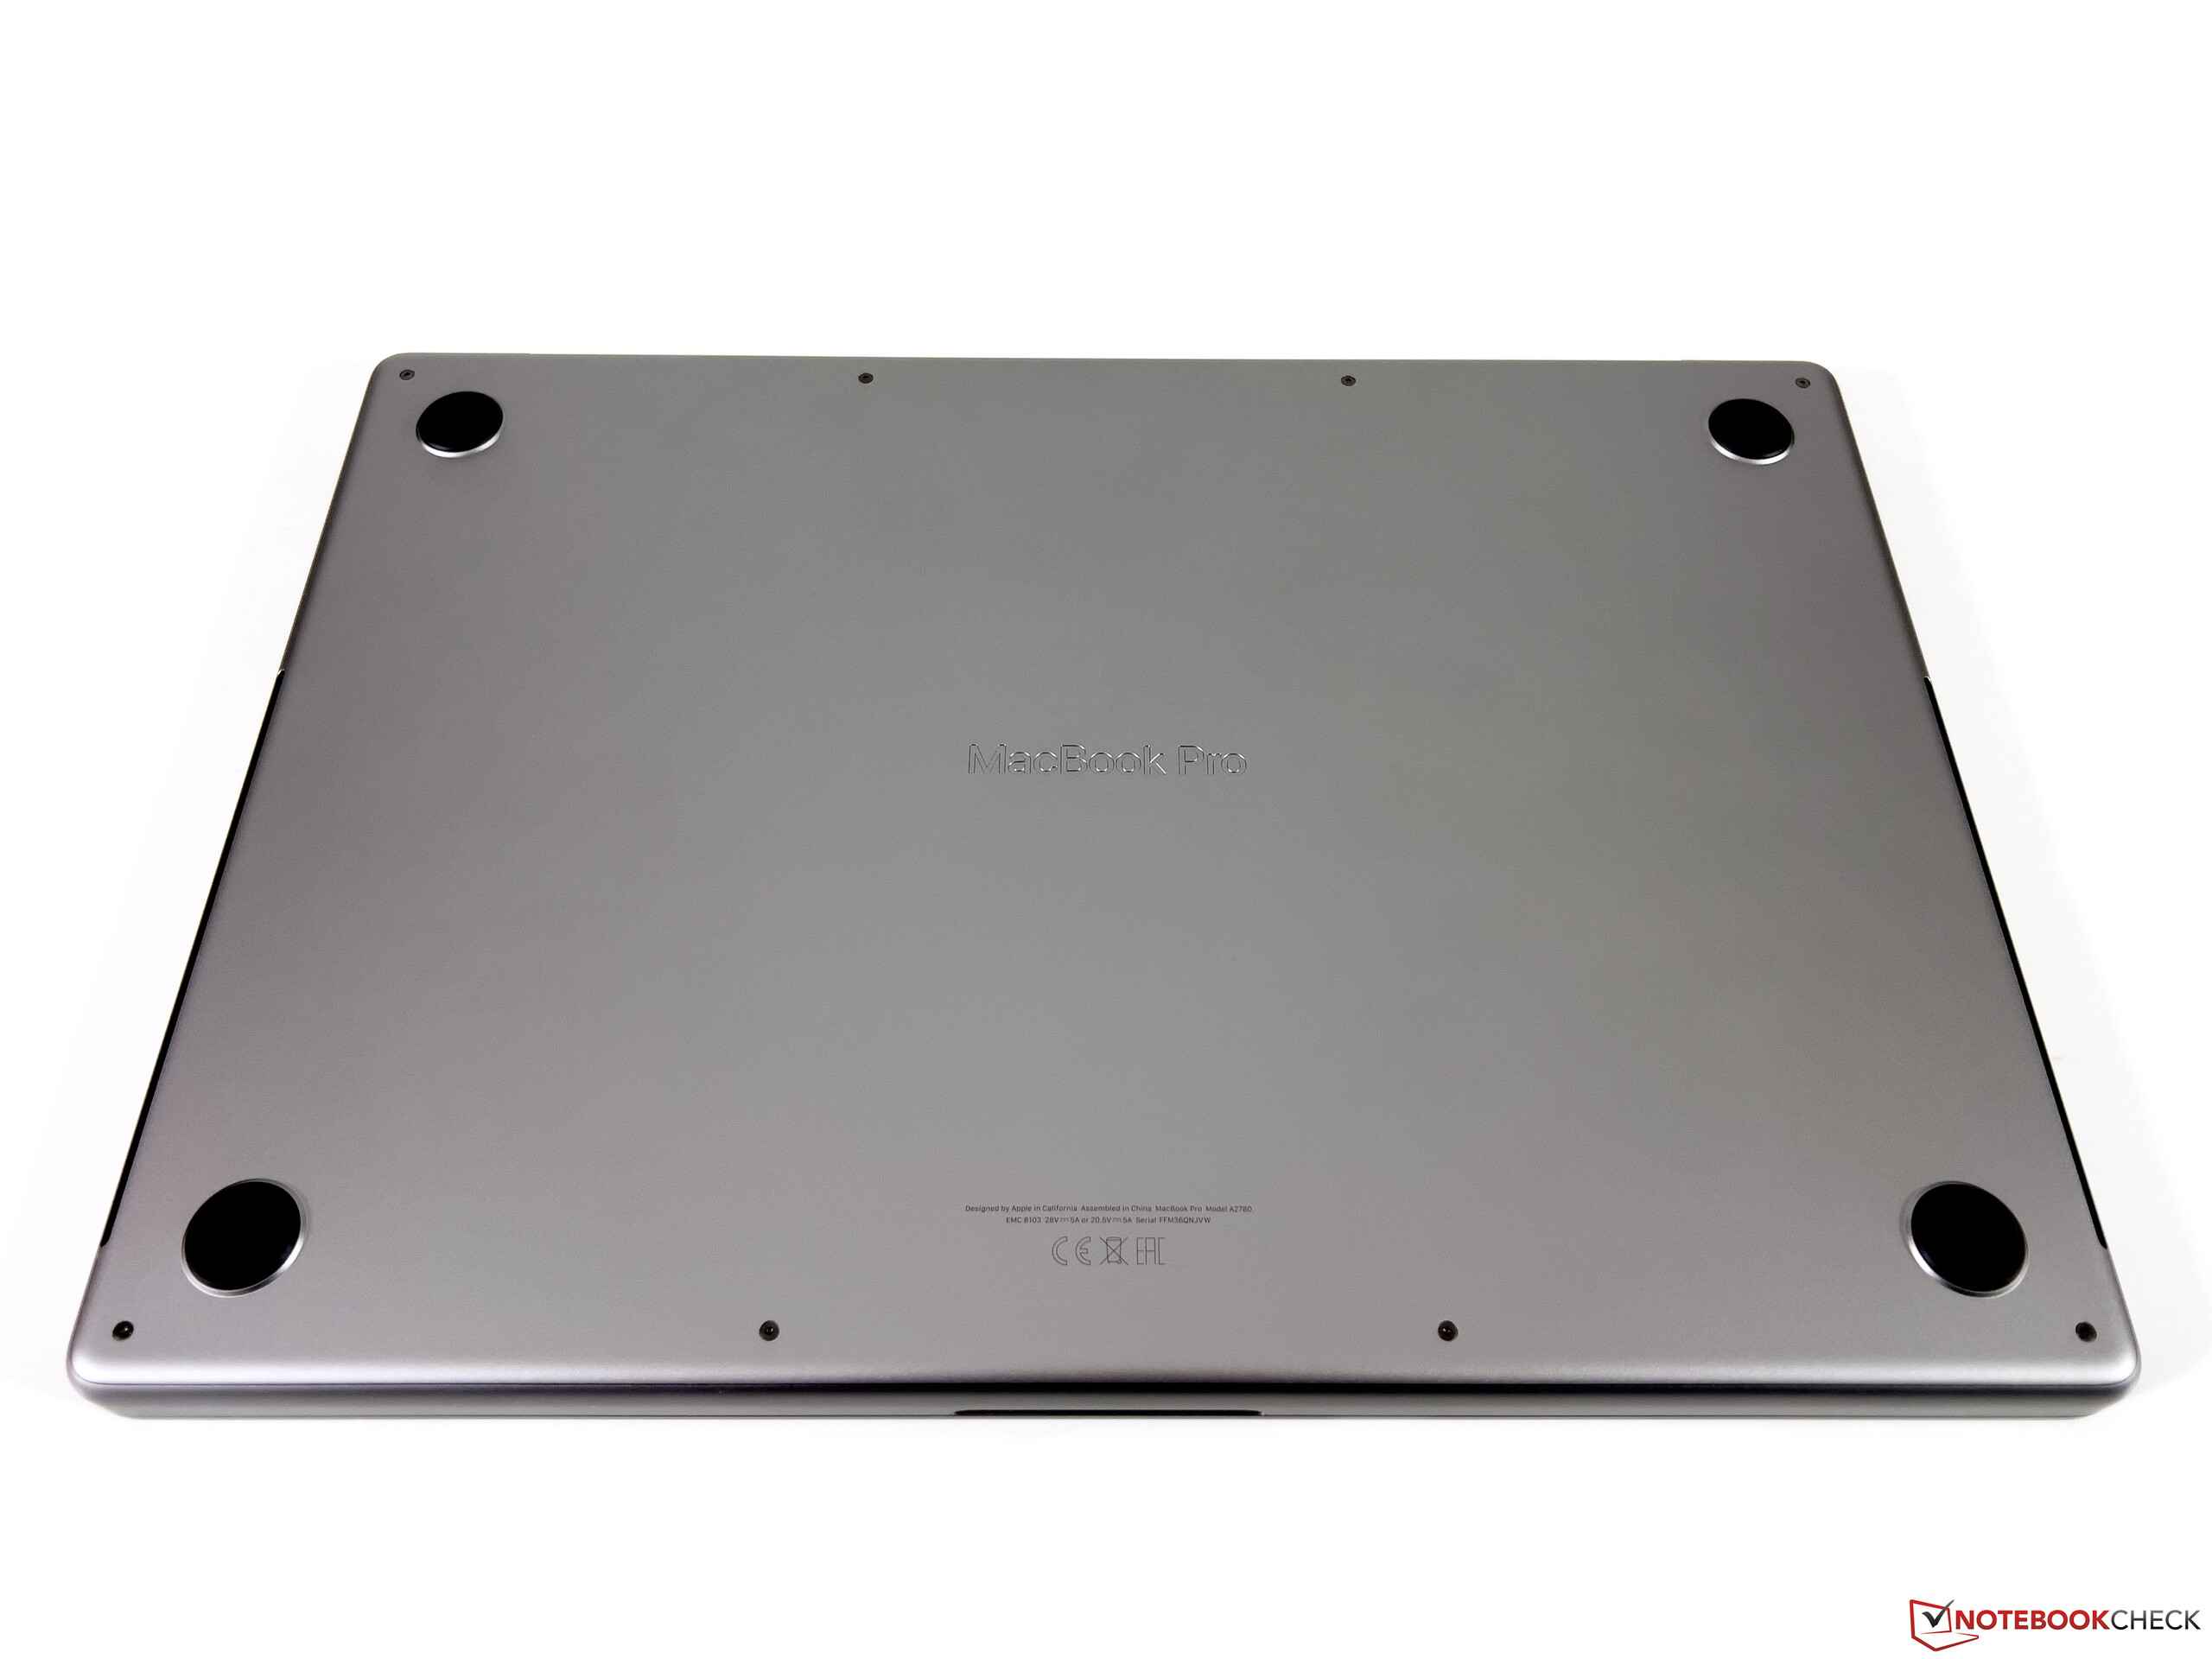
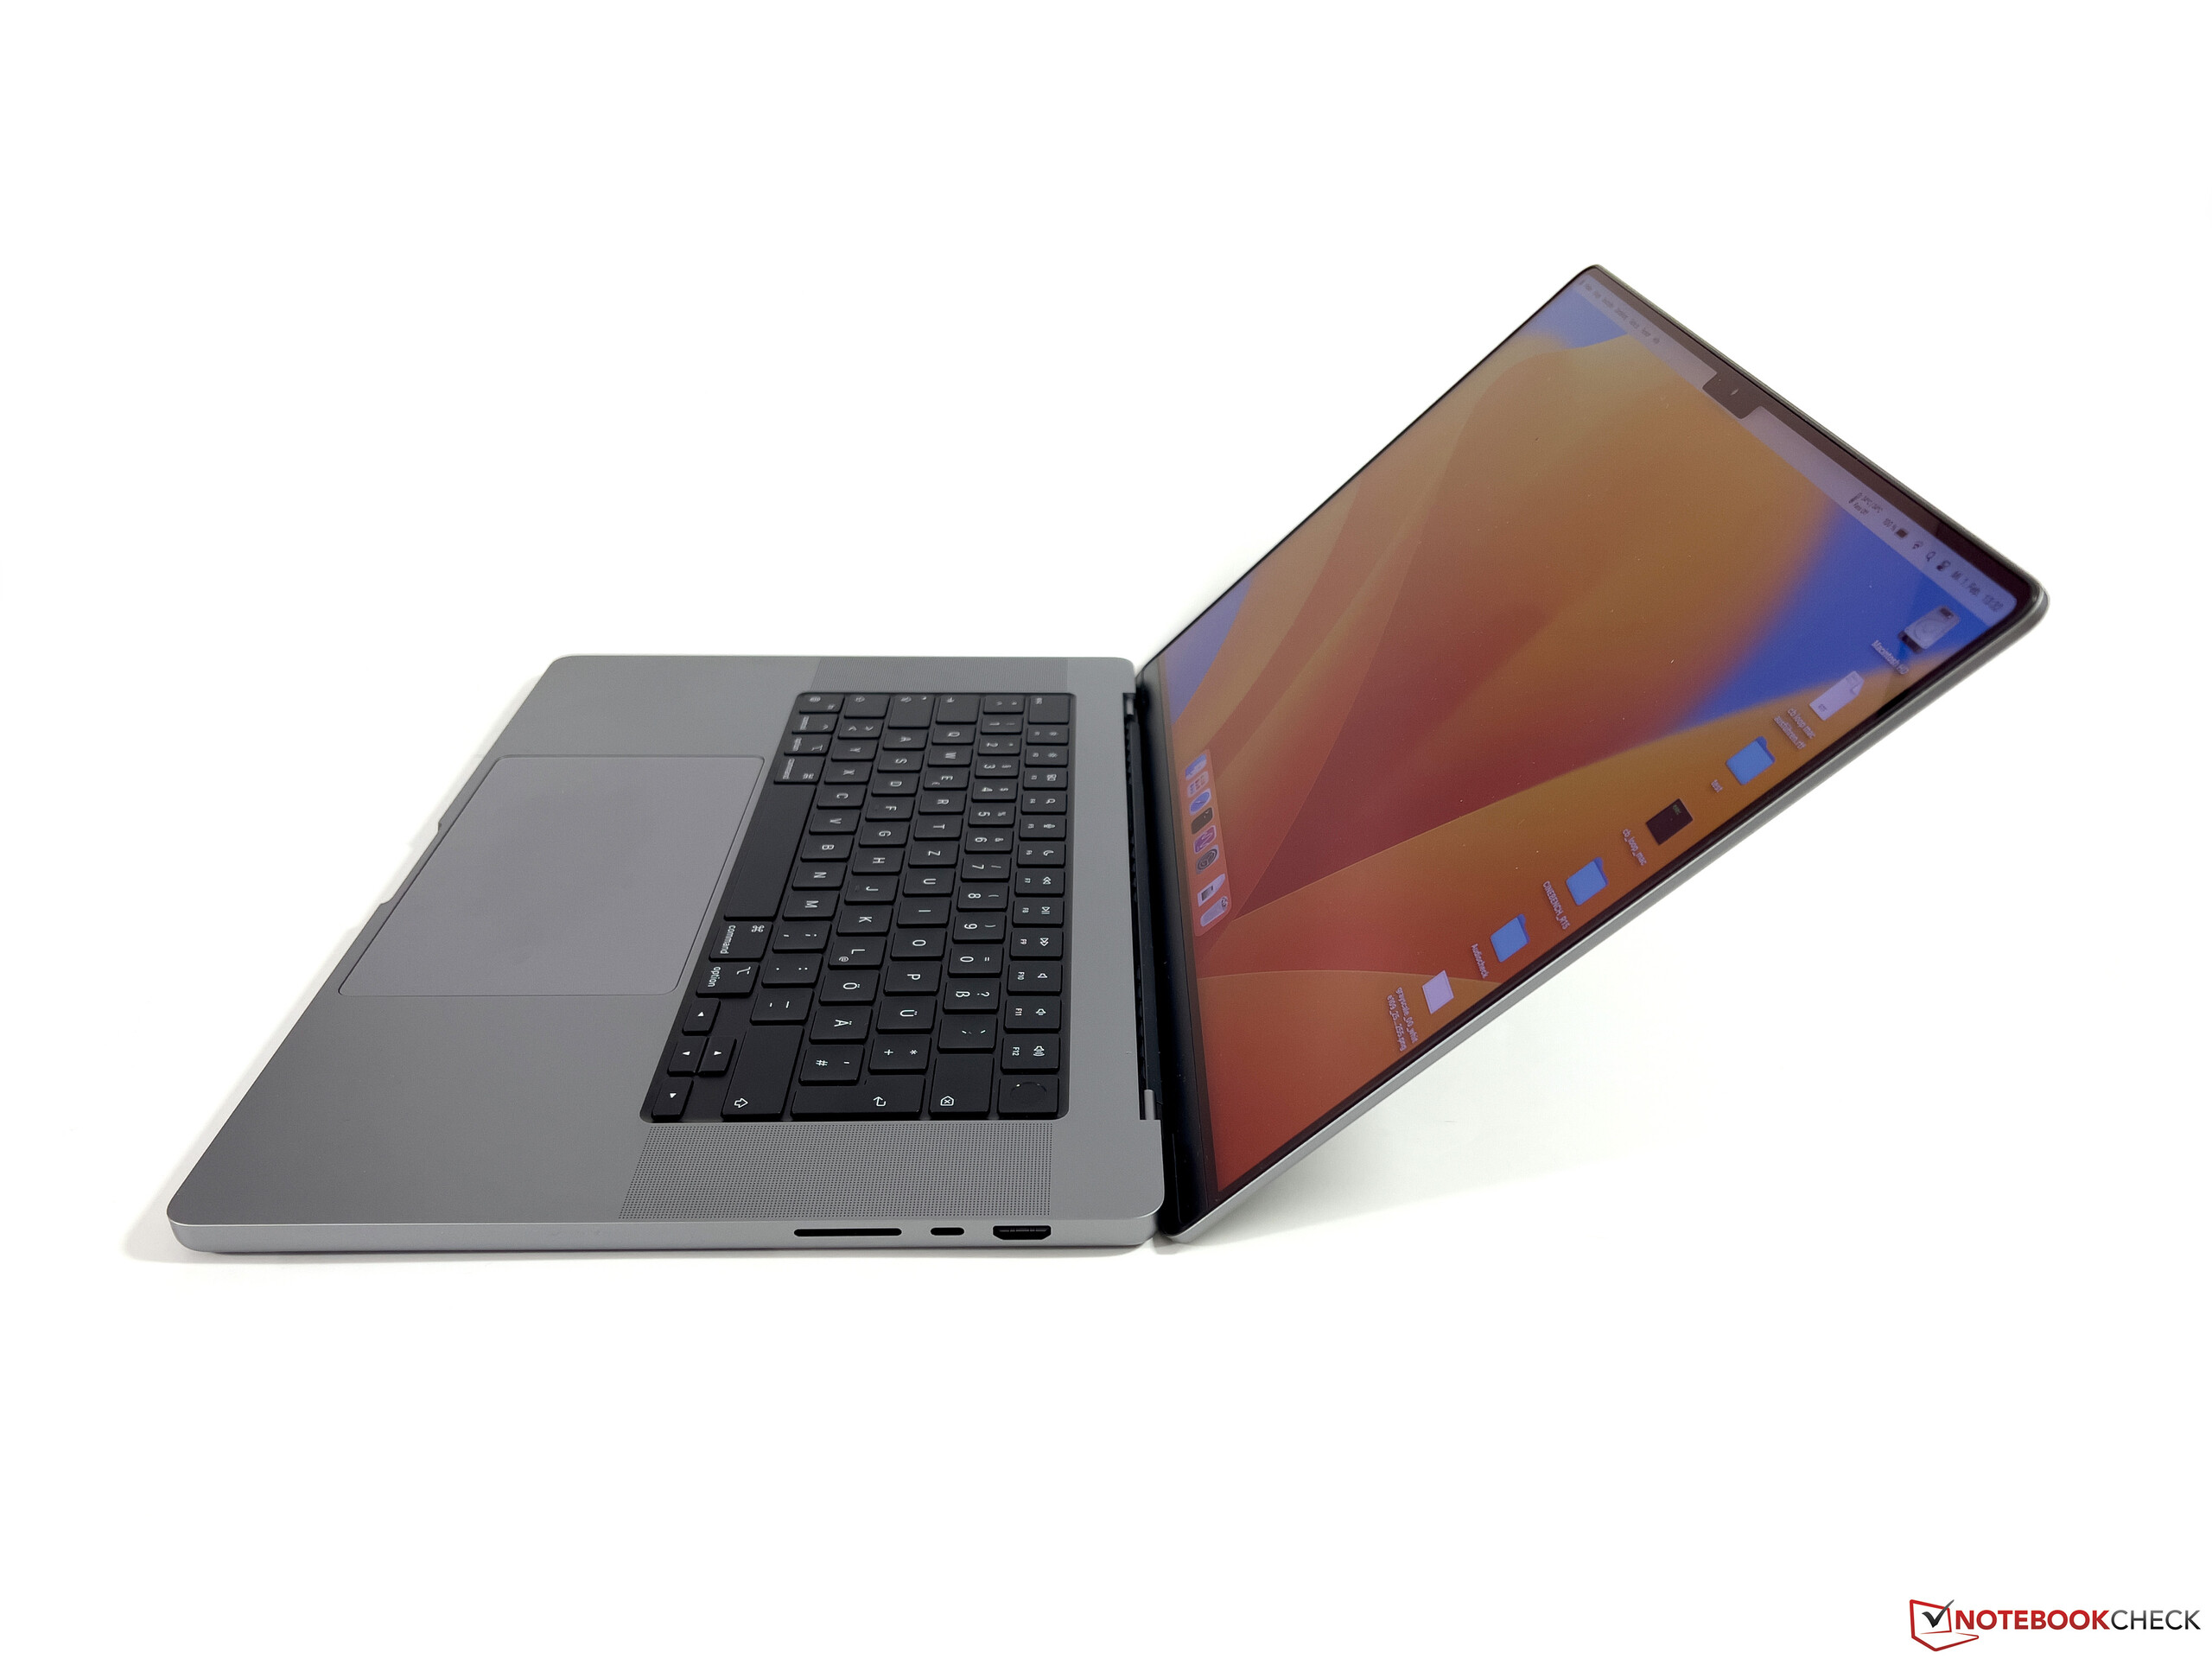
Case - MBP without changes
Just like in our review of the new MacBook Pro 14 2023, we can keep it very short here, because the new MacBook Pro 16 still uses the same chassis as before. The base unit still appears to be very bulky due to its design, but the overall proportions are balanced on the 16-inch model. There is nothing to complain about in terms of build quality or stability. The colors are still silver or space grey and the surfaces are not very prone to fingerprints or dirt.
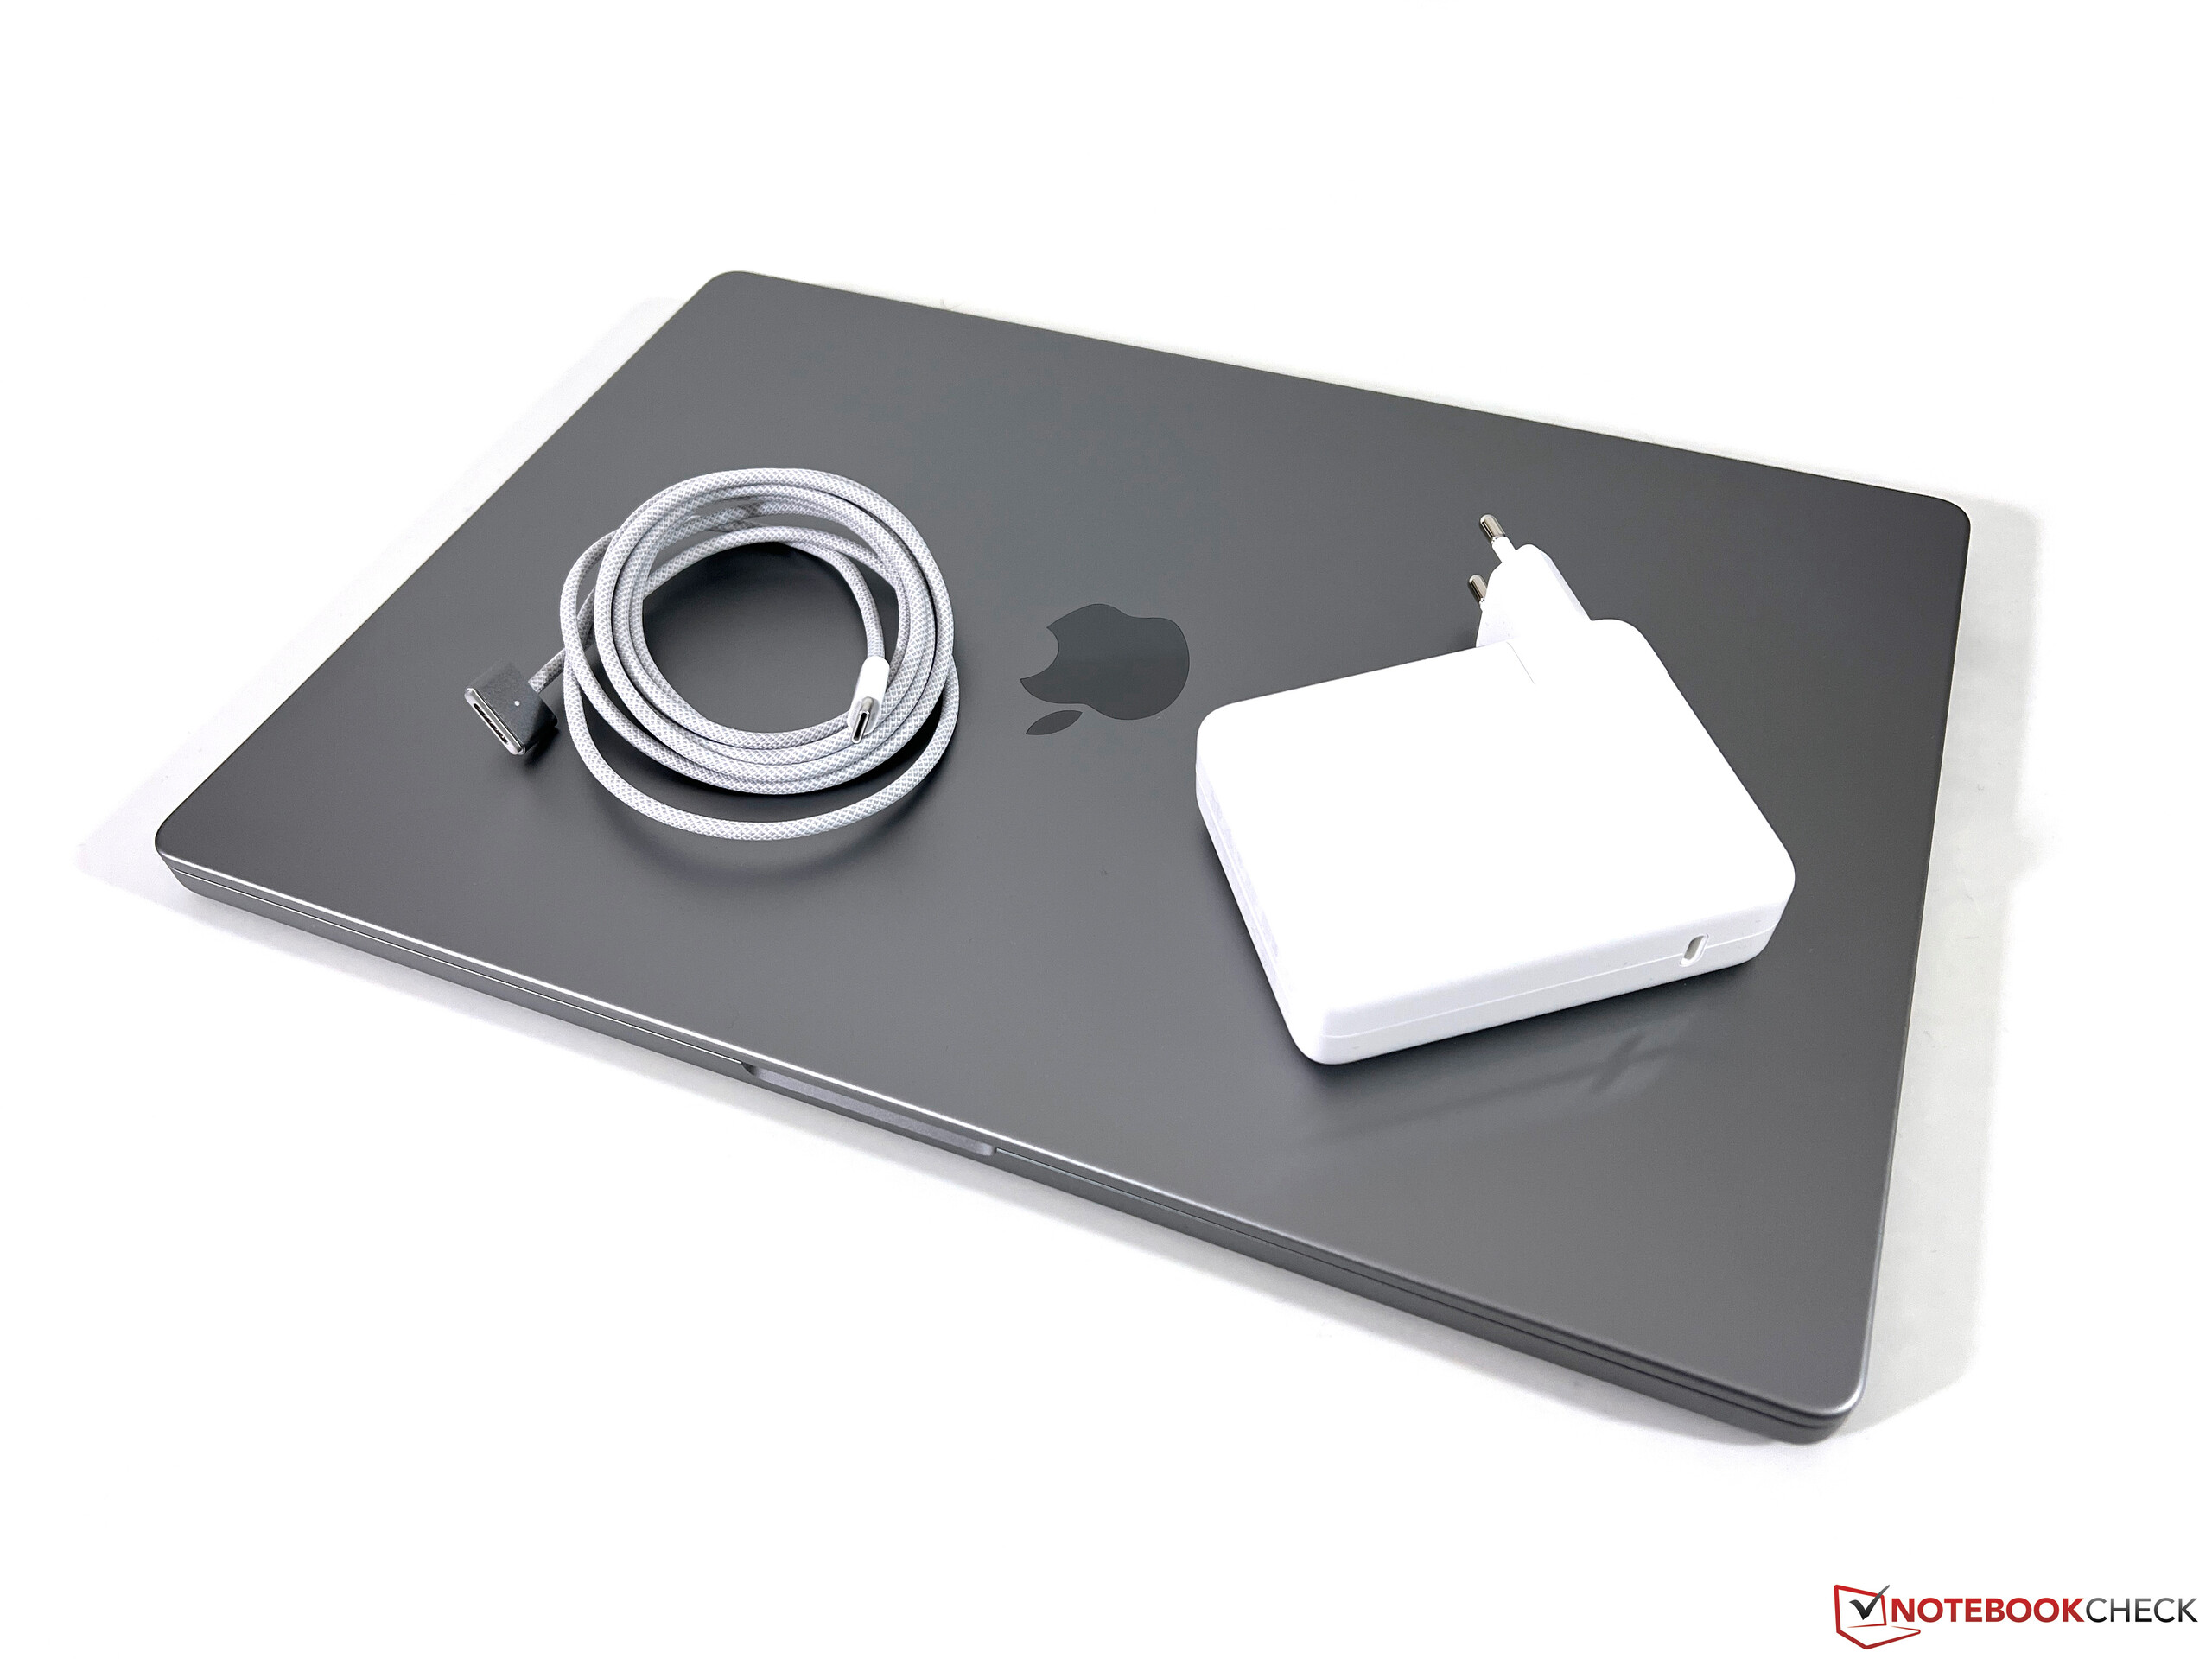
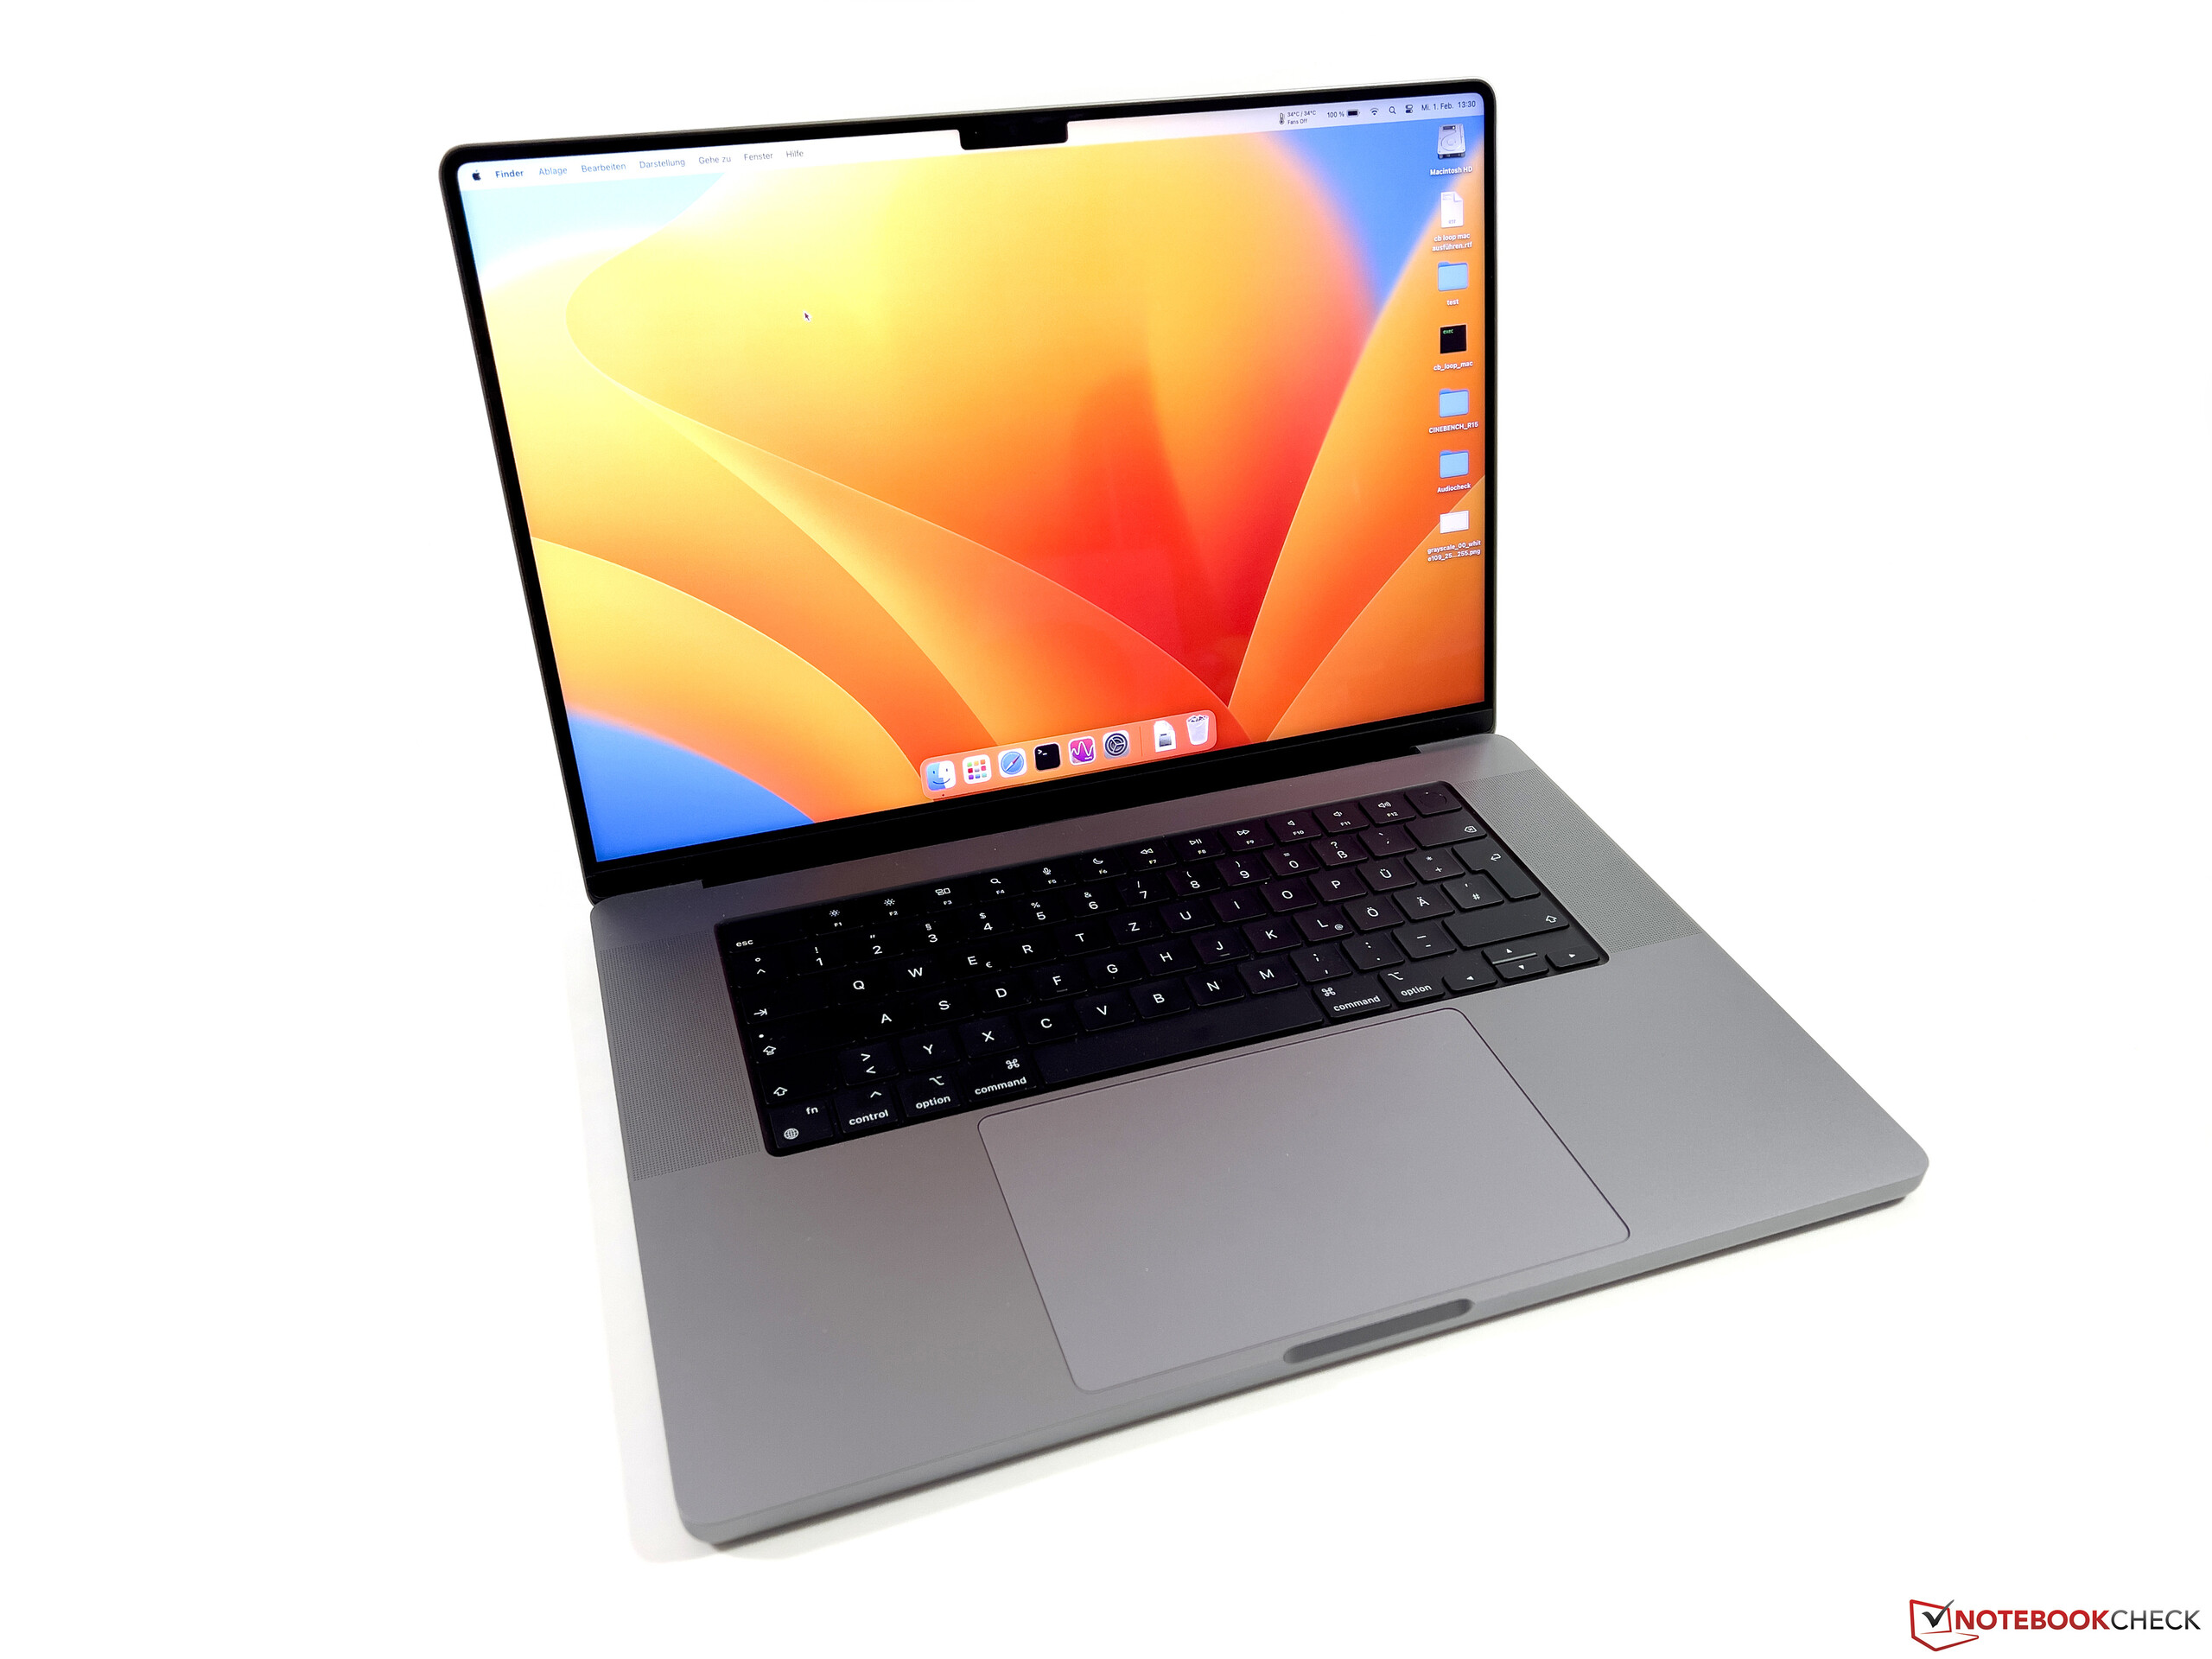
The MBP 16 might look pretty bulky at first, but it is actually the thinnest device in our comparison group at 16.8 mm. The weight of ~2.2 kg is also in line, only the Schenker Vision 16 Pro is noticeably lighter at 1.7 kg, while the mobile workstation Dell Precision 7670 is much heavier at 2.8 kg. The 140W power adapter tips the scale at 345 grams including the MagSafe cable.
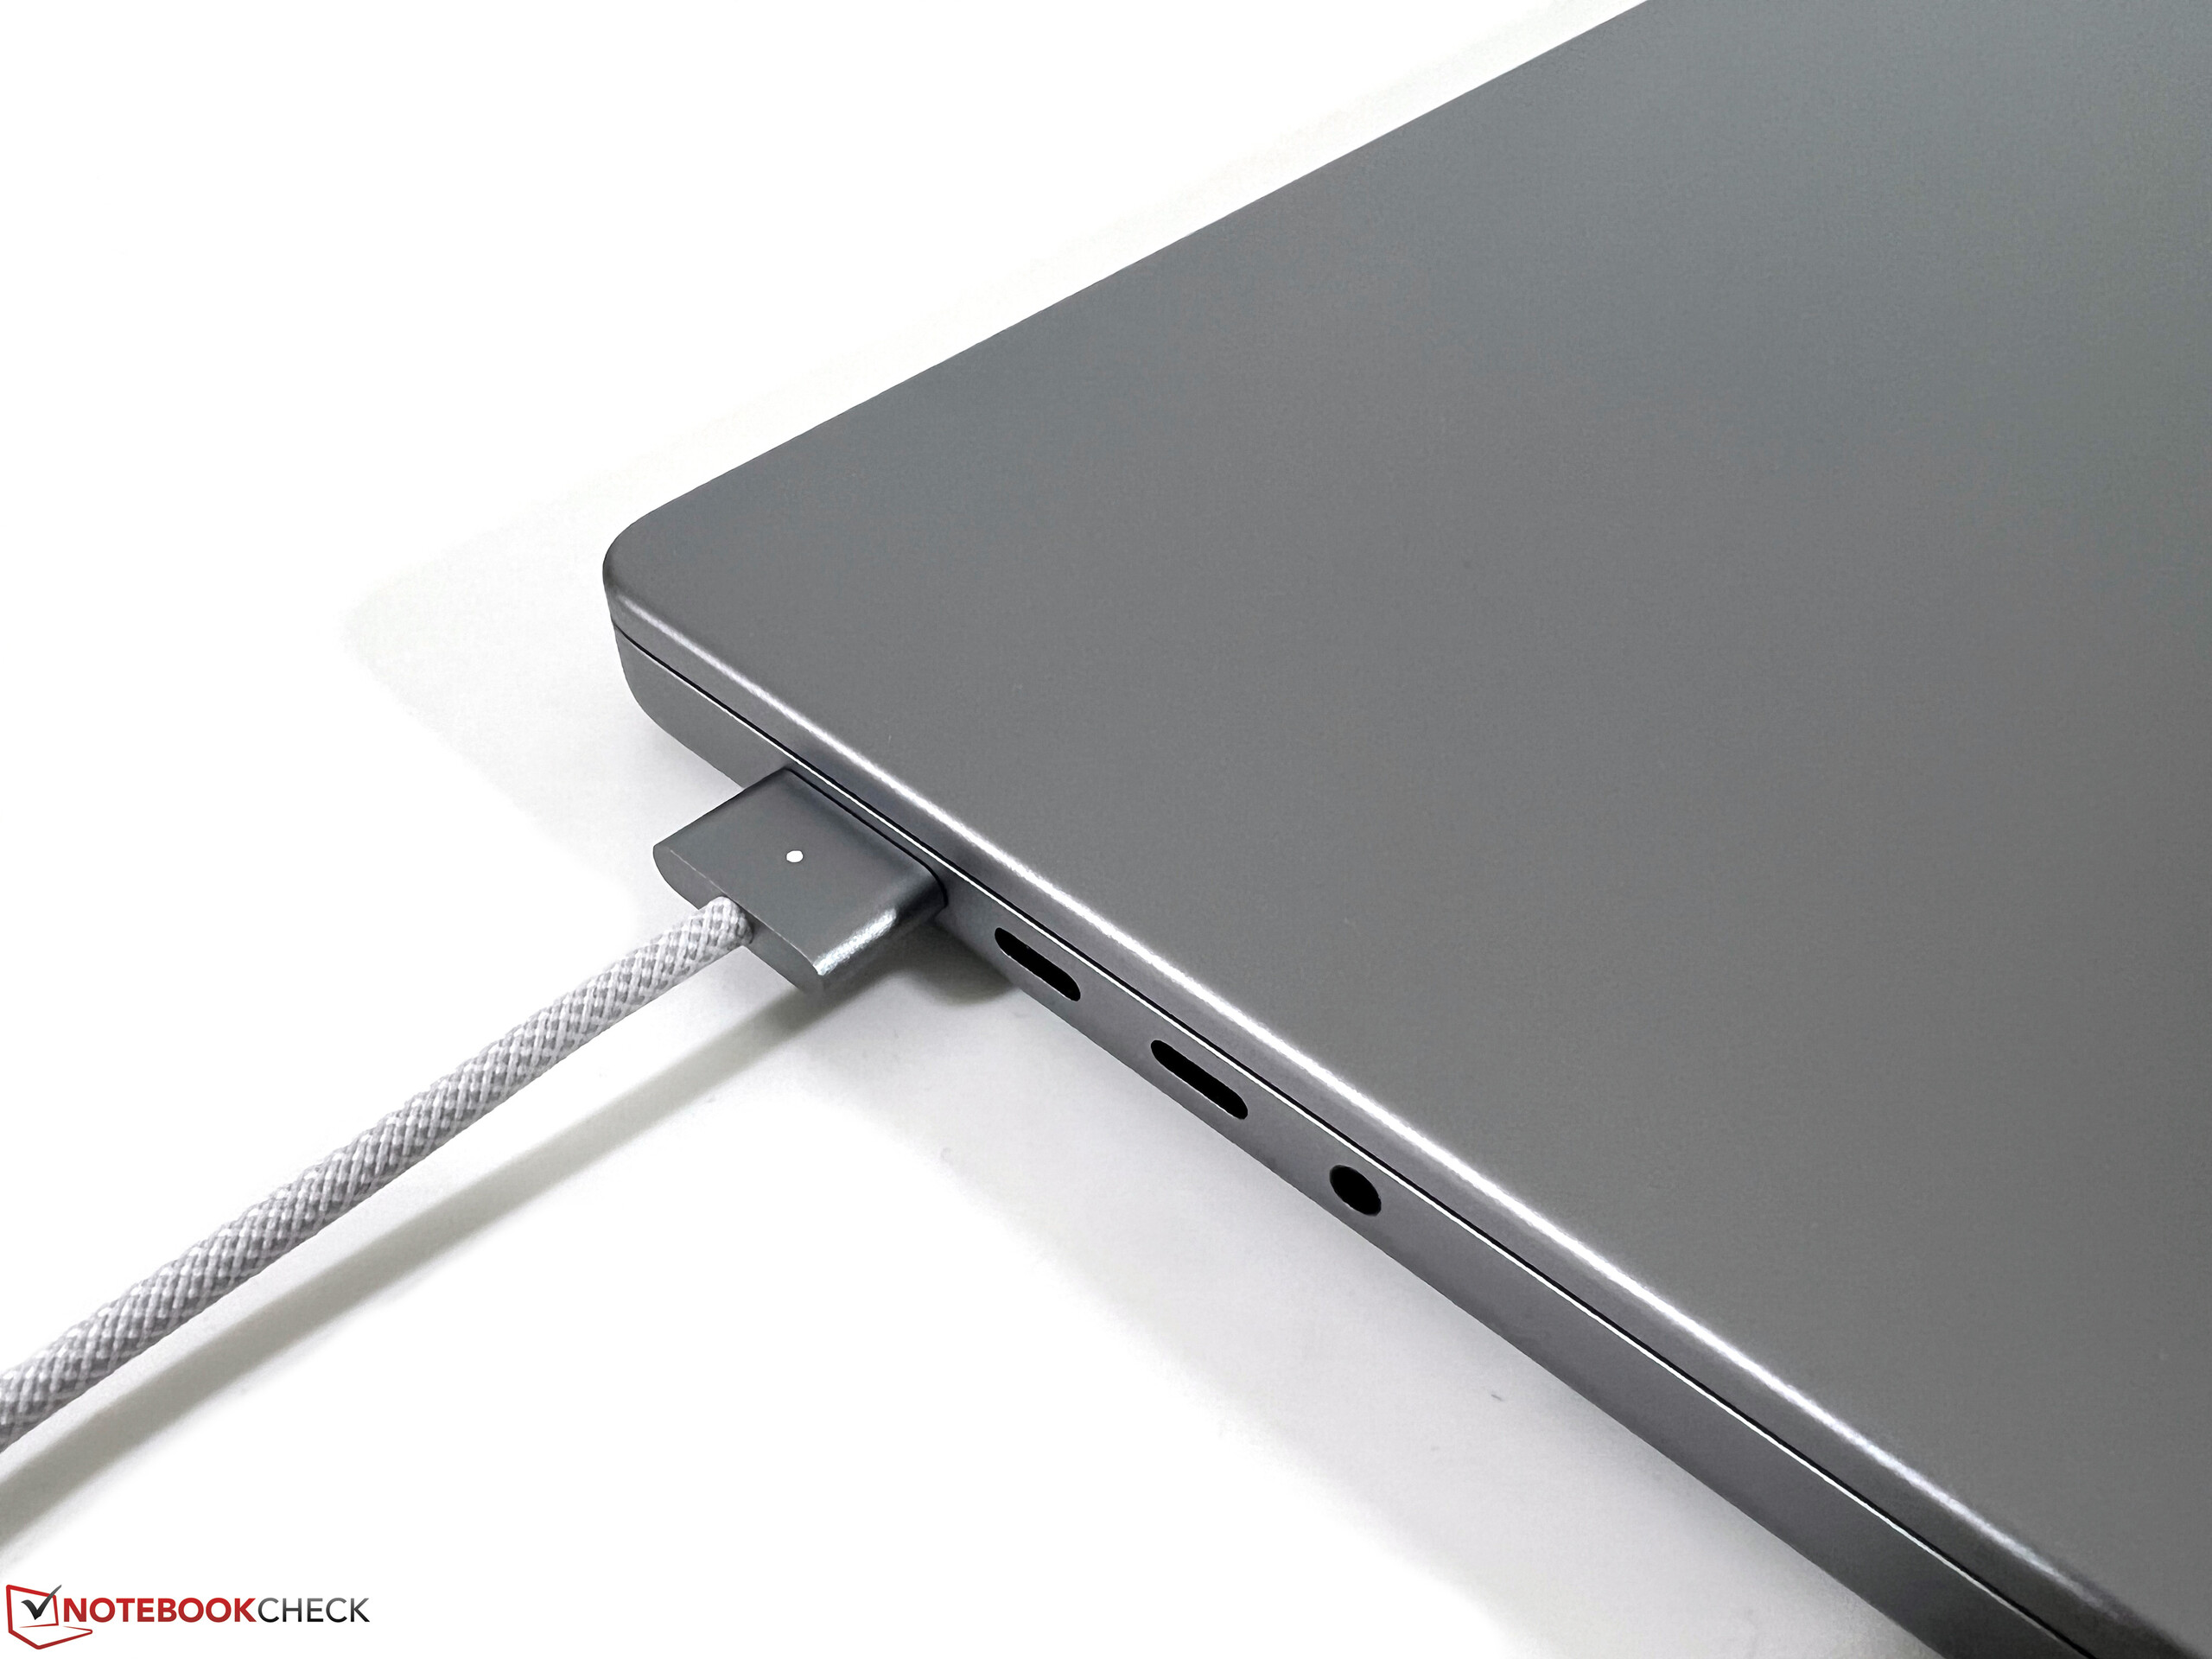
Connectivity - MacBook now with HDMI 2.1
The port layout did not change and you still get the MagSafe connector for charging as well as three USB-C/Thunderbolt ports, which can also be used to charge the device. Apple upgraded the HDMI port and it now supports the HDMI 2.1 standard. In addition to the integrated panel, models with the M2 Max can drive up to four (3x 6K@60Hz via Thunderbolt und 1x 4K@144 Hz via HDMI) or three external displays, respectively (2x 6K@60 Hz via Thunderbolt und 1x 8K@60 Hz bzw. 4K@240 Hz via HDMI).


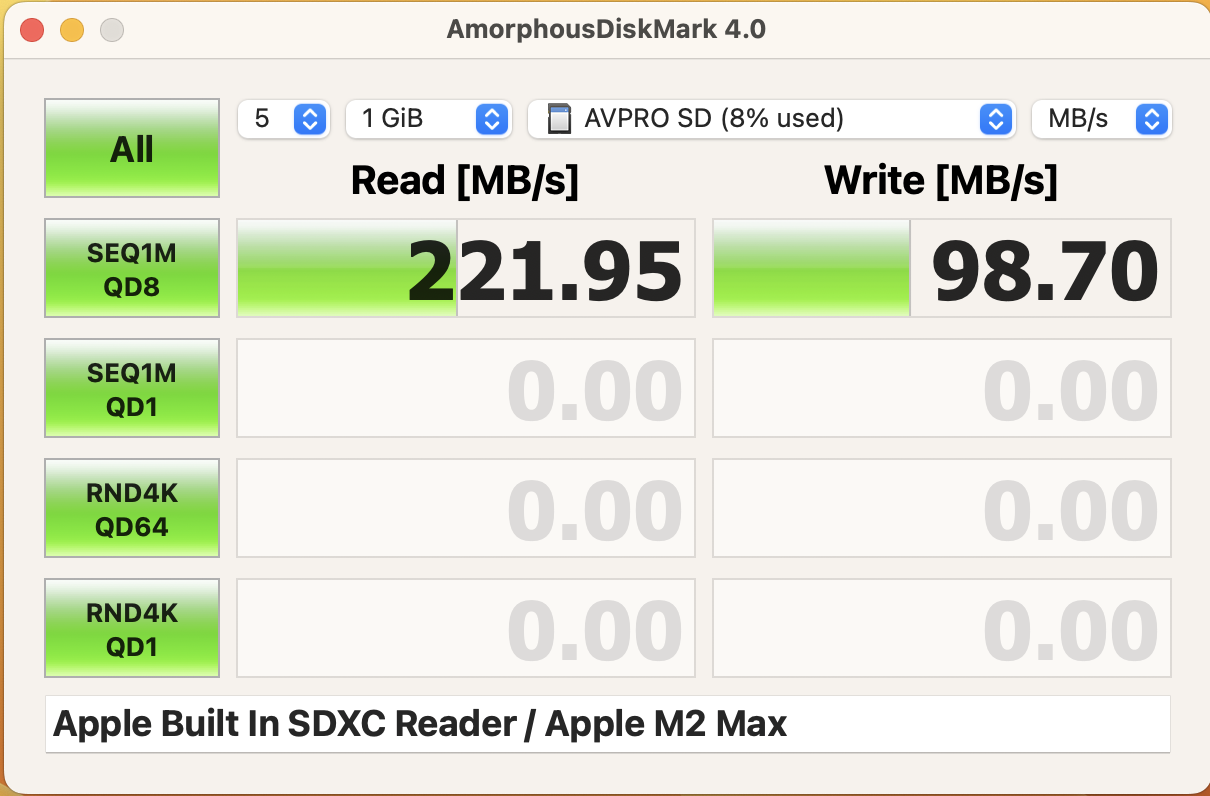
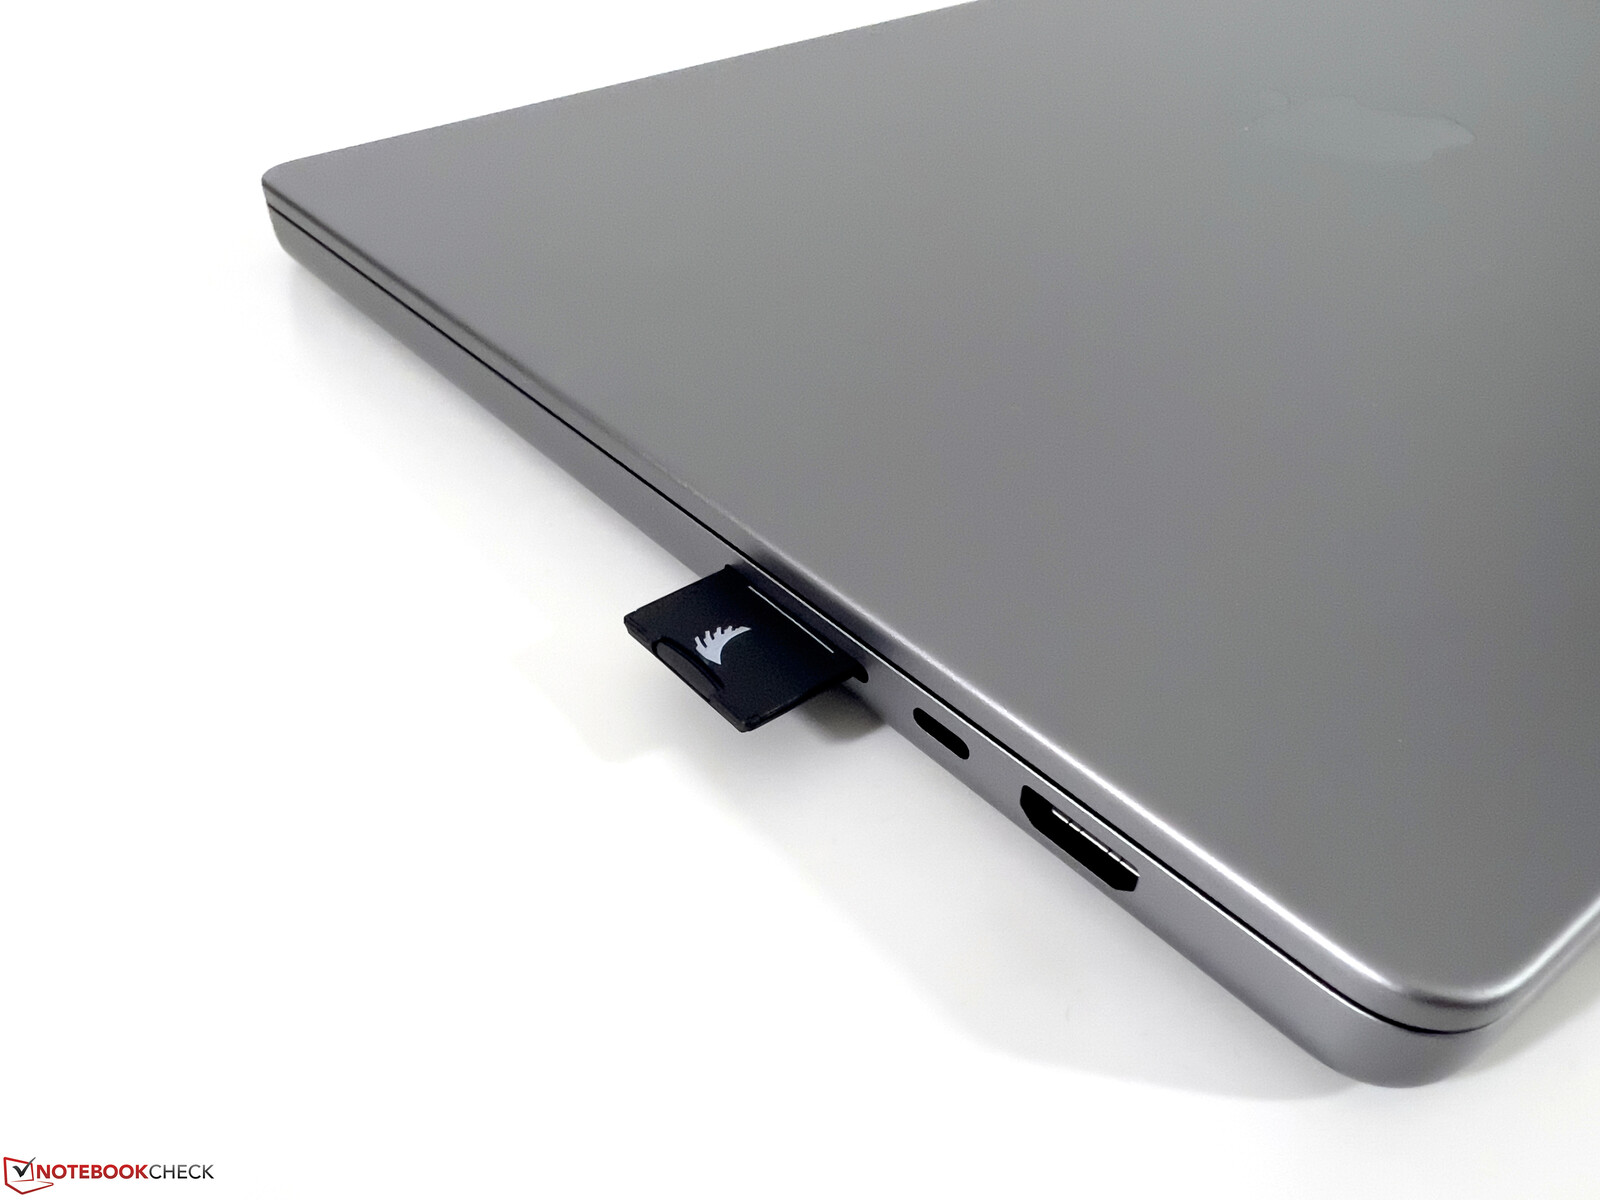
SD Card Reader
We measure better transfer rates for the integrated card reader compared to the previous model. Our reference card (Angelbird AV Pro V60) manages a maximum transfer rate of 222 MB/s and 196 MB/s when we copy images from the card.
| SD Card Reader | |
| average JPG Copy Test (av. of 3 runs) | |
| Apple MacBook Pro 16 2023 M2 Max (Angelbird AV Pro V60) | |
| Apple MacBook Pro 14 2023 M2 Pro (AV Pro V60) | |
| Dell Precision 7000 7670 Performance (Toshiba Exceria Pro SDXC 64 GB UHS-II) | |
| Apple MacBook Pro 16 2021 M1 Pro (Angelbird AV Pro V60) | |
| Average of class Multimedia (21.1 - 531, n=47, last 2 years) | |
| Schenker Vision 16 Pro RTX 3070 Ti (AV Pro V60) | |
| Asus ZenBook Pro 16X OLED UX7602ZM-ME115W (AV Pro SD microSD 128 GB V60) | |
| Lenovo ThinkPad X1 Extreme G5-21DE003RGE (AV Pro V60) | |
| maximum AS SSD Seq Read Test (1GB) | |
| Apple MacBook Pro 16 2023 M2 Max (Angelbird AV Pro V60) | |
| Apple MacBook Pro 14 2023 M2 Pro (AV Pro V60) | |
| Dell Precision 7000 7670 Performance (Toshiba Exceria Pro SDXC 64 GB UHS-II) | |
| Average of class Multimedia (27.4 - 1455, n=47, last 2 years) | |
| Schenker Vision 16 Pro RTX 3070 Ti (AV Pro V60) | |
| Asus ZenBook Pro 16X OLED UX7602ZM-ME115W (AV Pro SD microSD 128 GB V60) | |
| Lenovo ThinkPad X1 Extreme G5-21DE003RGE (AV Pro V60) | |
Communication
One drawback of the previous MacBook Pro models was the limitation to 80 MHz connections for Wi-Fi 6 networks, so the maximum transfer rates were much lower compared to some Windows laptops. Apple fixed this issue with the 2023 models and the Broadcom Wi-Fi module now supports the Wi-Fi 6E standard. We had no problems to use our 6 GHz Wi-Fi network (Asus reference router) and both the transfer rates as well as the signal strength were excellent.
| Networking | |
| Apple MacBook Pro 16 2023 M2 Max | |
| iperf3 receive AXE11000 6GHz | |
| iperf3 transmit AXE11000 6GHz | |
| Lenovo ThinkPad X1 Extreme G5-21DE003RGE | |
| iperf3 receive AXE11000 6GHz | |
| iperf3 transmit AXE11000 6GHz | |
| Asus ZenBook Pro 16X OLED UX7602ZM-ME115W | |
| iperf3 receive AXE11000 | |
| iperf3 transmit AXE11000 | |
| Schenker Vision 16 Pro RTX 3070 Ti | |
| iperf3 receive AXE11000 | |
| iperf3 transmit AXE11000 | |
| Dell Precision 7000 7670 Performance | |
| iperf3 receive AXE11000 6GHz | |
| iperf3 receive AXE11000 | |
| iperf3 transmit AXE11000 6GHz | |
| iperf3 transmit AXE11000 | |
| Apple MacBook Pro 16 2021 M1 Pro | |
| iperf3 transmit AX12 | |
| iperf3 receive AX12 | |
| iperf3 receive AXE11000 | |
| iperf3 transmit AXE11000 | |
Webcam
Apple still uses the same 1080p sensor from the previous model, but the image processing of the new M2 chips was improved, so the picture quality can be better in some scenarios. Considering the large display notch, however, we are a bit disappointed that the camera still does not support Face-ID or Center Stage. Users of iPhones can at least use their smartphones as webcams and there is even a top view, so you can use the area in front of the laptop (great for hands-on videos or product presentations).


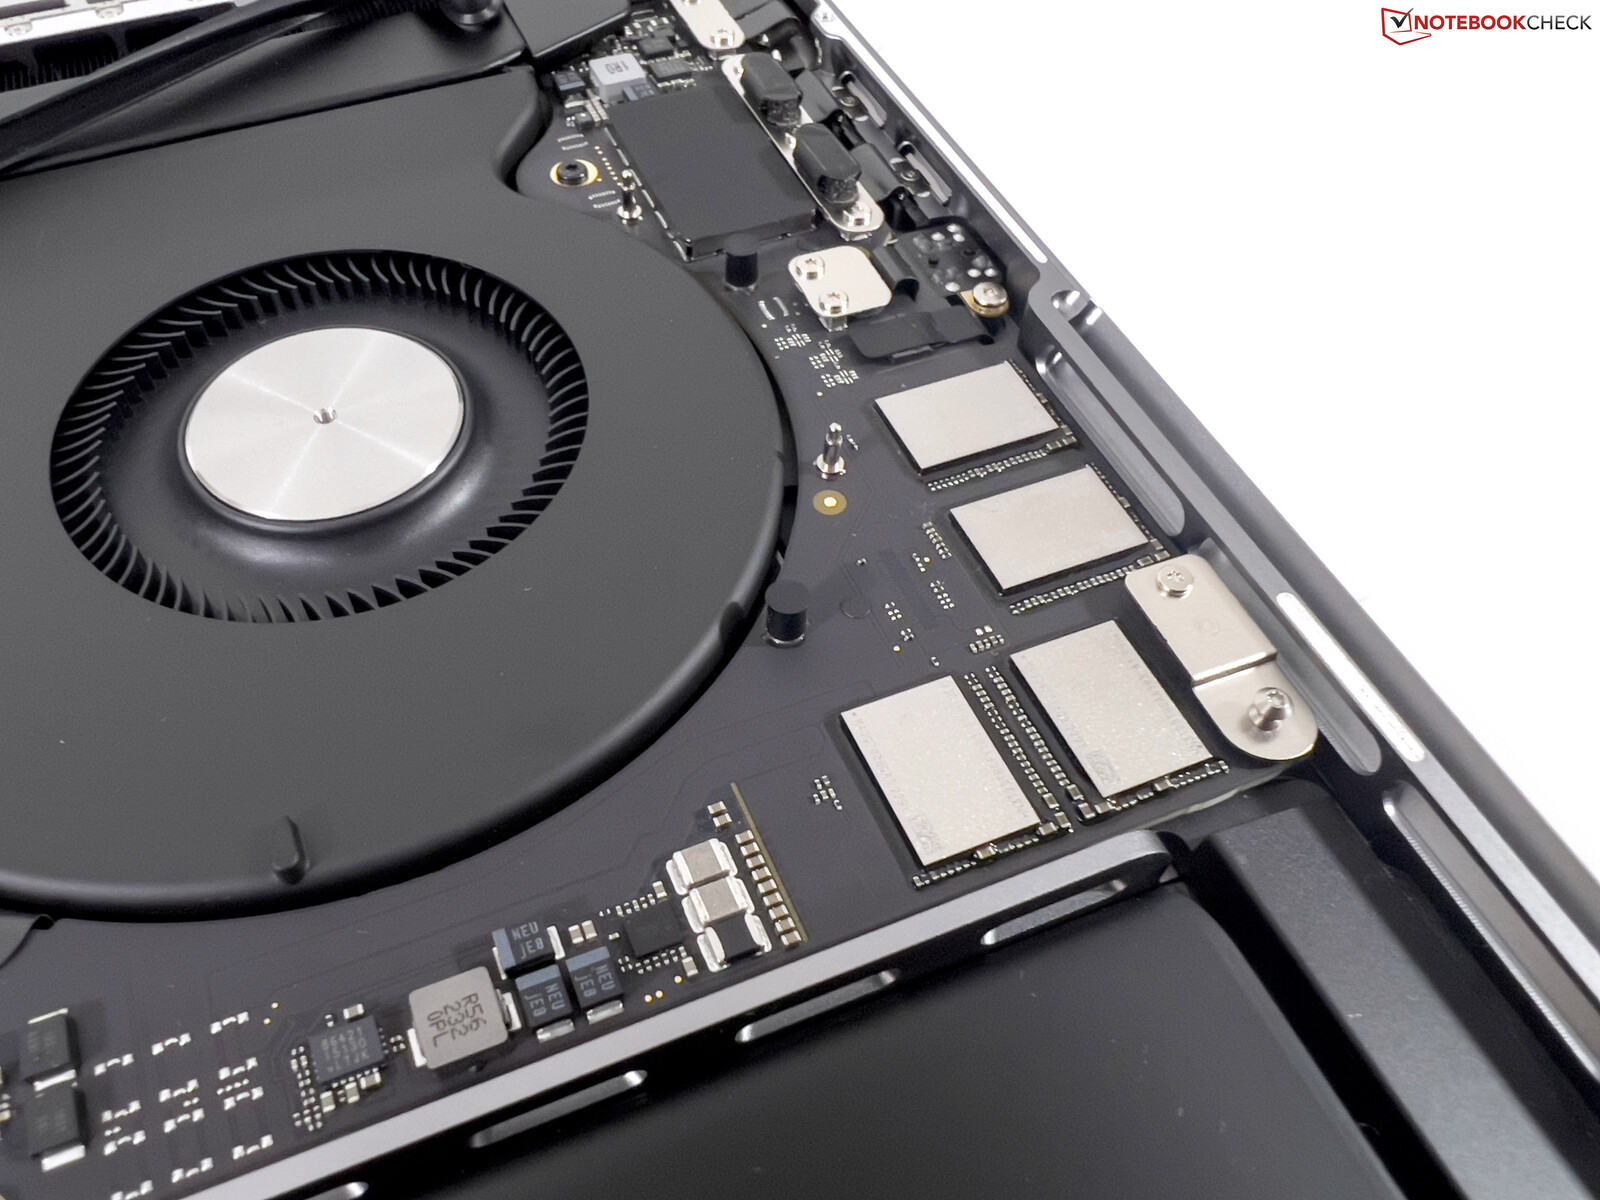
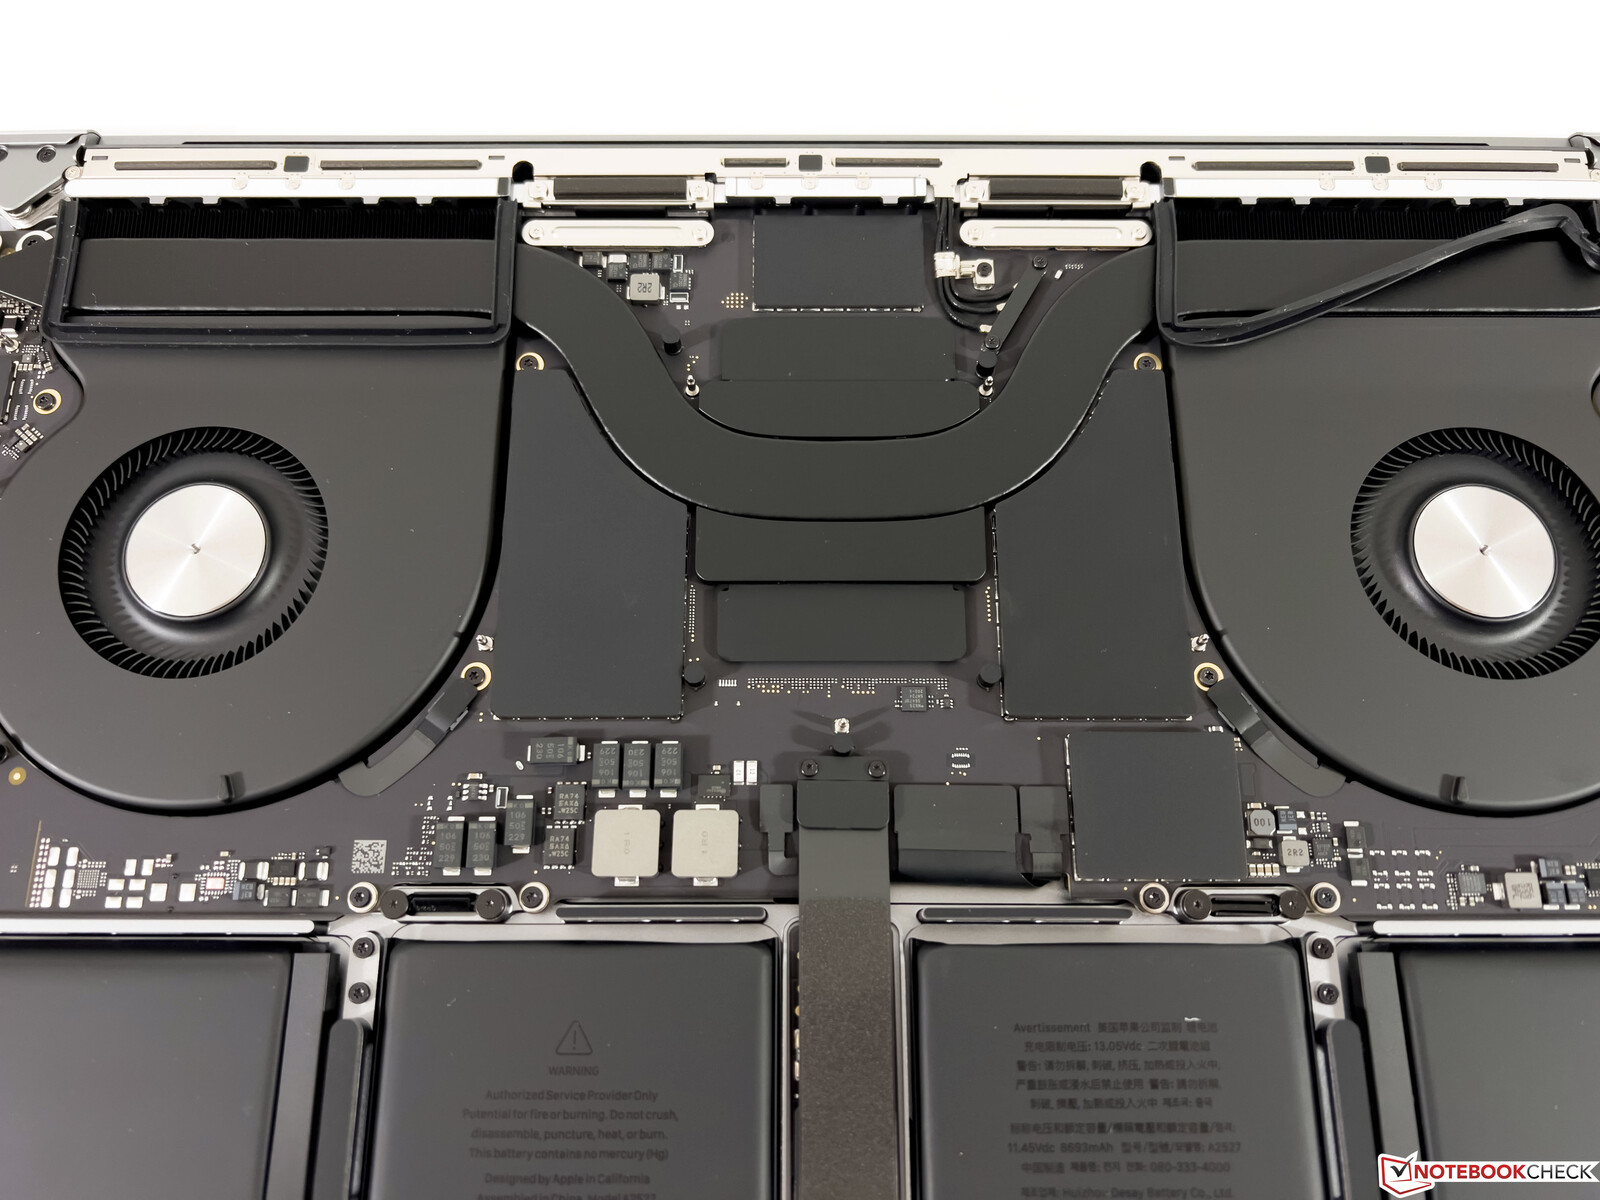
Maintenance
It is simple to remove the pentalobe screws with the according tool and then you have to push the bottom panel towards the front before you can lift it. You can clean the two fans, but lal the other components cannot be replaced or upgraded.
Warranty
Apple still ships the 2023 MacBook Pro 16 with a one-year warranty. It is possible to extend this period via Apple Care+, either for three years for 399 Euros or 149 Euros per year (no time limit), which means the costs are even higher compared to the MBP 14 (299 or 109 Euros, respectively).
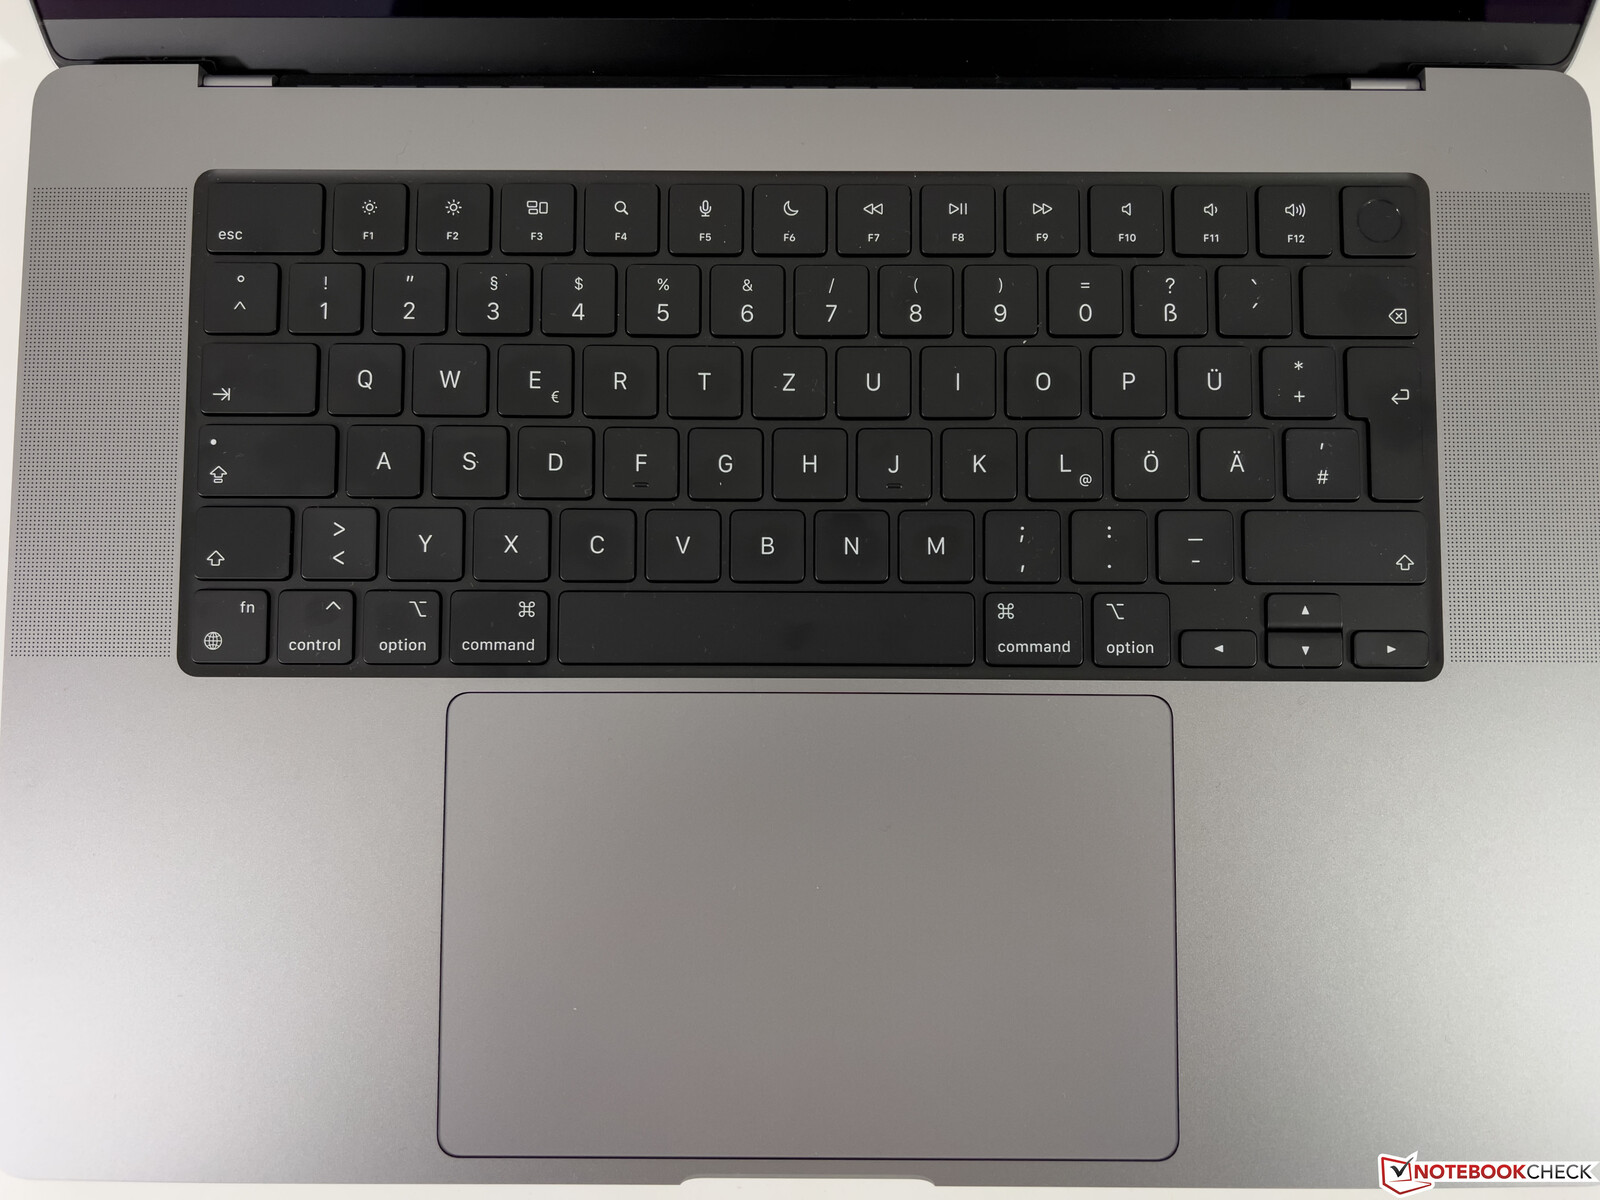
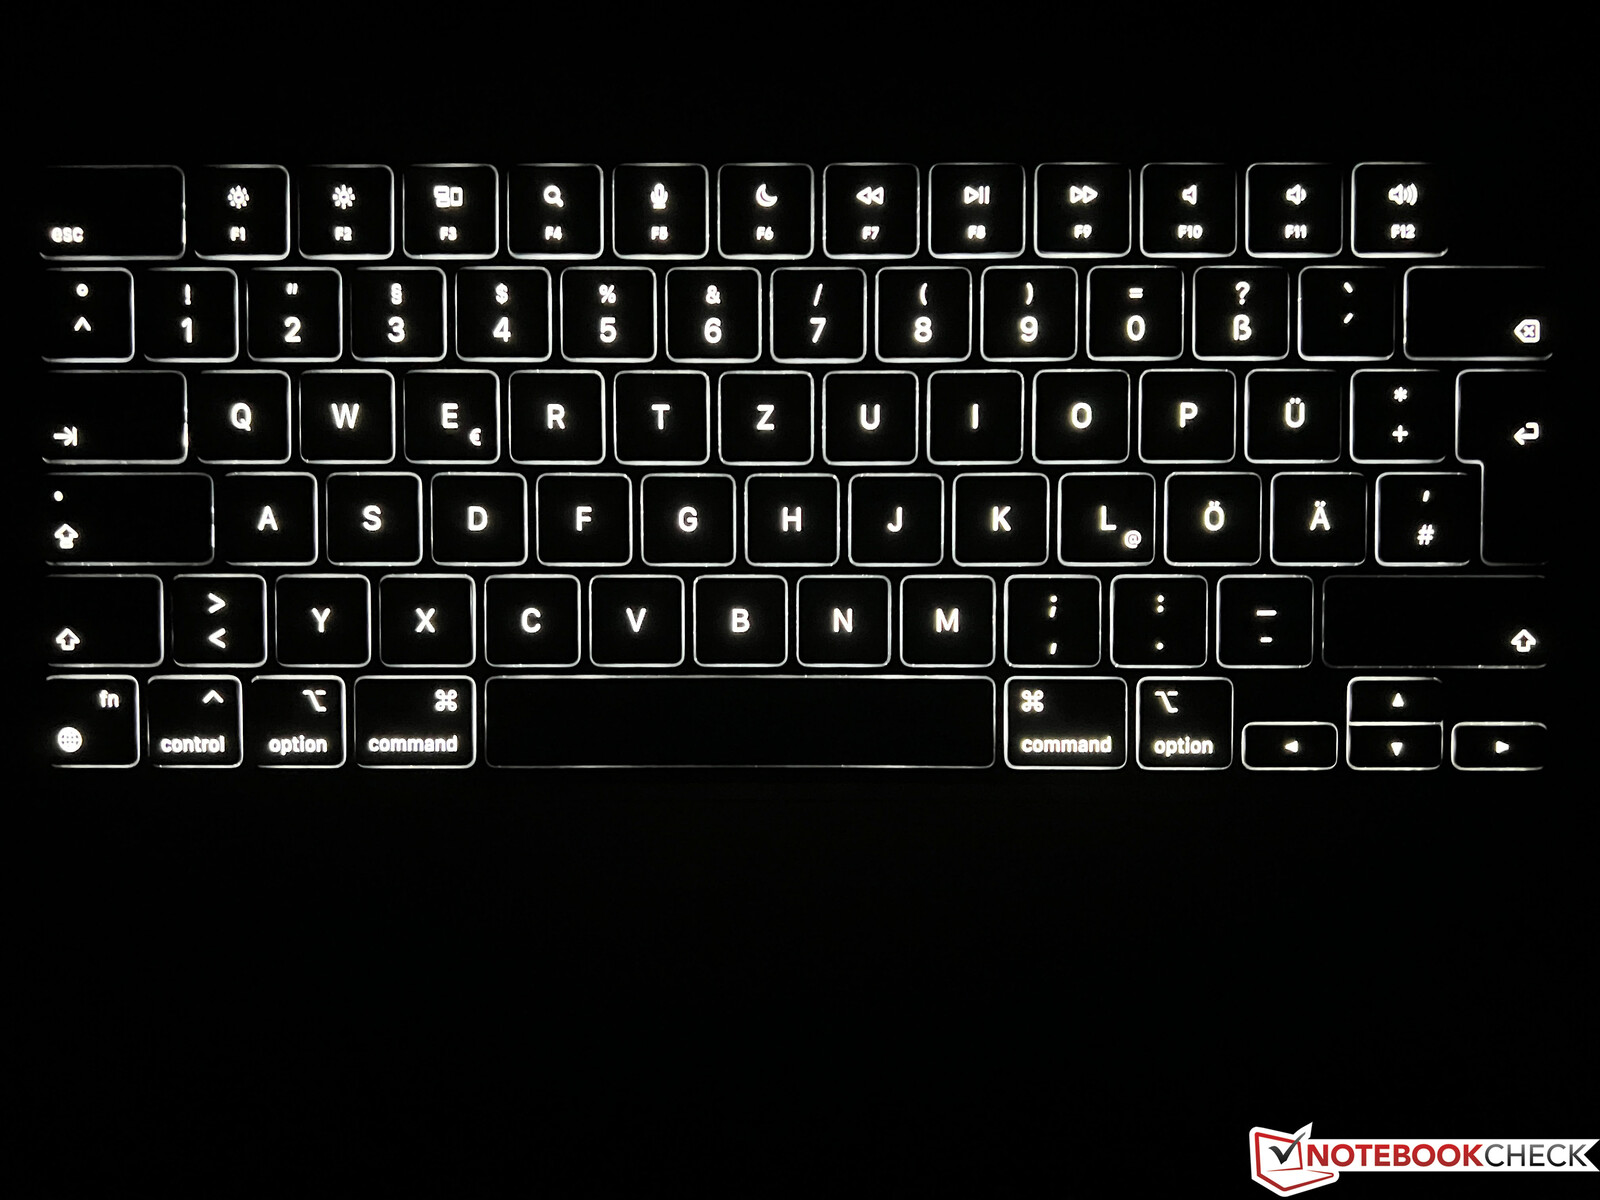
Input Devices - Good keyboard, perfect trackpad
We can refer to the previous model for the input devices. The keyboard offers a decent typing experience, but there is still room for improvements compared to expensive business laptops. However, Apple still offers the best keyboard illumination, which is automatically adjusted via brightness sensor in very fine steps. There are some Windows laptops that can activate the illumination based on the ambient lighting, but there are usually only two or three intensity levels.
The large trackpad is still the benchmark in terms of functionality and handling, because the implementation with macOS just works extremely well.
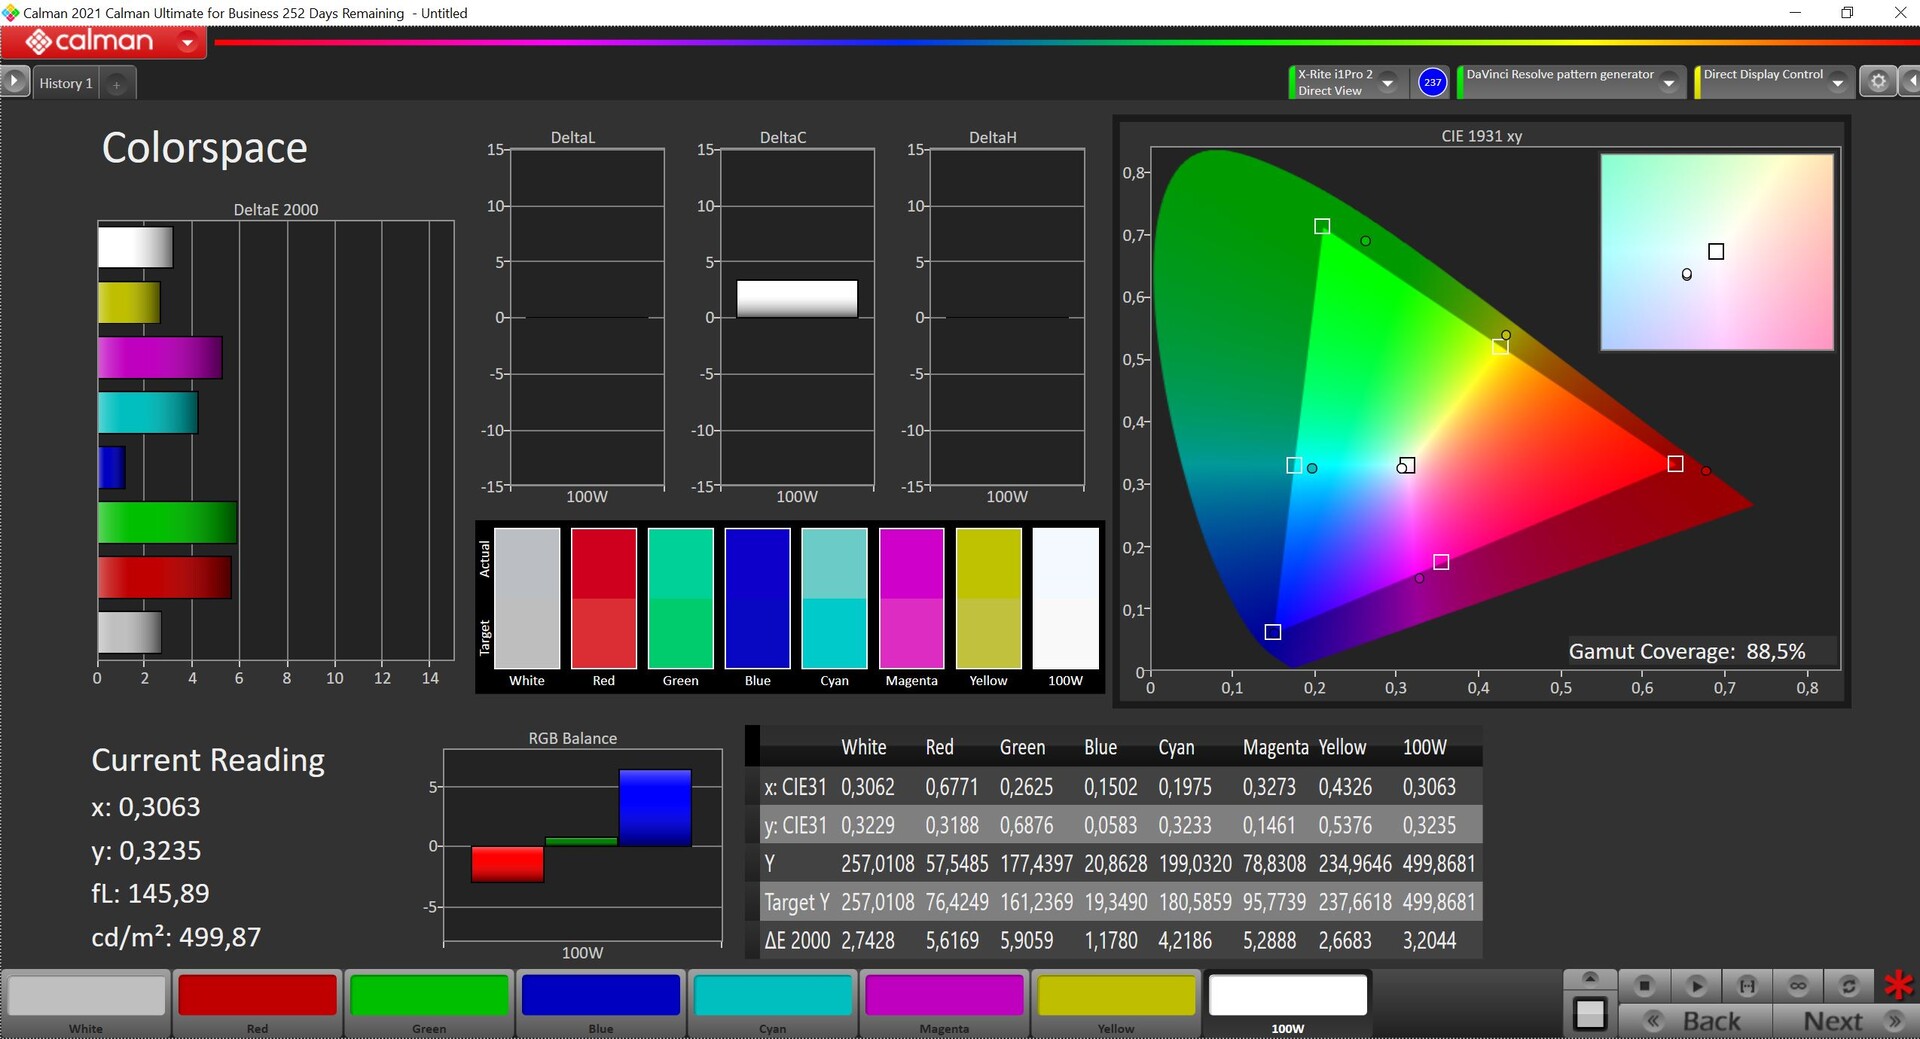
Display - 120 Hz Mini-LED

Apple did not change the specs of the Mini-LED panel in the MacBook Pro 16, but we are happy to see that Apple now advertises the maximum SDR brightness of 500 nits. The resolution of the 16.2-inch screen is 3456 x 2234 pixels (254 ppi) and it is basically a 16:10 aspect ratio screen with additional vertical pixels next to the display notch. The notch still does not look very nice, but we did not experience any functional issues. The subjective picture impression is still impressive with completely black contents and there is no backlight bleeding along the edges. However, there is blooming around bright objects on dark backgrounds (like logos) since the whole dimming zone of the panel is illuminated. This is very noticeable in demo videos or previously mentioned screens with logos, but it is not really an issue in practice where you enjoy rich colors and smooth movements thanks to the 120 Hz refresh rate.
As advertised, we measure a maximum SDR brightness of 500 nits; higher values are reserved for HDR contents. However, our test device did not reach the advertised maximum of 1600 nits since we only managed to measure 1470 nits on a small bright area and still little more than 1100 nits on an almost completely white picture. We recently tested the MSI Titan GT77 with the 4K Mini-LED screen and we just have to mention the great HDR implementation in macOS. The display will just increase the brightness when you have corresponding contents on the screen. It does not require any setting changes and there are no problems with the color profiles – it does not get more comfortable than this. Other comfort features include the precise automatic regulation of the display brightness and the automatic adjustment of the color temperature (True Tone).
| |||||||||||||||||||||||||
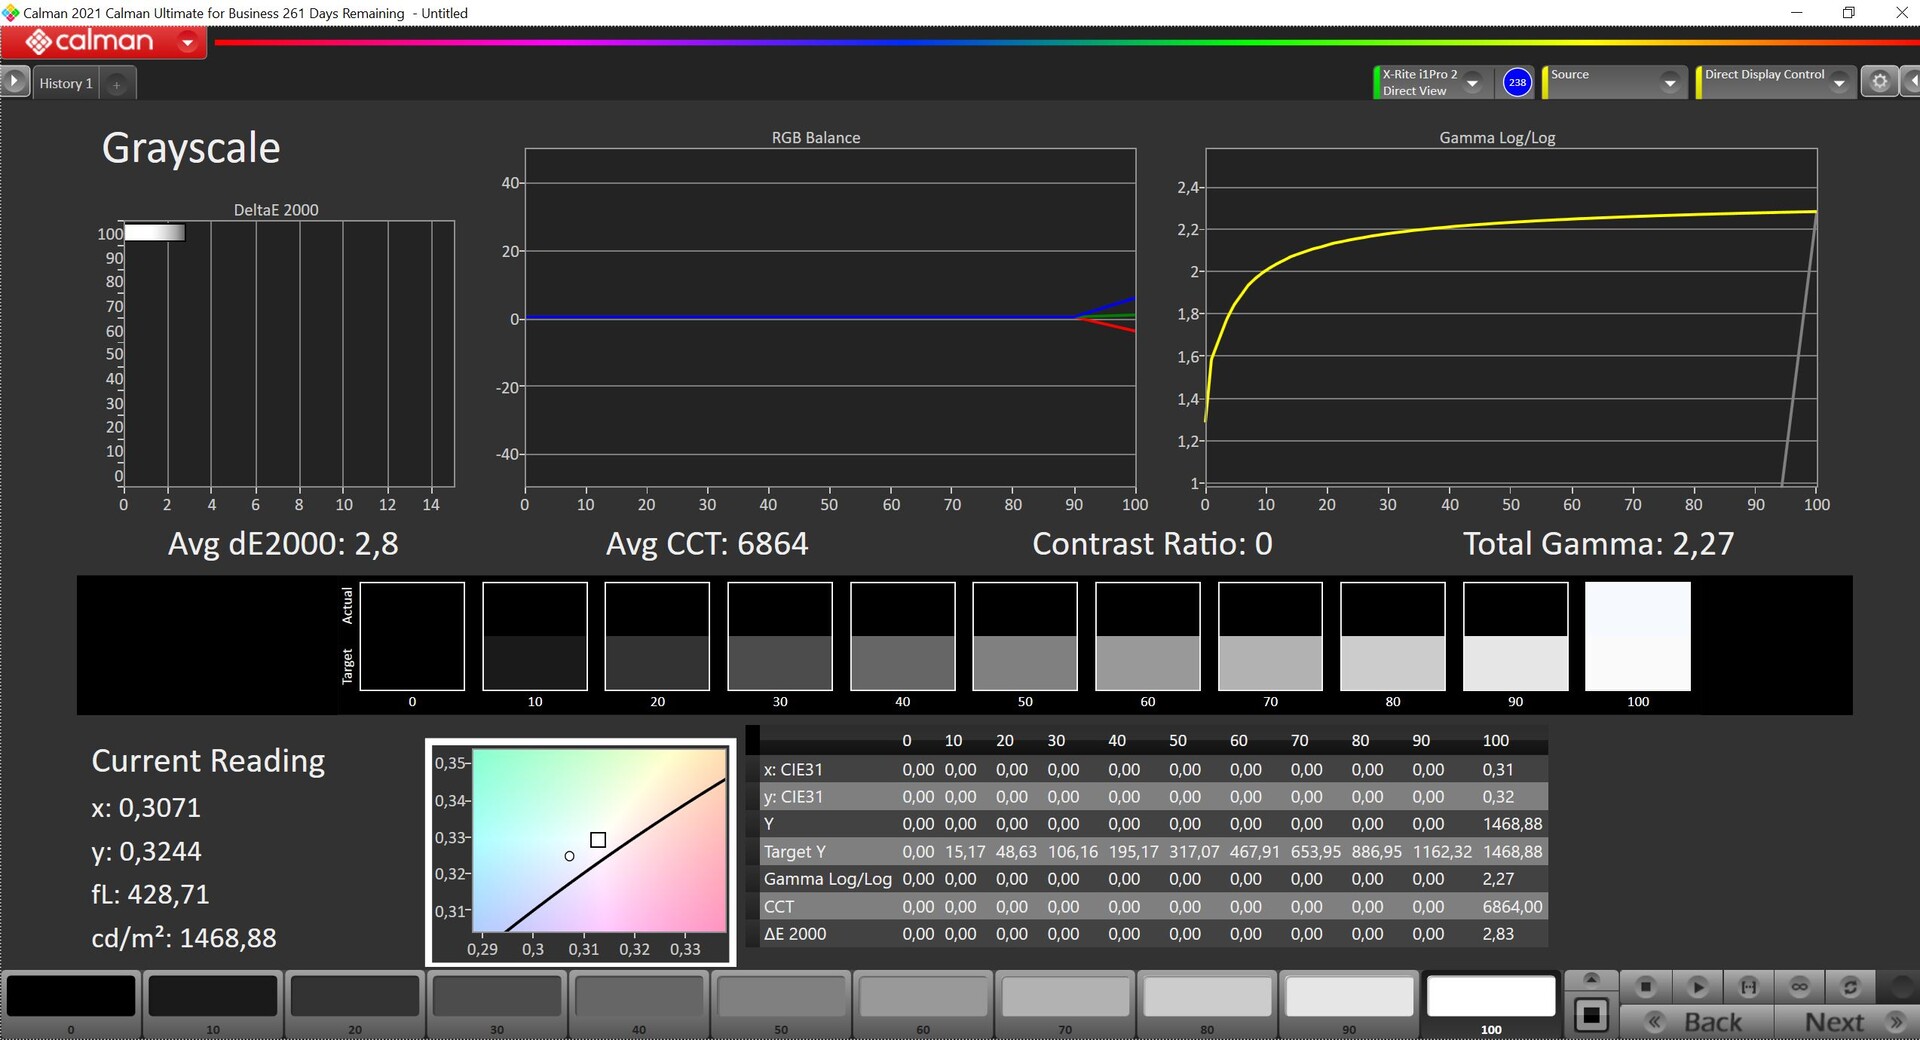
Brightness Distribution: 94 %
Center on Battery: 504 cd/m²
Contrast: 504000:1 (Black: 0.001 cd/m²)
ΔE ColorChecker Calman: 1.5 | ∀{0.5-29.43 Ø4.75}
ΔE Greyscale Calman: 2.1 | ∀{0.09-98 Ø5}
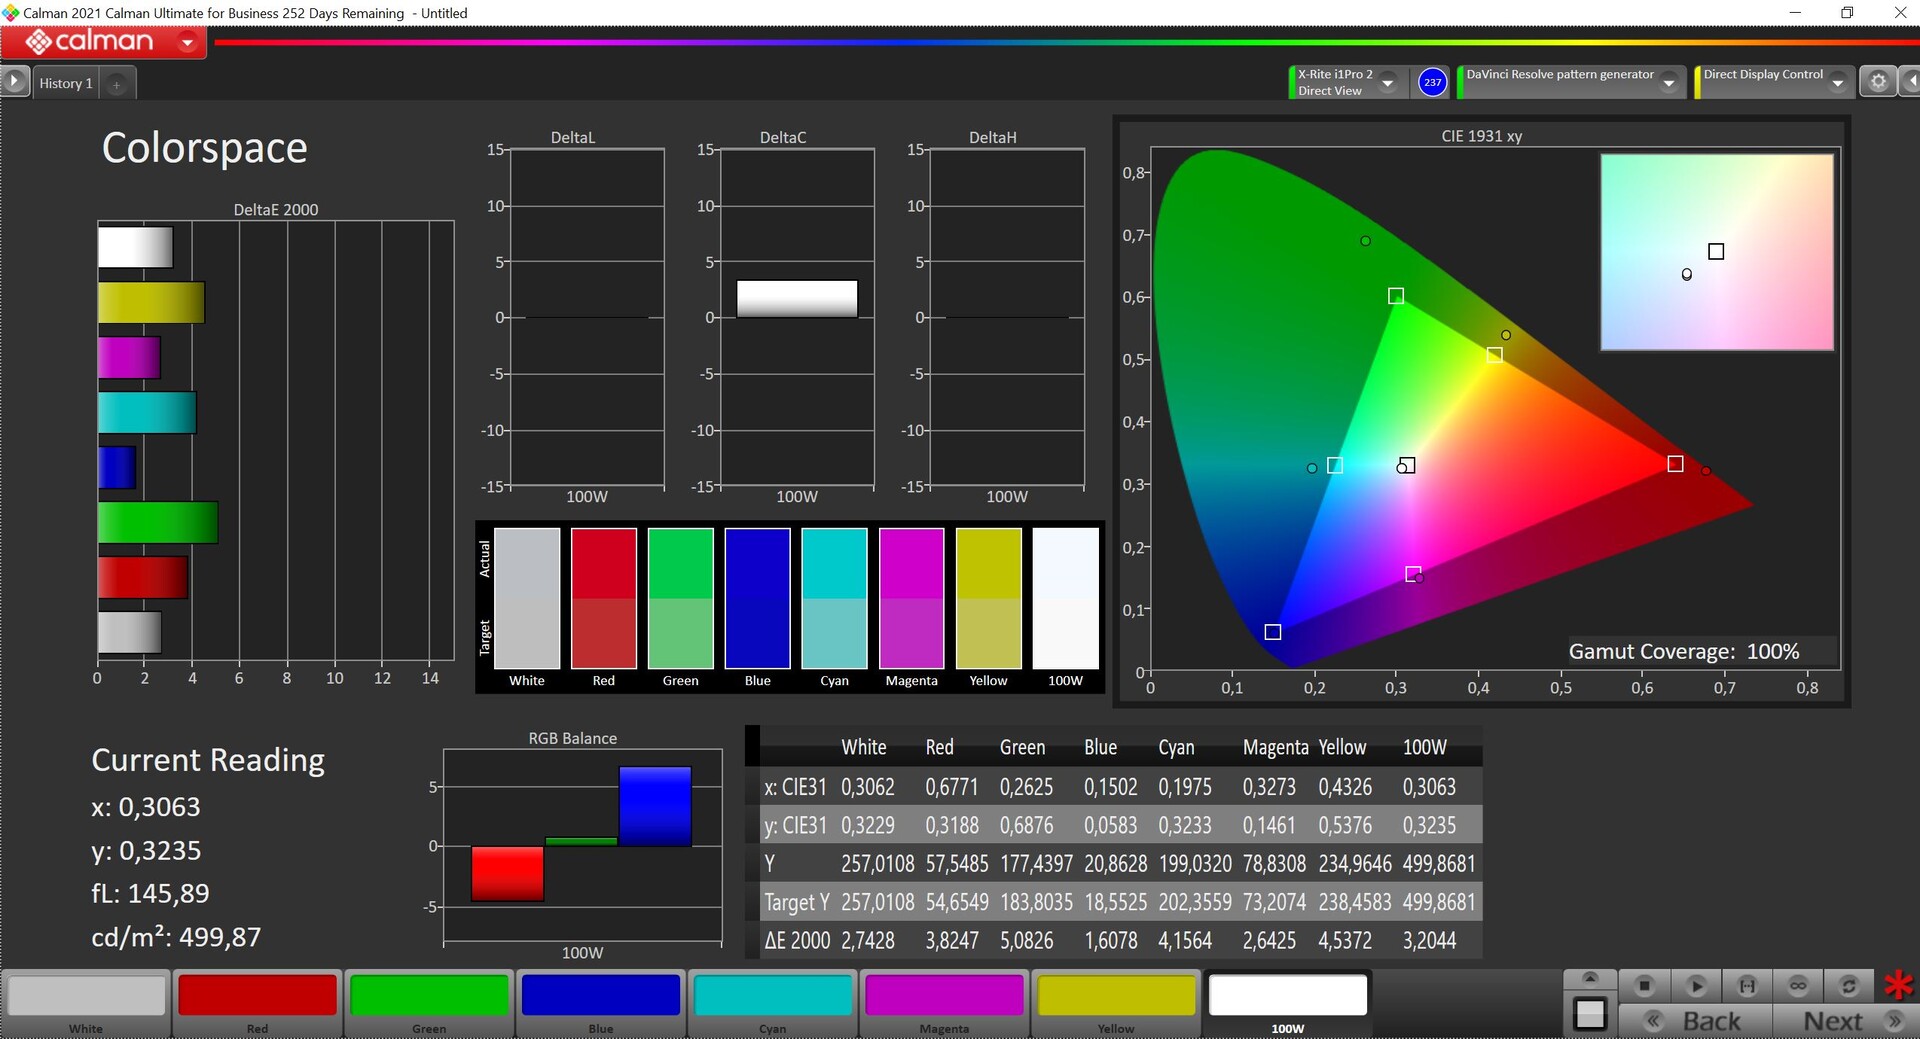
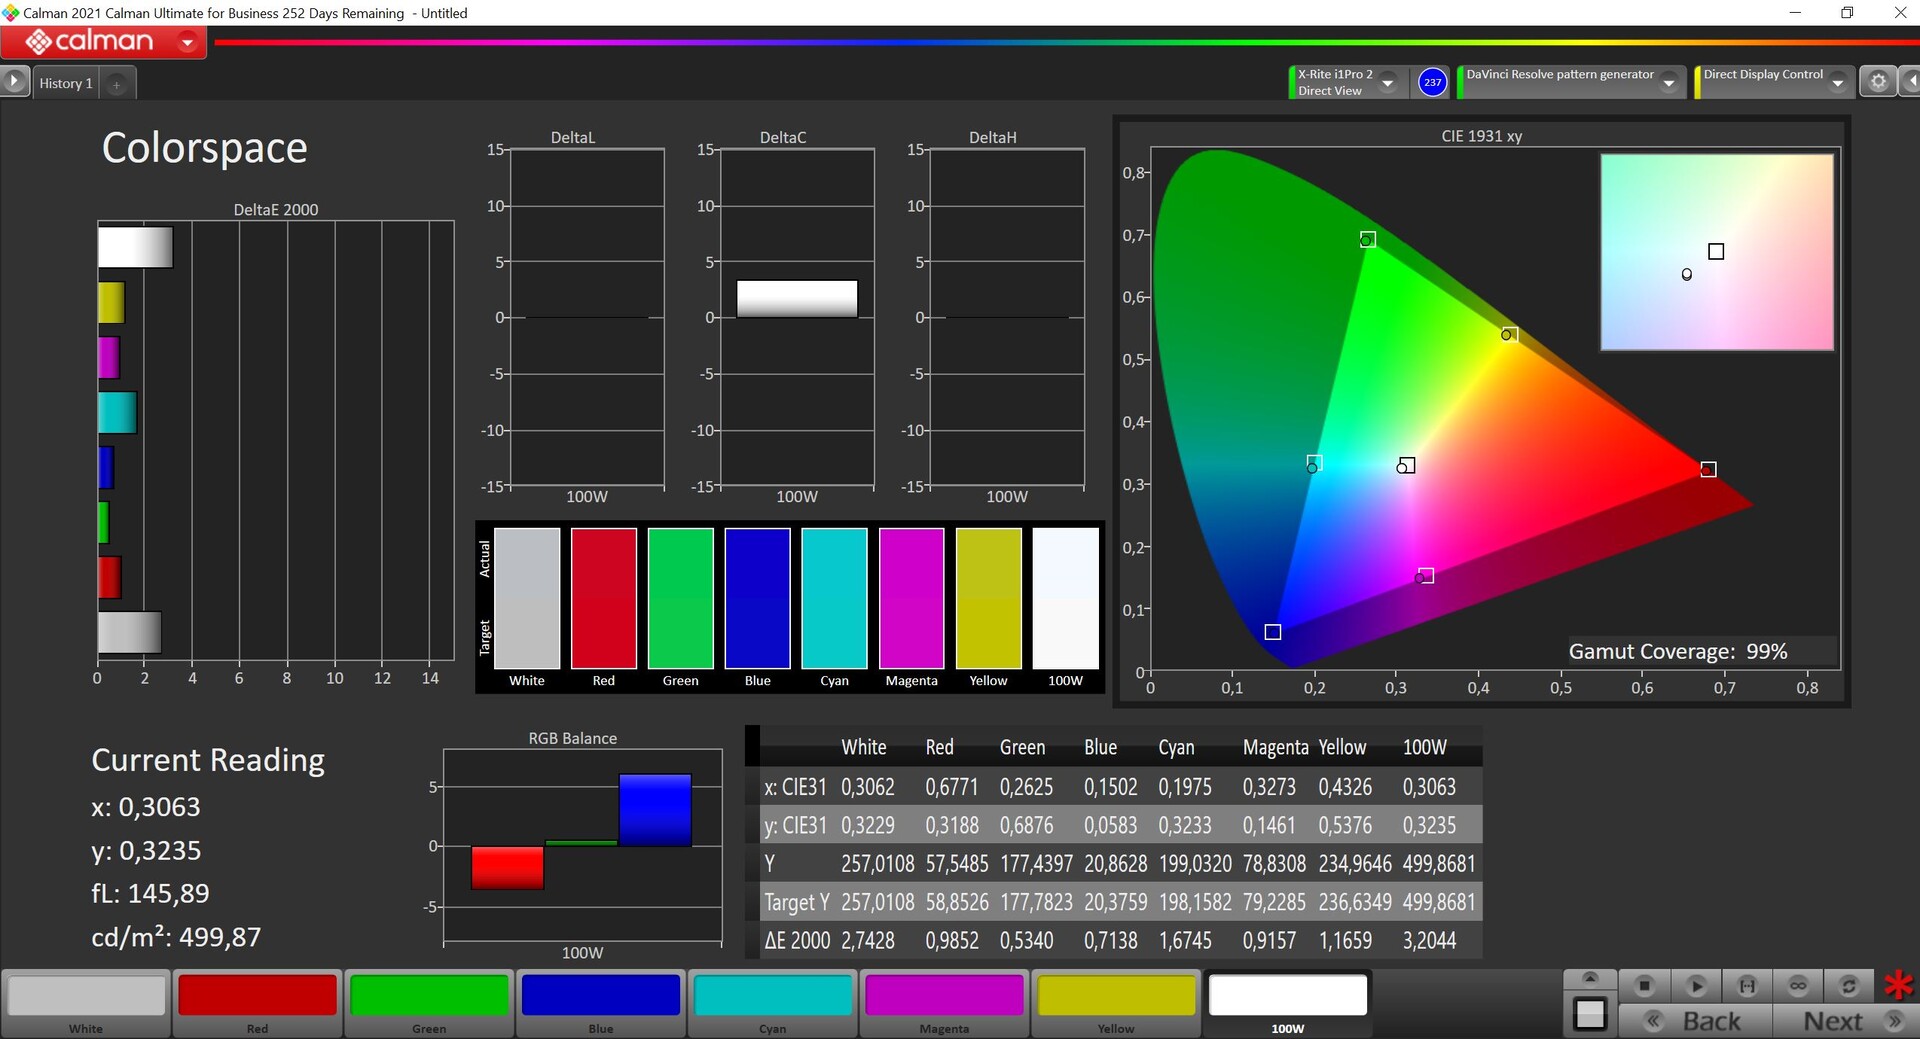
88.5% AdobeRGB 1998 (Argyll 3D)
100% sRGB (Argyll 3D)
99% Display P3 (Argyll 3D)
Gamma: 2.25
CCT: 6882 K
| Apple MacBook Pro 16 2023 M2 Max Mini-LED, 3456x2234, 16.2" | Apple MacBook Pro 16 2021 M1 Pro Liquid Retina XDR, Mini-LED, 3456x2234, 16.2" | Lenovo ThinkPad X1 Extreme G5-21DE003RGE LP160UQ1-SPB1, IPS, 3840x2400, 16" | Asus ZenBook Pro 16X OLED UX7602ZM-ME115W Samsung SDC415D, OLED, 3840x2400, 16" | Schenker Vision 16 Pro RTX 3070 Ti N160QDM-NZ1, IPS, 2560x1600, 16" | Dell Precision 7000 7670 Performance Samsung 160YV03, OLED, 3840x2400, 16" | |
|---|---|---|---|---|---|---|
| Display | -0% | -2% | 0% | -18% | 4% | |
| Display P3 Coverage (%) | 99 | 99.1 0% | 84.6 -15% | 99.84 1% | 68.7 -31% | 99.9 1% |
| sRGB Coverage (%) | 100 | 100 0% | 99.2 -1% | 99.99 0% | 96.7 -3% | 100 0% |
| AdobeRGB 1998 Coverage (%) | 88.5 | 88 -1% | 97.7 10% | 88.9 0% | 70 -21% | 98.1 11% |
| Response Times | -24% | 51% | 97% | 82% | 97% | |
| Response Time Grey 50% / Grey 80% * (ms) | 80.5 ? | 42.8 ? 47% | 46 ? 43% | 2 ? 98% | 14.3 ? 82% | 1.84 ? 98% |
| Response Time Black / White * (ms) | 47.2 ? | 91.6 ? -94% | 19.2 ? 59% | 2 ? 96% | 8.6 ? 82% | 1.92 ? 96% |
| PWM Frequency (Hz) | 14880 ? | 14880 | 59 ? | 59.52 ? | ||
| Screen | -247% | -4387% | -23% | -3804% | -70% | |
| Brightness middle (cd/m²) | 504 | 514 2% | 476 -6% | 346 -31% | 364 -28% | 325.2 -35% |
| Brightness (cd/m²) | 487 | 497 2% | 470 -3% | 354 -27% | 347 -29% | 328 -33% |
| Brightness Distribution (%) | 94 | 95 1% | 90 -4% | 96 2% | 89 -5% | 97 3% |
| Black Level * (cd/m²) | 0.001 | 0.02 -1900% | 0.35 -34900% | 0.3 -29900% | ||
| Contrast (:1) | 504000 | 25700 -95% | 1360 -100% | 1213 -100% | ||
| Colorchecker dE 2000 * | 1.5 | 1.4 7% | 1.9 -27% | 2.28 -52% | 3.3 -120% | 4.59 -206% |
| Colorchecker dE 2000 max. * | 3.3 | 2.8 15% | 4.7 -42% | 4.94 -50% | 6.6 -100% | 7.65 -132% |
| Greyscale dE 2000 * | 2.1 | 2.3 -10% | 2.4 -14% | 1.64 22% | 5.2 -148% | 2.5 -19% |
| Gamma | 2.25 98% | 2.27 97% | 2.24 98% | 2.37 93% | 2.14 103% | 2.1 105% |
| CCT | 6882 94% | 6792 96% | 6377 102% | 6384 102% | 6331 103% | 6541 99% |
| Colorchecker dE 2000 calibrated * | 1.3 | 2.16 | 2.5 | |||
| Total Average (Program / Settings) | -90% /
-156% | -1446% /
-2692% | 25% /
5% | -1247% /
-2332% | 10% /
-20% |
* ... smaller is better
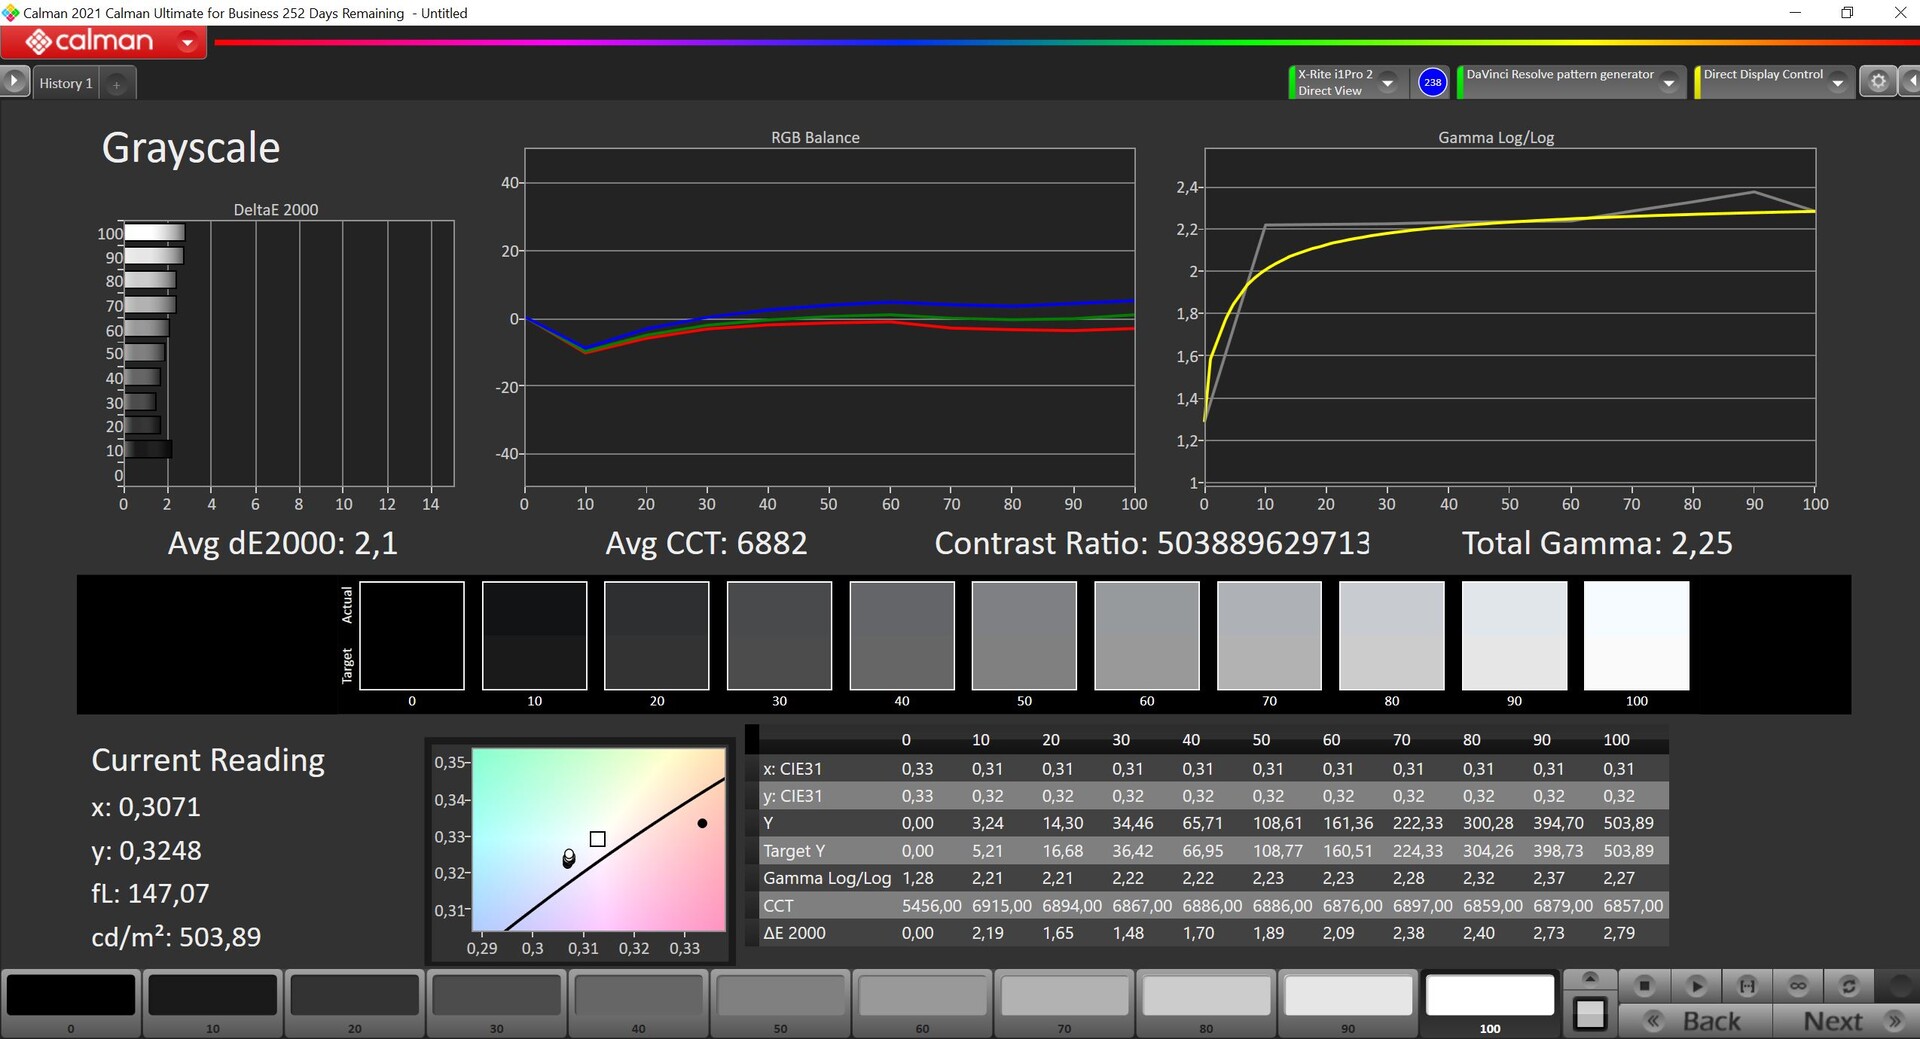
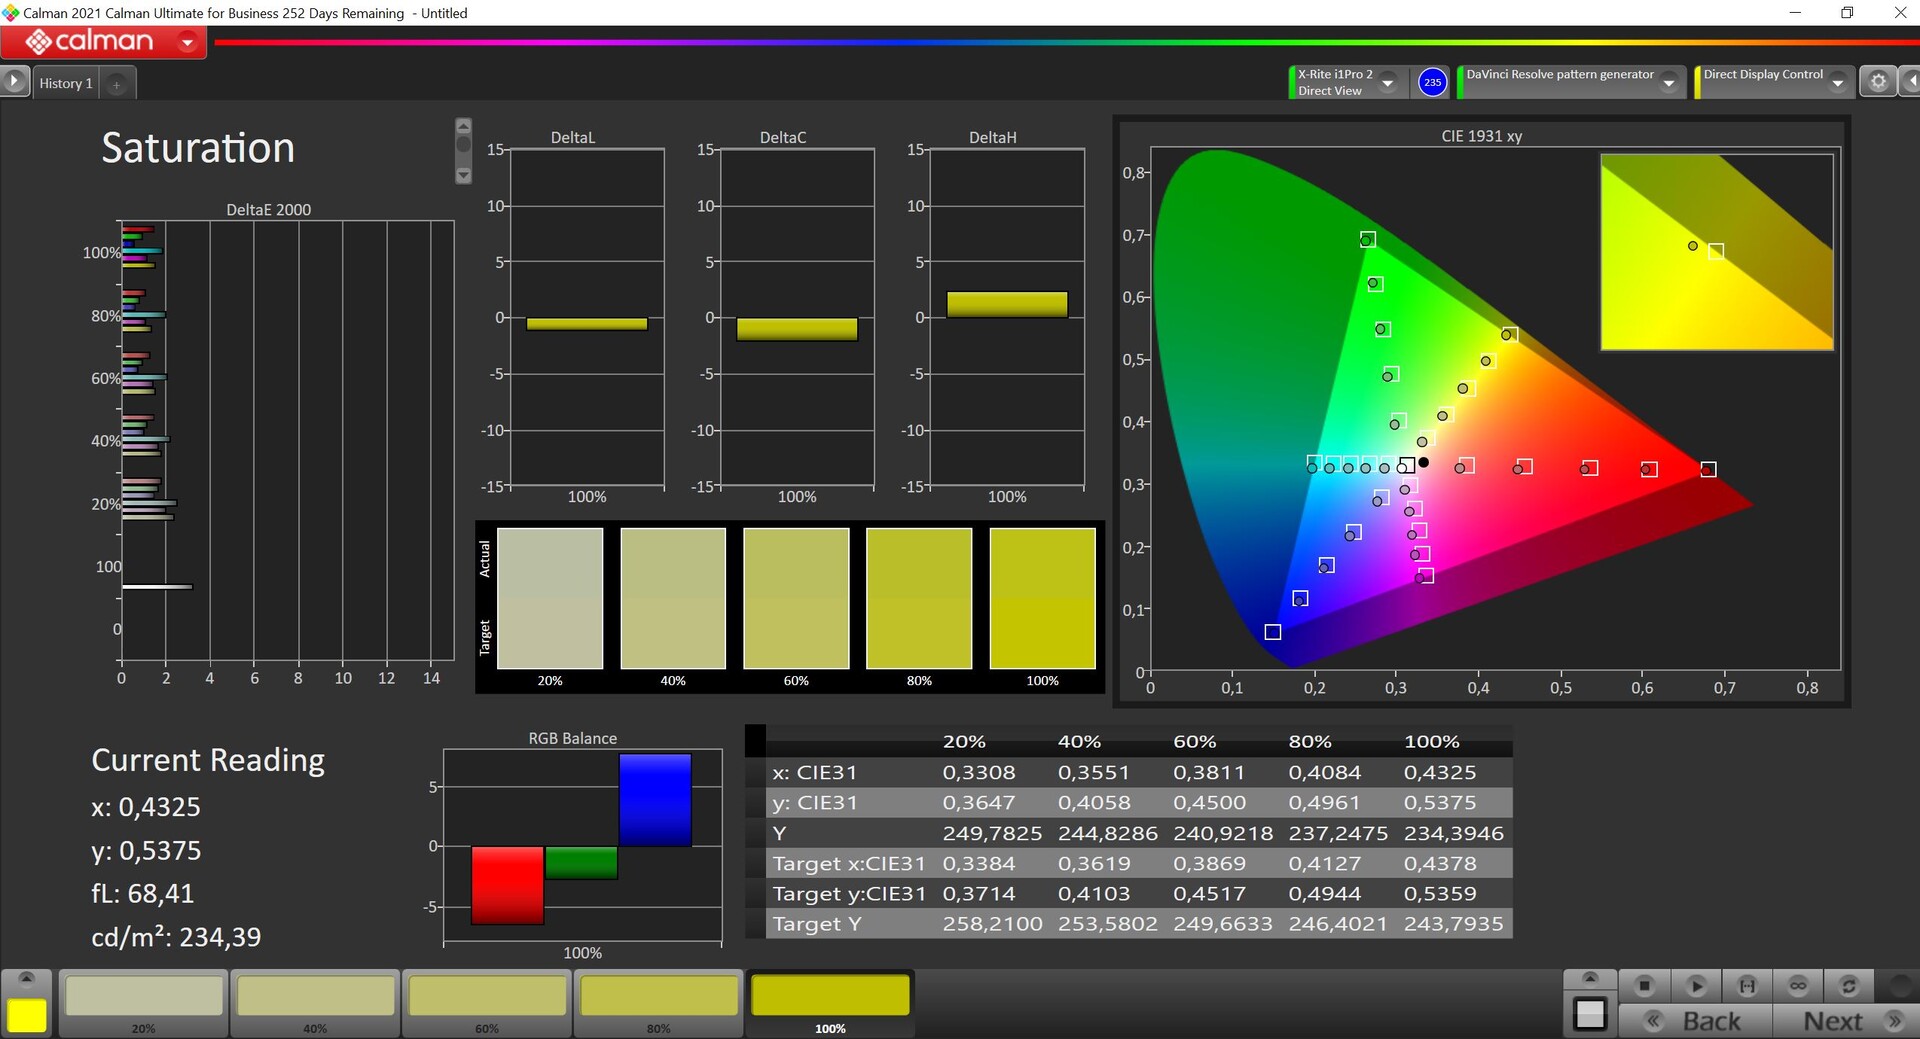
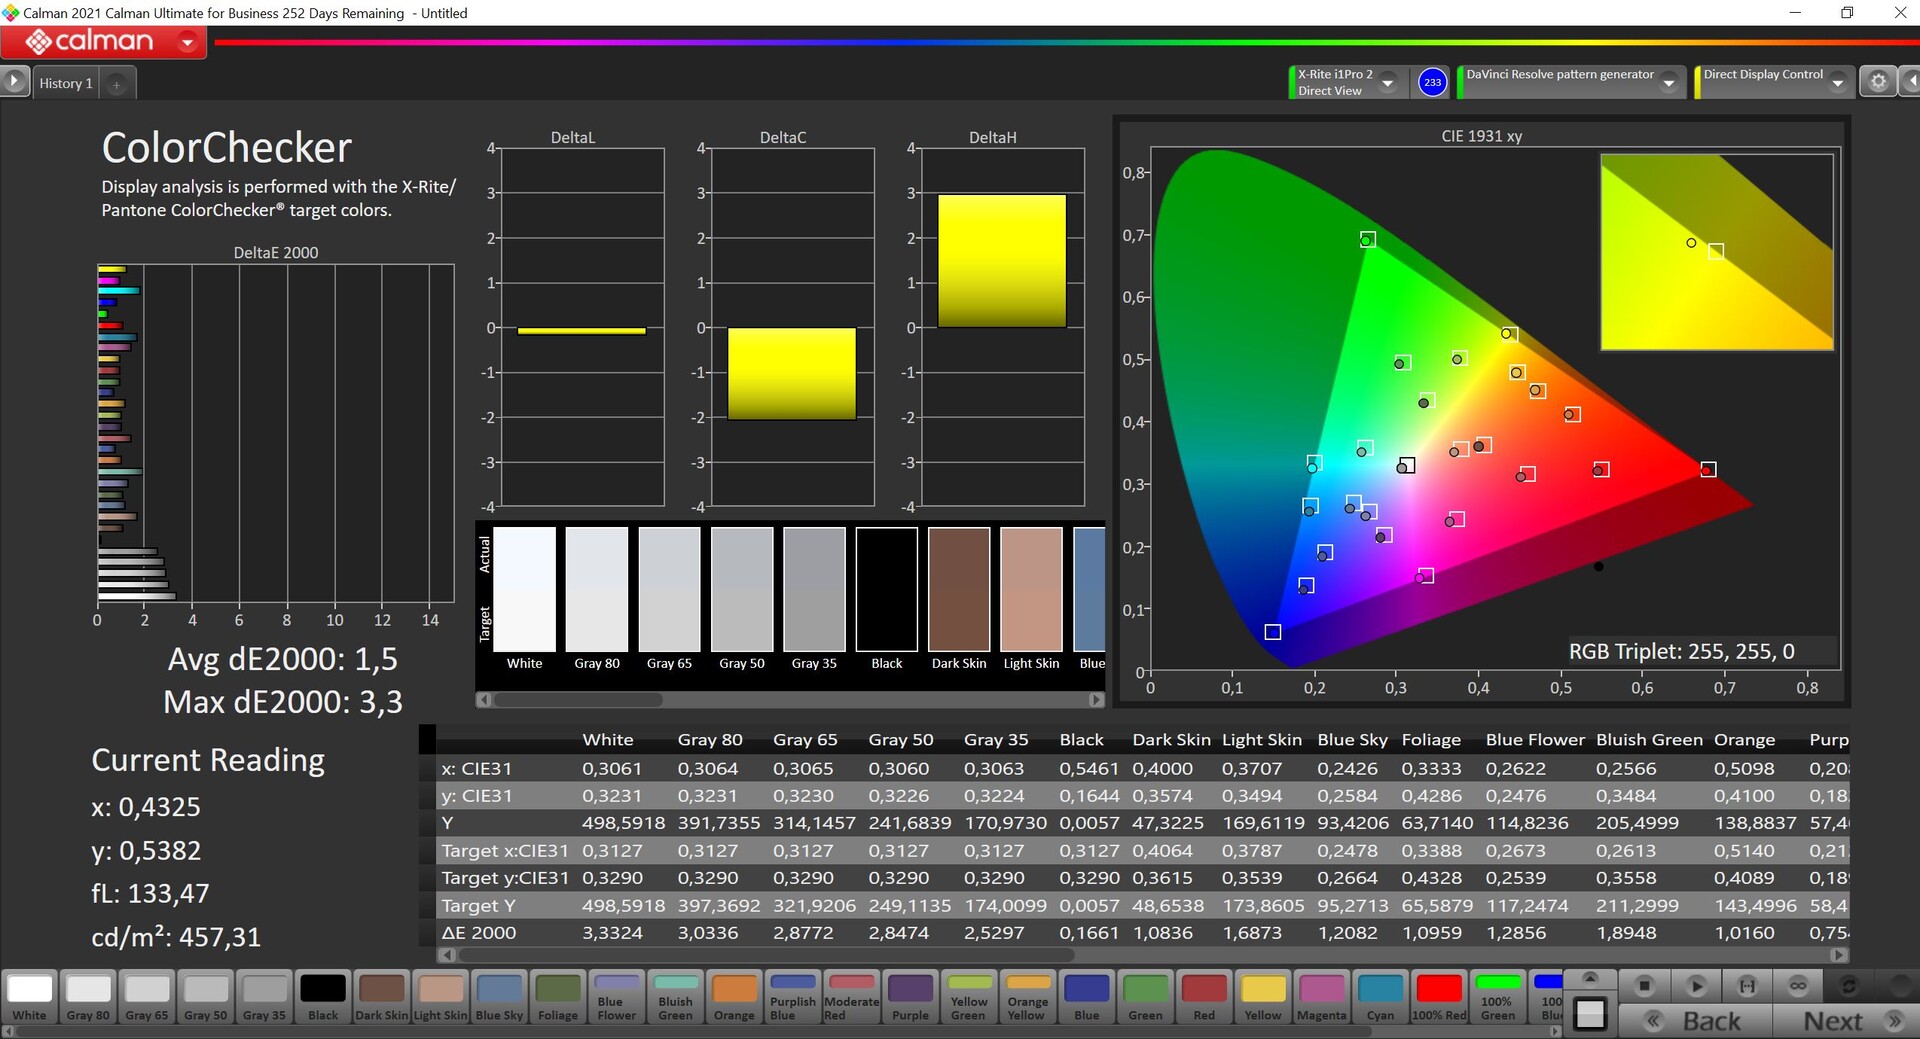
Our display analysis with the professional CalMAN software (X-Rite i1 Pro 2) shows that the panel is already calibrated very well out of the box. Neither the grayscale, nor the colors show DeltaE 2000 deviations of more than 3 compared to the P3 reference color space, which is covered completely. Only the color temperature is slightly too cool and there is a minimal blue cast, but this is almost invisible with the naked eye. We cannot calibrate the panel with our tools, which means we cannot offer a corresponding display profile and the color space measurements were taken from CalMAN.
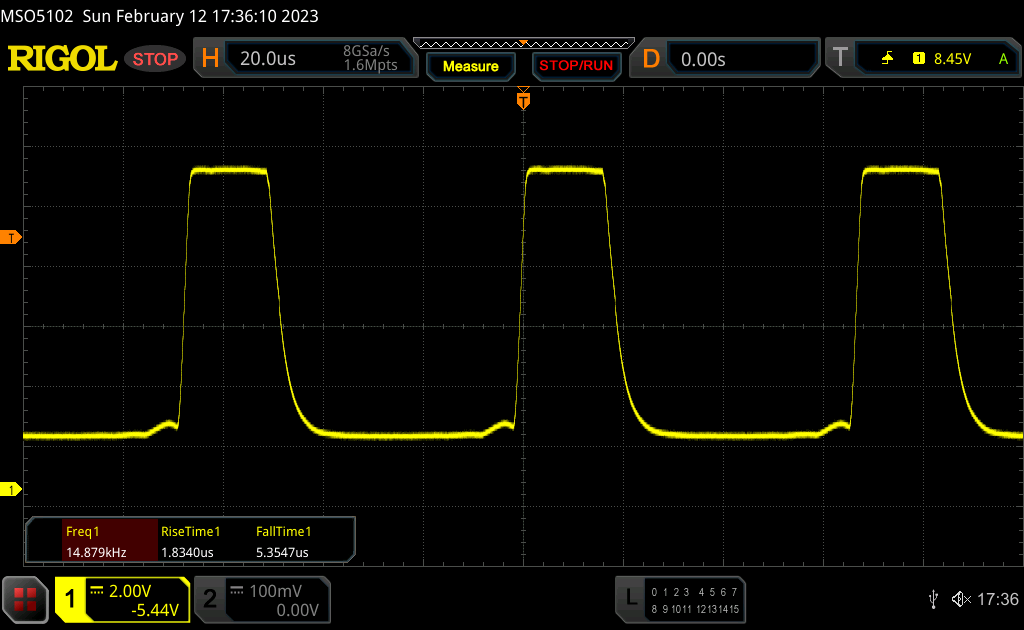
Display Response Times
| ↔ Response Time Black to White | ||
|---|---|---|
| 47.2 ms ... rise ↗ and fall ↘ combined | ↗ 20.6 ms rise | 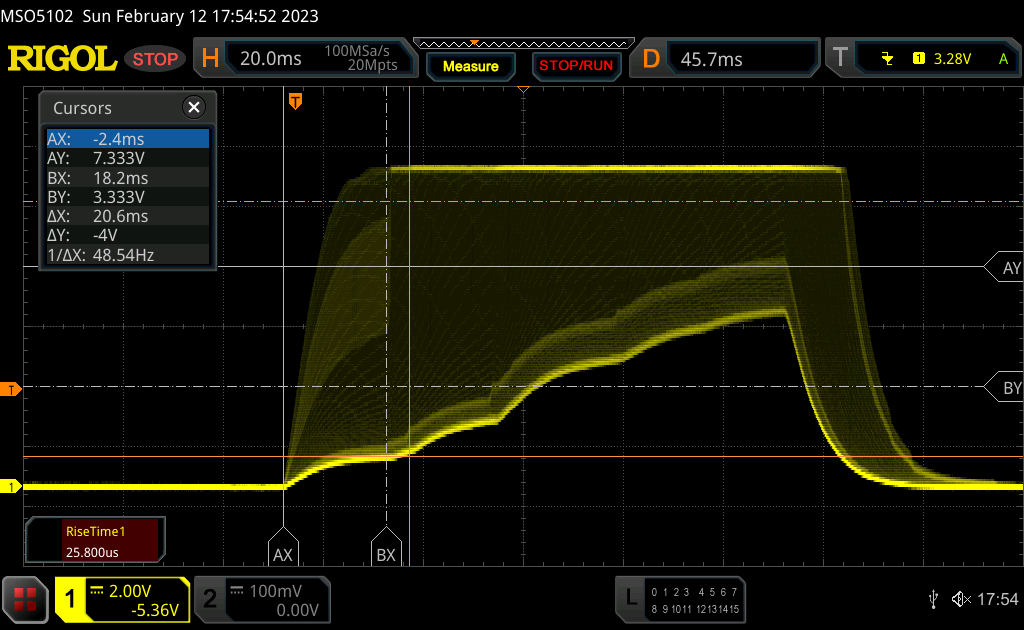 |
| ↘ 26.6 ms fall | ||
| The screen shows slow response rates in our tests and will be unsatisfactory for gamers. In comparison, all tested devices range from 0.1 (minimum) to 240 (maximum) ms. » 99 % of all devices are better. This means that the measured response time is worse than the average of all tested devices (20.1 ms). | ||
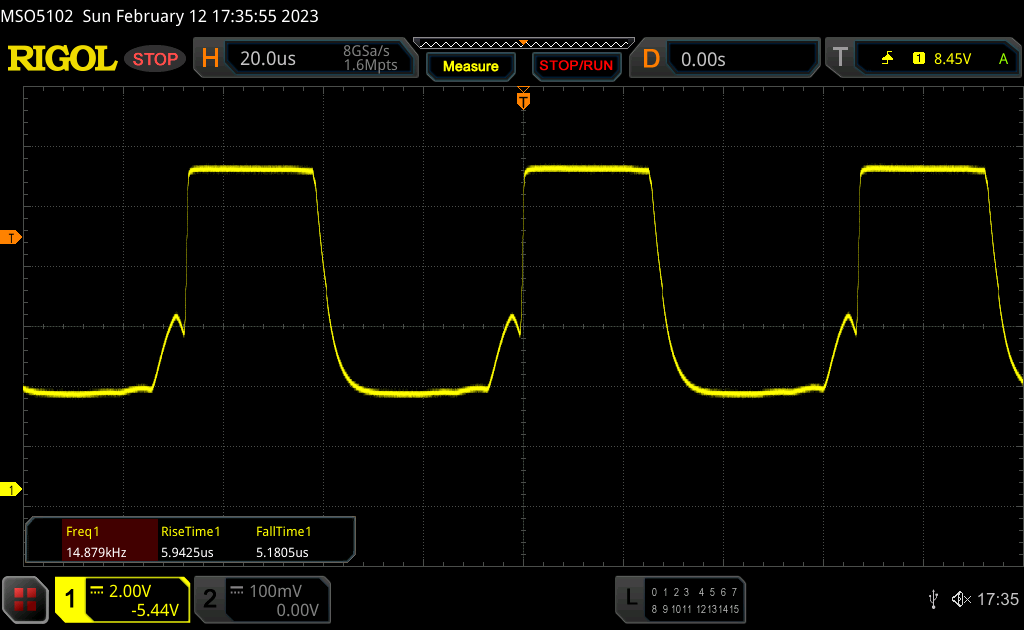
| ↔ Response Time 50% Grey to 80% Grey | ||
| 80.5 ms ... rise ↗ and fall ↘ combined | ↗ 38.5 ms rise | 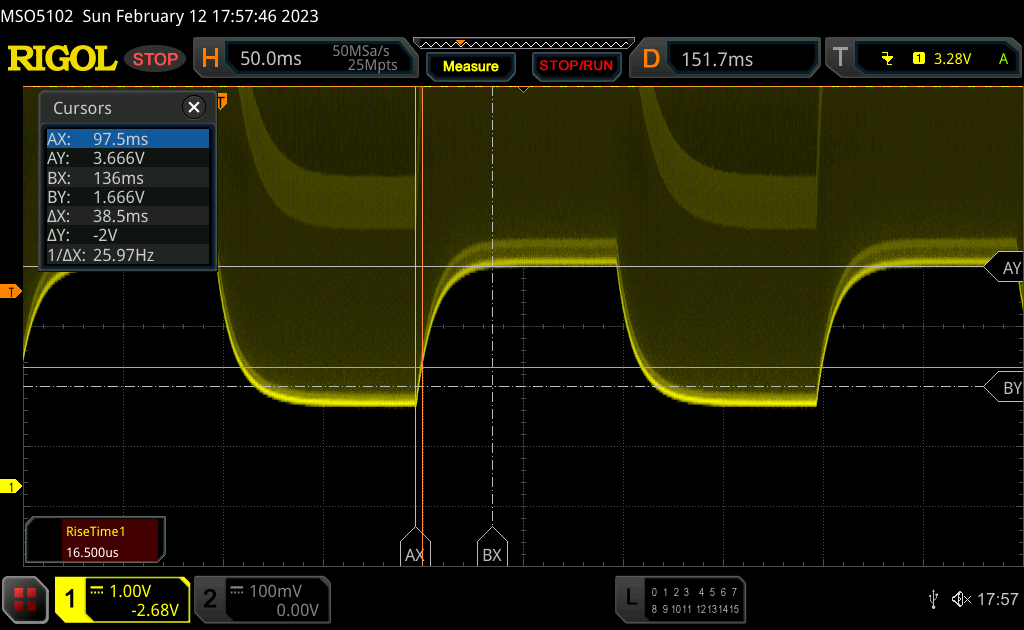 |
| ↘ 42 ms fall | ||
| The screen shows slow response rates in our tests and will be unsatisfactory for gamers. In comparison, all tested devices range from 0.165 (minimum) to 636 (maximum) ms. » 99 % of all devices are better. This means that the measured response time is worse than the average of all tested devices (31.4 ms). | ||
Screen Flickering / PWM (Pulse-Width Modulation)
| Screen flickering / PWM detected | 14880 Hz | ≤ 100 % brightness setting | 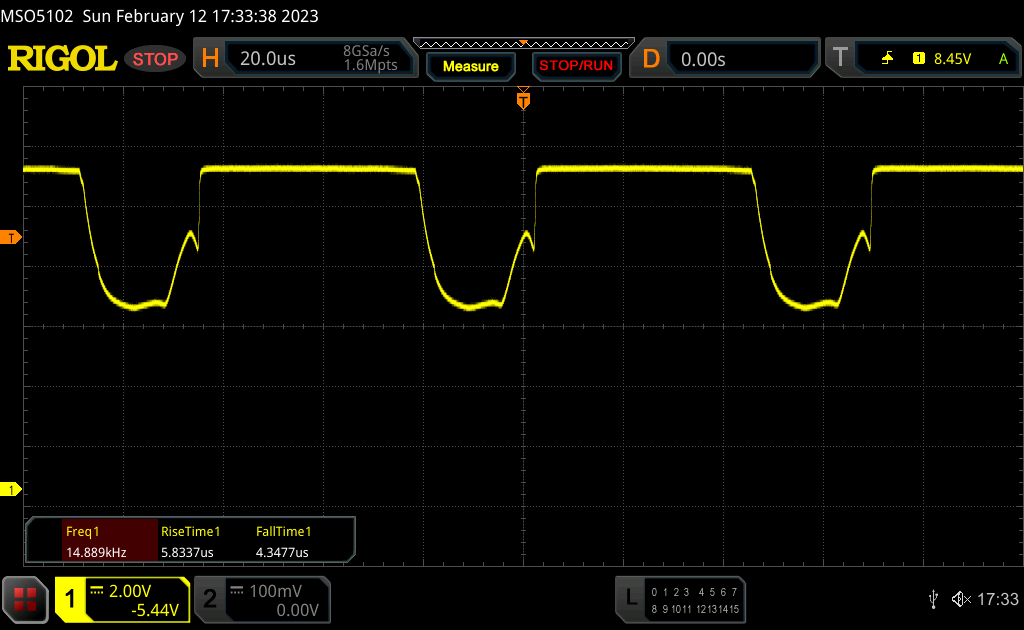 |
| ≤ 500 cd/m² brightness | |||
The display backlight flickers at 14880 Hz (worst case, e.g., utilizing PWM) Flickering detected at a brightness setting of 100 % (500 cd/m²) and below. There should be no flickering or PWM above this brightness setting. The frequency of 14880 Hz is quite high, so most users sensitive to PWM should not notice any flickering. Flickering occurs even at high brightness setting and may have an effect on the user during everyday use. In comparison: 53 % of all tested devices do not use PWM to dim the display. If PWM was detected, an average of 7986 (minimum: 5 - maximum: 343500) Hz was measured. | |||
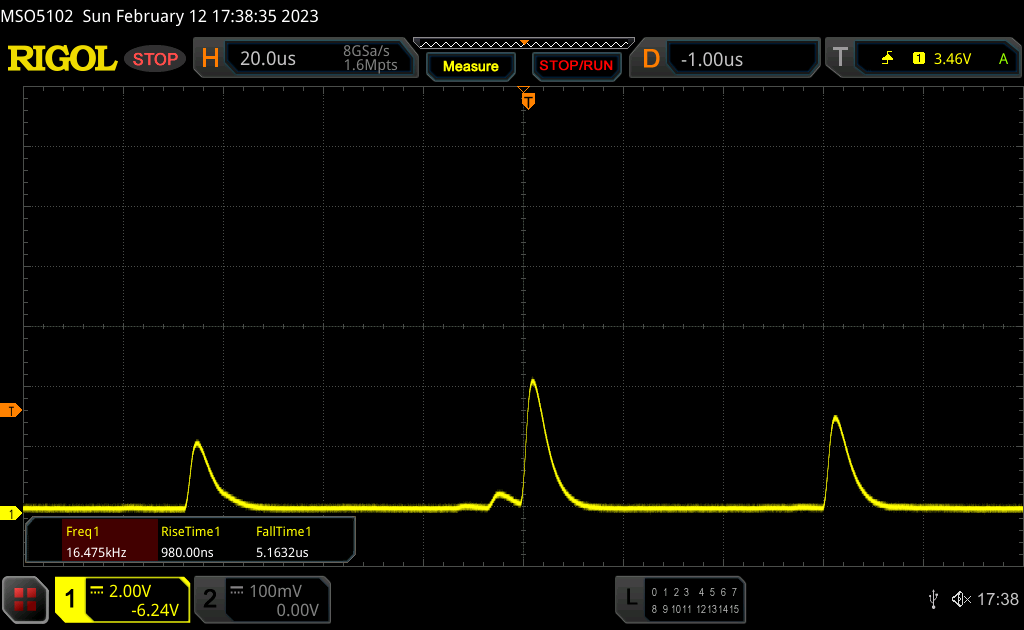
Similar to the smaller MBP 14 we can measure PWM at a frequency of 14.88 KHz, even at the maximum SDR brightness. However, the frequency is very high and should not cause problems for the majority of users. The PWM flickering makes it tricky to determine the response times, which also appear to be very slow. You can notice minor ghosting in practice (when you move the cursor, for example), but the higher refresh rate of 120 Hz helps with a smooth impression.

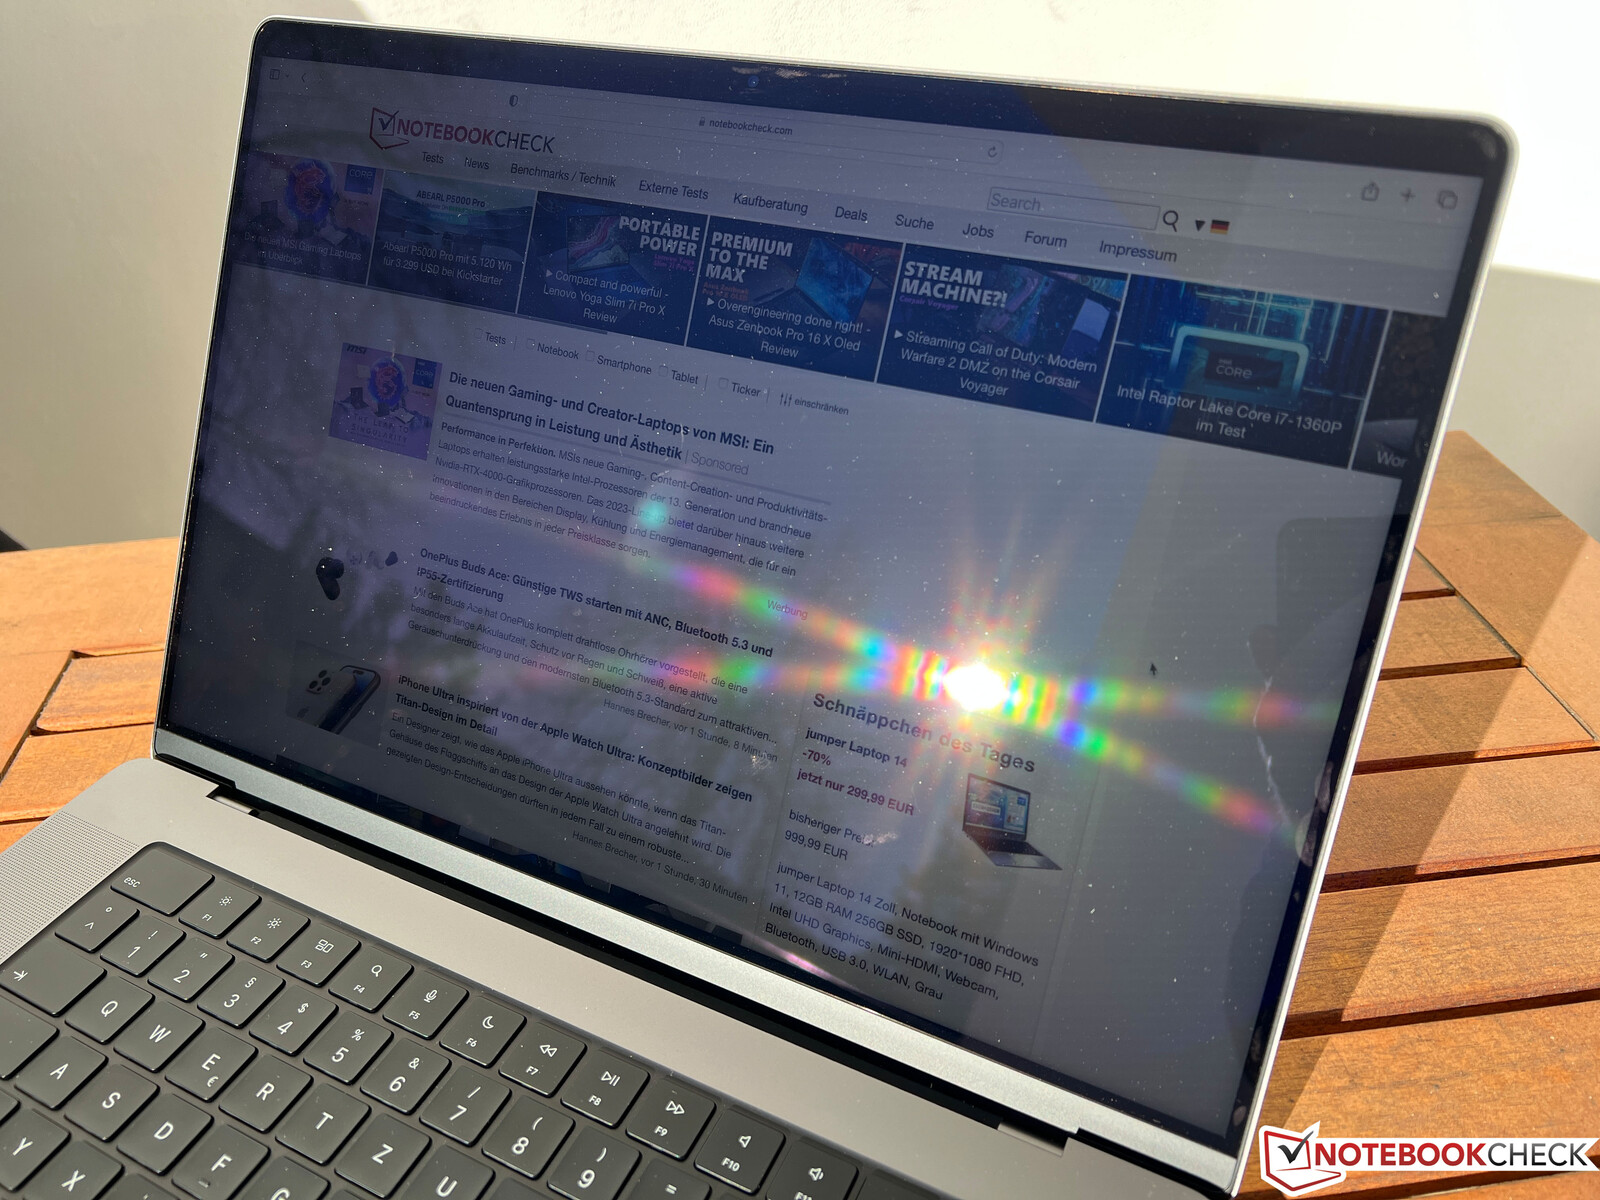
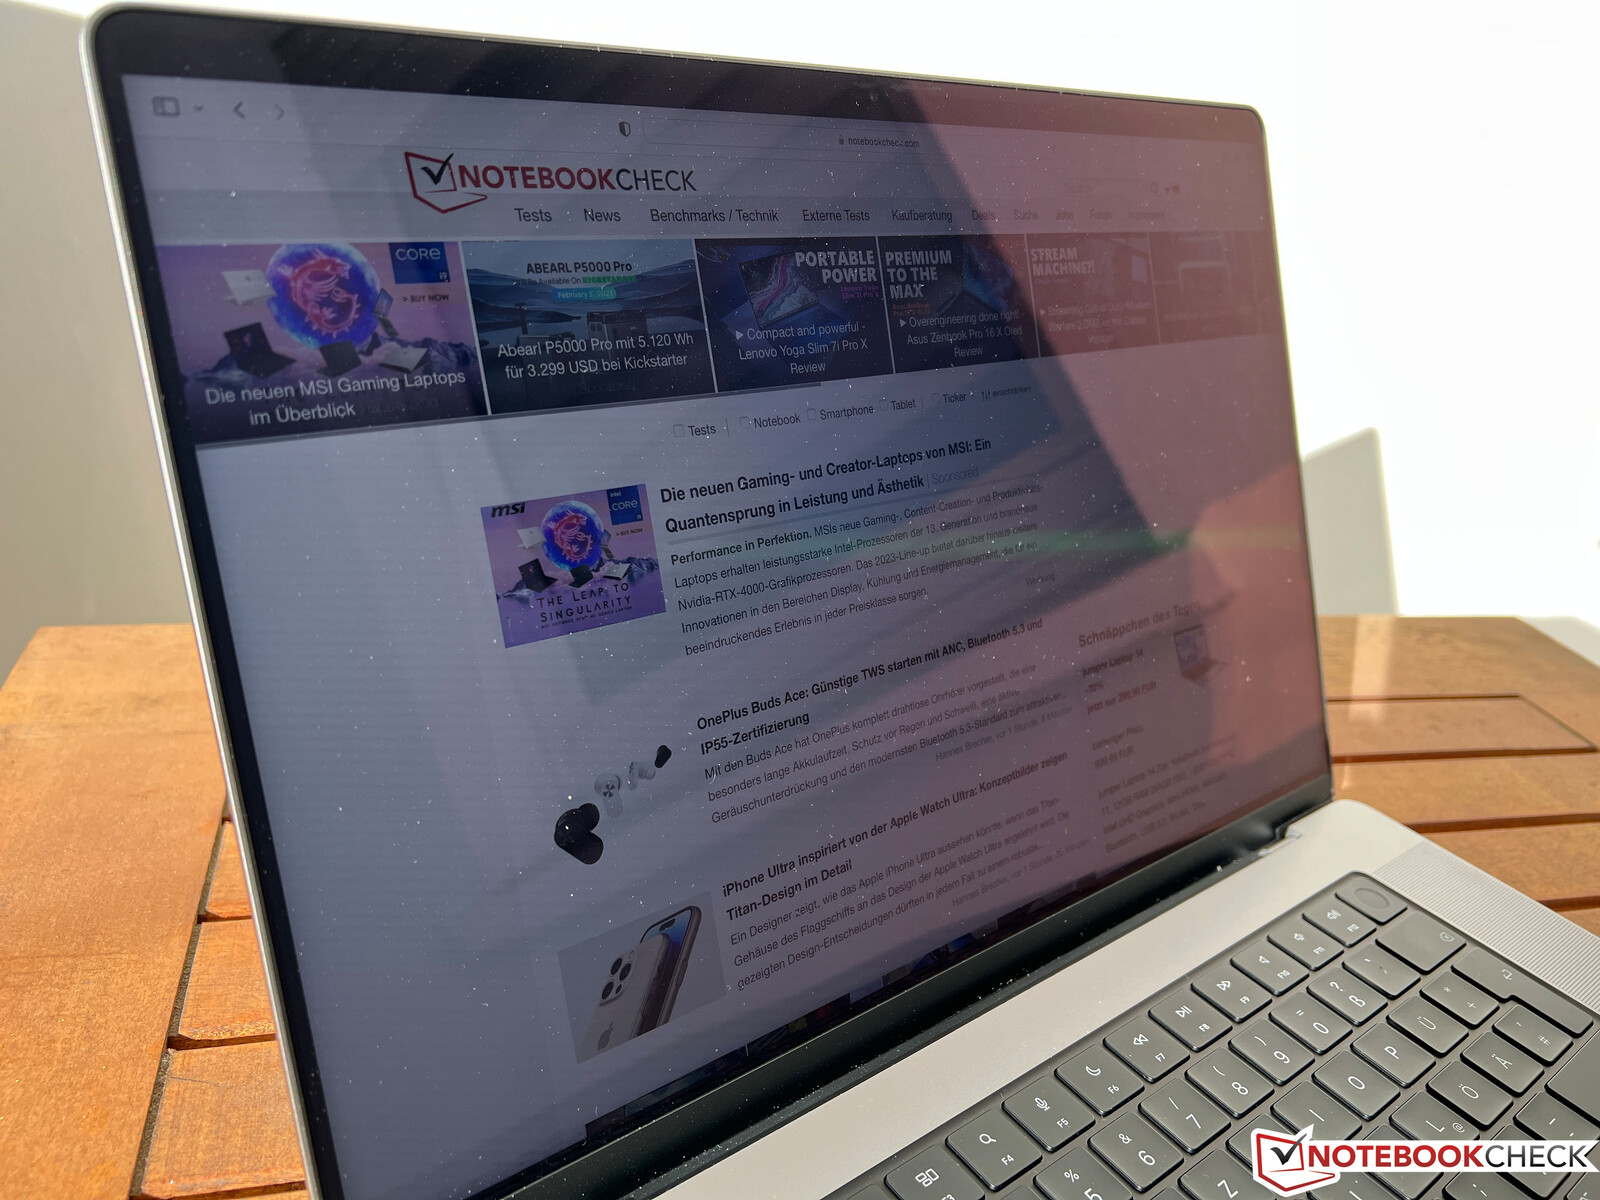
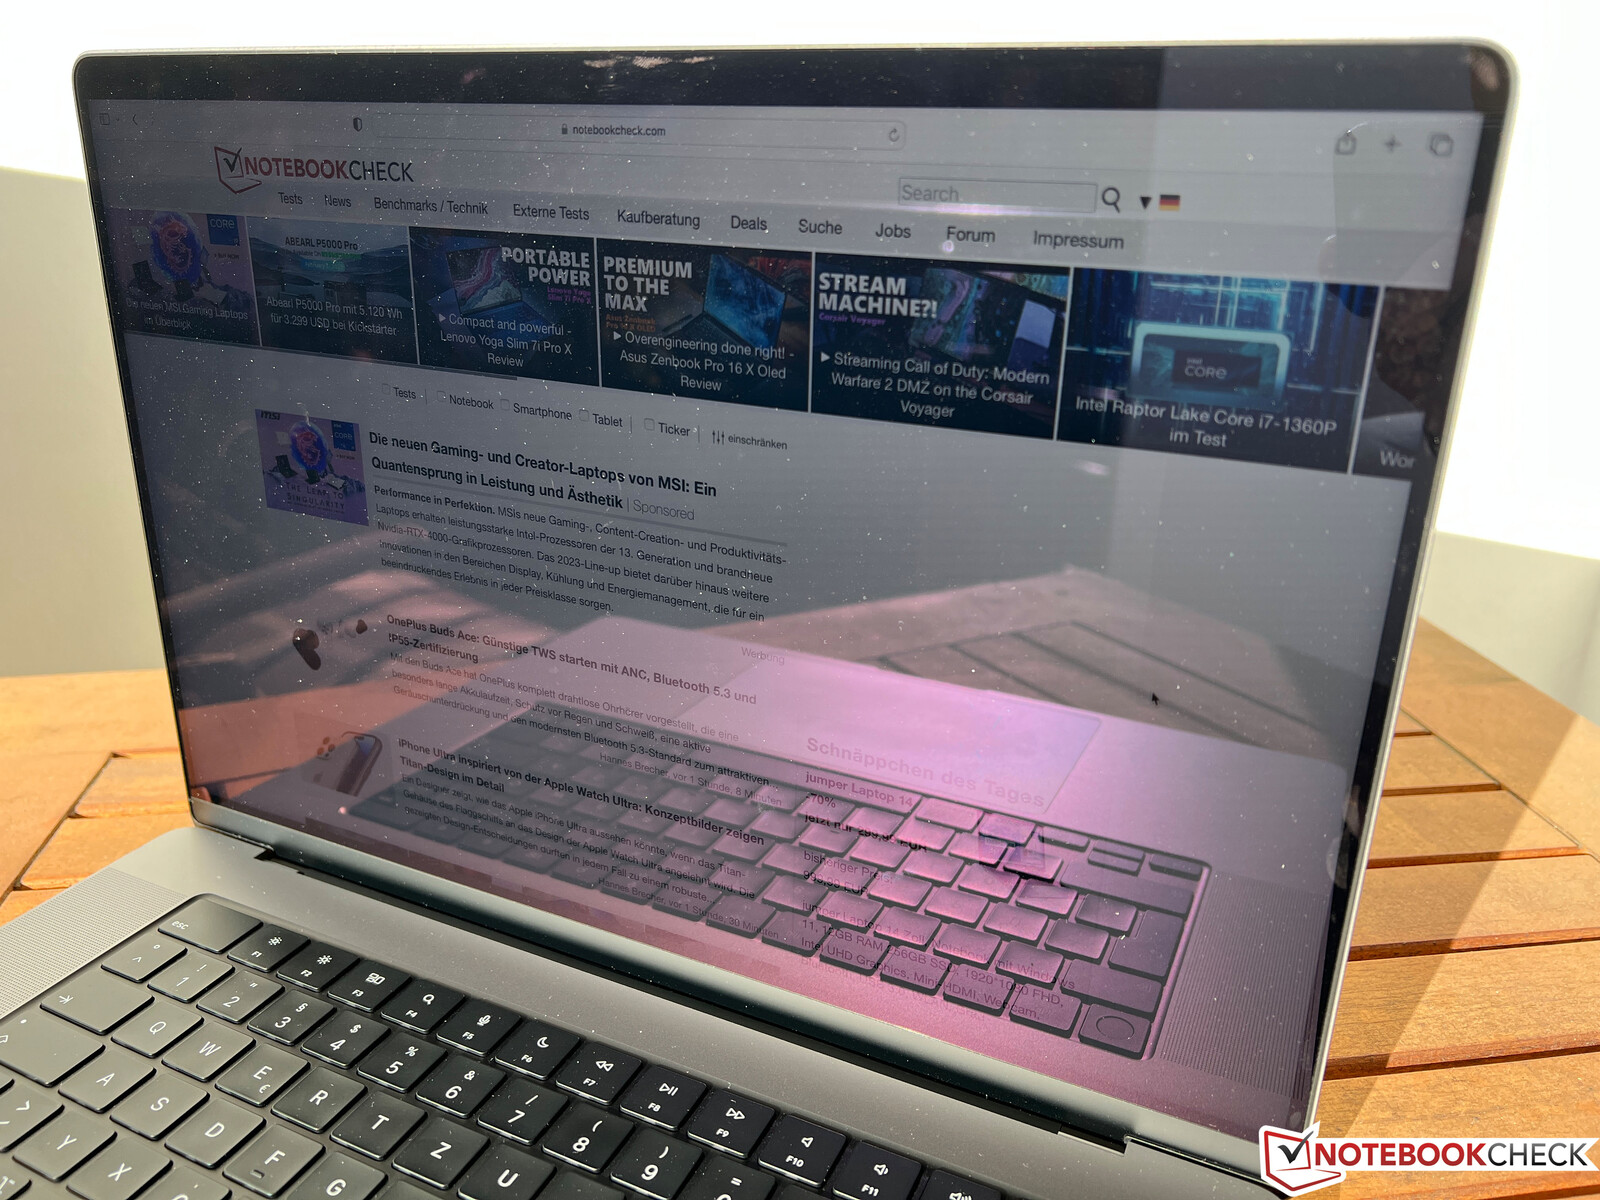
The MacBook Pro 16 uses a glossy screen, but it is not as reflective as many Windows laptops with glossy panels. You can also see the display contents very comfortably in brighter environments as long as you can avoid direct reflections from light sources or bright objects. There are also third-party apps like Vivid that let you use the maximum panel brightness even with SDR contents, which can also help outdoors. The viewing angle stability of the Mini-LED panel is very good.

Performance - M2 Max with 38 GPU cores

The new M2 Pro and M2 Max SoCs are still based on the same architecture as before and the chips are manufactured in an improved 5 nm process (N5P). The regular M2 chip, which was introduced last year with the new MacBook Air, already showed the general direction of the new SoCs. The number of performance cores is identical, but the number of efficiency cores was doubled from 2 to 4. The larger MacBook Pro 16 is only available with the full version of the M2 Pro (12 CPU cores & 19 GPU cores), while the base model of the MacBook Pro 14 uses a slower chip with two fewer P-cores.
| SoC | CPU cores | GPU cores | RAM | additional price |
|---|---|---|---|---|
| M2 Pro | 4 Efficiency cores & 8 Performance cores | 19 | 16 or 32 GB | |
| M2 Max | 4 Efficiency cores & 8 Performance cores | 30 | 32, 64 or 96 GB | 230 Euros |
| M2 Max | 4 Efficiency cores & 8 Performance cores | 38 | 32, 64 or 96 GB | 460 Euros |
The choice of SoCs is pretty simple in terms of CPU performance, because all three models of the MacBook Pro 16 will be identical. In theory, the performance cores of the M2 Max can reach a higher single-core Turbo of 3.69 GHz instead of 3.5 GHz for the M2 Pro (multi-core turbo 3.264 GHz for both SoCs), but we never saw more than 3.4 GHz during our benchmarks and we did not see any performance differences between our test models. The choice of the SoC is therefore based on demands in terms of GPU performance and/or RAM (64 and 96 GB are only available with the M2 Max).
Review Settings
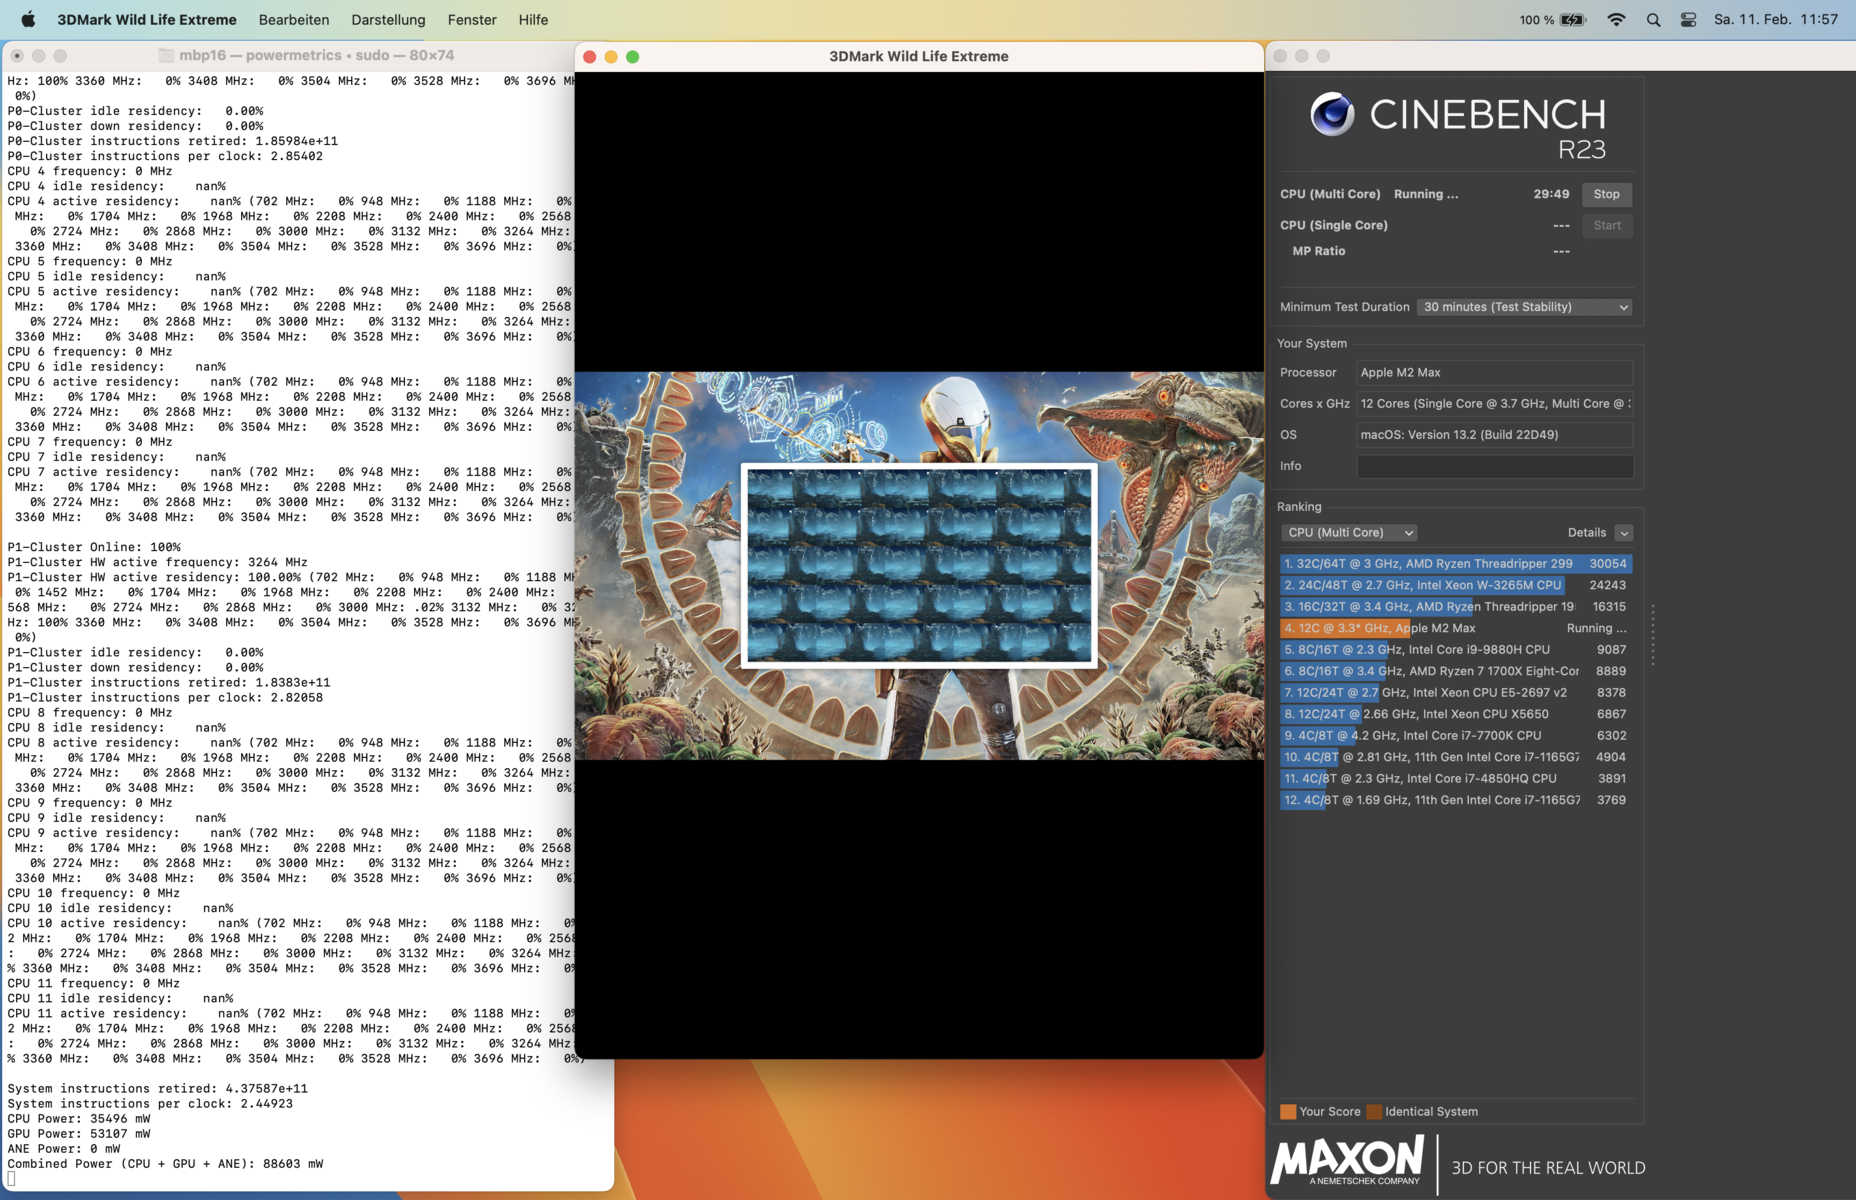
MacBook Pro models with the M2 Max SoCs once again offer an additional High Performance mode, but it does not increase the performance and only increases the fan speed instead. However, the temperatures are not critical by any means, so we performed all the following benchmarks and measurements with the default Automatic mode. The mode Low Charge limits the SoC performance to 22 Watts, but the fans will stay turned off.
Processor - 12 CPU cores
We already mentioned that the CPU performance of the new M2 Max does not differ from the M2 Pro we already reviewed in the smaller MacBook Pro 14. However, we can observe a slightly higher power consumption of 35-36 Watts (~34W for the M2 Pro). Apple managed to improve the performance both in emulated tests like Cinebench R15 as well as native benchmarks like Cinebench R23. We see an improvement of 6 % in R23 single and 20 % in the multi test.
The smaller MBP 14 performed well compared to the AMD and Intel competitors with comparatively low TDP values, but the 16-inch rivals generally offer more CPU performance thanks to higher power limits. Geekbench is the exception and the M2 Max is actually faster than the rivals in this benchmark.
Cinebench R15 Multi Loop
Our Cinebench R15 multi loop is emulated, but the test still shows that the performance is completely stable when you stress all cores. The biggest advantage over Windows rivals is that the CPU performance is not reduced on battery power (until the battery level drops to 3 %). More CPU benchmarks are listed in our tech section.
Cinebench R23: Multi Core | Single Core
Cinebench R20: CPU (Multi Core) | CPU (Single Core)
Cinebench R15: CPU Multi 64Bit | CPU Single 64Bit
Geekbench 5.5: Multi-Core | Single-Core
| CPU Performance rating | |
| Lenovo ThinkPad X1 Extreme G5-21DE003RGE | |
| Dell Precision 7000 7670 Performance | |
| Average of class Multimedia | |
| Asus ZenBook Pro 16X OLED UX7602ZM-ME115W | |
| Schenker Vision 16 Pro RTX 3070 Ti | |
| Apple MacBook Pro 16 2023 M2 Max | |
| Average Apple M2 Max | |
| Apple MacBook Pro 14 2023 M2 Pro | |
| Apple MacBook Pro 16 2021 M1 Max | |
| Cinebench R23 / Multi Core | |
| Lenovo ThinkPad X1 Extreme G5-21DE003RGE | |
| Asus ZenBook Pro 16X OLED UX7602ZM-ME115W | |
| Average of class Multimedia (4861 - 33362, n=81, last 2 years) | |
| Dell Precision 7000 7670 Performance | |
| Apple MacBook Pro 14 2023 M2 Pro | |
| Apple MacBook Pro 16 2023 M2 Max | |
| Average Apple M2 Max (14738 - 14767, n=2) | |
| Schenker Vision 16 Pro RTX 3070 Ti | |
| Apple MacBook Pro 16 2021 M1 Max | |
| Cinebench R23 / Single Core | |
| Average of class Multimedia (1128 - 2459, n=73, last 2 years) | |
| Lenovo ThinkPad X1 Extreme G5-21DE003RGE | |
| Schenker Vision 16 Pro RTX 3070 Ti | |
| Asus ZenBook Pro 16X OLED UX7602ZM-ME115W | |
| Apple MacBook Pro 14 2023 M2 Pro | |
| Average Apple M2 Max (1625 - 1662, n=2) | |
| Apple MacBook Pro 16 2023 M2 Max | |
| Apple MacBook Pro 16 2021 M1 Max | |
| Dell Precision 7000 7670 Performance | |
| Cinebench R20 / CPU (Multi Core) | |
| Lenovo ThinkPad X1 Extreme G5-21DE003RGE | |
| Dell Precision 7000 7670 Performance | |
| Average of class Multimedia (1887 - 12912, n=65, last 2 years) | |
| Asus ZenBook Pro 16X OLED UX7602ZM-ME115W | |
| Schenker Vision 16 Pro RTX 3070 Ti | |
| Average Apple M2 Max (4044 - 4085, n=2) | |
| Apple MacBook Pro 14 2023 M2 Pro | |
| Apple MacBook Pro 16 2023 M2 Max | |
| Apple MacBook Pro 16 2021 M1 Max | |
| Cinebench R20 / CPU (Single Core) | |
| Average of class Multimedia (420 - 853, n=65, last 2 years) | |
| Lenovo ThinkPad X1 Extreme G5-21DE003RGE | |
| Dell Precision 7000 7670 Performance | |
| Schenker Vision 16 Pro RTX 3070 Ti | |
| Asus ZenBook Pro 16X OLED UX7602ZM-ME115W | |
| Apple MacBook Pro 16 2023 M2 Max | |
| Average Apple M2 Max (451 - 460, n=2) | |
| Apple MacBook Pro 14 2023 M2 Pro | |
| Apple MacBook Pro 16 2021 M1 Max | |
| Cinebench R15 / CPU Multi 64Bit | |
| Lenovo ThinkPad X1 Extreme G5-21DE003RGE | |
| Dell Precision 7000 7670 Performance | |
| Schenker Vision 16 Pro RTX 3070 Ti | |
| Schenker Vision 16 Pro RTX 3070 Ti | |
| Asus ZenBook Pro 16X OLED UX7602ZM-ME115W | |
| Average of class Multimedia (856 - 5224, n=70, last 2 years) | |
| Average Apple M2 Max (2074 - 2094, n=2) | |
| Apple MacBook Pro 16 2023 M2 Max | |
| Apple MacBook Pro 14 2023 M2 Pro | |
| Apple MacBook Pro 16 2021 M1 Max | |
| Cinebench R15 / CPU Single 64Bit | |
| Average of class Multimedia (99.6 - 326, n=68, last 2 years) | |
| Dell Precision 7000 7670 Performance | |
| Asus ZenBook Pro 16X OLED UX7602ZM-ME115W | |
| Asus ZenBook Pro 16X OLED UX7602ZM-ME115W | |
| Schenker Vision 16 Pro RTX 3070 Ti | |
| Lenovo ThinkPad X1 Extreme G5-21DE003RGE | |
| Apple MacBook Pro 16 2023 M2 Max | |
| Average Apple M2 Max (233 - 239, n=2) | |
| Apple MacBook Pro 14 2023 M2 Pro | |
| Apple MacBook Pro 16 2021 M1 Max | |
| Geekbench 5.5 / Multi-Core | |
| Average Apple M2 Max (15348 - 15444, n=3) | |
| Apple MacBook Pro 16 2023 M2 Max | |
| Apple MacBook Pro 14 2023 M2 Pro | |
| Dell Precision 7000 7670 Performance | |
| Asus ZenBook Pro 16X OLED UX7602ZM-ME115W | |
| Apple MacBook Pro 16 2021 M1 Max | |
| Average of class Multimedia (4652 - 20422, n=65, last 2 years) | |
| Lenovo ThinkPad X1 Extreme G5-21DE003RGE | |
| Schenker Vision 16 Pro RTX 3070 Ti | |
| Geekbench 5.5 / Single-Core | |
| Apple MacBook Pro 16 2023 M2 Max | |
| Average Apple M2 Max (1965 - 1978, n=3) | |
| Apple MacBook Pro 14 2023 M2 Pro | |
| Dell Precision 7000 7670 Performance | |
| Average of class Multimedia (805 - 2974, n=65, last 2 years) | |
| Schenker Vision 16 Pro RTX 3070 Ti | |
| Asus ZenBook Pro 16X OLED UX7602ZM-ME115W | |
| Lenovo ThinkPad X1 Extreme G5-21DE003RGE | |
| Apple MacBook Pro 16 2021 M1 Max | |
System Performance
The new MacBook Pro 16 2023 with the M2 Max is once again an extremely responsive laptop, and the good performance is also shown by the benchmarks. Emulated apps usually run without any problems, either, even though many apps (including full Adobe suite, DaVinci Resolve, Microsoft Office) are available as native apps by now, and they are really fast. Subjectively, Photoshop even runs better on the MBP compared to the current MSI Titan GT77 with the Core i9-13950HX and the GeForce RTX 4090 Laptop, pretty the much the best mobile hardware you can currently get. The PugetBench results below are no representative for the actual performance since they only work with the emulated Intel versions of the apps, but we still include the results for comparison purposes.
Blackmagic RAW Speed Test: 12:1 8K Metal | 12:1 8K CPU
Photoshop PugetBench: Overall Score
Premiere Pro PugetBench: Overall Score 0.9
Jetstream 2: 2.0 Total Score
Speedometer 2.0: Result 2.0
Mozilla Kraken 1.1: Total
WebXPRT 3: Overall
WebXPRT 4: Overall
| CrossMark / Overall | |
| Apple MacBook Pro 16 2023 M2 Max | |
| Average Apple M2 Max, Apple M2 Max 38-Core GPU (n=1) | |
| Average of class Multimedia (866 - 2728, n=68, last 2 years) | |
| Dell Precision 7000 7670 Performance | |
| Asus ZenBook Pro 16X OLED UX7602ZM-ME115W | |
| Lenovo ThinkPad X1 Extreme G5-21DE003RGE | |
| Schenker Vision 16 Pro RTX 3070 Ti | |
| Apple MacBook Pro 16 2021 M1 Max | |
| CrossMark / Productivity | |
| Average of class Multimedia (913 - 2489, n=68, last 2 years) | |
| Dell Precision 7000 7670 Performance | |
| Asus ZenBook Pro 16X OLED UX7602ZM-ME115W | |
| Lenovo ThinkPad X1 Extreme G5-21DE003RGE | |
| Apple MacBook Pro 16 2023 M2 Max | |
| Average Apple M2 Max, Apple M2 Max 38-Core GPU (n=1) | |
| Schenker Vision 16 Pro RTX 3070 Ti | |
| Apple MacBook Pro 16 2021 M1 Max | |
| CrossMark / Creativity | |
| Apple MacBook Pro 16 2023 M2 Max | |
| Average Apple M2 Max, Apple M2 Max 38-Core GPU (n=1) | |
| Apple MacBook Pro 16 2021 M1 Max | |
| Average of class Multimedia (907 - 3465, n=68, last 2 years) | |
| Dell Precision 7000 7670 Performance | |
| Asus ZenBook Pro 16X OLED UX7602ZM-ME115W | |
| Lenovo ThinkPad X1 Extreme G5-21DE003RGE | |
| Schenker Vision 16 Pro RTX 3070 Ti | |
| CrossMark / Responsiveness | |
| Dell Precision 7000 7670 Performance | |
| Asus ZenBook Pro 16X OLED UX7602ZM-ME115W | |
| Lenovo ThinkPad X1 Extreme G5-21DE003RGE | |
| Average of class Multimedia (605 - 2024, n=68, last 2 years) | |
| Apple MacBook Pro 16 2023 M2 Max | |
| Average Apple M2 Max, Apple M2 Max 38-Core GPU (n=1) | |
| Schenker Vision 16 Pro RTX 3070 Ti | |
| Apple MacBook Pro 16 2021 M1 Max | |
| Blackmagic RAW Speed Test / 12:1 8K Metal | |
| Average of class Multimedia (78 - 430, n=7, last 2 years) | |
| Apple MacBook Pro 16 2023 M2 Max | |
| Average Apple M2 Max, Apple M2 Max 38-Core GPU (n=1) | |
| Apple MacBook Pro 16 2021 M1 Max | |
| Blackmagic RAW Speed Test / 12:1 8K CPU | |
| Average of class Multimedia (44 - 102, n=7, last 2 years) | |
| Apple MacBook Pro 16 2023 M2 Max | |
| Average Apple M2 Max, Apple M2 Max 38-Core GPU (n=1) | |
| Apple MacBook Pro 16 2021 M1 Max | |
| Photoshop PugetBench / Overall Score | |
| Apple MacBook Pro 16 2023 M2 Max | |
| Average Apple M2 Max, Apple M2 Max 38-Core GPU (n=1) | |
| Apple MacBook Pro 16 2021 M1 Max | |
| Premiere Pro PugetBench / Overall Score 0.9 | |
| Apple MacBook Pro 16 2023 M2 Max | |
| Average Apple M2 Max, Apple M2 Max 38-Core GPU (n=1) | |
| Apple MacBook Pro 16 2021 M1 Max | |
| Jetstream 2 / 2.0 Total Score | |
| Average of class Multimedia (261 - 481, n=39, last 2 years) | |
| Dell Precision 7000 7670 Performance | |
| Schenker Vision 16 Pro RTX 3070 Ti | |
| Apple MacBook Pro 16 2023 M2 Max | |
| Average Apple M2 Max, Apple M2 Max 38-Core GPU (n=1) | |
| Lenovo ThinkPad X1 Extreme G5-21DE003RGE | |
| Apple MacBook Pro 16 2021 M1 Max | |
| Speedometer 2.0 / Result 2.0 | |
| Average of class Multimedia (337 - 946, n=38, last 2 years) | |
| Apple MacBook Pro 16 2023 M2 Max | |
| Average Apple M2 Max, Apple M2 Max 38-Core GPU (n=1) | |
| Schenker Vision 16 Pro RTX 3070 Ti | |
| Apple MacBook Pro 16 2021 M1 Max | |
| Lenovo ThinkPad X1 Extreme G5-21DE003RGE | |
| Mozilla Kraken 1.1 / Total | |
| Schenker Vision 16 Pro RTX 3070 Ti | |
| Lenovo ThinkPad X1 Extreme G5-21DE003RGE | |
| Asus ZenBook Pro 16X OLED UX7602ZM-ME115W | |
| Dell Precision 7000 7670 Performance | |
| Average of class Multimedia (228 - 835, n=74, last 2 years) | |
| Apple MacBook Pro 16 2023 M2 Max | |
| Average Apple M2 Max, Apple M2 Max 38-Core GPU (n=1) | |
| Apple MacBook Pro 16 2021 M1 Max | |
| WebXPRT 3 / Overall | |
| Apple MacBook Pro 16 2023 M2 Max | |
| Average Apple M2 Max, Apple M2 Max 38-Core GPU (n=1) | |
| Apple MacBook Pro 16 2021 M1 Max | |
| Average of class Multimedia (136.4 - 596, n=71, last 2 years) | |
| Dell Precision 7000 7670 Performance | |
| Asus ZenBook Pro 16X OLED UX7602ZM-ME115W | |
| Schenker Vision 16 Pro RTX 3070 Ti | |
| Lenovo ThinkPad X1 Extreme G5-21DE003RGE | |
| WebXPRT 4 / Overall | |
| Average of class Multimedia (167.3 - 402, n=71, last 2 years) | |
| Dell Precision 7000 7670 Performance | |
| Asus ZenBook Pro 16X OLED UX7602ZM-ME115W | |
| Schenker Vision 16 Pro RTX 3070 Ti | |
| Apple MacBook Pro 16 2023 M2 Max | |
| Average Apple M2 Max, Apple M2 Max 38-Core GPU (n=1) | |
| Lenovo ThinkPad X1 Extreme G5-21DE003RGE | |
* ... smaller is better
Storage Devices
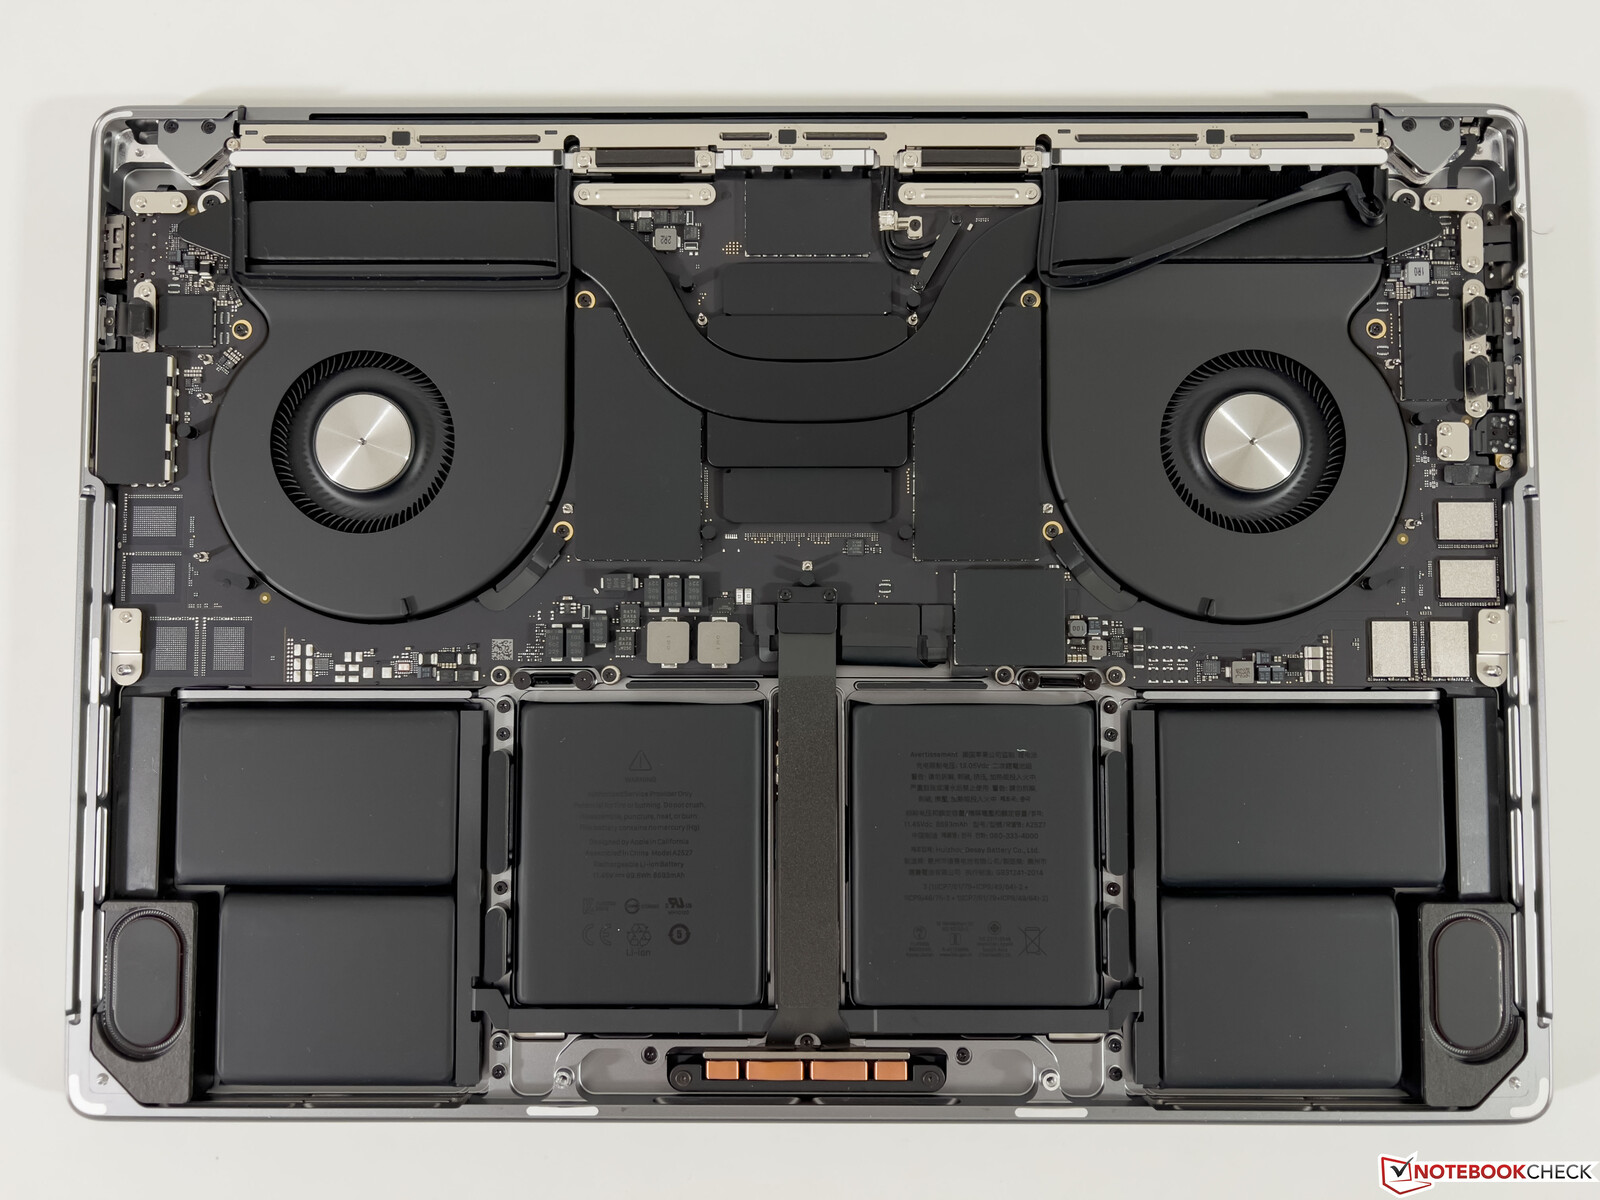
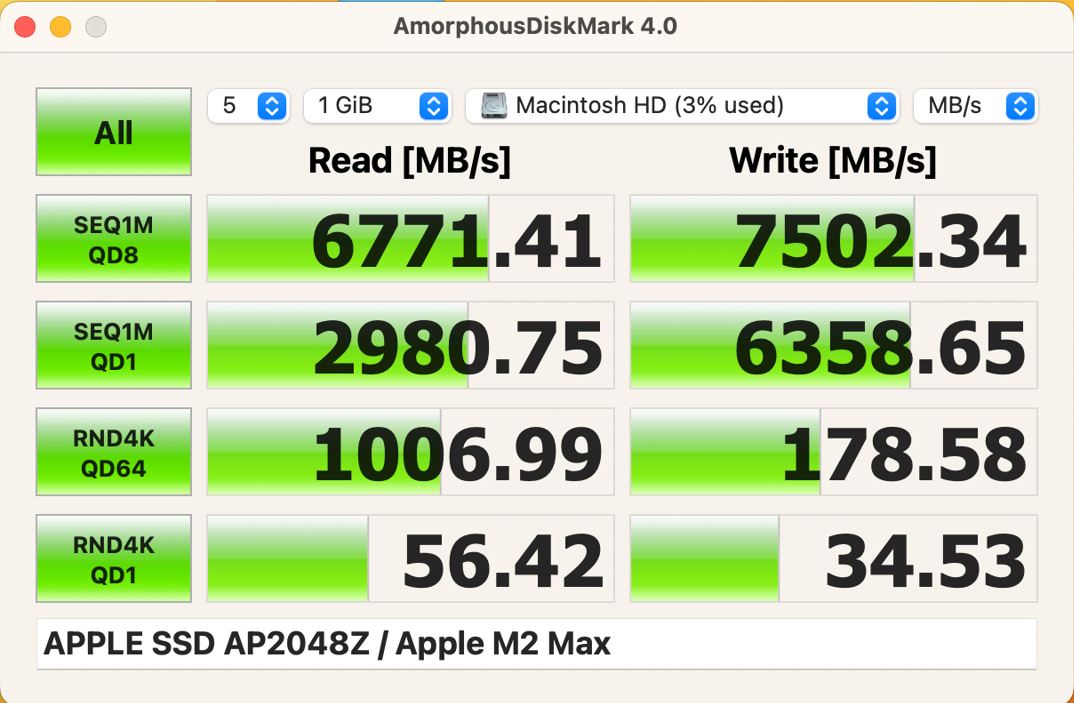
Our review unit is equipped with the 2 TB SSD, which is realized with four 512 GB chips. The other side of the mainboard has four more spaces for SSD chips, which allows up to 4 TB with 512 GB chips. Only the 8 TB model of the MacBook Pro will utilize 1 TB chips. The performance of the PCIe 4.0 SSD is very good; more SSD benchmarks are listed here.
GPU Performance
Apple changed the core configuration for the processor as well as the GPUs and increased the number of cores. The M2 Max SoCs are available with 30 or 38 GPU cores clocked at up to 1.4 GHz. We can see an improvement of 24-28 % over the old M1 Max with 32 GPU cores in most benchmarks, but the power consumption also increased from 44 up to 64 Watts. However, we only recorded this GPU consumption in the Novabench GPU tests, all other benchmarks topped out at 54W and we usually saw between 46-48W in most tests, so the overall efficiency is better than before. But it also shows that it is not easy to utilize the full potential of the GPU.
Native benchmarks like 3DMark Wildlife Extreme Unlimited show that the M2 Max GPU can even compete with RTX 3080 (Lenovo Legion 7 16) or RTX 3080 Ti laptops (Alienware x15), while the Geekbench performance is roughly on par with the RTX 3060.
The graphics performance is stable under sustained workloads and even on battery power, which is definitely an advantage over Windows laptops with discrete GPUs.
| GFXBench | |
| 3840x2160 4K Aztec Ruins High Tier Offscreen | |
| Apple MacBook Pro 16 2023 M2 Max | |
| Average Apple M2 Max 38-Core GPU (n=1) | |
| Apple MacBook Pro 16 2021 M1 Max | |
| Average of class Multimedia (36.4 - 232, n=13, last 2 years) | |
| 2560x1440 Aztec Ruins High Tier Offscreen | |
| Average Apple M2 Max 38-Core GPU (n=1) | |
| Apple MacBook Pro 16 2023 M2 Max | |
| Apple MacBook Pro 16 2021 M1 Max | |
| Average of class Multimedia (73.3 - 516, n=13, last 2 years) | |
| 1920x1080 Aztec Ruins Normal Tier Offscreen | |
| Apple MacBook Pro 16 2023 M2 Max | |
| Average Apple M2 Max 38-Core GPU (n=1) | |
| Apple MacBook Pro 16 2021 M1 Max | |
| Average of class Multimedia (178.3 - 1302, n=12, last 2 years) | |
| 1920x1080 Car Chase Offscreen | |
| Apple MacBook Pro 16 2023 M2 Max | |
| Average Apple M2 Max 38-Core GPU (n=1) | |
| Average of class Multimedia (174.6 - 941, n=10, last 2 years) | |
| Apple MacBook Pro 16 2021 M1 Max | |
| Blender / v3.3 Classroom METAL | |
| Apple MacBook Pro 14 2023 M2 Pro | |
| Apple MacBook Pro 16 2023 M2 Max | |
| Average Apple M2 Max 38-Core GPU (n=1) | |
| Average of class Multimedia (17.8 - 68, n=5, last 2 years) | |
| Blender / v3.3 Classroom OPTIX/RTX | |
| Lenovo ThinkPad X1 Extreme G5-21DE003RGE | |
| Average of class Multimedia (12 - 105, n=28, last 2 years) | |
| Asus ZenBook Pro 16X OLED UX7602ZM-ME115W | |
| Schenker Vision 16 Pro RTX 3070 Ti | |
| Dell Precision 7000 7670 Performance | |
| Blender / v3.3 Classroom CUDA | |
| Average of class Multimedia (20 - 186, n=28, last 2 years) | |
| Lenovo ThinkPad X1 Extreme G5-21DE003RGE | |
| Asus ZenBook Pro 16X OLED UX7602ZM-ME115W | |
| Schenker Vision 16 Pro RTX 3070 Ti | |
| Dell Precision 7000 7670 Performance | |
| Blender / v3.3 Classroom CPU | |
| Schenker Vision 16 Pro RTX 3070 Ti | |
| Average of class Multimedia (134.5 - 1042, n=68, last 2 years) | |
| Dell Precision 7000 7670 Performance | |
| Apple MacBook Pro 14 2023 M2 Pro | |
| Lenovo ThinkPad X1 Extreme G5-21DE003RGE | |
| Apple MacBook Pro 16 2023 M2 Max | |
| Average Apple M2 Max 38-Core GPU (n=1) | |
| Asus ZenBook Pro 16X OLED UX7602ZM-ME115W | |
* ... smaller is better
Gaming Performance
The gaming performance of the new M2 Max with 38 GPU cores is very good, but the biggest limitation is still the small number of native titles for Apple’s own M1/M2 silicon and the limited compatibility with other titles that are emulated via Rosetta 2 or run via additional applications like CrossWare, which allows you play some Windows games.
Resident Evil Village is certainly the best example for a native Apple silicon title right now, which runs completely smooth in 1080p and maximum details (100-140 fps) and the performance is roughly comparable to a GeForce RTX 3060 Mobile. Apple also advertises an optimized version of No man’s Sky for quite a while, but there is still no release date.
Popular Windows titles like Grand Theft Auto or The Witcher 3 also runs smoothly with high details, but you have to be careful with some settings. For example, we were not able to use our Ultra preset for GTA V and the same applies for Witcher 3, because the game crashes when Nvidia HairWorks is active. HBAO also creates a problem where areas are too dark, so you can only use SSAO. Once you have these two settings turned off, the game runs extremely well at 70-80 fps and the performance is very stable. We cannot record the fps numbers and the number of titles with integrated benchmarks is limited, so we only have a small number of results.
| GTA V - 1920x1080 High/On (Advanced Graphics Off) AA:2xMSAA + FX AF:8x | |
| Schenker Vision 16 Pro RTX 3070 Ti | |
| Asus ZenBook Pro 16X OLED UX7602ZM-ME115W | |
| Dell Precision 7000 7670 Performance | |
| Lenovo ThinkPad X1 Extreme G5-21DE003RGE | |
| Average of class Multimedia (19.5 - 186.1, n=56, last 2 years) | |
| Apple MacBook Pro 16 2023 M2 Max | |
| Average Apple M2 Max 38-Core GPU (n=1) | |
| The Witcher 3 - 1920x1080 High Graphics & Postprocessing (Nvidia HairWorks Off) | |
| Dell Precision 7000 7670 Performance | |
| Schenker Vision 16 Pro RTX 3070 Ti | |
| Lenovo ThinkPad X1 Extreme G5-21DE003RGE | |
| Asus ZenBook Pro 16X OLED UX7602ZM-ME115W | |
| Average of class Multimedia (22 - 242, n=22, last 2 years) | |
| Apple MacBook Pro 16 2023 M2 Max | |
| Average Apple M2 Max 38-Core GPU (n=1) | |
| Apple MacBook Pro 14 2023 M2 Pro | |
| Borderlands 3 - 1920x1080 High Overall Quality (DX11) | |
| Dell Precision 7000 7670 Performance | |
| Apple MacBook Pro 16 2023 M2 Max | |
| Average Apple M2 Max 38-Core GPU (n=1) | |
| Apple MacBook Pro 16 2021 M1 Max | |
| Apple MacBook Pro 14 2023 M2 Pro | |
| Apple MacBook Pro 16 2021 M1 Pro | |
Compared to the M1 Max with 32 GPU cores, the new M2 Max is around 25 % faster in emulated titles. You can play games like GTA V and Witcher 3, but you clearly notice that they are not optimized. They run very well (especially Witcher 3), but GeForce GPUs are just superior.
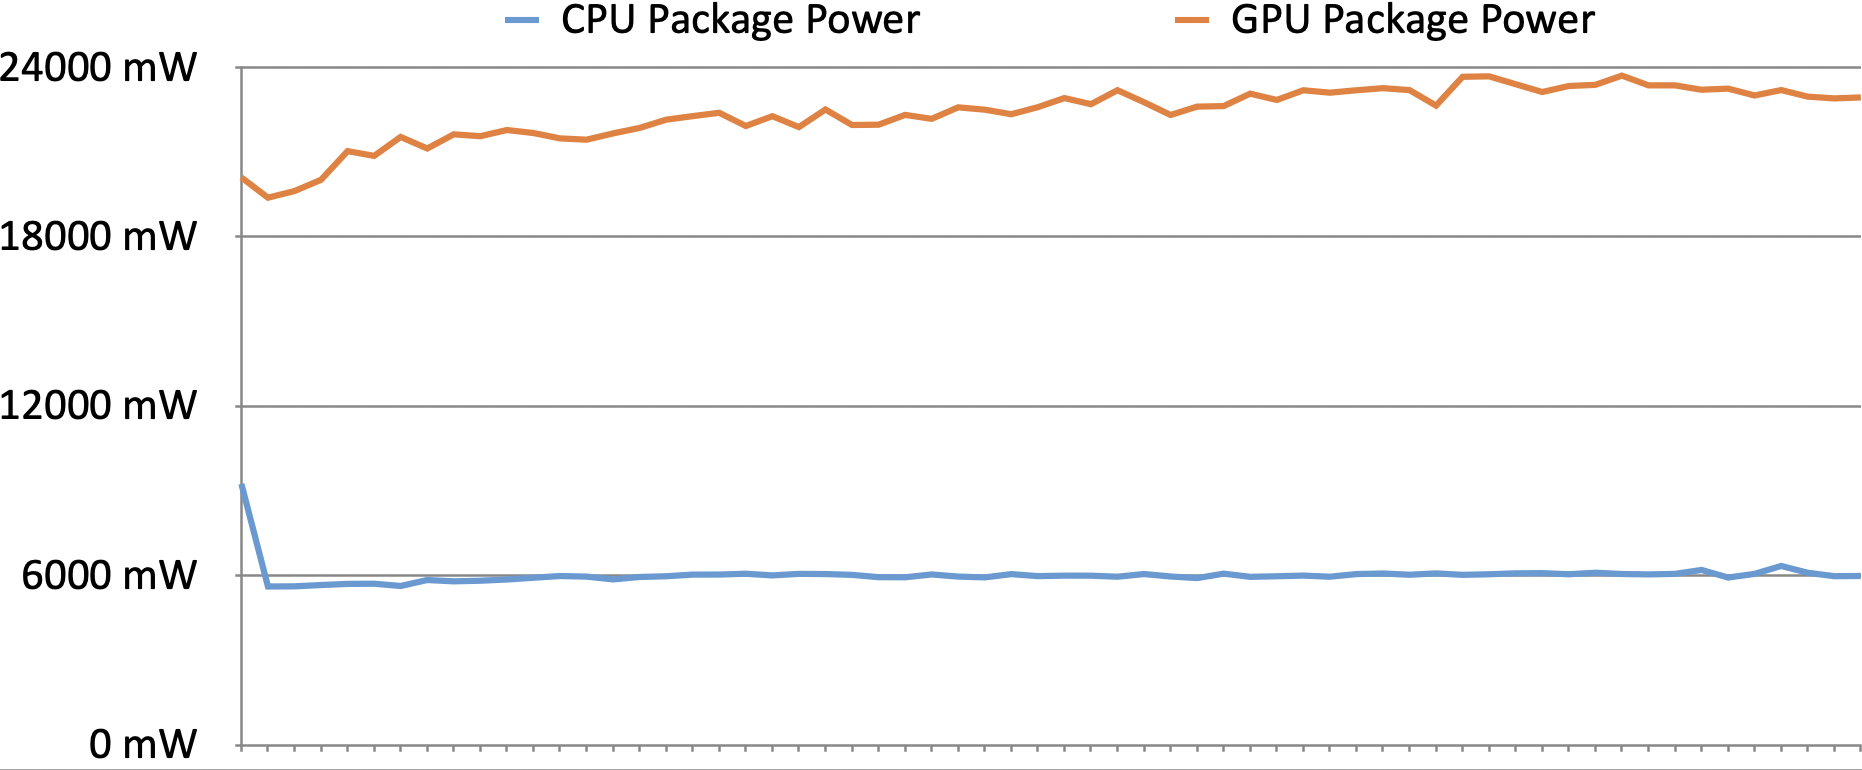
A look at the power consumption shows that the M2 Max is very efficient, because the CPU only consumes around 6W and the GPU between 19-24W in Witcher 3. This means the MacBook Pro 16 is 65-79% more efficient than the two comparison devices Schenker Vision 16 Pro and Lenovo ThinkPad X1 Extreme G5. (Note: Due to the slightly changed settings, the results are not perfectly comparable and the advantage of the MBP would be a bit smaller at identical settings, but it still gives us a good idea of the efficiency).
| Power Consumption - Witcher 3 ultra Efficiency (external Monitor) | |
| Apple MacBook Pro 14 2023 M2 Pro | |
| Apple MacBook Pro 16 2023 M2 Max | |
| Schenker Vision 16 Pro RTX 3070 Ti | |
| Lenovo ThinkPad X1 Extreme G5-21DE003RGE | |
| low | med. | high | ultra | QHD | |
|---|---|---|---|---|---|
| GTA V (2015) | 84 | 81 | 57 | ||
| The Witcher 3 (2015) | 83 | 76 | |||
| Shadow of the Tomb Raider (2018) | 182 | 131 | 122 | 109 | 78 |
| Total War: Three Kingdoms (2019) | 330 | 147 | 96 | 71 | 47 |
| Borderlands 3 (2019) | 72 | 60.2 | 48.6 |
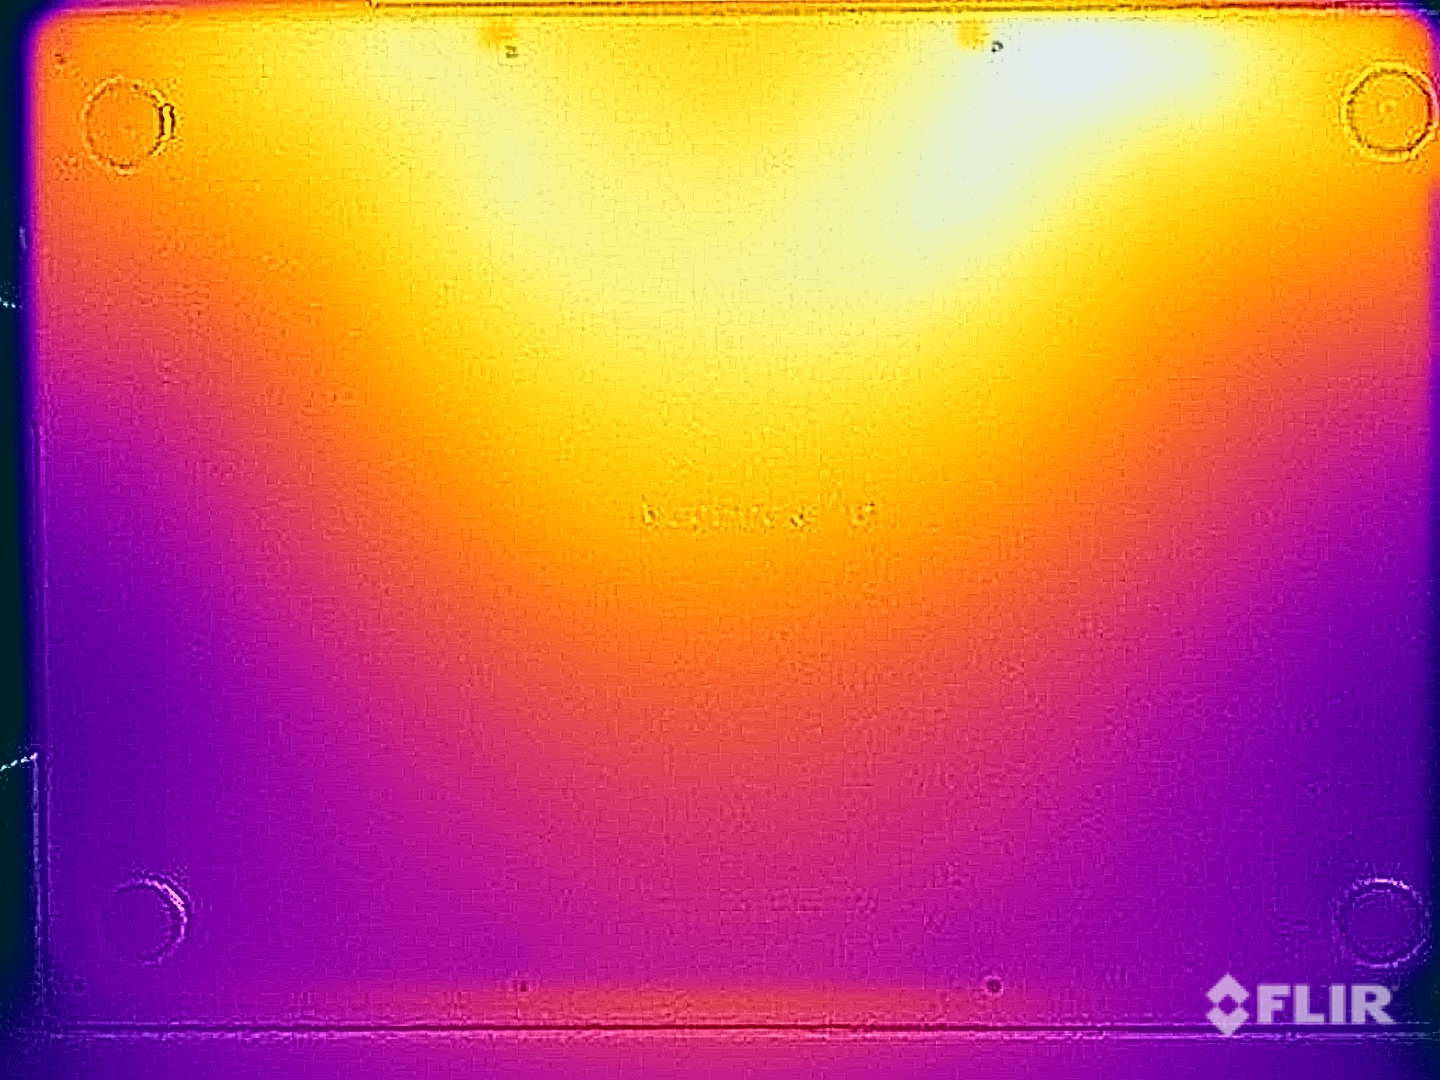
Emissions - Warm keyboard under load
System Noise
The two fans are usually deactivated when you only perform daily tasks and Apple still uses a very defensive fan curve, so short peak load scenarios do not result in fan activity, either. As soon as you stress the laptop for longer periods, the fans will gradually start spinning faster, but the fan murmur is hardly noticeable at the lowest fan speeds. The overall fan speeds are also lower compared to the smaller MacBook Pro 14. Full CPU load will result in 28 dB(A) at 2800 rpm and our stress test in 43.2 dB(A) at 3600 rpm. There are differences while gaming and we measure between 35.1 dB(A) in Witcher 3 and 43.2 dB(A) in Resident Evil Village and Shadow of the Tomb Raider. The maximum fan speed is 5570 rpm, which results in 56.2 dB(A), but we only managed to trigger this level manually and not during our benchmarks and tests. This means the cooling solution still has some headroom for more powerful components.
All in all, the fan noise is comparable to the old model, while the Windows competition is often much noisier under load. Our test unit did not have any problems with other electronic noises like coil whine.
Noise level
| Idle |
| 23.9 / 23.9 / 23.9 dB(A) |
| Load |
| 36.6 / 43.2 dB(A) |
 | ||
30 dB silent 40 dB(A) audible 50 dB(A) loud |
||
min: | ||
| Apple MacBook Pro 16 2023 M2 Max M2 Max 38-Core GPU, M2 Max, Apple SSD AP2048Z | Apple MacBook Pro 16 2021 M1 Max M1 Max 32-Core GPU, M1 Max, Apple SSD AP2048R | Lenovo ThinkPad X1 Extreme G5-21DE003RGE GeForce RTX 3060 Laptop GPU, i7-12700H, Micron 3400 1TB MTFDKBA1T0TFH | Asus ZenBook Pro 16X OLED UX7602ZM-ME115W GeForce RTX 3060 Laptop GPU, i9-12900H, Samsung PM9A1 MZVL21T0HCLR | Schenker Vision 16 Pro RTX 3070 Ti GeForce RTX 3070 Ti Laptop GPU, i7-12700H, Samsung SSD 980 Pro 1TB MZ-V8P1T0BW | Dell Precision 7000 7670 Performance RTX A5500 Laptop GPU, i9-12950HX | |
|---|---|---|---|---|---|---|
| Noise | -5% | -7% | -16% | -10% | -17% | |
| off / environment * (dB) | 23.9 | 24.2 -1% | 23.2 3% | 26 -9% | 22.9 4% | 23.9 -0% |
| Idle Minimum * (dB) | 23.9 | 24.2 -1% | 23.2 3% | 26 -9% | 24.3 -2% | 24 -0% |
| Idle Average * (dB) | 23.9 | 24.2 -1% | 23.2 3% | 26 -9% | 24.3 -2% | 24 -0% |
| Idle Maximum * (dB) | 23.9 | 24.2 -1% | 23.2 3% | 26 -9% | 24.3 -2% | 38 -59% |
| Load Average * (dB) | 36.6 | 42.9 -17% | 45.5 -24% | 48 -31% | 38.5 -5% | 46.3 -27% |
| Witcher 3 ultra * (dB) | 35.1 | 39.5 -13% | 45.5 -30% | 51 -45% | 41.9 -19% | |
| Load Maximum * (dB) | 43.2 | 42.9 1% | 45.5 -5% | 54.6 -26% | 51 -18% | 47.9 -11% |
* ... smaller is better
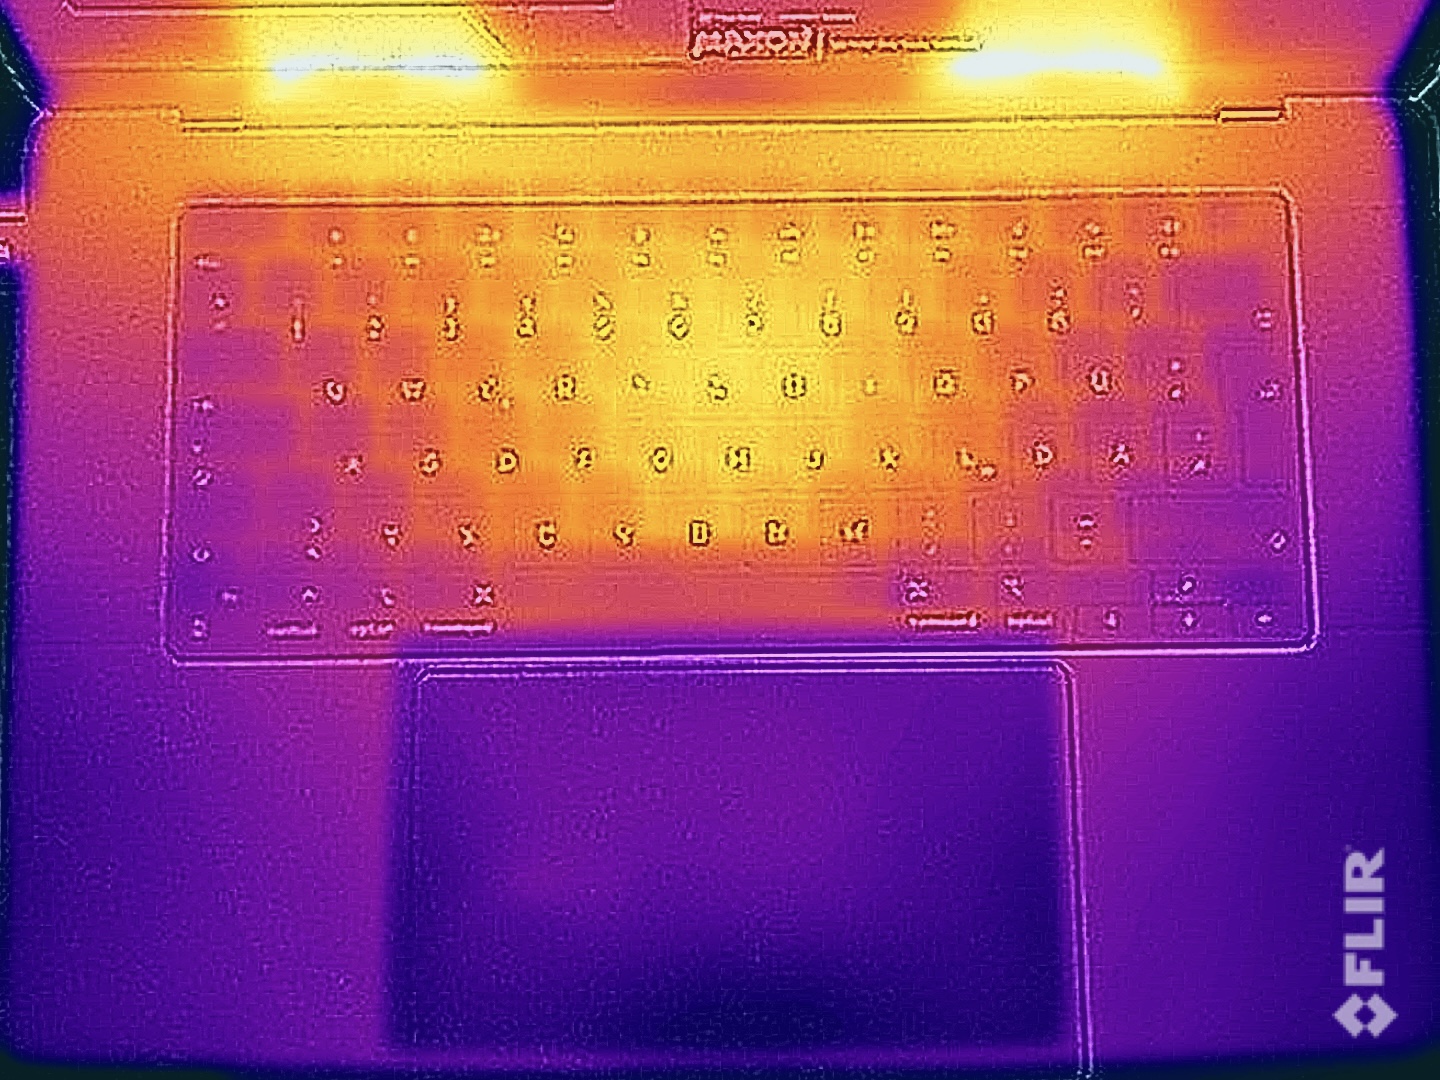
Temperature
The surface temperatures are not problematic and the chassis does not really warm up at all in light workloads. We can measure up to 42 °C at the bottom under load, which means you can still put it on your lap. The top of the base unit gets a little bit warmer and the center keyboard area warms up to ~44 °C, which is noticeable, especially when you play games. The old MacBook Pro 16 M1 Max was slightly cooler, but the other Windows rivals are usually warmer under load.
(±) The maximum temperature on the upper side is 44.2 °C / 112 F, compared to the average of 36.9 °C / 98 F, ranging from 21 to 71 °C for the class Multimedia.
(±) The bottom heats up to a maximum of 42.9 °C / 109 F, compared to the average of 39.1 °C / 102 F
(+) In idle usage, the average temperature for the upper side is 22.1 °C / 72 F, compared to the device average of 31.3 °C / 88 F.
(±) Playing The Witcher 3, the average temperature for the upper side is 36.5 °C / 98 F, compared to the device average of 31.3 °C / 88 F.
(+) The palmrests and touchpad are cooler than skin temperature with a maximum of 30.1 °C / 86.2 F and are therefore cool to the touch.
(±) The average temperature of the palmrest area of similar devices was 28.7 °C / 83.7 F (-1.4 °C / -2.5 F).
| Apple MacBook Pro 16 2023 M2 Max Apple M2 Max, Apple M2 Max 38-Core GPU | Apple MacBook Pro 16 2021 M1 Max Apple M1 Max, Apple M1 Max 32-Core GPU | Lenovo ThinkPad X1 Extreme G5-21DE003RGE Intel Core i7-12700H, NVIDIA GeForce RTX 3060 Laptop GPU | Asus ZenBook Pro 16X OLED UX7602ZM-ME115W Intel Core i9-12900H, NVIDIA GeForce RTX 3060 Laptop GPU | Schenker Vision 16 Pro RTX 3070 Ti Intel Core i7-12700H, NVIDIA GeForce RTX 3070 Ti Laptop GPU | Dell Precision 7000 7670 Performance Intel Core i9-12950HX, NVIDIA RTX A5500 Laptop GPU | |
|---|---|---|---|---|---|---|
| Heat | -2% | -22% | -19% | -16% | -34% | |
| Maximum Upper Side * (°C) | 44.2 | 42.3 4% | 52 -18% | 32 28% | 50.8 -15% | 53 -20% |
| Maximum Bottom * (°C) | 42.9 | 41.7 3% | 56.4 -31% | 41.6 3% | 46.3 -8% | 43.2 -1% |
| Idle Upper Side * (°C) | 22.4 | 23.9 -7% | 26.4 -18% | 32.6 -46% | 27.2 -21% | 36.8 -64% |
| Idle Bottom * (°C) | 22.3 | 23.9 -7% | 27.2 -22% | 36 -61% | 26.6 -19% | 33.8 -52% |
* ... smaller is better
Stress test
Similar to the previous model it and as we have shown in the GPU section, it is not easy to fully utilize the potential of the M2 Max GPU for longer periods. This means there are also periodic fluctuations during our stress test since the CPU power is linked to the GPU power. The maximum value we saw during all our benchmarks was 88W for the CPU and GPU combined, but the consumption quickly levels off at 65-70W. There are once again different possible explanations: Apple might want to avoid louder fans (since we saw that there is still plenty of headroom) or the manufacturer wants to make sure that you can use the same combined CPU/GPU performance on battery power.
Speakers
Our speaker analysis only shows minor deviations from the predecessor MacBook Pro 16 2021, but the results are still within measurement tolerances. The sound system consisting of 6 speakers and woofers is still the best system you can currently get in a laptop and it is also slightly better compared to the smaller MacBook Pro 14.
Apple MacBook Pro 16 2023 M2 Max audio analysis
(+) | speakers can play relatively loud (86.1 dB)
Bass 100 - 315 Hz
(+) | good bass - only 3.9% away from median
(+) | bass is linear (5.7% delta to prev. frequency)
Mids 400 - 2000 Hz
(+) | balanced mids - only 1.2% away from median
(+) | mids are linear (1.5% delta to prev. frequency)
Highs 2 - 16 kHz
(+) | balanced highs - only 2.5% away from median
(+) | highs are linear (1.7% delta to prev. frequency)
Overall 100 - 16.000 Hz
(+) | overall sound is linear (4.9% difference to median)
Compared to same class
» 0% of all tested devices in this class were better, 0% similar, 99% worse
» The best had a delta of 5%, average was 17%, worst was 45%
Compared to all devices tested
» 0% of all tested devices were better, 0% similar, 100% worse
» The best had a delta of 4%, average was 24%, worst was 134%
Apple MacBook Pro 16 2021 M1 Pro audio analysis
(+) | speakers can play relatively loud (84.7 dB)
Bass 100 - 315 Hz
(+) | good bass - only 3.8% away from median
(+) | bass is linear (5.2% delta to prev. frequency)
Mids 400 - 2000 Hz
(+) | balanced mids - only 1.3% away from median
(+) | mids are linear (2.1% delta to prev. frequency)
Highs 2 - 16 kHz
(+) | balanced highs - only 1.9% away from median
(+) | highs are linear (2.7% delta to prev. frequency)
Overall 100 - 16.000 Hz
(+) | overall sound is linear (4.6% difference to median)
Compared to same class
» 0% of all tested devices in this class were better, 0% similar, 100% worse
» The best had a delta of 5%, average was 17%, worst was 45%
Compared to all devices tested
» 0% of all tested devices were better, 0% similar, 100% worse
» The best had a delta of 4%, average was 24%, worst was 134%
Energy Management - MBP 16 with long runtime
Power Consumption
The idle consumption is almost identical to the previous model and the bright 16-inch screen is once again the biggest consumer. We can measure almost 17W at the maximum SDR brightness and even up to 34W at the full HDR brightness of ~1100 nits. The results are also pretty similar under load. We can measure up to 145W at the beginning of our stress test and later ~130W, so the included 140W power adapter is still sufficient.
| Off / Standby | |
| Idle | |
| Load |
|
Key:
min: | |
| Apple MacBook Pro 16 2023 M2 Max M2 Max, M2 Max 38-Core GPU, Apple SSD AP2048Z, Mini-LED, 3456x2234, 16.2" | Apple MacBook Pro 16 2021 M1 Max M1 Max, M1 Max 32-Core GPU, Apple SSD AP2048R, Mini-LED, 3456x2234, 16.2" | Lenovo ThinkPad X1 Extreme G5-21DE003RGE i7-12700H, GeForce RTX 3060 Laptop GPU, Micron 3400 1TB MTFDKBA1T0TFH, IPS, 3840x2400, 16" | Asus ZenBook Pro 16X OLED UX7602ZM-ME115W i9-12900H, GeForce RTX 3060 Laptop GPU, Samsung PM9A1 MZVL21T0HCLR, OLED, 3840x2400, 16" | Schenker Vision 16 Pro RTX 3070 Ti i7-12700H, GeForce RTX 3070 Ti Laptop GPU, Samsung SSD 980 Pro 1TB MZ-V8P1T0BW, IPS, 2560x1600, 16" | Dell Precision 7000 7670 Performance i9-12950HX, RTX A5500 Laptop GPU, , OLED, 3840x2400, 16" | Average Apple M2 Max 38-Core GPU | Average of class Multimedia | |
|---|---|---|---|---|---|---|---|---|
| Power Consumption | 2% | -53% | -29% | -20% | -122% | 0% | 23% | |
| Idle Minimum * (Watt) | 5.2 | 5.4 -4% | 11.8 -127% | 11.1 -113% | 9 -73% | 16.4 -215% | 5.2 ? -0% | 5.83 ? -12% |
| Idle Average * (Watt) | 16.5 | 16.4 1% | 22.4 -36% | 11.4 31% | 13.3 19% | 35.9 -118% | 16.5 ? -0% | 10.3 ? 38% |
| Idle Maximum * (Watt) | 16.8 | 16.7 1% | 23.1 -38% | 14.4 14% | 14.3 15% | 47 -180% | 16.8 ? -0% | 12.2 ? 27% |
| Load Average * (Watt) | 113 | 94 17% | 138 -22% | 137.4 -22% | 107 5% | 147.1 -30% | 113 ? -0% | 66.9 ? 41% |
| Witcher 3 ultra * (Watt) | 92 | 104 -13% | 129.9 -41% | 136 -48% | 155.2 -69% | 158.8 -73% | ||
| Load Maximum * (Watt) | 145 | 135 7% | 225.6 -56% | 197 -36% | 172 -19% | 311 -114% | 145 ? -0% | 113 ? 22% |
* ... smaller is better
Power consumption Witcher 3 / Stress test
Power consumption external screen
Battery runtime

The battery capacity is still 99.6 Wh and we can see an improved runtime in our video test at 150 nits (-7 large and 2 small steps from the maximum brightness). While the previous model managed around 17 hours, we were now able to record almost 19 hour of video playback. Our Wi-Fi test results on the other hand are almost identical at ~15 hours at 150 nits and slightly more than 7 hours at the maximum SDR brightness. These results are much better compared to Windows rivals, especially when they are equipped with high-res screens.
The load runtime on the other hand is the shortest within our comparison group, but the MBP 16 does not reduce its performance. The battery level drops to just 3 % after 50 minutes, when the performance will be limited. The Windows rivals manage longer minimum runtimes, but with significant performance losses as soon as you unplug the devices.
An HDR video (YouTube 4K) at the maximum HDR brightness runs for 4:47 hours, which is exactly 10 minutes longer compared to the previous model. A full recharge takes 100 minutes when the device is turned on; 50 % is available after just 28 minutes and 80 % after 51 minutes.
| Apple MacBook Pro 16 2023 M2 Max M2 Max, M2 Max 38-Core GPU, 99.6 Wh | Apple MacBook Pro 16 2021 M1 Max M1 Max, M1 Max 32-Core GPU, 99.6 Wh | Lenovo ThinkPad X1 Extreme G5-21DE003RGE i7-12700H, GeForce RTX 3060 Laptop GPU, 90 Wh | Asus ZenBook Pro 16X OLED UX7602ZM-ME115W i9-12900H, GeForce RTX 3060 Laptop GPU, 96 Wh | Schenker Vision 16 Pro RTX 3070 Ti i7-12700H, GeForce RTX 3070 Ti Laptop GPU, 80 Wh | Dell Precision 7000 7670 Performance i9-12950HX, RTX A5500 Laptop GPU, 93 Wh | Average of class Multimedia | |
|---|---|---|---|---|---|---|---|
| Battery runtime | -3% | -20% | 48% | -36% | -68% | 6% | |
| H.264 (h) | 18.7 | 17 -9% | 7.3 -61% | 6.1 -67% | 16.2 ? -13% | ||
| WiFi v1.3 (h) | 14.8 | 14.9 1% | 6.7 -55% | 8.9 -40% | 6 -59% | 4.7 -68% | 11.9 ? -20% |
| Load (h) | 1.1 | 1.1 0% | 1.7 55% | 2.6 136% | 1.3 18% | 1.656 ? 51% |
Pros
Cons
Verdict - MacBook Pro 16 2023 once again one of the best multimedia laptops
The new MacBook Pro 16 2023 with the M2 Max SoC is the most powerful laptop Apple has on sale right now. While we do not get the expected performance and efficiency improvements from completely new 3 nm chips, which we expected ahead of the launch, the 2023 model is still a solid update. The CPU of the M2 Max can be up to 20 % faster than the old model and we also see an advantage of 25-30 % for the GPU with 38 cores. However, both components also consume more power, so the efficiency did not change that much under maximum load. Thanks to the addition efficiency cores, the efficiency is still better in practice since the faster P-cores ae not utilized as much as before. All in all, the performance is very good and you can also use the full performance on battery power, which is not possible on comparable Windows laptops.
Our stress test shows that the two components cannot utilize their full potential and there is definitely a limitation. We are pretty sure that the M2 Max could be even faster, but this would also require a more powerful PSU, louder fans and the performance might be lower on battery power. We don’t think Apple wants these compromises.
Thanks to the new M2 Max, the Apple MacBook Pro 16 2023 is even more powerful than before. The Mini-LED panel is still excellent and the MBP 16 is once again one of the best laptops for content creators. However, the great overall package comes at a steep price and the new MBP 16 with the M2 Max starts at 3900 Euros.
The new SoC is the biggest change, otherwise the 2023 model finally supports faster Wi-Fi 6E as well as Bluetooth 5.3 and the HDMI port now supports the 2.1 standard with 4K output at up to 240 Hz. The battery runtime is usually comparable to the previous model, only the video runtime is now better at almost 19 hours. The Mini-LED panel still offers excellent image quality and HDR capabilities with a very comfortable HDR implementation in macOS. Apple also uses the best sound system you can get in a laptop right now.
There are also drawbacks and the biggest one is the lack of maintenance and upgrade options. You have to make sure you get a model with sufficient RAM and SSD storage when you buy the laptop, which brings us to the next drawback, the high prices of upgrades for the RAM and SSDs. The display notch is not very aesthetic, either.
Among other 16-inch notebooks, the MacBook definitely has to compete with powerful rivals that offer more CPU and GPU performance, and the new RTX 40 GPUs from Nvidia are just arriving these days. However, these systems will also consume much more power. Even the high-re screens of the rivals have a hard time keeping up with Apple’s Mini-LED panel, especially the HDR capabilities. Most Windows laptops offer some upgrade options in return and you can usually replace the RAM, the SSD and sometimes the Wi-Fi module.
We don’t think an upgrade from the 2021 model makes a lot of sense and when you are upgrading from an older Intel MacBook or other systems, we recommend you check the old 2021 model as well, which is currently 700-800 Euros less expensive with the M1 Max (starting at ~3100 Euros). You should also consider how much GPU performance you really need and systems with the M1 Pro or M2 Pro, respectively, will probably offer plenty of performance for most users.
Price and Availability
The base model of the Apple MacBook Pro 16 2023 with the M2 Max is available for $3100 on Amazon and our review unit with upgraded RAM and SSD storage can be purchased directly from Apple for $4299.
Apple MacBook Pro 16 2023 M2 Max
- 02/14/2023 v7 (old)
Andreas Osthoff
Transparency
The selection of devices to be reviewed is made by our editorial team. The test sample was provided to the author as a loan by the manufacturer or retailer for the purpose of this review. The lender had no influence on this review, nor did the manufacturer receive a copy of this review before publication. There was no obligation to publish this review. As an independent media company, Notebookcheck is not subjected to the authority of manufacturers, retailers or publishers.
This is how Notebookcheck is testing
Every year, Notebookcheck independently reviews hundreds of laptops and smartphones using standardized procedures to ensure that all results are comparable. We have continuously developed our test methods for around 20 years and set industry standards in the process. In our test labs, high-quality measuring equipment is utilized by experienced technicians and editors. These tests involve a multi-stage validation process. Our complex rating system is based on hundreds of well-founded measurements and benchmarks, which maintains objectivity. Further information on our test methods can be found here.
Price comparison
