

Alienware 15 R4 (i9-8950HK, GTX 1070, FHD) Laptop Review

Alienware is late to the party in upgrading its devices' Intel Coffee Lake processors. All Alienware 15 R4 configurations including the entry-model pack hexa-core processors which support up to twelve simultaneous threads thanks to Hyper-Threading. This is a huge leap from the quad-core Kaby Lake CPUs that Alienware used in the R4’s predecessor.
Alienware offers the 15 R4 in two hexa-core flavors: the hugely popular Intel Core i7-8750H and the much more expensive Intel Core i9-8950HK. The latter has an unlocked multiplier and can be theoretically overclocked up to 5.0 GHz.
A word of warning about the GPU though. To pass a GeForce GTX 1080 Max-Q off as a GeForce GTX 1080 is misleading. There are clear performance differences between the two GPUs.
The 15 R4’s pricing scheme is as confusing as other Dell laptops. Dell charges hefty prices for configuring the 15 R4 with larger hard drives and more RAM, but the price does not change irrespective of color or keyboard layout.
It is worth bearing in mind that the 15 R4 only comes with twelve months manufacturer’s warranty. We would expect to see a longer warranty given the 15 R4’s premium price.
The 15 R4 starts at €1,528 (~$1780) at Dell’s online store. This model is equipped with an Intel Core i5-8300H CPU, an NVIDIA GeForce GTX 1060 GPU, 8 GB RAM and a 256 GB SSD. Our test device currently retails for over €2,700 (~$3145) and is equipped with an Intel Core i9-8950HK CPU, an NVIDIA GeForce GTX 1070 GPU, 16 GB of RAM, a 256 GB SSD and a 1 TB HDD.
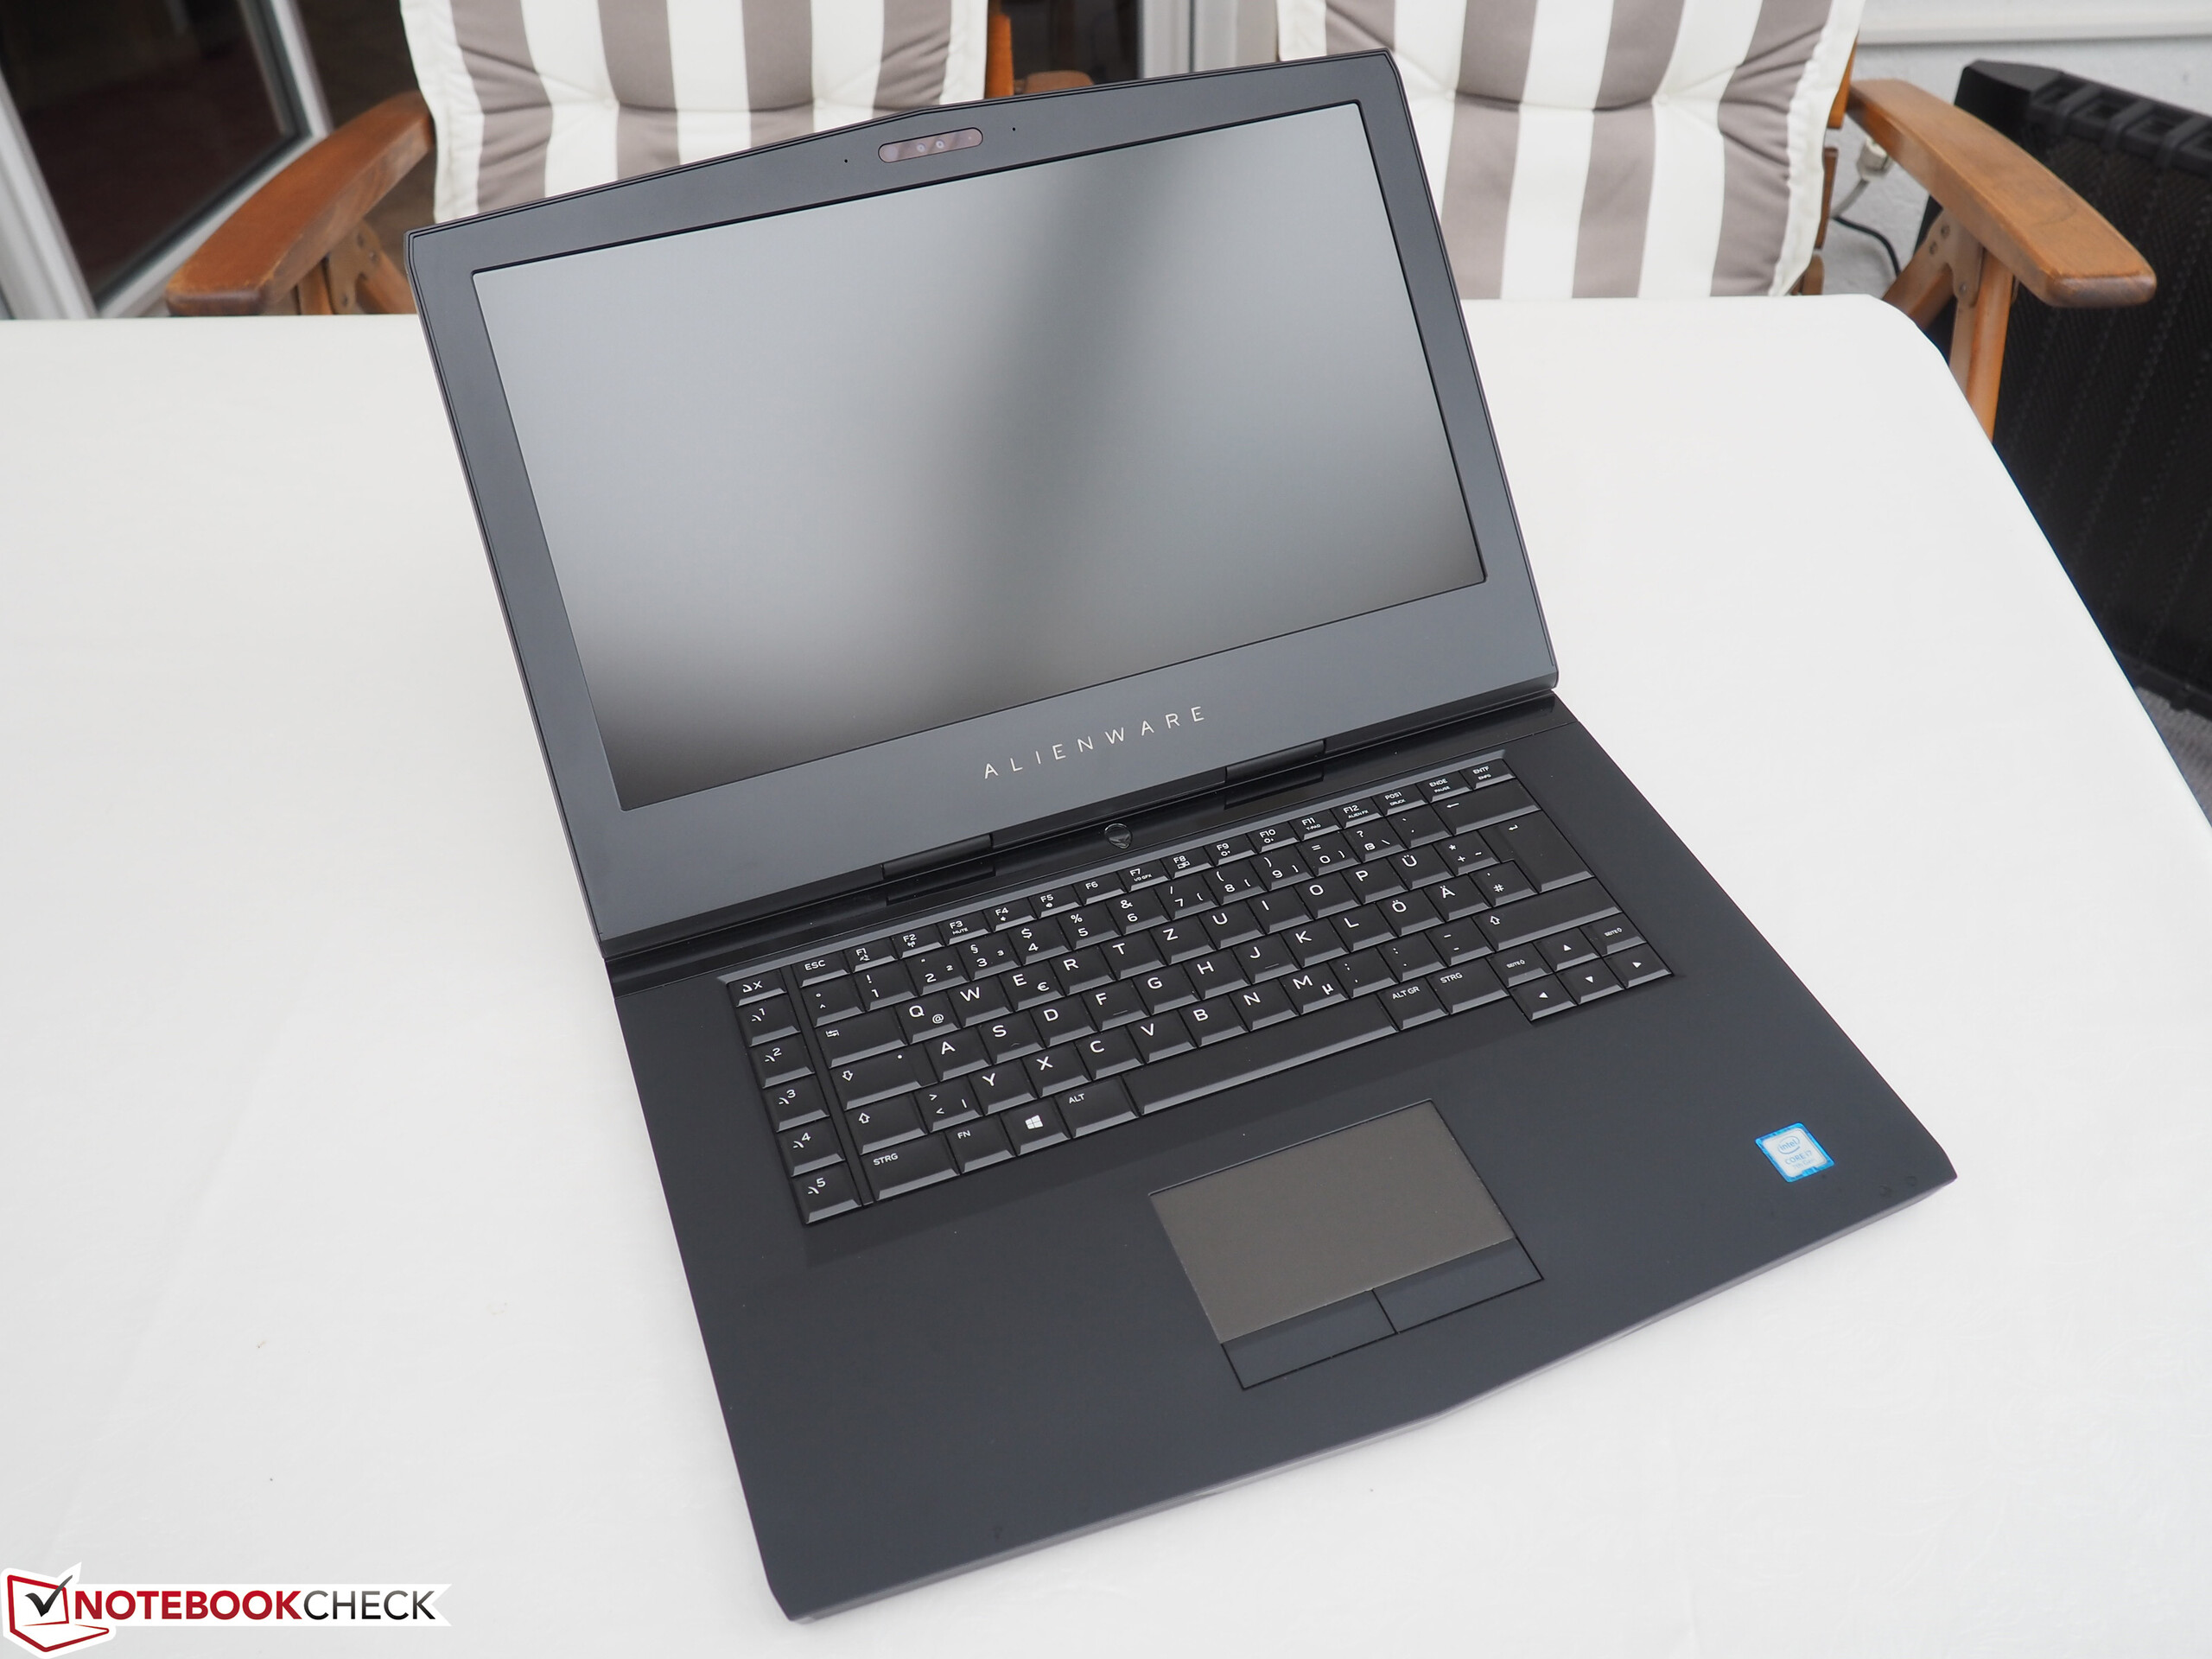
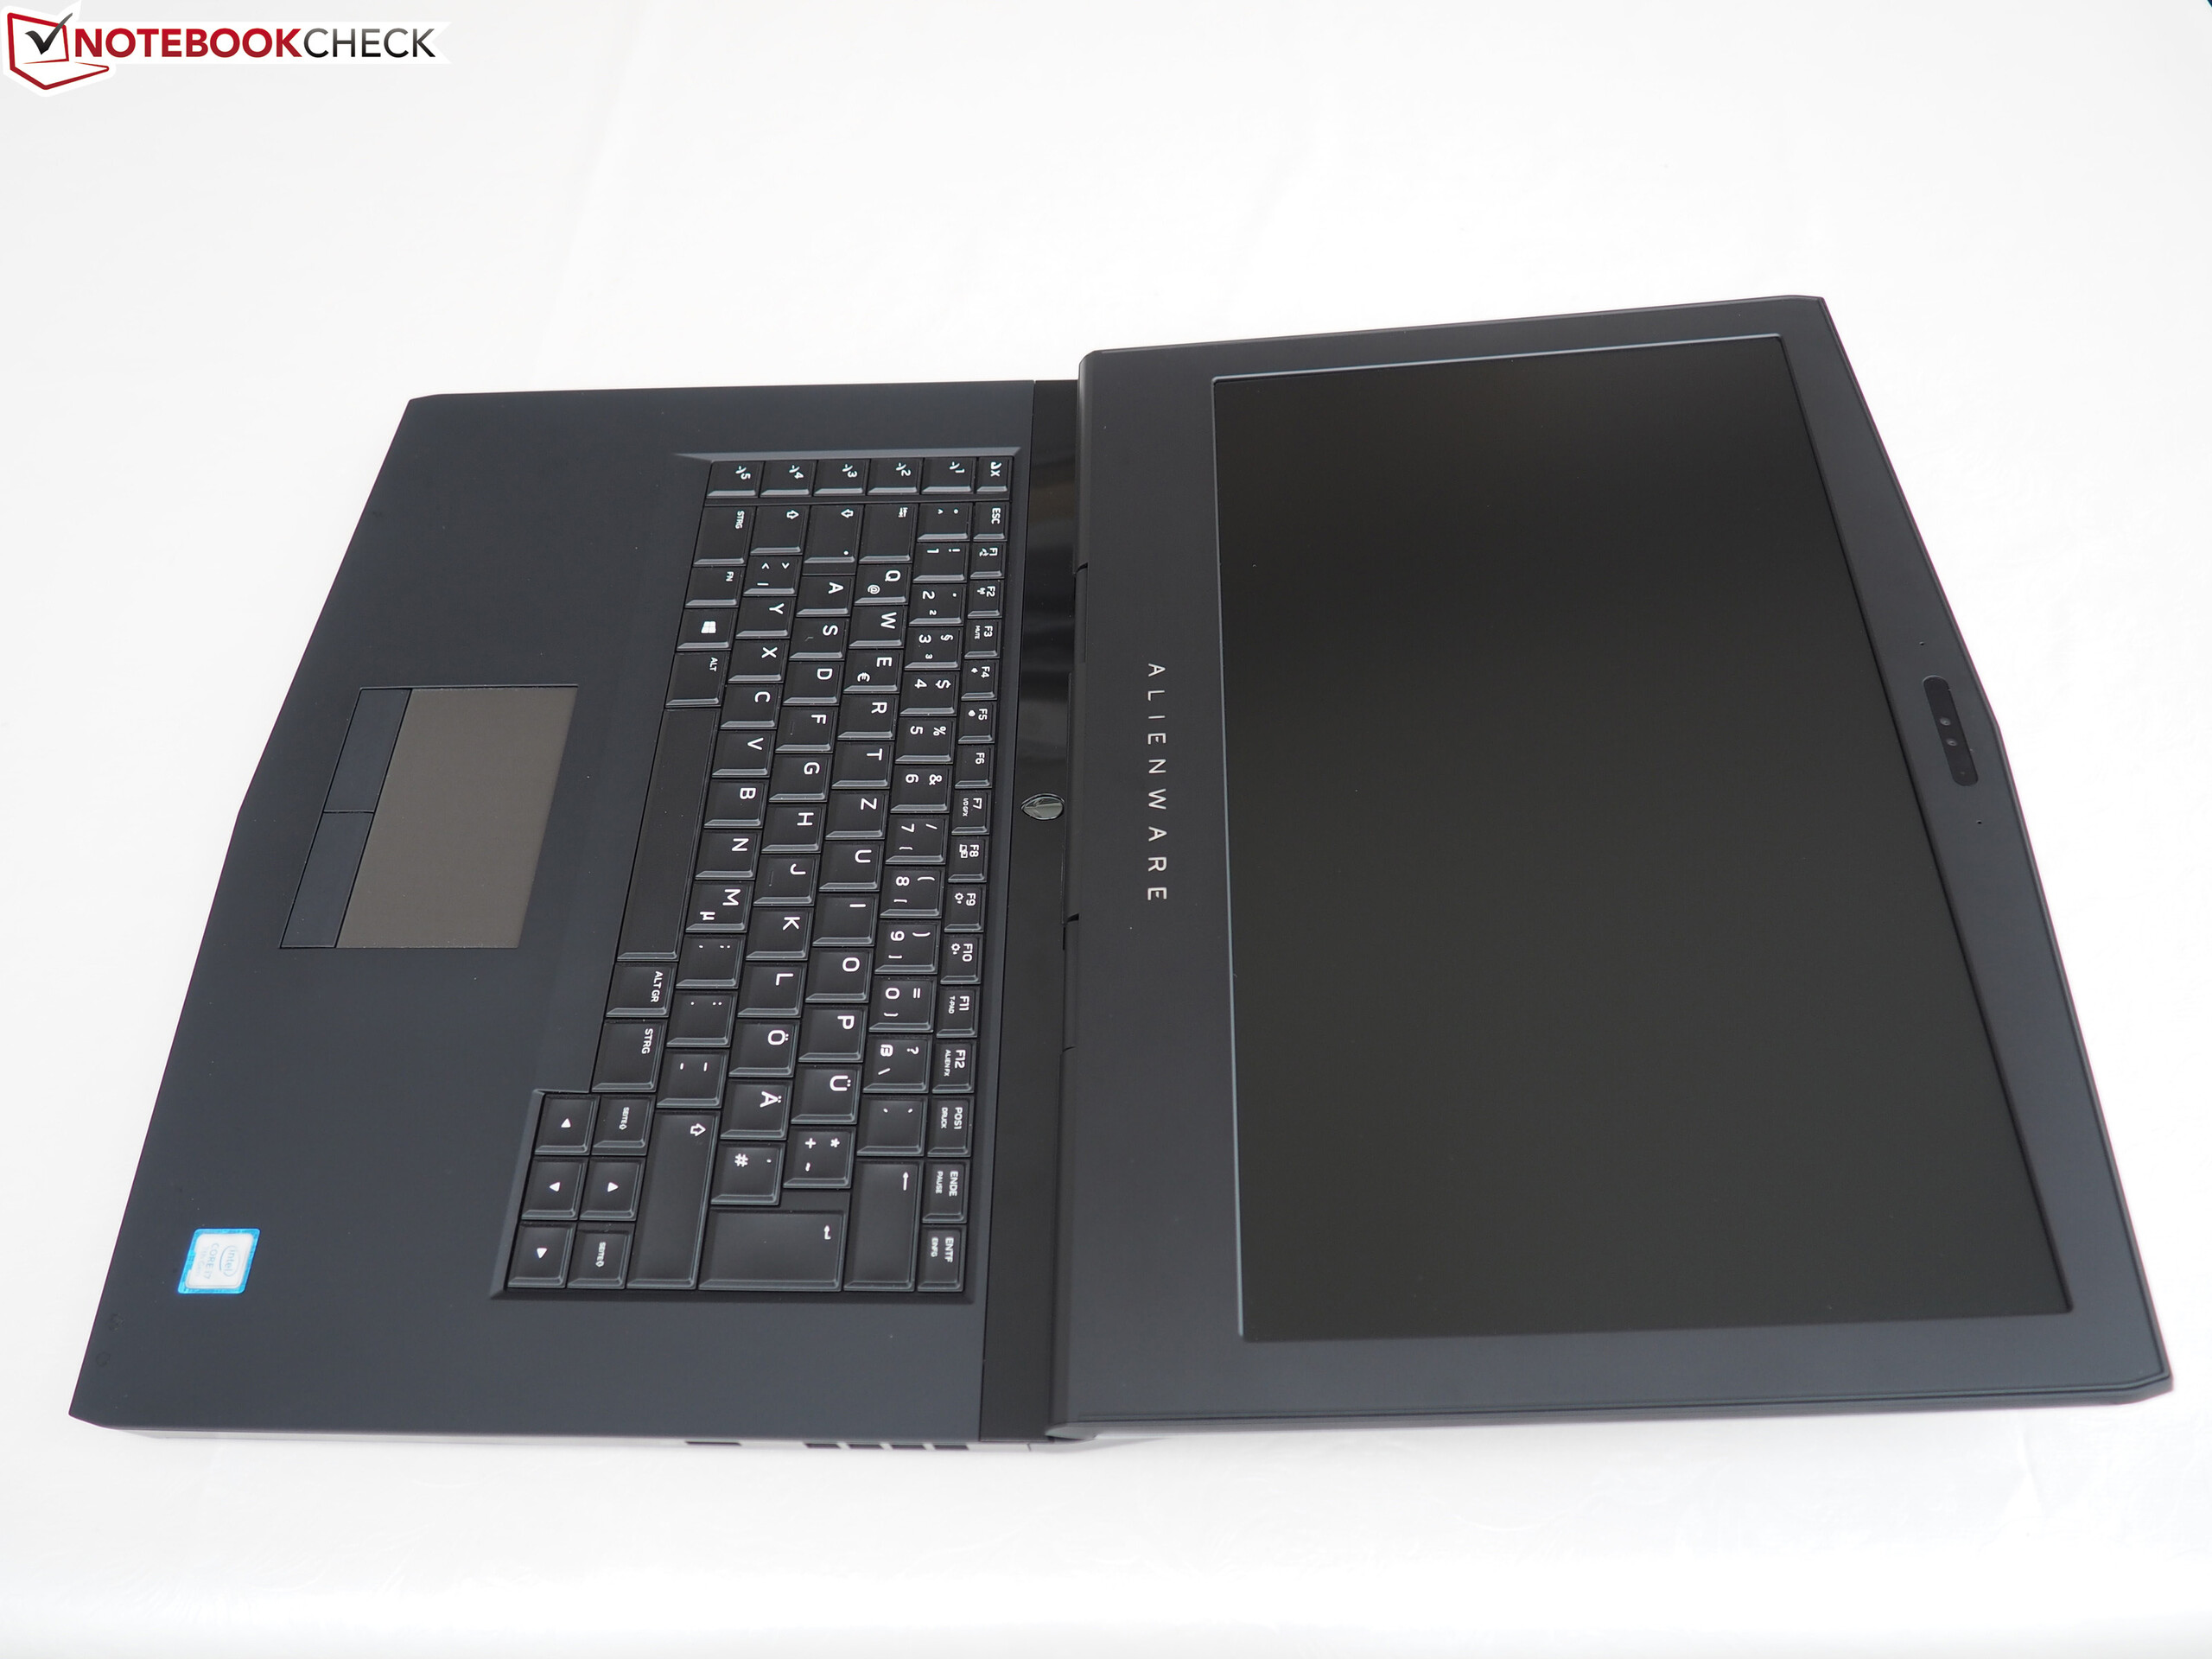
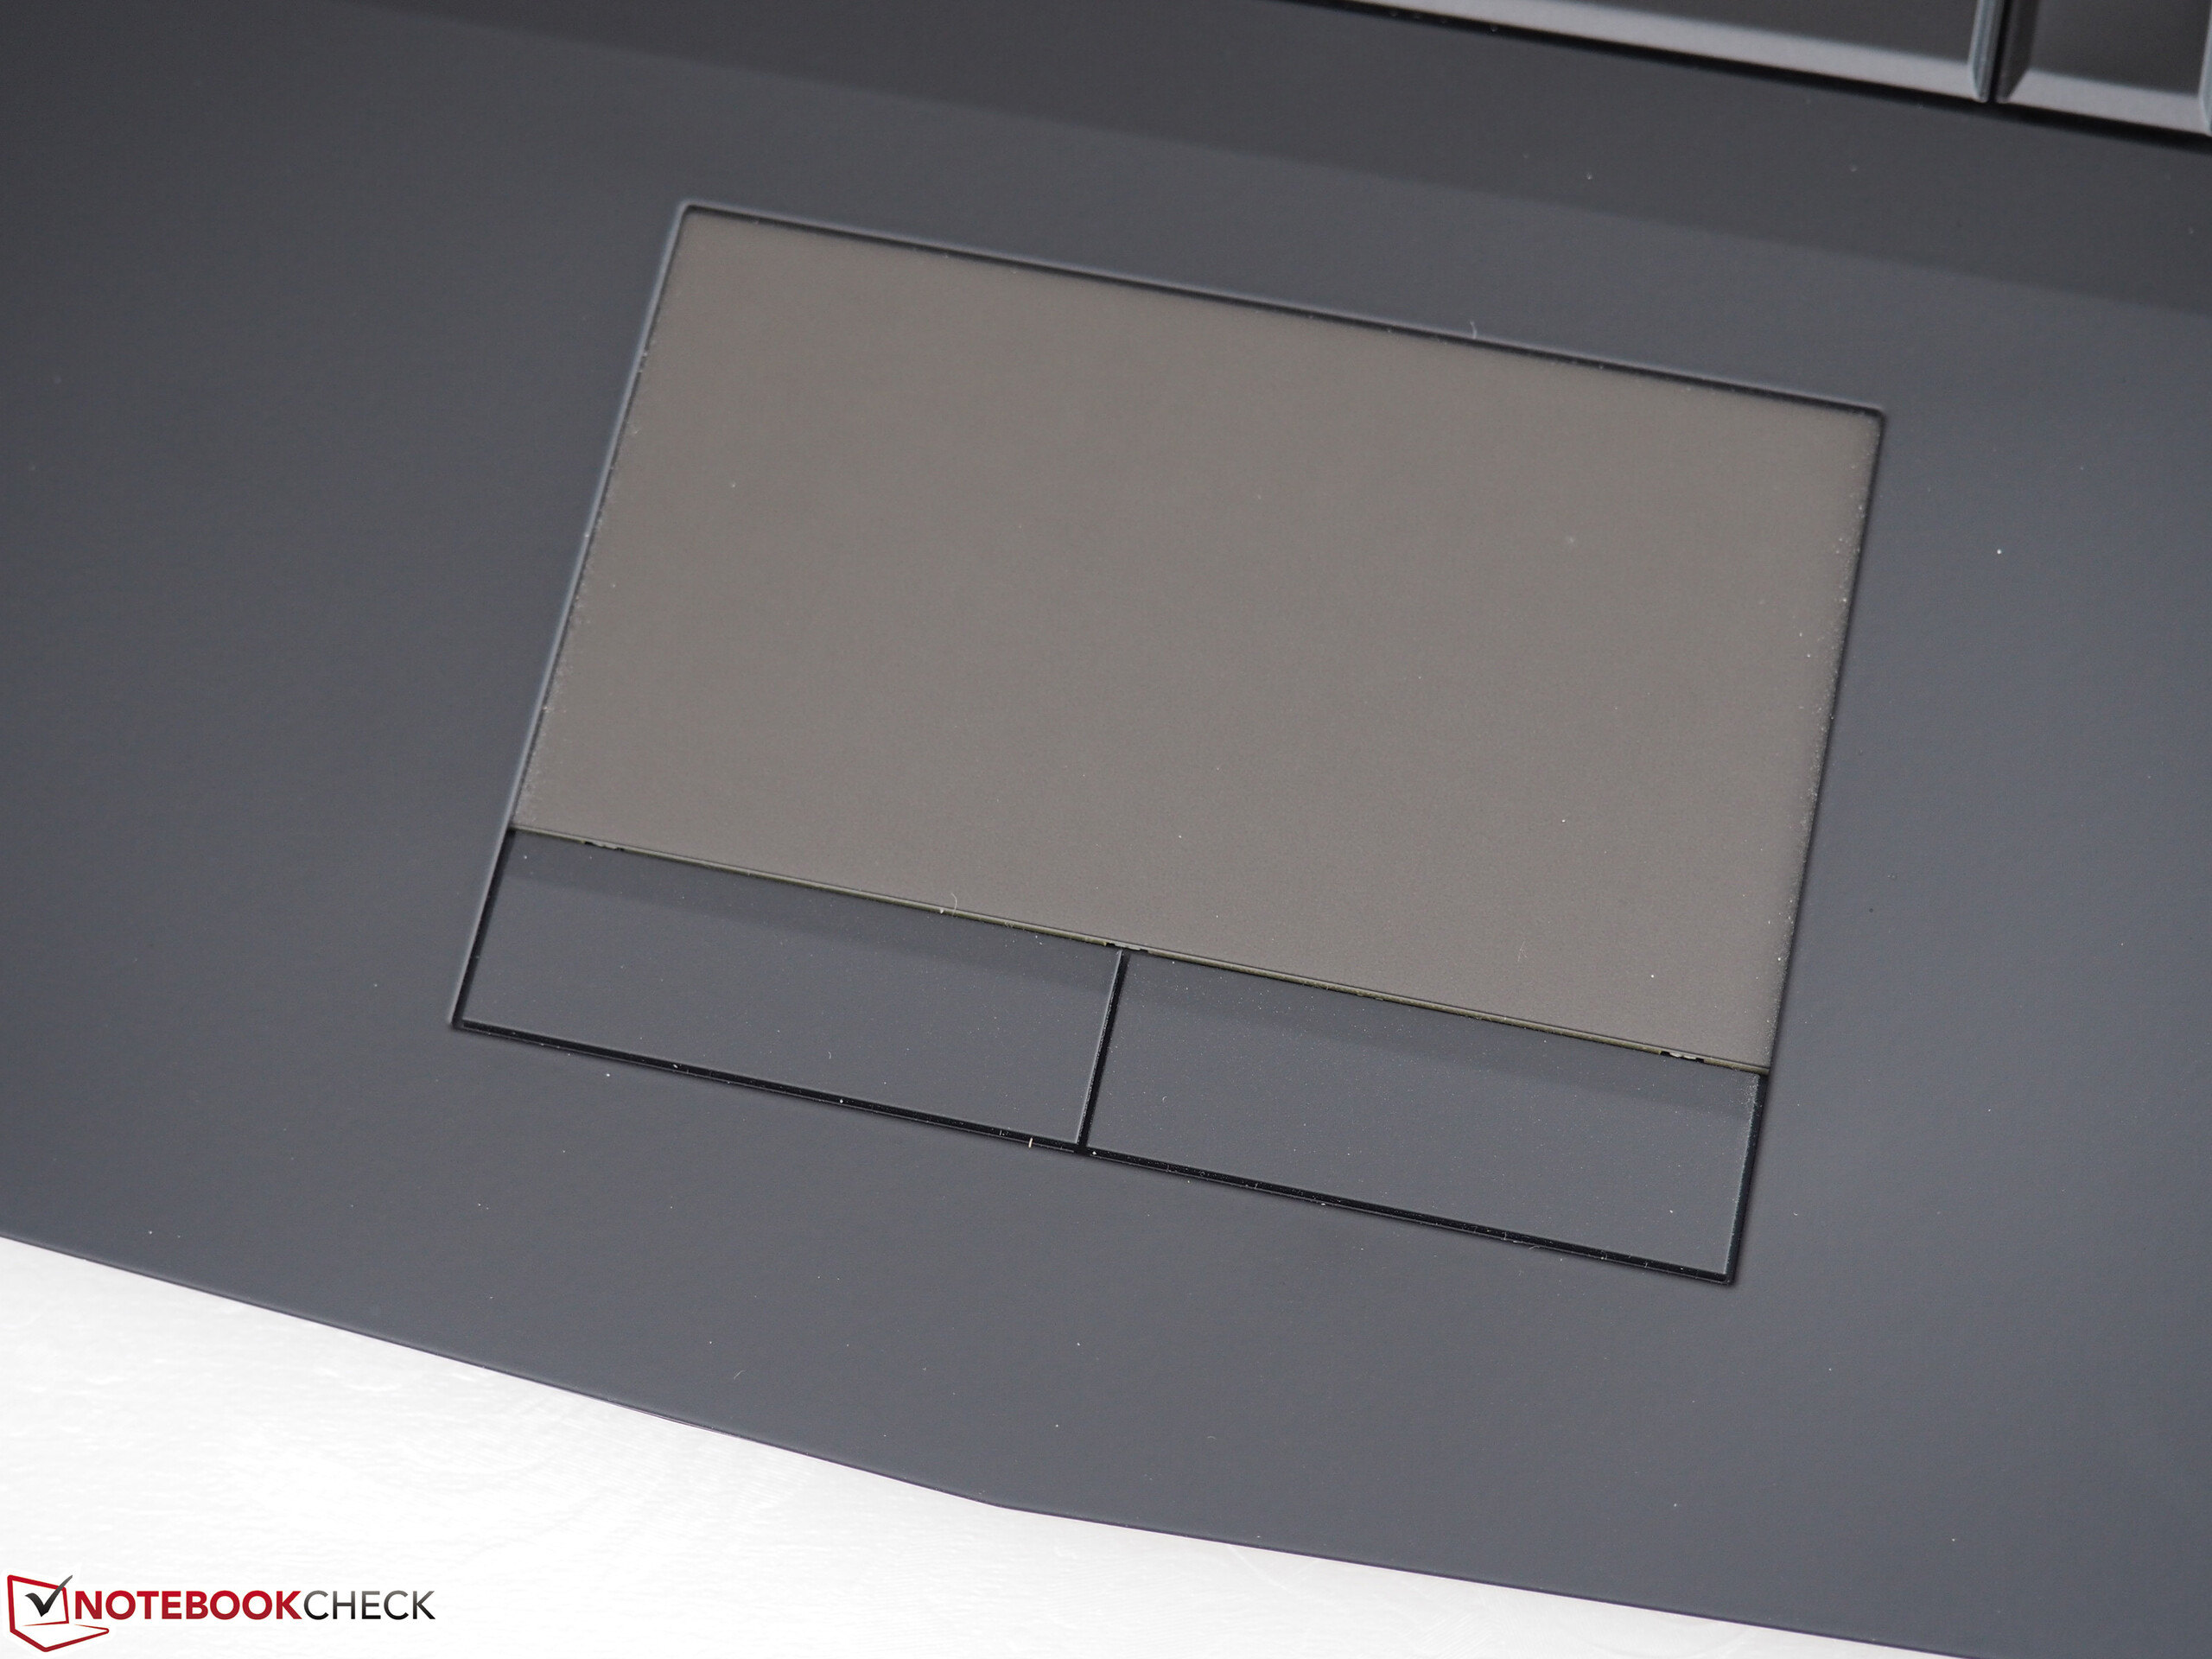
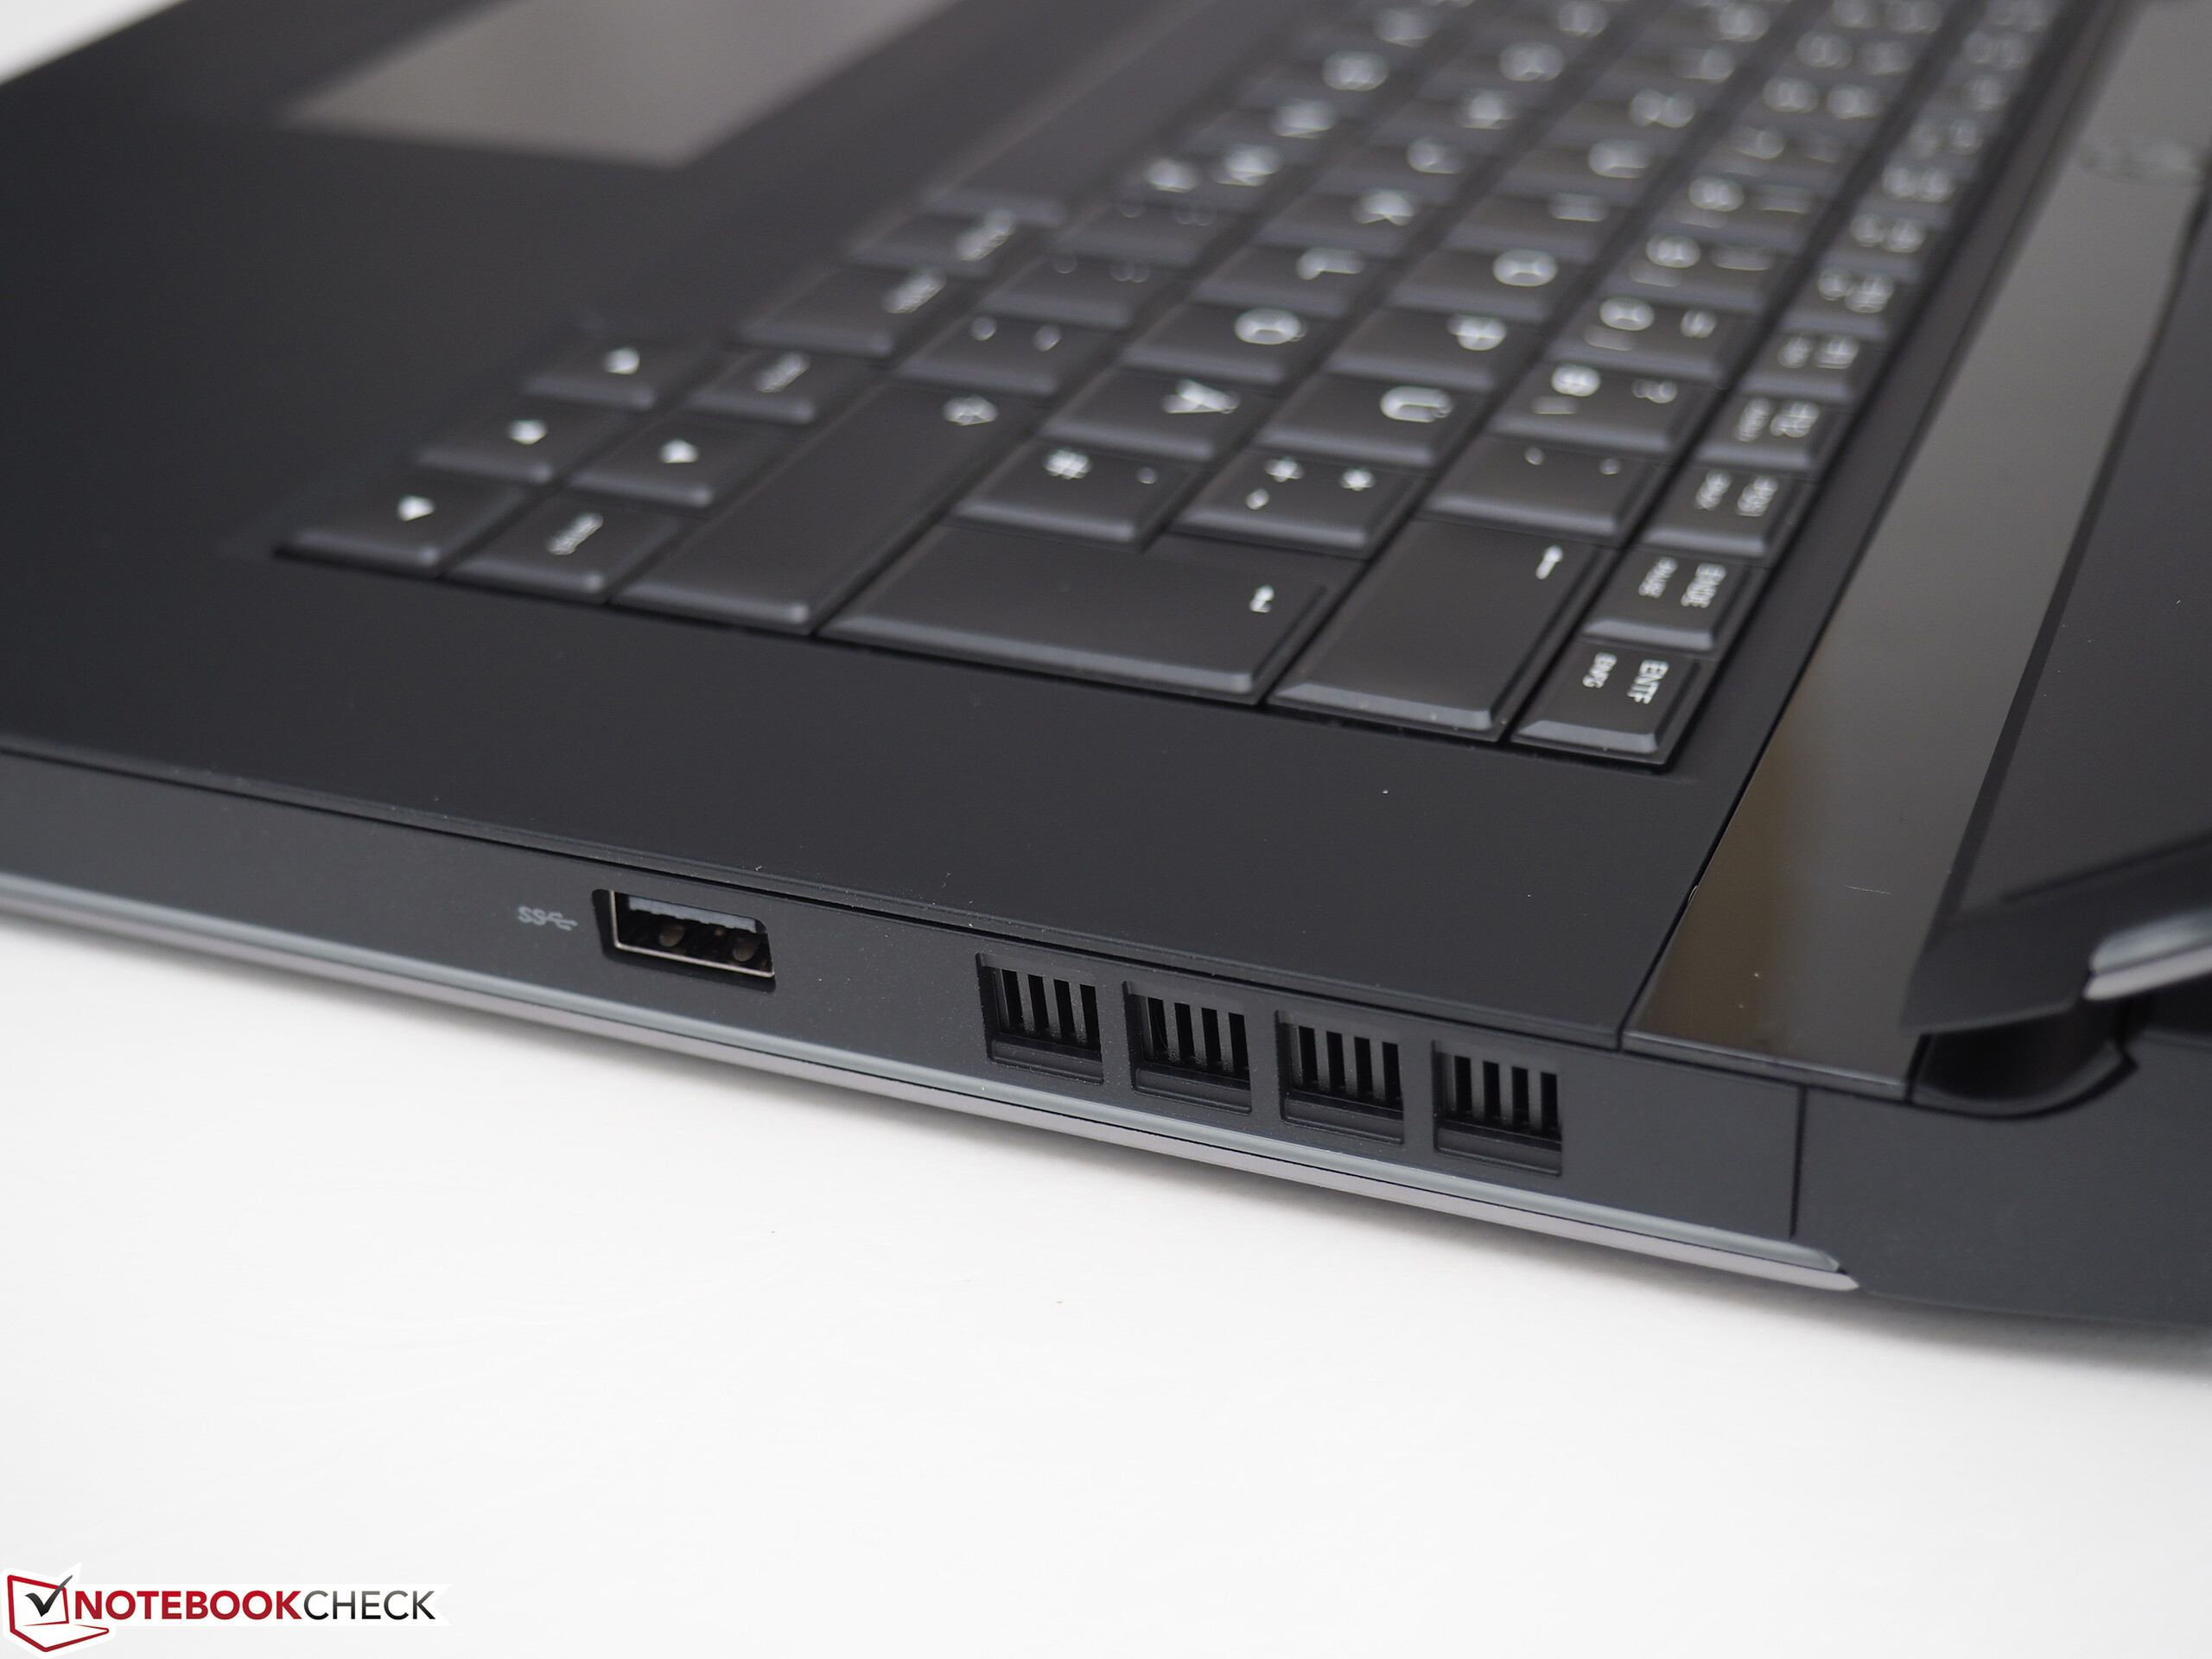
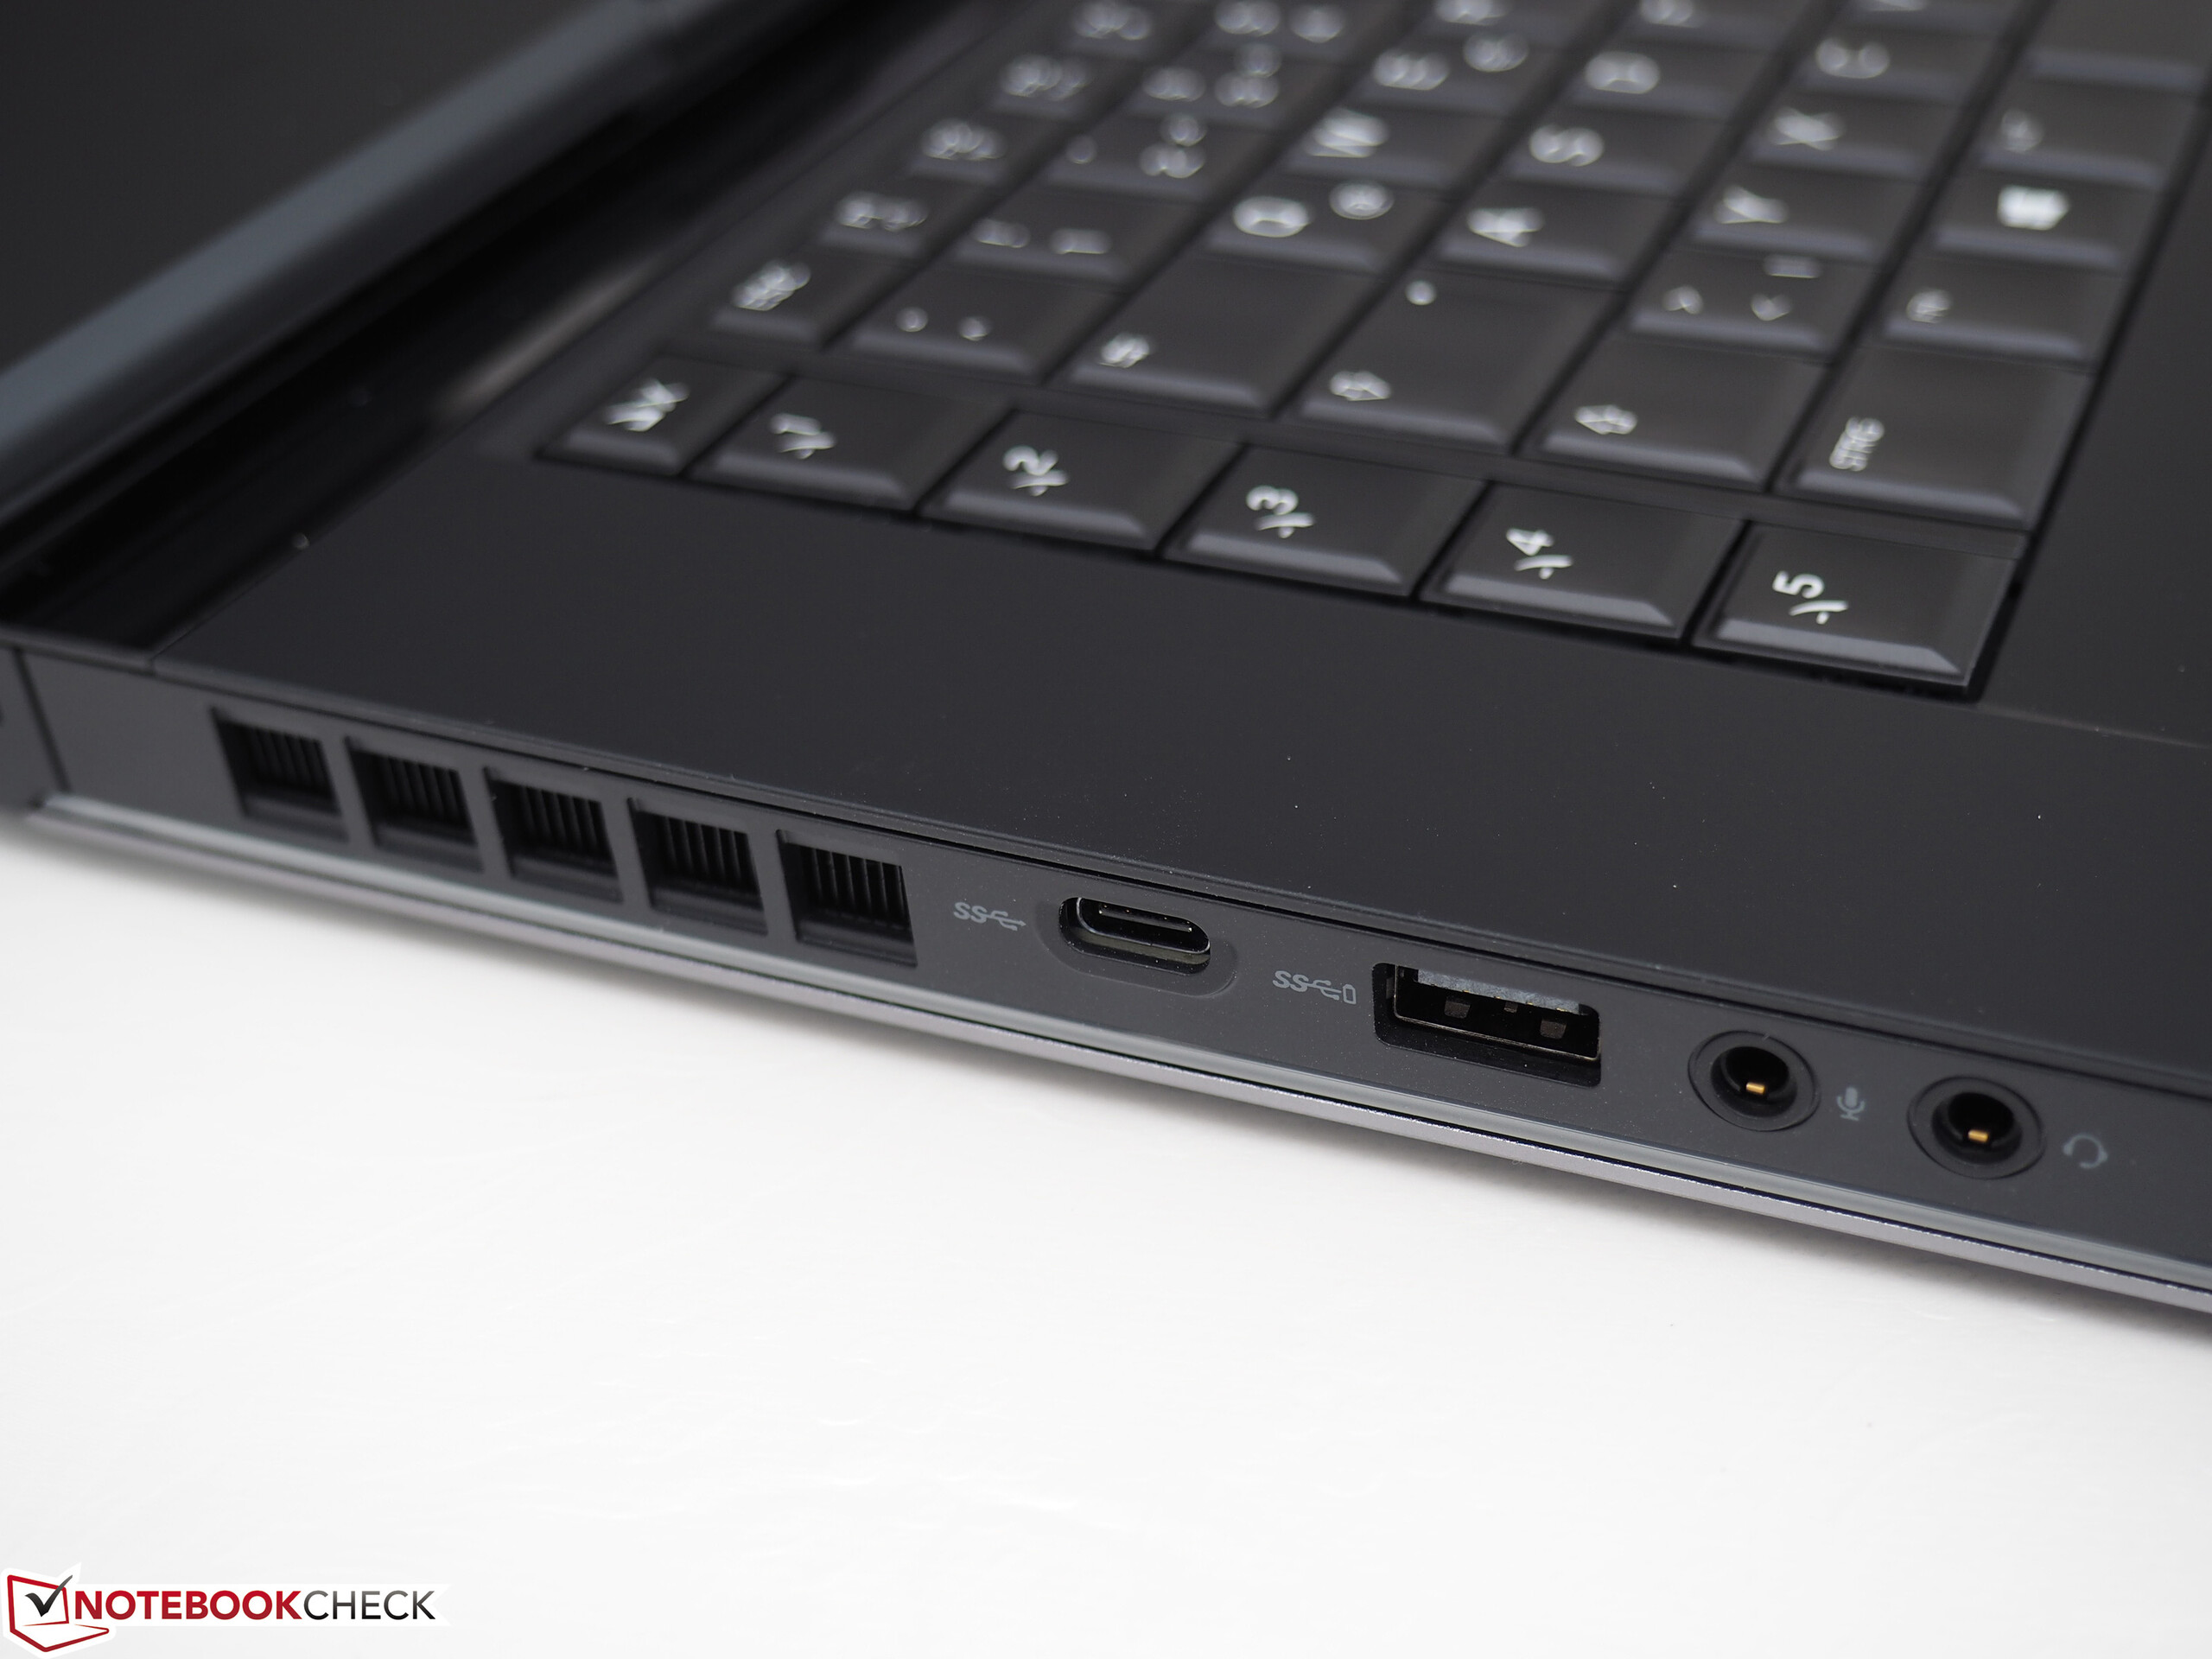
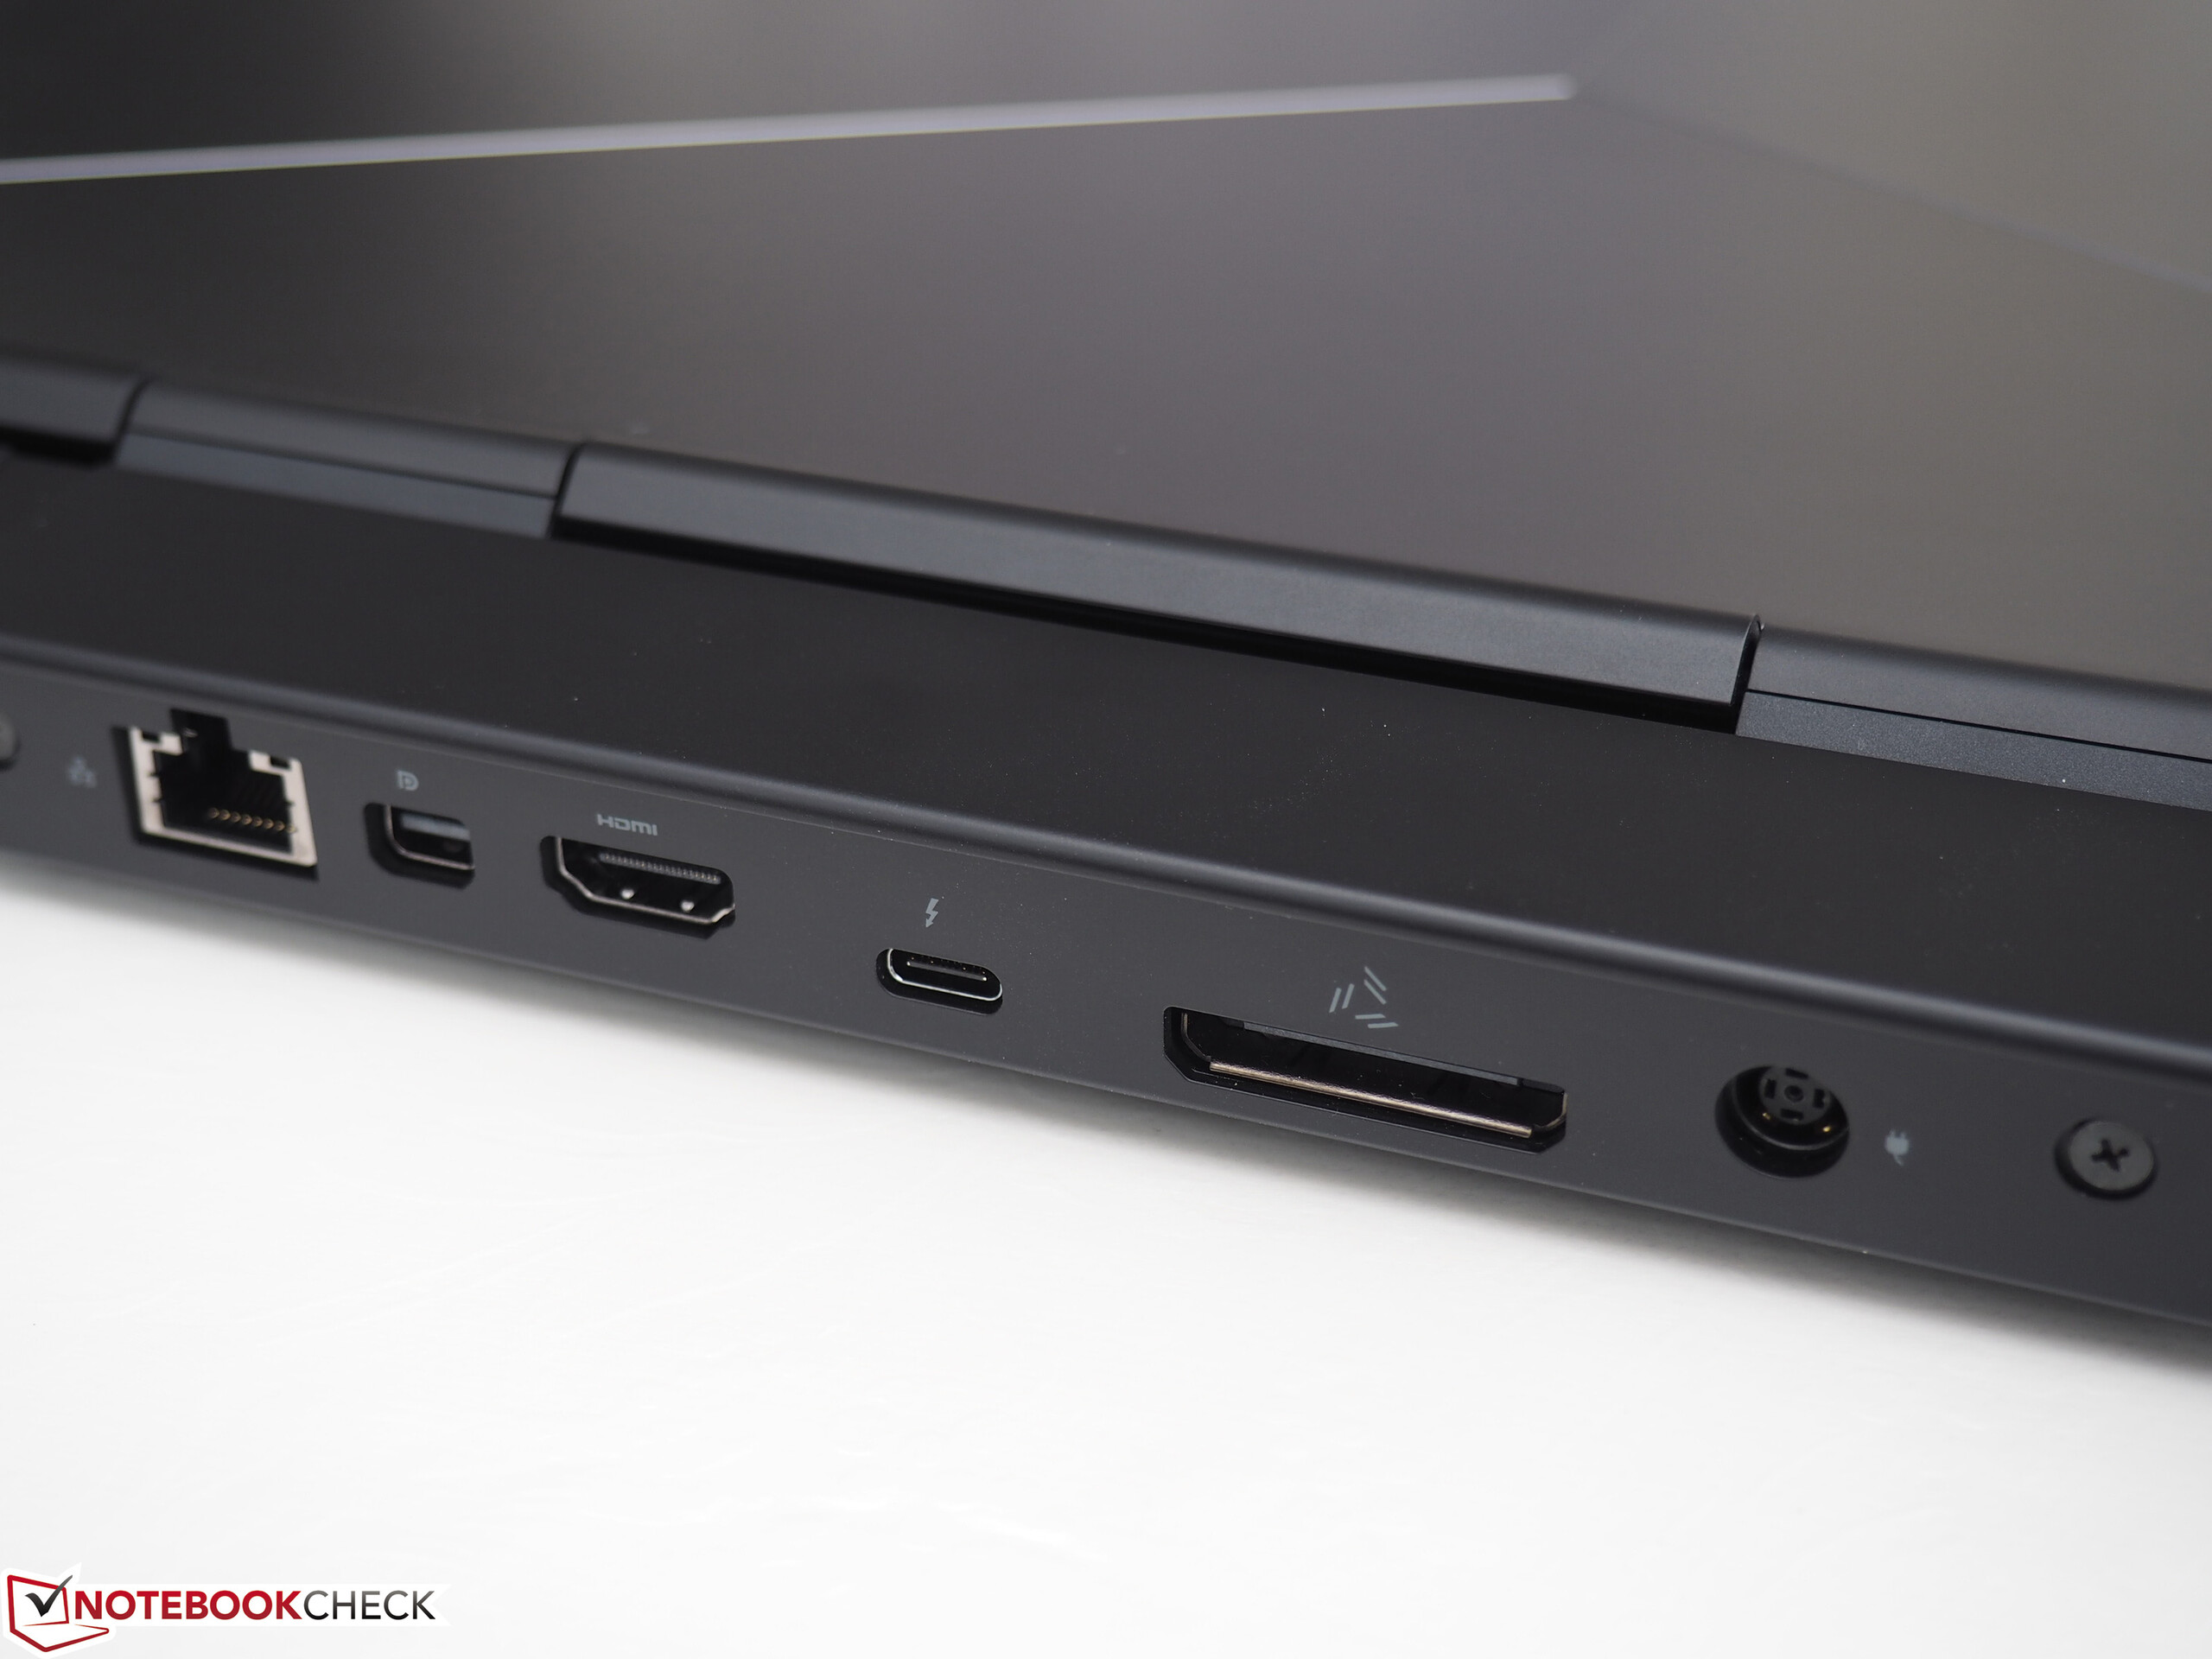
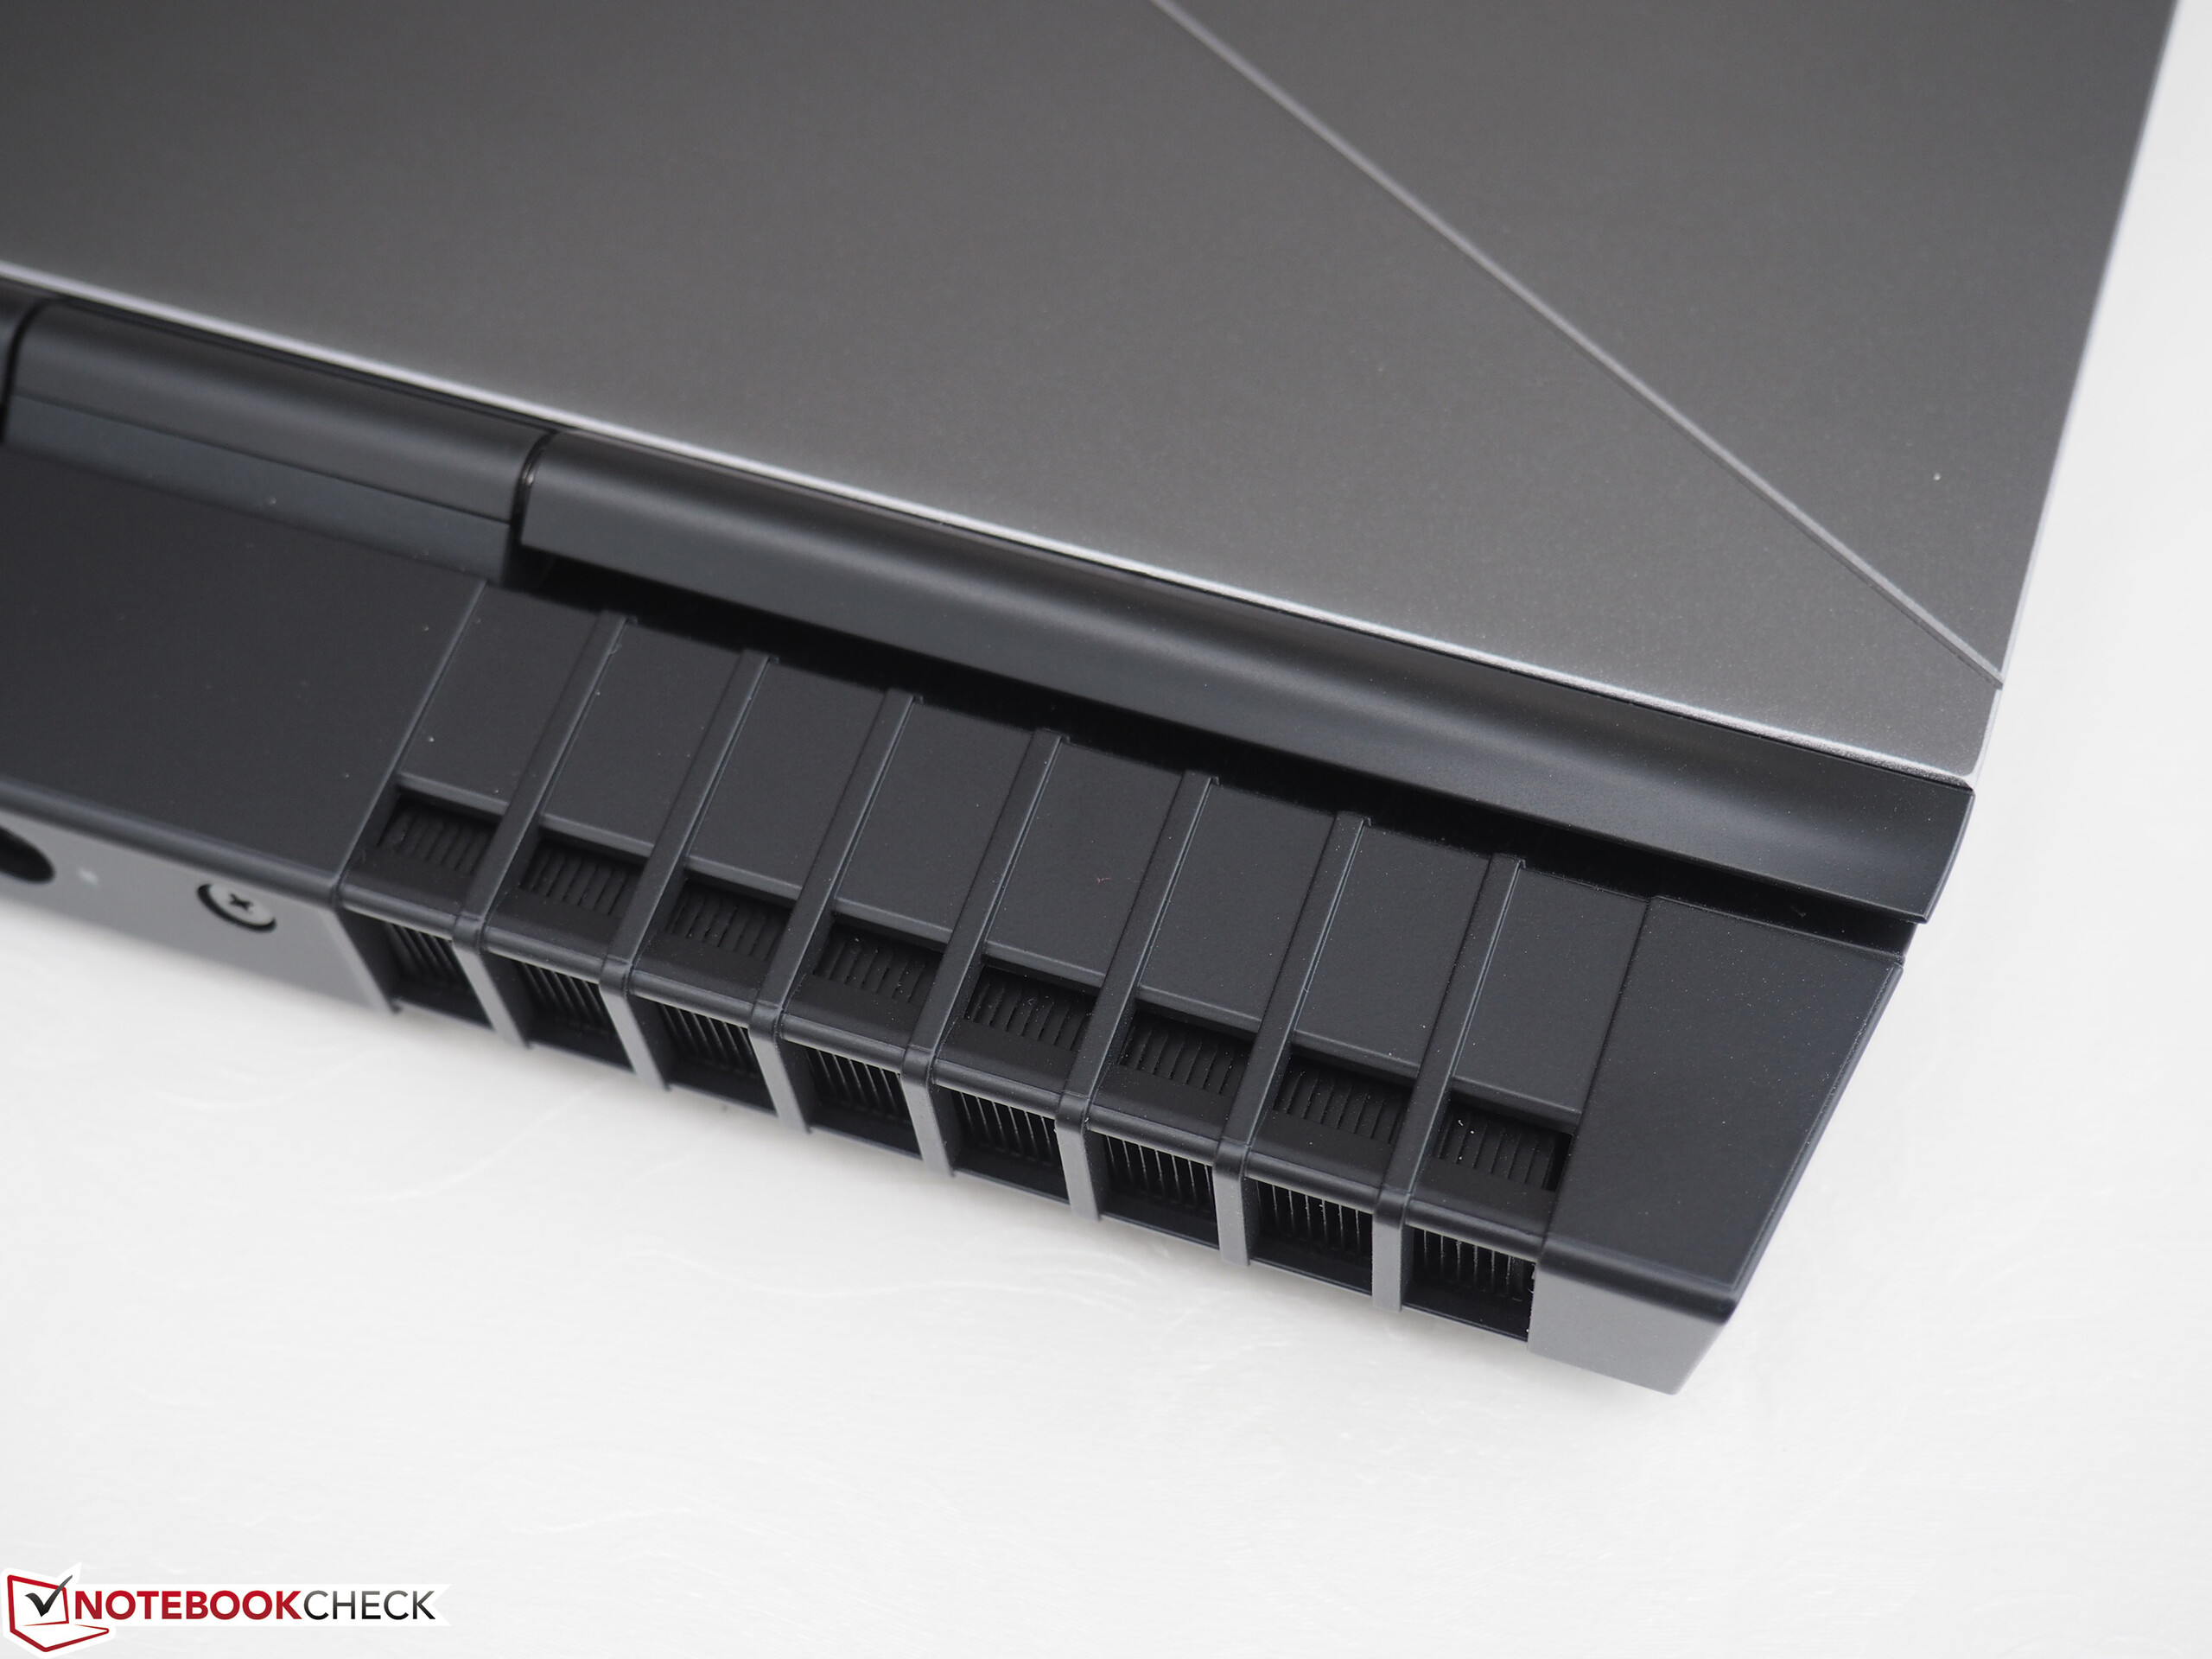
We will not be examining the case, the connectivity or the input devices in this review as they are the same as the 15 R4’s predecessor, except for the webcam where there are some differences. Please see our Alienware 15 R3 review for a detailed look at these areas.
We have chosen to compare the 15 R4 against other 15-inch gaming laptops that are also less than 3.0 cm (~1.2 in) thick. We will be comparing the 15 R4 against the AORUS X5 v8, the Razer Blade 15 and the Gigabyte Aero 15X v8.
| Networking | |
| iperf3 transmit AX12 | |
| Alienware 15 R4 | |
| Razer Blade 15 2018 | |
| Aorus X5 v8 | |
| Alienware 15 R3 | |
| Gigabyte Aero 15X v8 | |
| iperf3 receive AX12 | |
| Alienware 15 R4 | |
| Gigabyte Aero 15X v8 | |
| Alienware 15 R3 | |
| Razer Blade 15 2018 | |
| Aorus X5 v8 | |
Display
The 15 R4 comes in a choice of 15.6-inch displays, of which there are five for the Core i9-8950HK version. Principally, you have the choice between a 60 Hz IPS panel and a 120 Hz TN panel. The former is available in either FHD or UHD, while the latter is only available in FHD. There is a further choice between G-Sync and non-G-Sync models. We have laid out the display options and their price options at the time of writing below for clarity.
- FHD (1,920x1,080) 60 Hz IPS G-Sync
- FHD (1,920x1,080) 120 Hz TN (+ 100.00 €/~$116)
- FHD (1,920x1,080) 120 Hz TN G-Sync (+ 100.00 €/~$116)
- UHD (3,840x2,160) 60 Hz IPS (+ 350.00 €/~$408)
- UHD (3,840x2,160) 60 Hz IPS G-Sync (+ 380.00 €/~$443)
It is worth bearing in mind that the Core i7-8750H and Core i5-8300H versions include an additional display option, which is an FHD 60 Hz IPS panel without G-Sync.
| |||||||||||||||||||||||||
Brightness Distribution: 88 %
Center on Battery: 292 cd/m²
Contrast: 1007:1 (Black: 0.29 cd/m²)
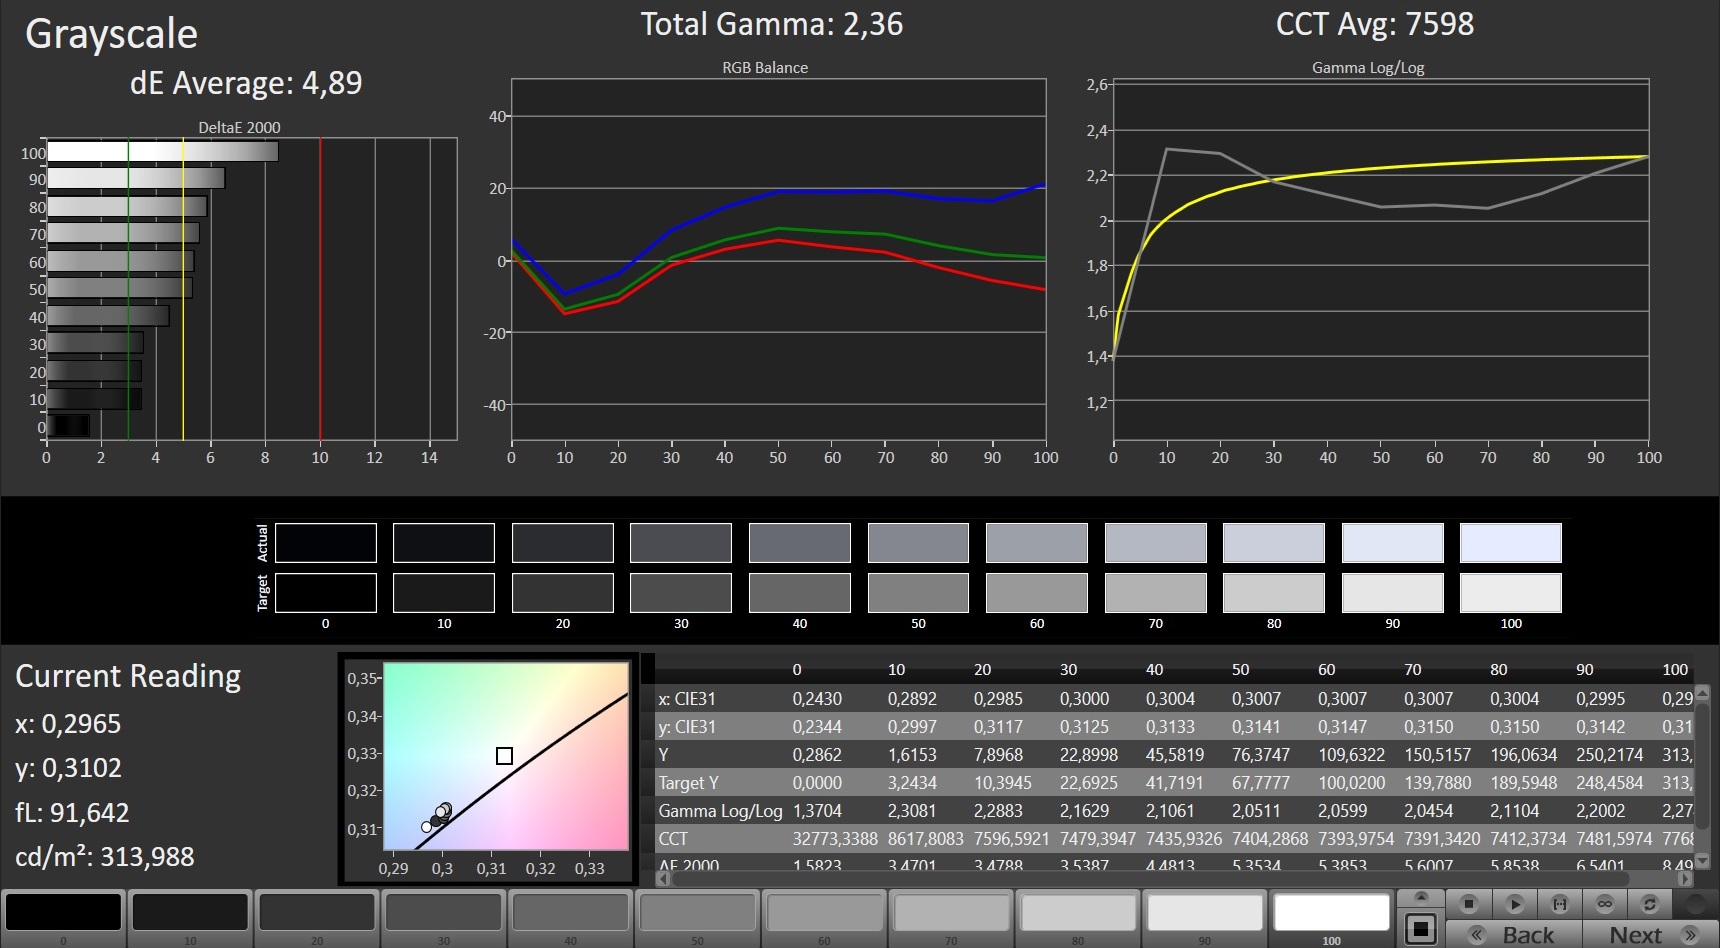
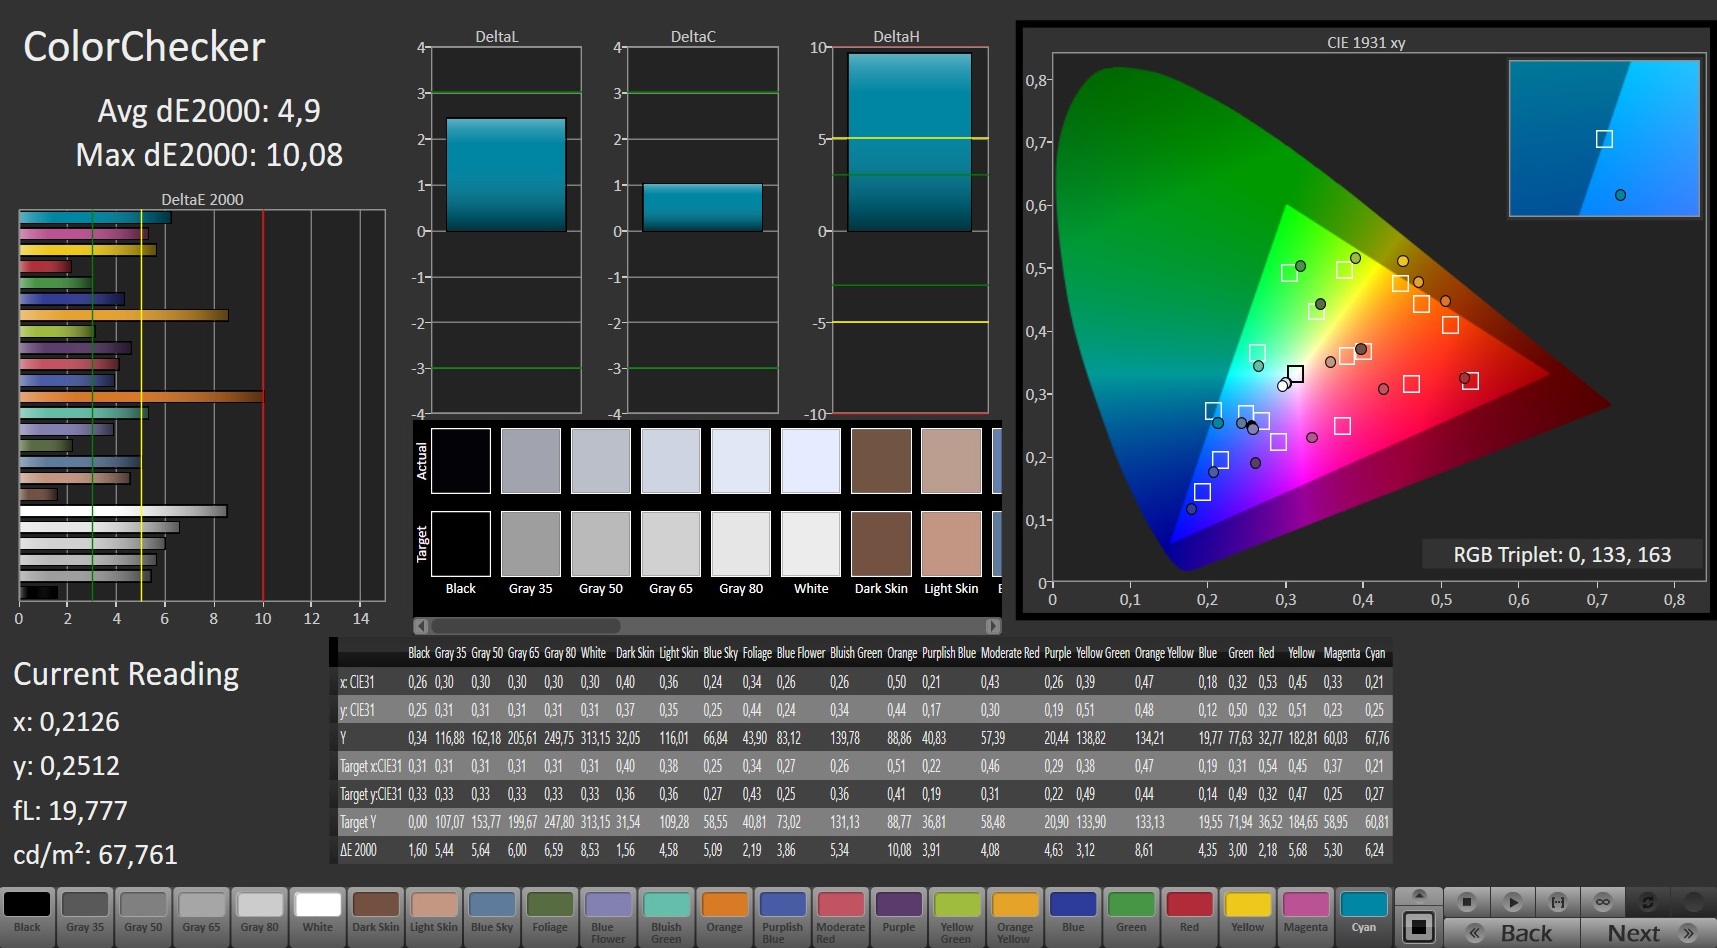
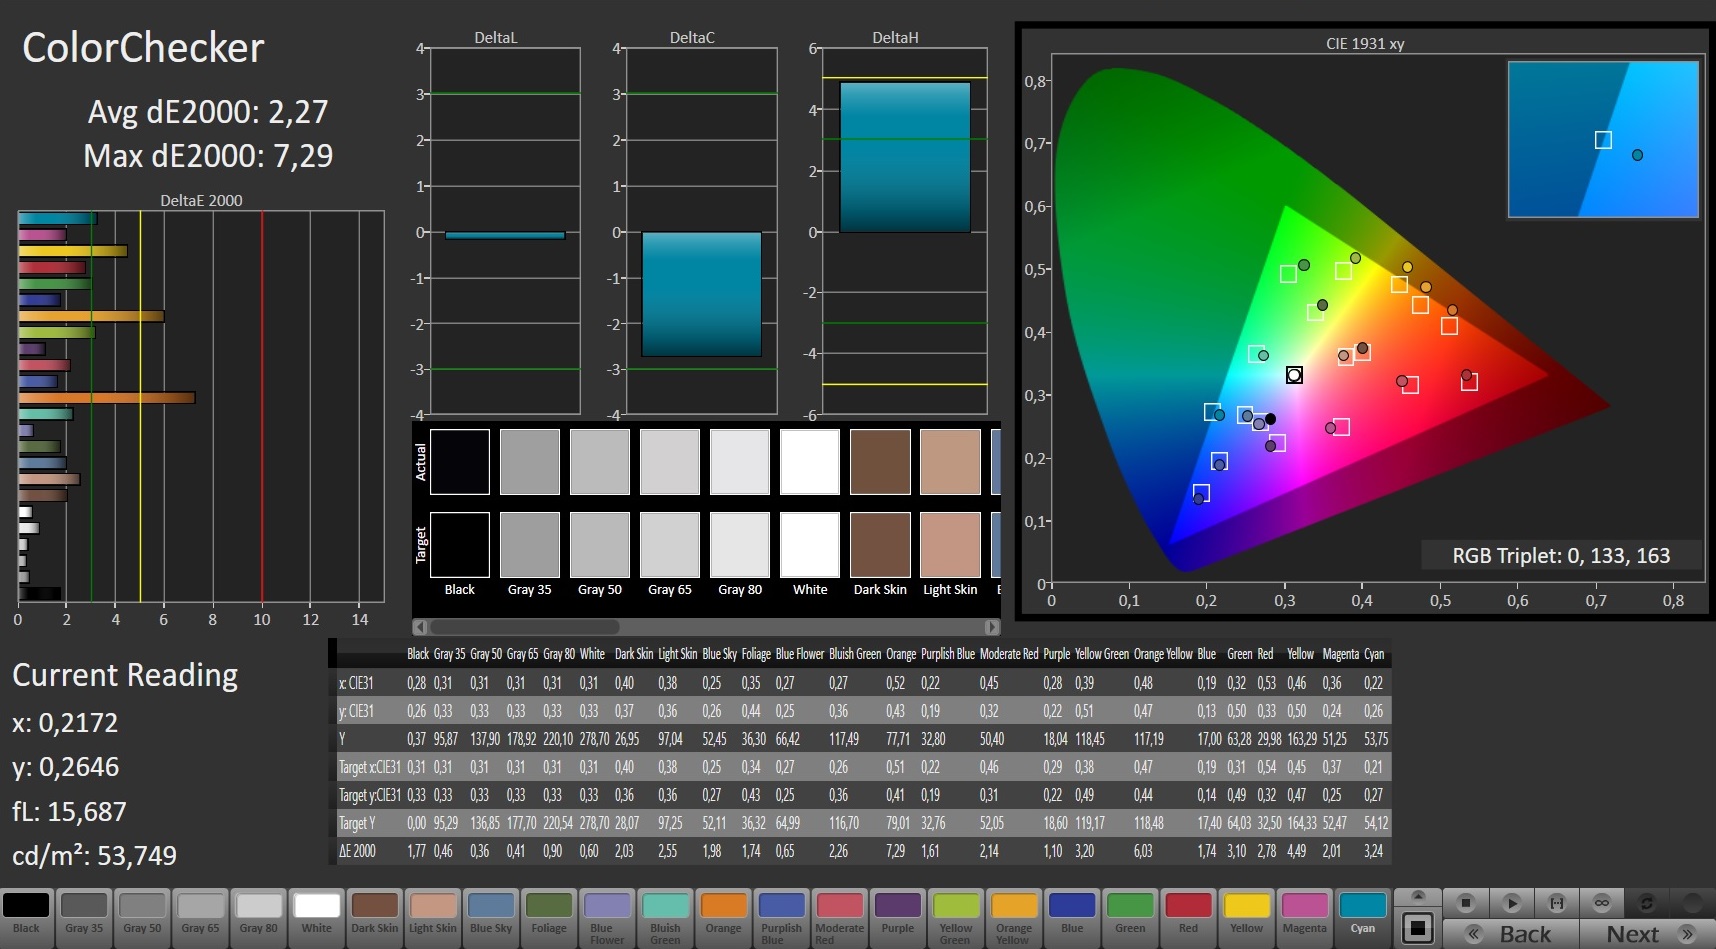
ΔE ColorChecker Calman: 4.9 | ∀{0.5-29.43 Ø4.81}
calibrated: 2.27
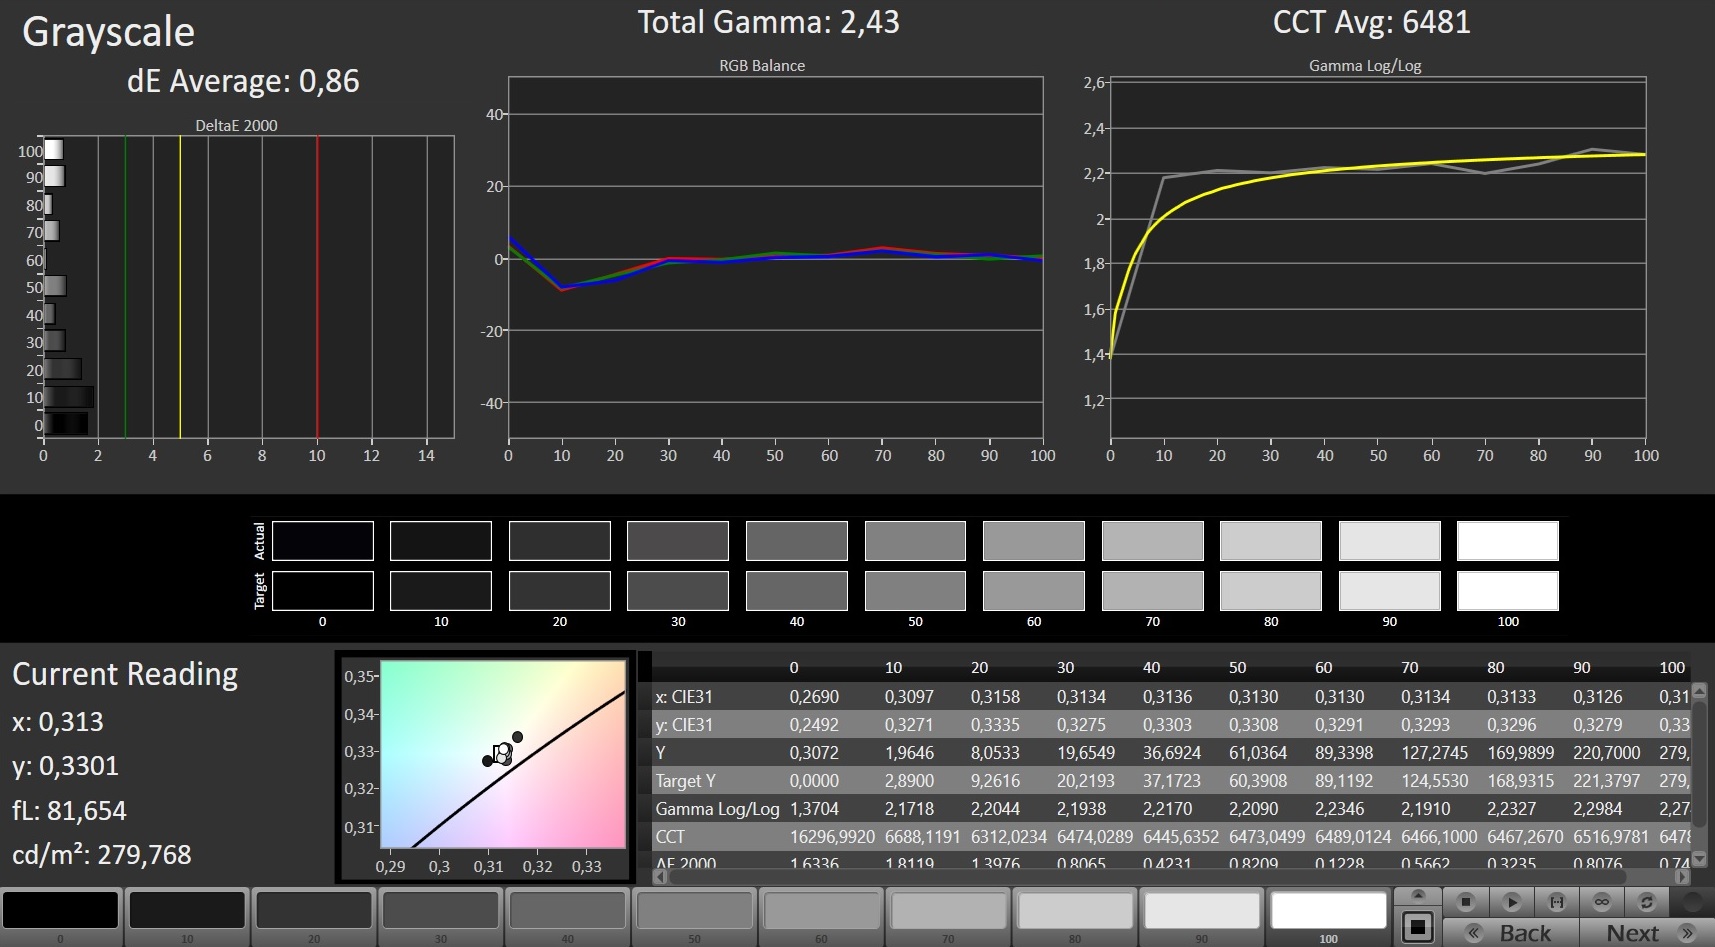
ΔE Greyscale Calman: 4.89 | ∀{0.09-98 Ø5.1}
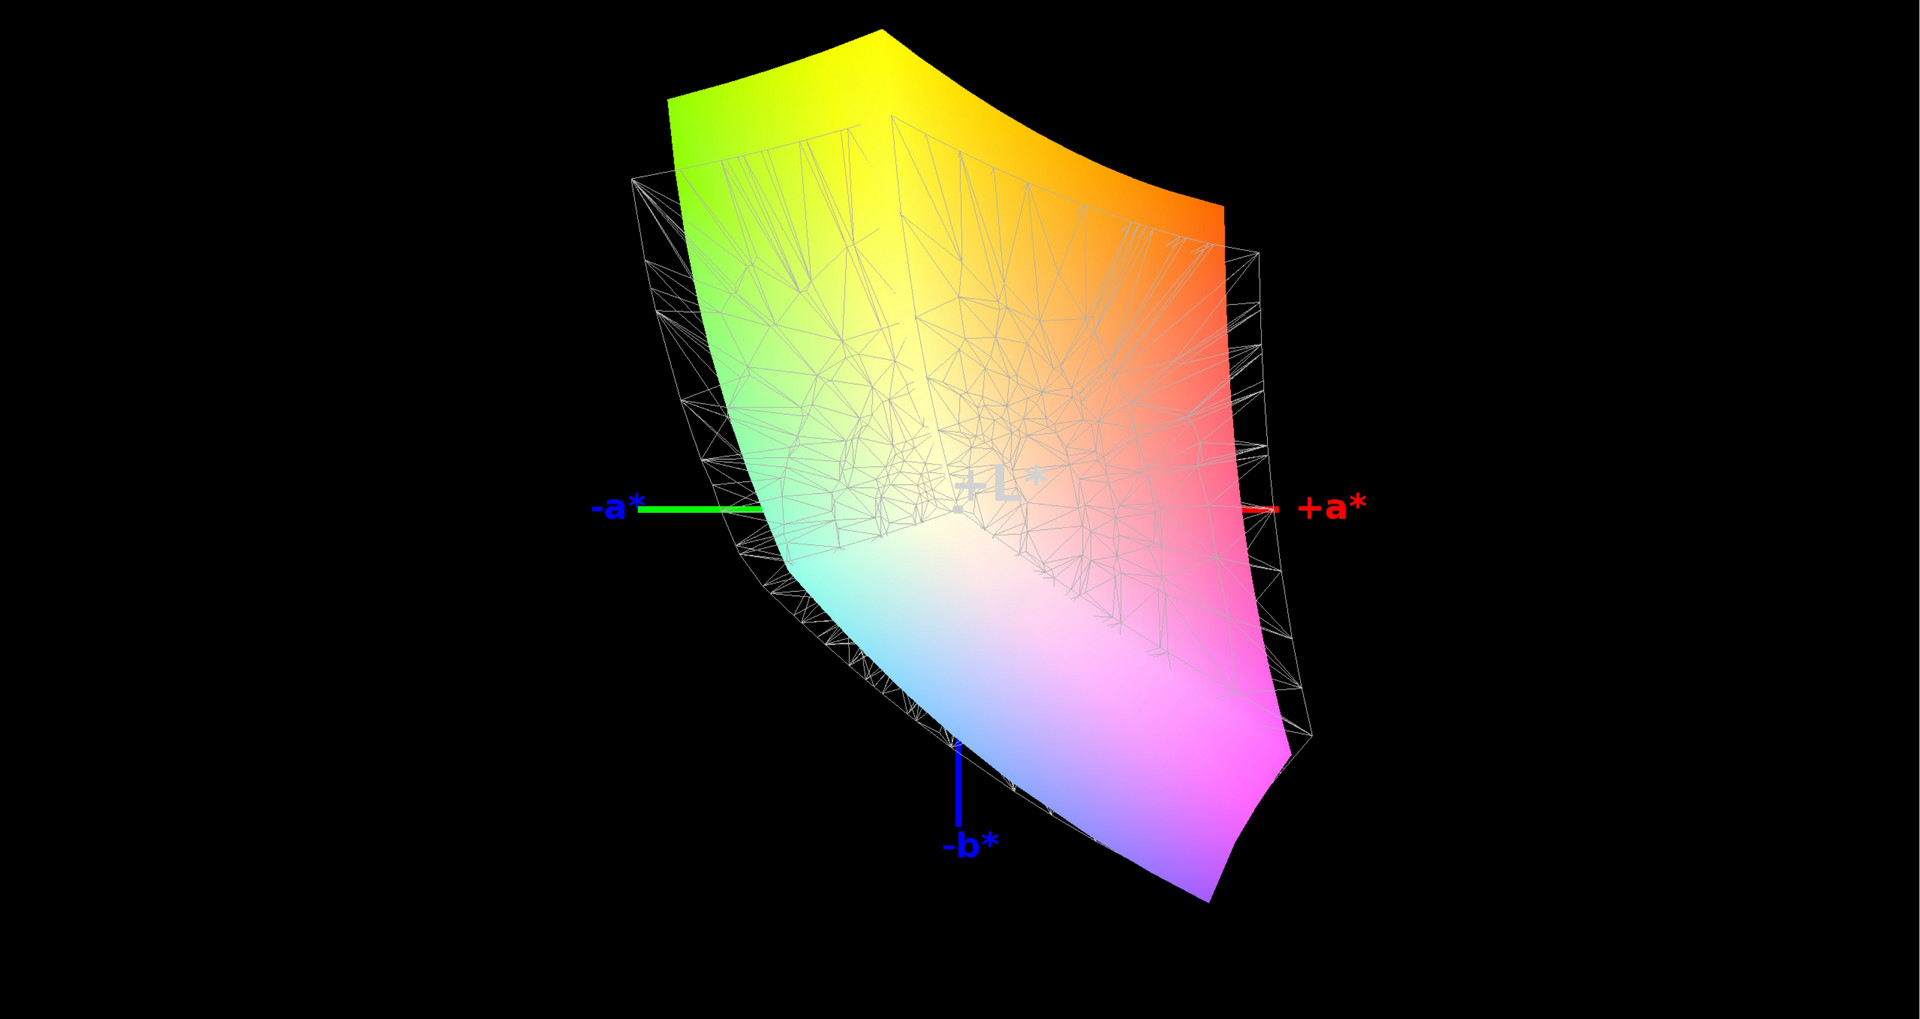
86% sRGB (Argyll 1.6.3 3D)
56% AdobeRGB 1998 (Argyll 1.6.3 3D)
63.1% AdobeRGB 1998 (Argyll 3D)
86.4% sRGB (Argyll 3D)
65.7% Display P3 (Argyll 3D)
Gamma: 2.36
CCT: 7598 K
| Alienware 15 R4 LG Philips LP156WF6 (LGD0540), IPS, 1920x1080 | Alienware 15 R3 HPJGK_B156HTN (AUO51ED), TN, 1920x1080 | Aorus X5 v8 AU Optronics B156HAN07.0 (AUO70ED), IPS, 1920x1080 | Razer Blade 15 2018 LGD05C0, IPS, 1920x1080 | Gigabyte Aero 15X v8 LGD05C0, IPS, 1920x1080 | |
|---|---|---|---|---|---|
| Display | 3% | 6% | 3% | 3% | |
| Display P3 Coverage (%) | 65.7 | 66 0% | 67.1 2% | 64.3 -2% | 63.6 -3% |
| sRGB Coverage (%) | 86.4 | 90.5 5% | 93.4 8% | 93.7 8% | 93.8 9% |
| AdobeRGB 1998 Coverage (%) | 63.1 | 66.2 5% | 68.1 8% | 65.5 4% | 64.9 3% |
| Response Times | 42% | 50% | 52% | 54% | |
| Response Time Grey 50% / Grey 80% * (ms) | 37.6 ? | 25 ? 34% | 18.8 ? 50% | 17.2 ? 54% | 16.8 ? 55% |
| Response Time Black / White * (ms) | 24 ? | 12 ? 50% | 12 ? 50% | 12 ? 50% | 11.2 ? 53% |
| PWM Frequency (Hz) | 20830 ? | ||||
| Screen | -25% | 22% | 16% | 24% | |
| Brightness middle (cd/m²) | 292 | 386 32% | 271 -7% | 290 -1% | 313 7% |
| Brightness (cd/m²) | 278 | 382 37% | 259 -7% | 281 1% | 300 8% |
| Brightness Distribution (%) | 88 | 93 6% | 87 -1% | 82 -7% | 78 -11% |
| Black Level * (cd/m²) | 0.29 | 0.39 -34% | 0.27 7% | 0.3 -3% | 0.33 -14% |
| Contrast (:1) | 1007 | 990 -2% | 1004 0% | 967 -4% | 948 -6% |
| Colorchecker dE 2000 * | 4.9 | 10.2 -108% | 1.81 63% | 2.85 42% | 1.29 74% |
| Colorchecker dE 2000 max. * | 10.08 | 15.81 -57% | 3.33 67% | 6.27 38% | 2.04 80% |
| Colorchecker dE 2000 calibrated * | 2.27 | 1.39 39% | |||
| Greyscale dE 2000 * | 4.89 | 11.28 -131% | 1.09 78% | 2.4 51% | 0.69 86% |
| Gamma | 2.36 93% | 2.23 99% | 2.45 90% | 2.34 94% | 2.43 91% |
| CCT | 7598 86% | 11383 57% | 6435 101% | 6718 97% | 6550 99% |
| Color Space (Percent of AdobeRGB 1998) (%) | 56 | 59 5% | 61 9% | 60 7% | 60 7% |
| Color Space (Percent of sRGB) (%) | 86 | 90 5% | 93 8% | 94 9% | 94 9% |
| Total Average (Program / Settings) | 7% /
-10% | 26% /
22% | 24% /
18% | 27% /
24% |
* ... smaller is better
Our test device is equipped with the default 1,920x1,080 60 Hz IPS display with G-Sync. According to AIDA64, this is an LG Philips LP156WF6 (LGD0540) panel.
Our test device achieved an average maximum brightness of 278.1 cd/m² when measured with X-Rite i1Pro2. This is slightly lower than most our comparison devices, but the 0.29 cd/m² black value is only second best to the AORUS X5 v8. This helps our test device achieve a 1,007:1 contrast ratio, which is higher than all our comparison devices.
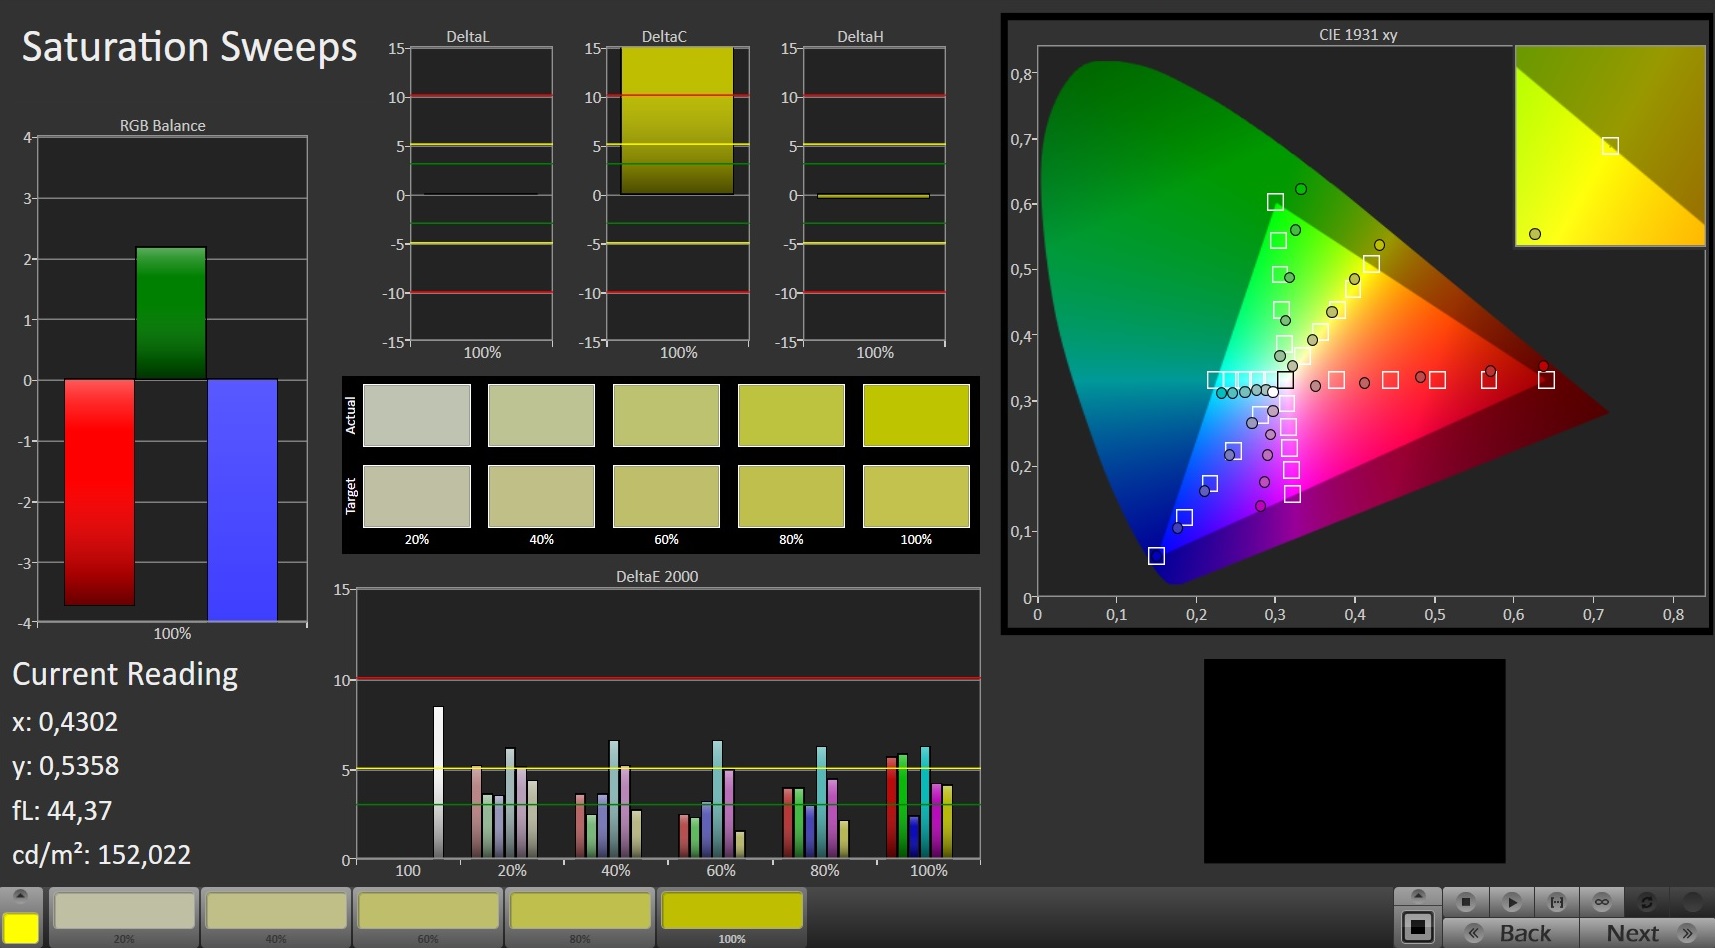
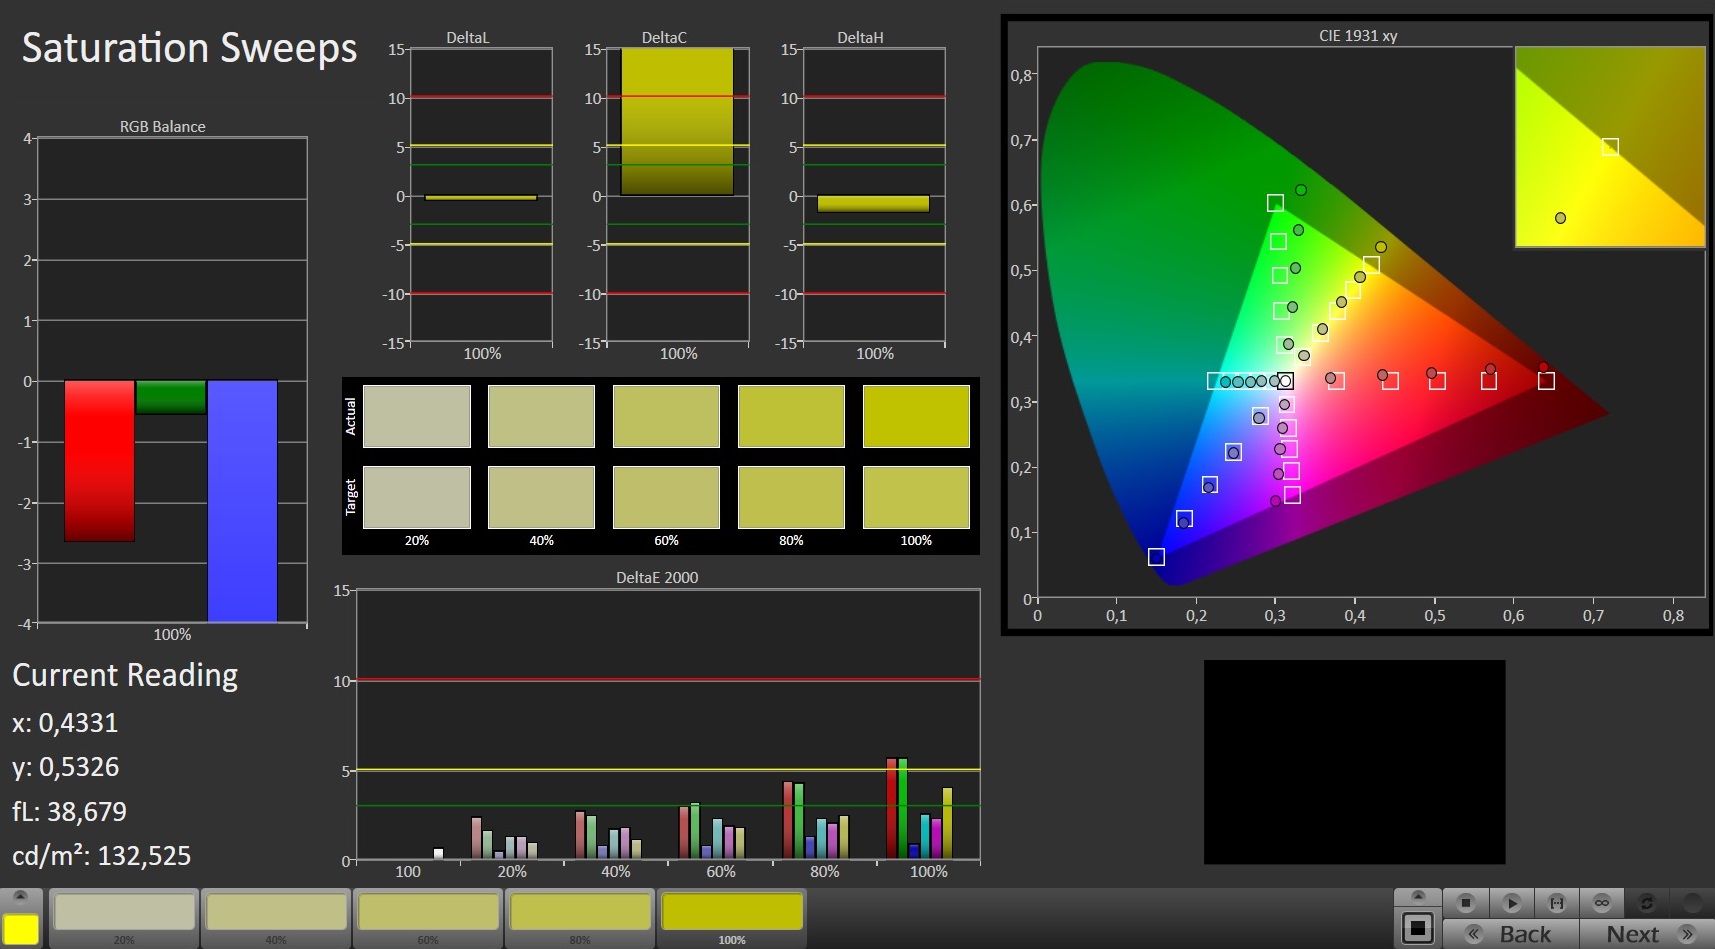
Color space coverage is good too at 86% sRGB and 56% AdobeRGB. The 15 R4 with the default display falls between 5-9% short of our comparison devices in this regard though.
Our test device has 24 ms black-to-white and 37.6 ms gray-to-gray reaction times. These are adequate for most uses, but some gamers may find these somewhat too slow.
Color accuracy is passable, but our test device’s display has a blue tint out of the box. We fixed this with further calibration and have included our ICC file should you wish to try our calibration on your machine.
The 15 R4 does use pulse-width modulation (PWM) to regulate brightness. Fortunately, this is at 20,830 Hz, which is such a high frequency that it should not even affect those who are PWM sensitive.

Our test device has strong viewing angles thanks to its IPS panel. There are no brightness or color distortions even at acute angles.
The 15 R4 is difficult to use outdoors on sunny days because of its relatively low maximum brightness. Content on the screen is hardly visible in direct sunlight, which makes the 15 R4 most suited to being used indoors.
Display Response Times
| ↔ Response Time Black to White | ||
|---|---|---|
| 24 ms ... rise ↗ and fall ↘ combined | ↗ 13.2 ms rise | 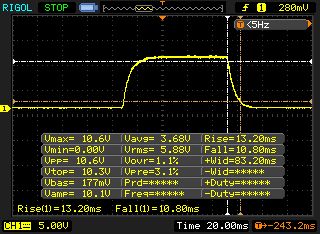 |
| ↘ 10.8 ms fall | ||
| The screen shows good response rates in our tests, but may be too slow for competitive gamers. In comparison, all tested devices range from 0.1 (minimum) to 240 (maximum) ms. » 52 % of all devices are better. This means that the measured response time is worse than the average of all tested devices (20.4 ms). | ||
| ↔ Response Time 50% Grey to 80% Grey | ||
| 37.6 ms ... rise ↗ and fall ↘ combined | ↗ 18.8 ms rise | 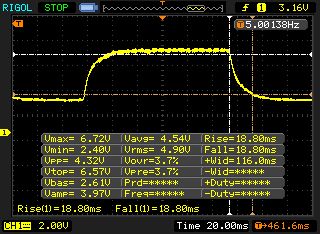 |
| ↘ 18.8 ms fall | ||
| The screen shows slow response rates in our tests and will be unsatisfactory for gamers. In comparison, all tested devices range from 0.165 (minimum) to 636 (maximum) ms. » 53 % of all devices are better. This means that the measured response time is worse than the average of all tested devices (31.9 ms). | ||
Screen Flickering / PWM (Pulse-Width Modulation)
| Screen flickering / PWM detected | 20830 Hz | ≤ 99 % brightness setting | 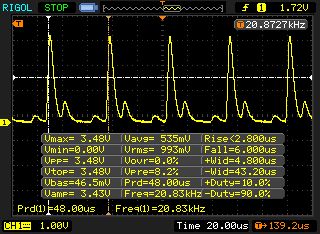 |
The display backlight flickers at 20830 Hz (worst case, e.g., utilizing PWM) Flickering detected at a brightness setting of 99 % and below. There should be no flickering or PWM above this brightness setting. The frequency of 20830 Hz is quite high, so most users sensitive to PWM should not notice any flickering. In comparison: 53 % of all tested devices do not use PWM to dim the display. If PWM was detected, an average of 8255 (minimum: 5 - maximum: 343500) Hz was measured. | |||
Performance
Alienware has significantly redesigned its Command Center utility as part of updating its devices to Coffee Lake CPUs. Command Center is arranged in tabs from left-to-right by Start Page, Library, FX and Fusion. All tabs have their distinct uses, with the start page summarizing all main features and the Library listing all installed games. Likewise, the FX tab handles system lighting, while the Fusion tab contains power, thermal, energy management and sound settings.
All settings shown in the screenshots are the default ones.
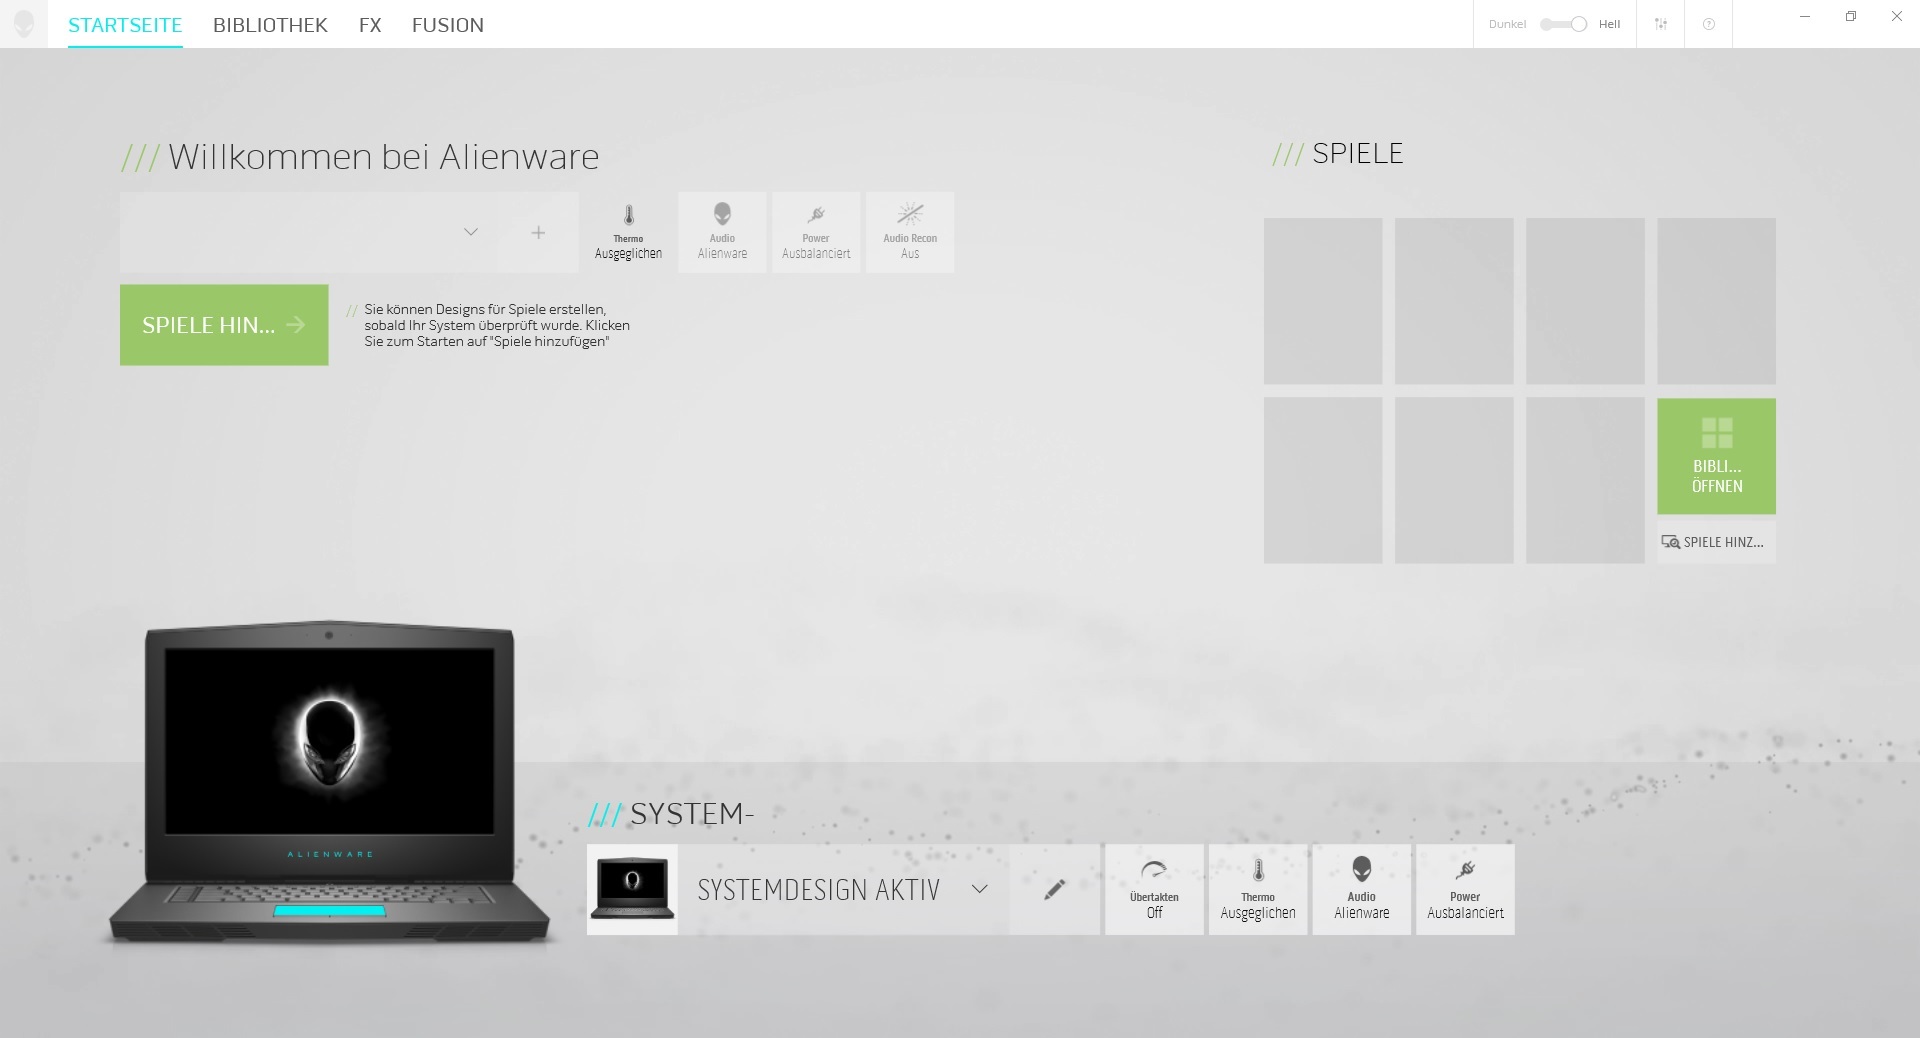
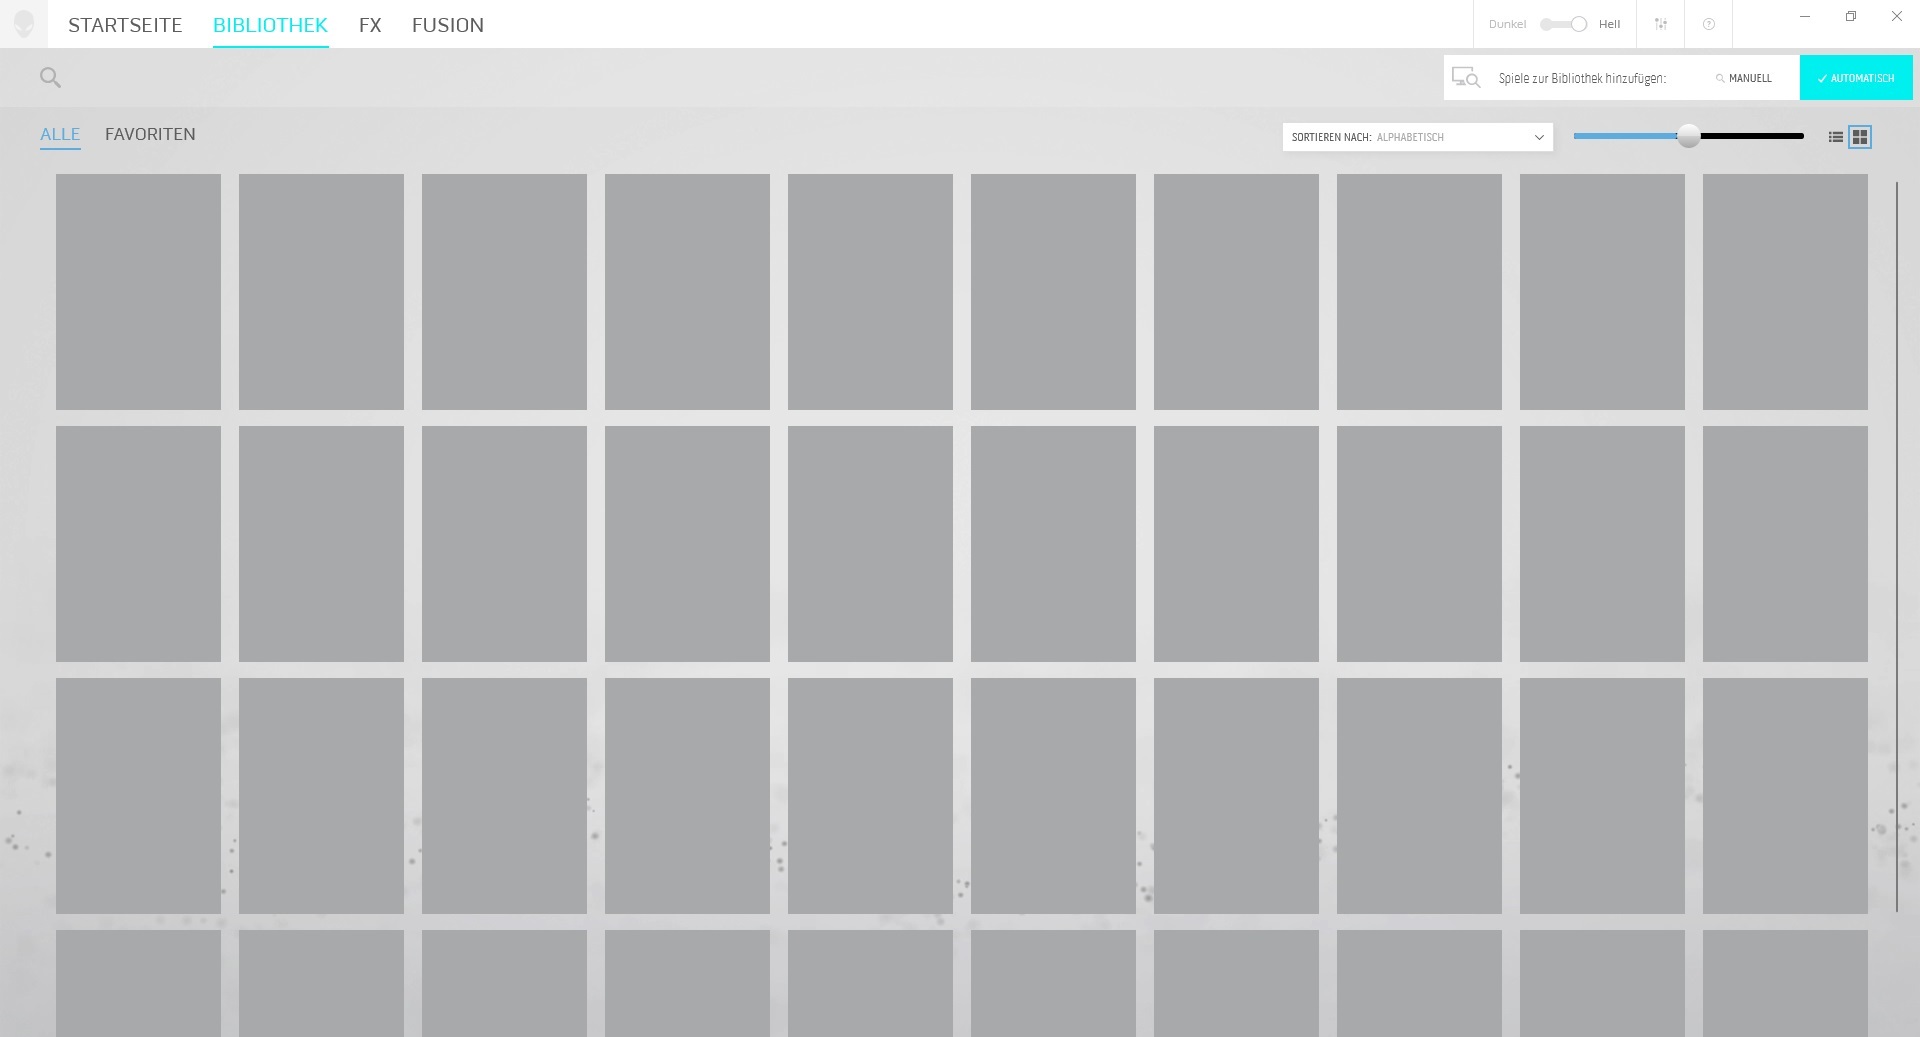
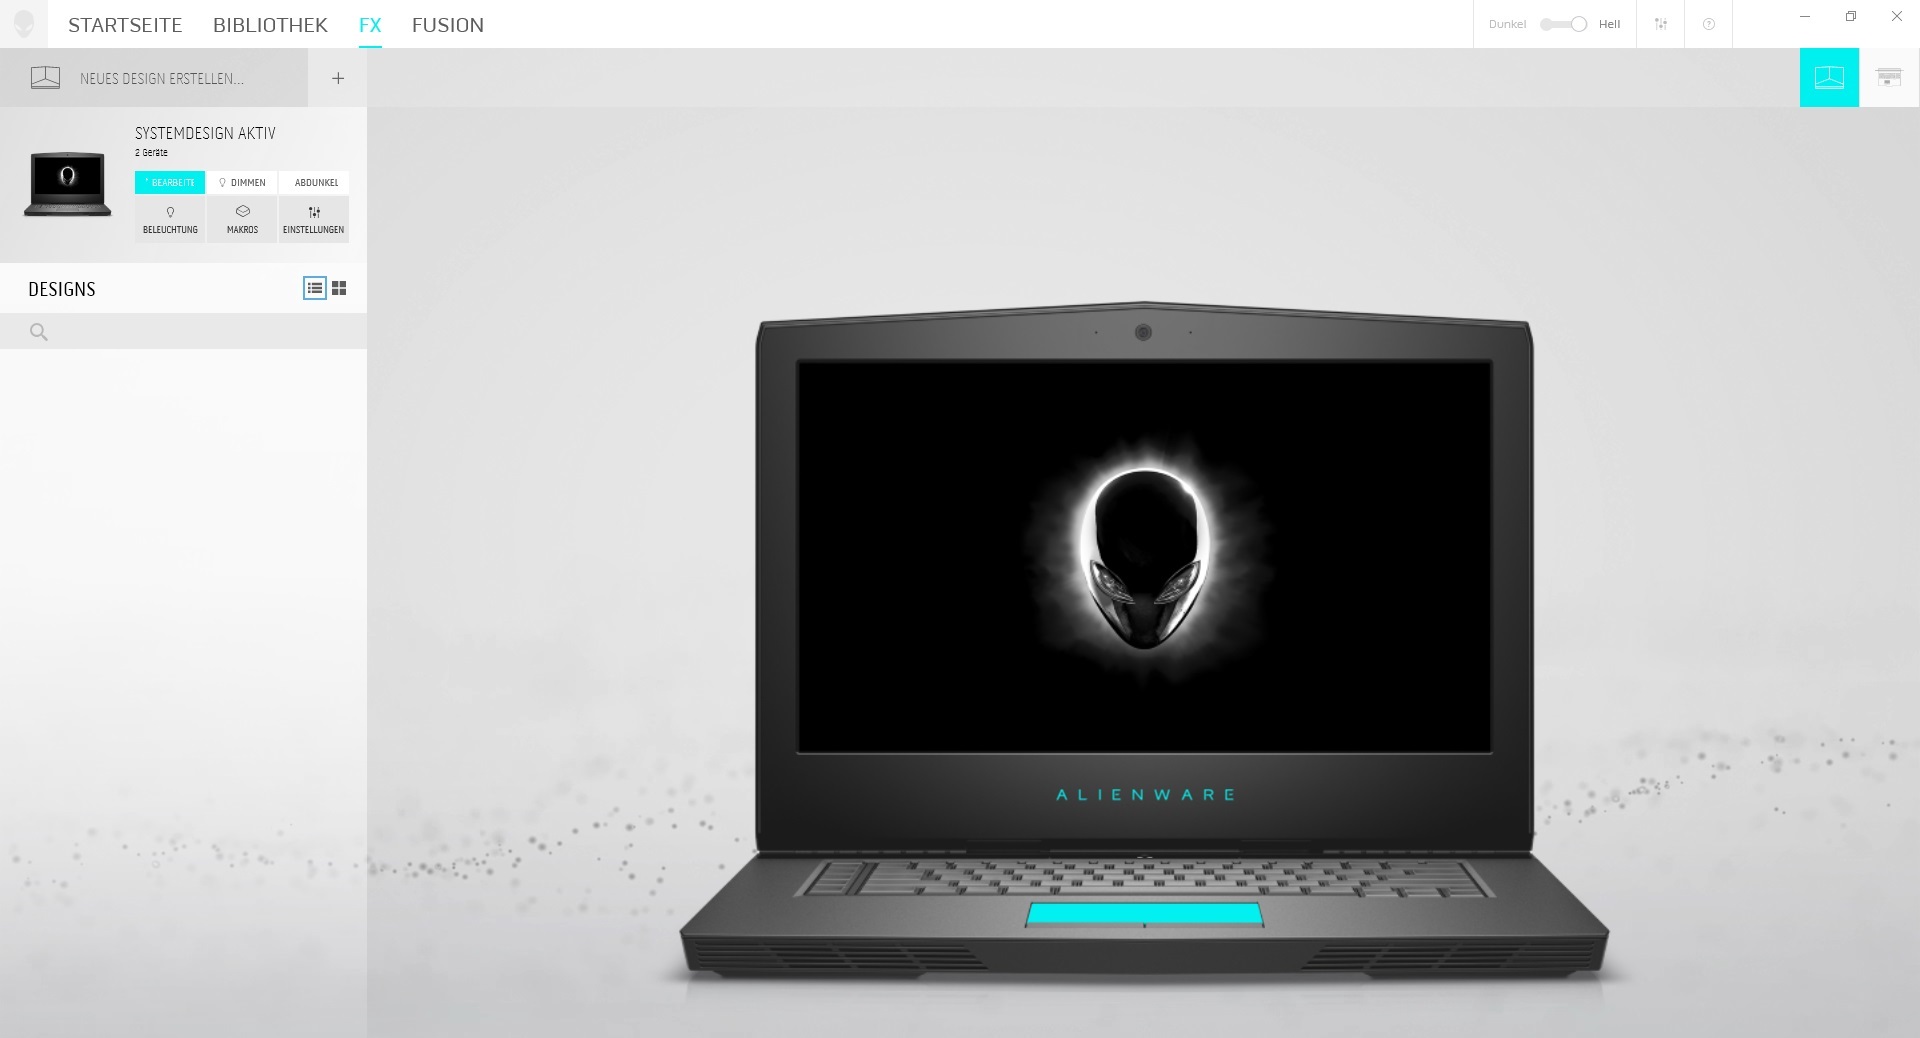
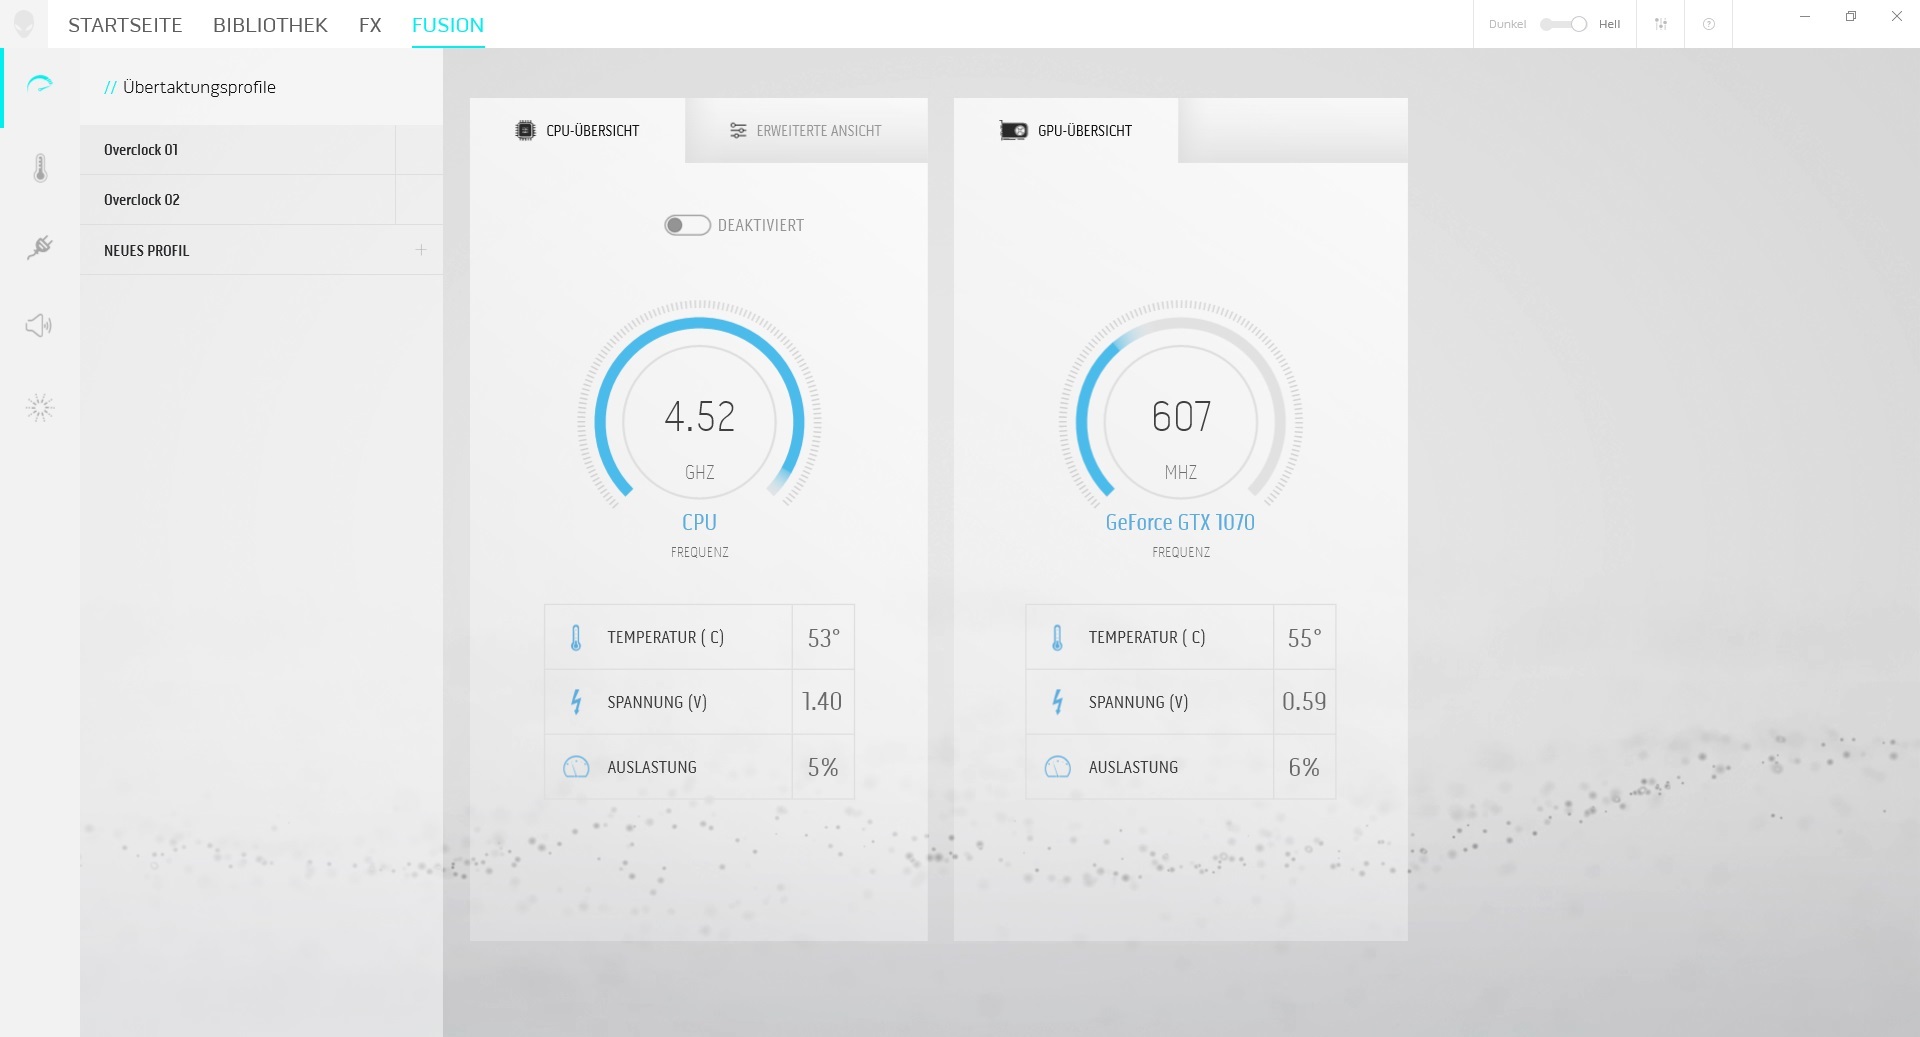
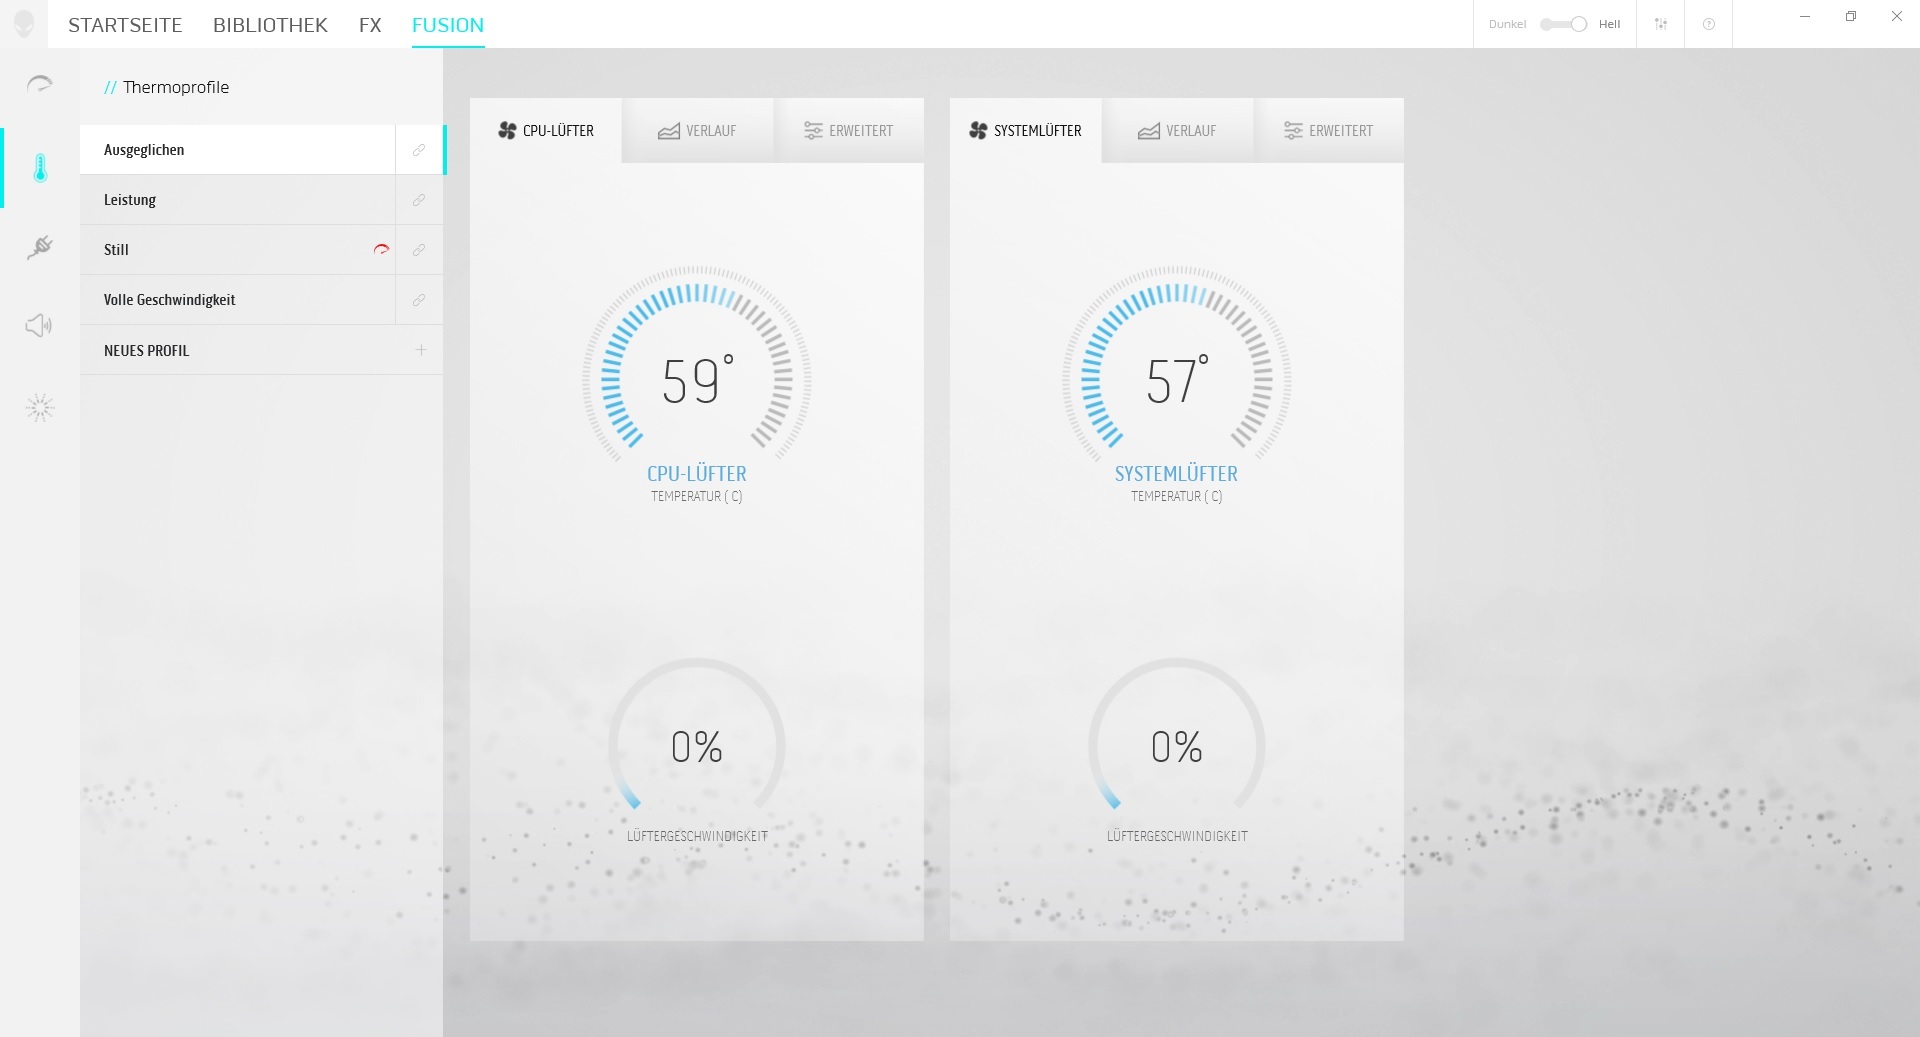
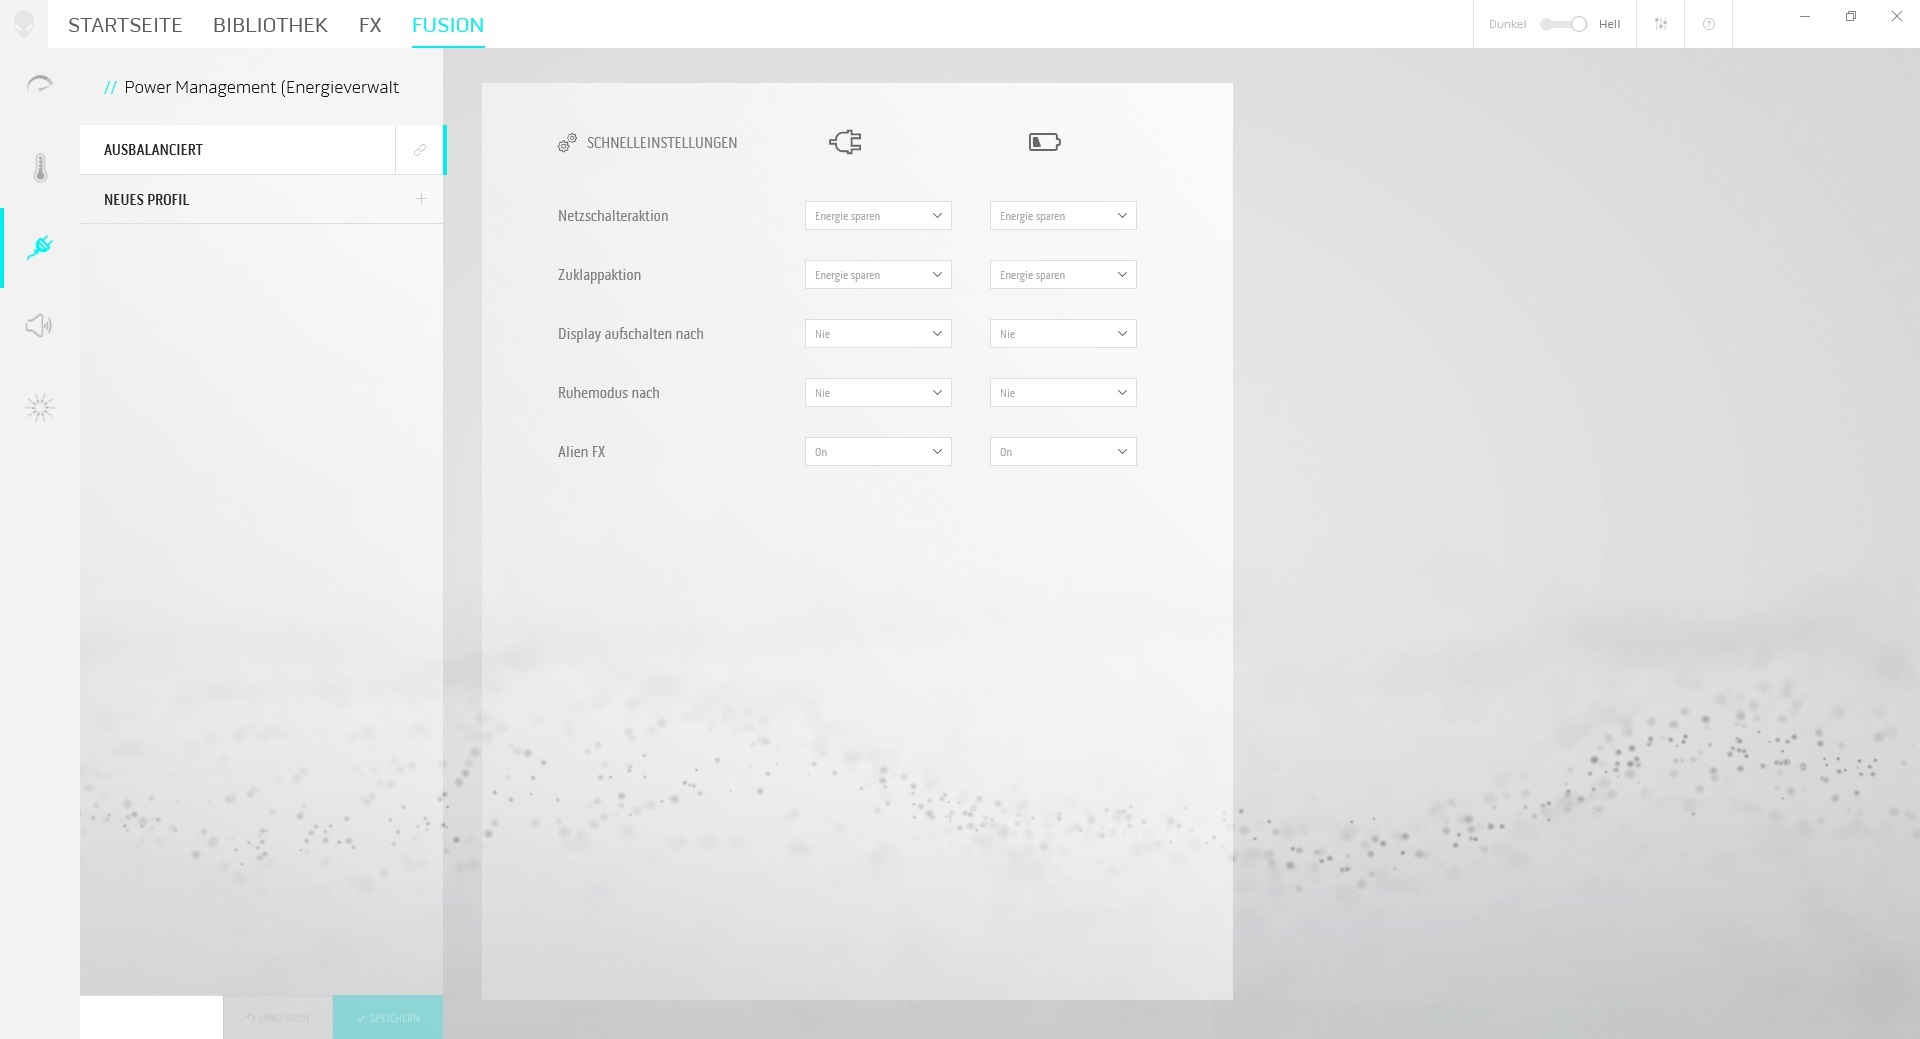
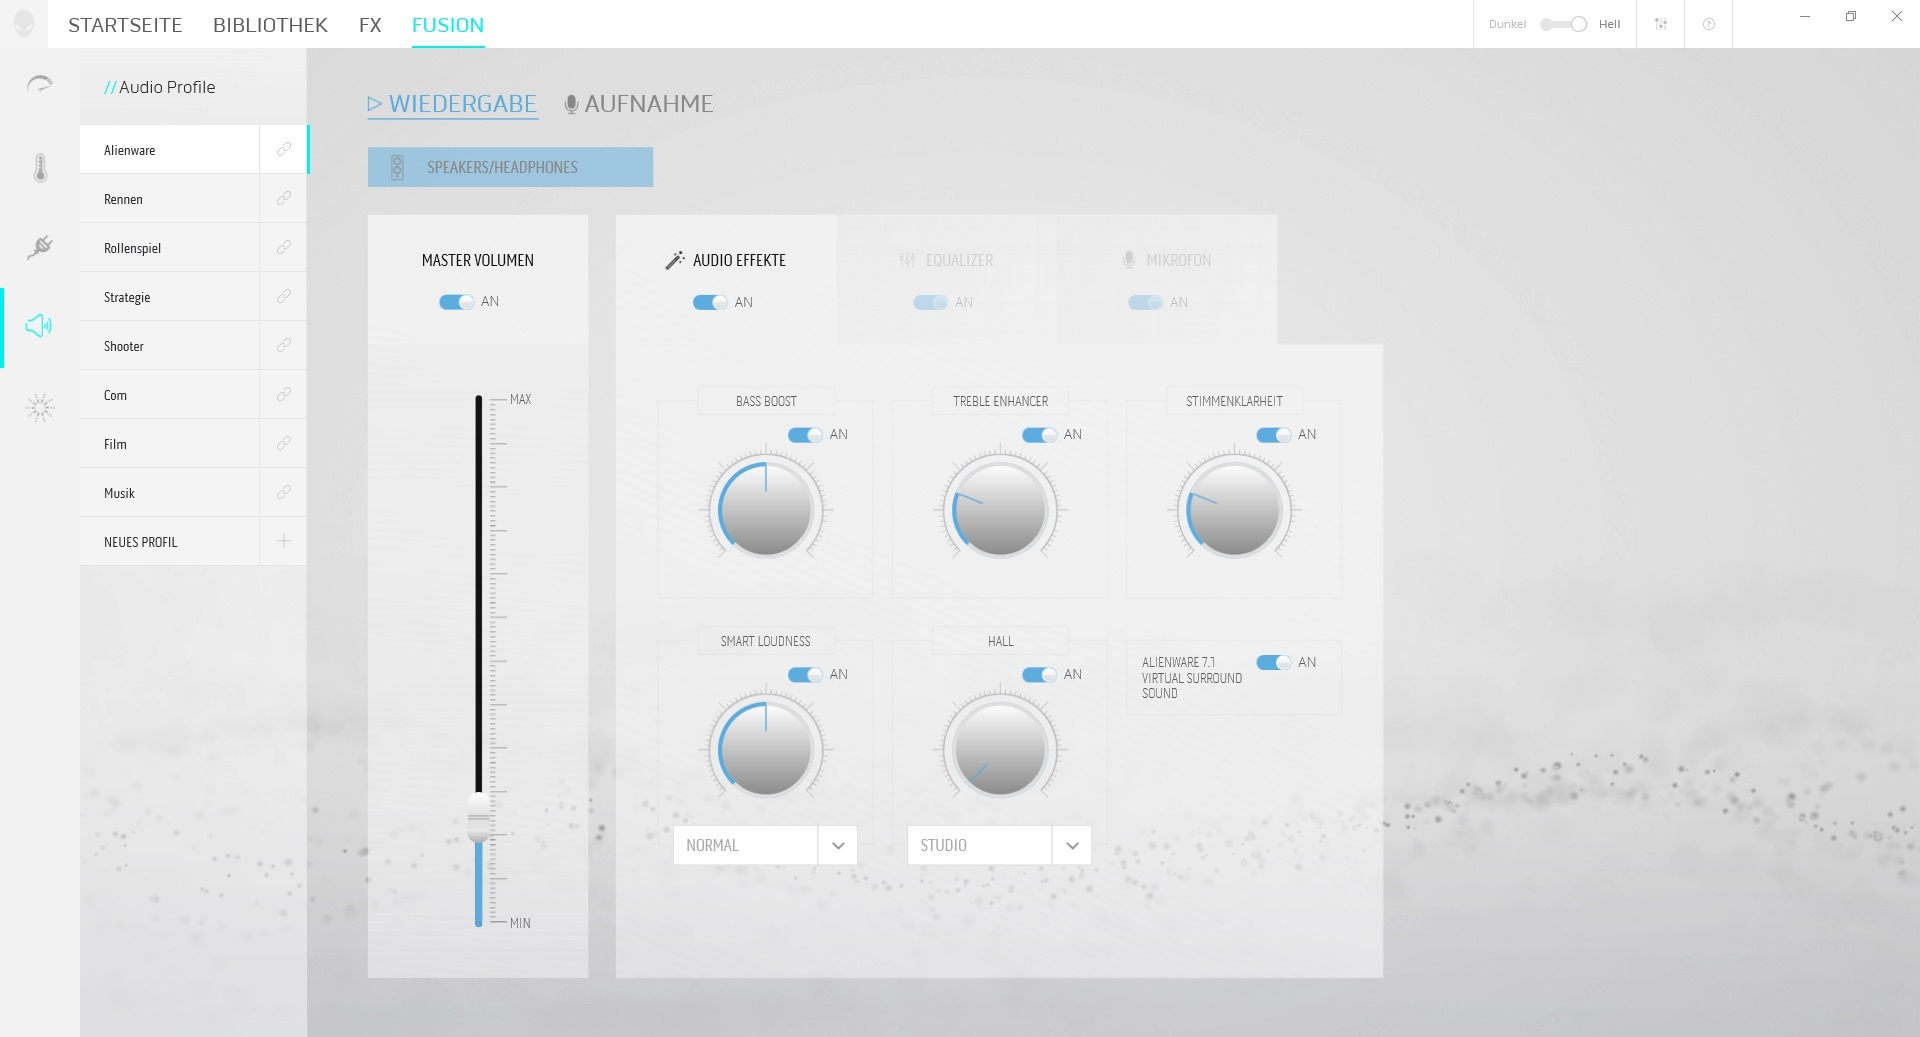
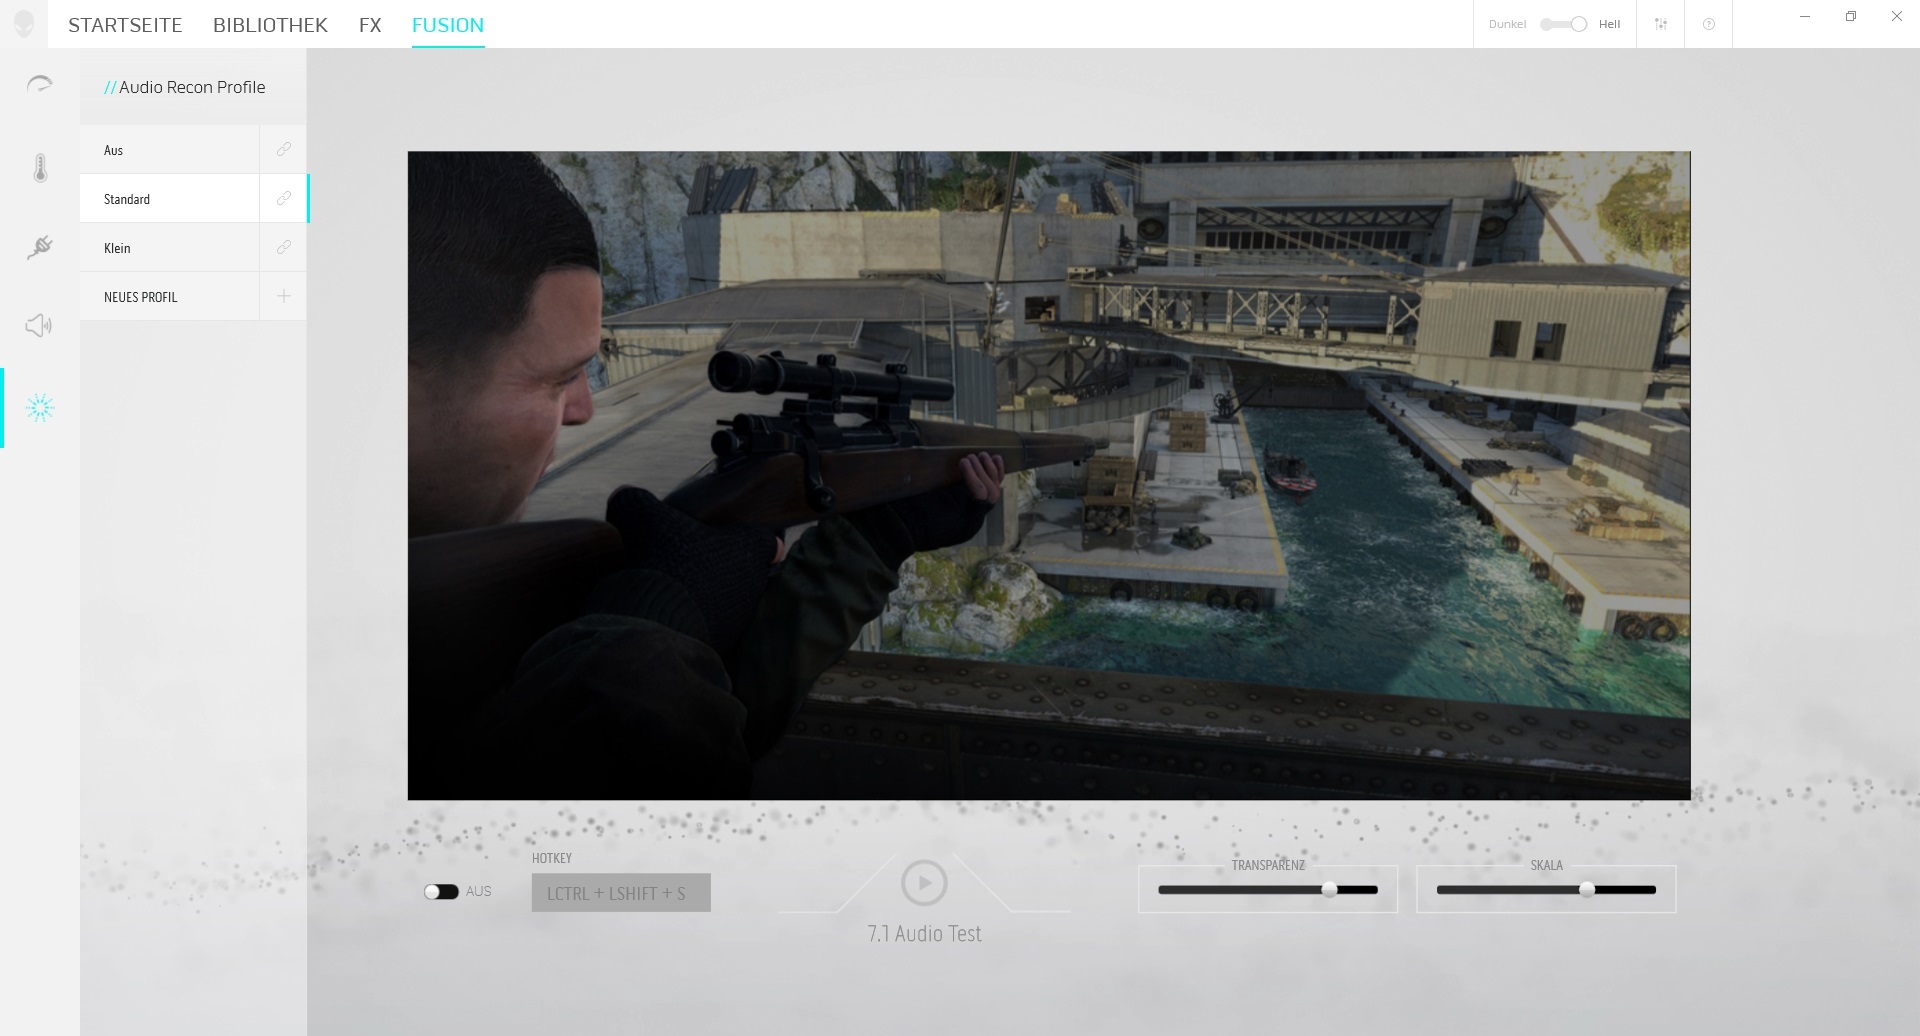
Unfortunately, the Command Center seems unfinished as the utility was missing some menus after multiple restarts.
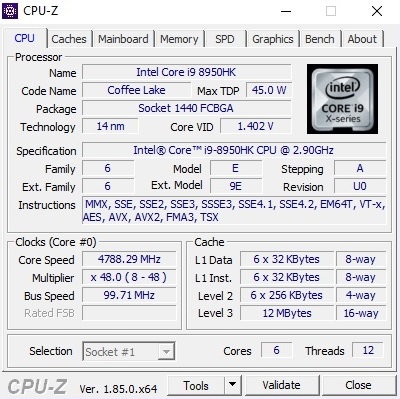
Processor
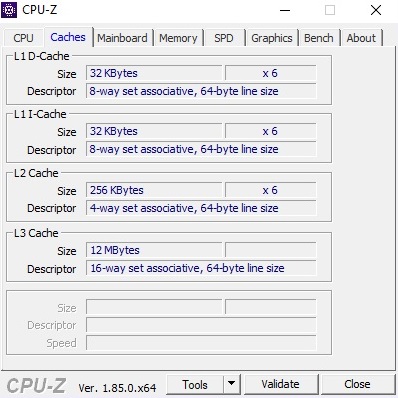
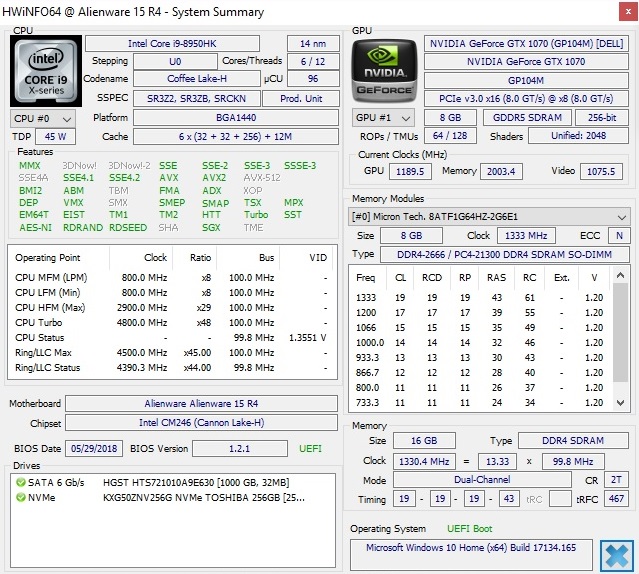
Our test is equipped with an Intel Core i9-8950HK processor. This is currently Intel’s top-end mobile CPU. The main advantages between the Core i9-8950HK and the Core i7-8750H are in terms of L3 cache and clock speed. The Core i9-8950HK has 12 MB L3 cache and a 4.8 GHz clock speed, which is 3 MB and 0.7 GHz more than the Core i7-8750H.
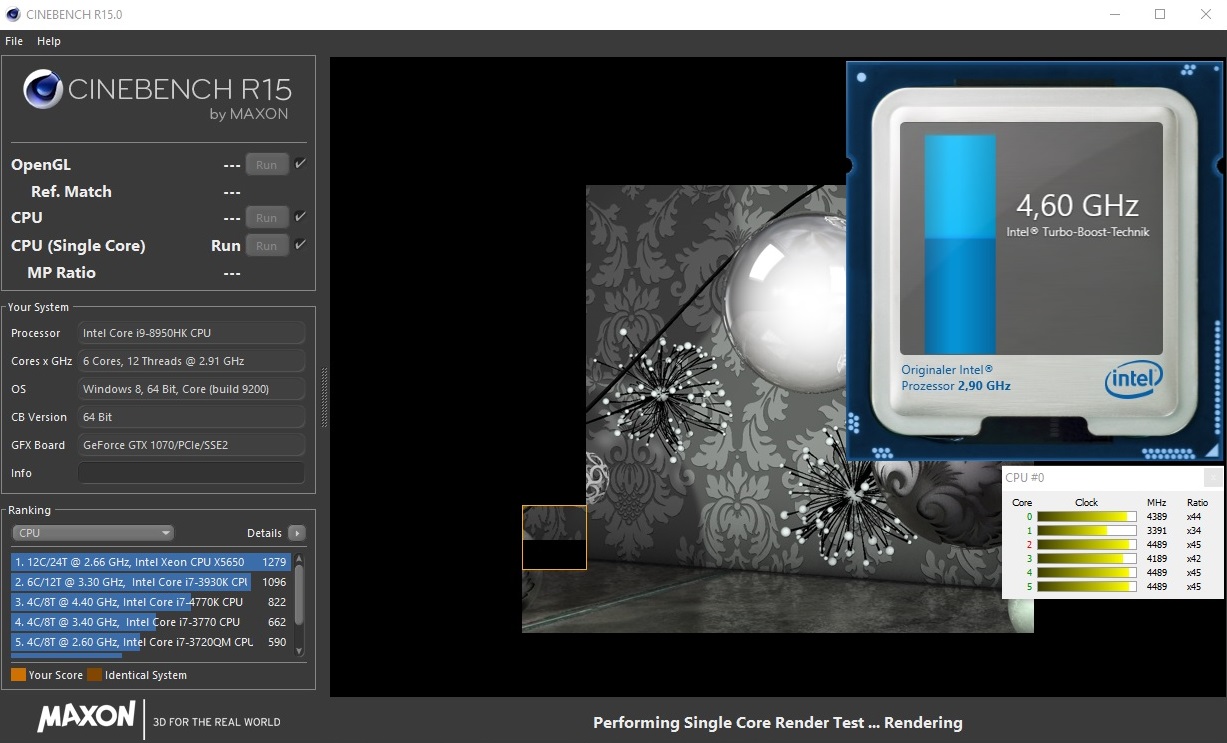
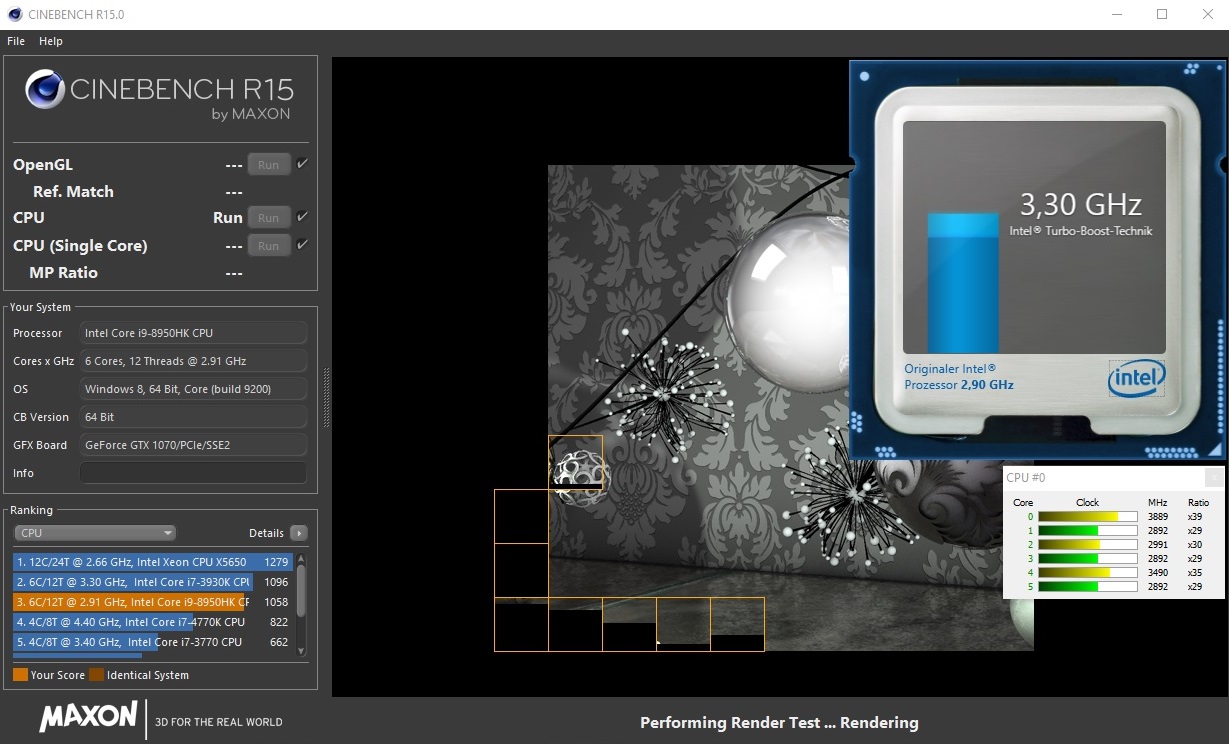
While the Core i9-8950HK has a theoretically high clock speed, our test device fails to deliver in CPU benchmarks. In Cinebench R15 multi-threaded benchmarks, our test device operated at between 2.9-4.2 GHz, averaging 3.3 GHz. Overall, the 15 R4 uses Turbo Boost ineffectively.
The relatively poor Turbo Boost performance means that our test device scores lower than the AORUS X5 v8 and the Gigabyte Aero 15X v8, which are powered by Intel Core i7-8850H and Intel Core i7-8750H processors respectively.
In short, it makes little sense for Alienware to have included the Core i9-8950HK as an option when the 15 R4 cannot make full use of it. Alienware has made the same mistake of equipping its predecessor with an Intel Core i7-7820HK too.
System Performance
Our test device scores comparatively well in system benchmarks despite poor Turbo Boost performance though. The 15 R4 takes second place in PCMark 10 in which our test device scored 6,008 points. This is only 2% slower than the AORUS X5 v8 and is 19% faster than both the Aero 15x v8 and the Razer Blade 15. The 15 R4 device performed comparatively worse in PCMark 8 though, with our test device finishing fourth, behind both the Aero 15x v8 and the Blade 15 .
We would recommend running Windows 10 from the SSD rather than the HDD. System performance is much snappier when running the OS from the former rather than the latter.
| PCMark 10 - Score | |
| Average of class Gaming (5776 - 9852, n=120, last 2 years) | |
| Aorus X5 v8 | |
| Alienware 15 R4 | |
| Gigabyte Aero 15X v8 | |
| Razer Blade 15 2018 | |
| PCMark 8 Home Score Accelerated v2 | 5541 points | |
| PCMark 8 Work Score Accelerated v2 | 5632 points | |
| PCMark 10 Score | 6008 points | |
Help | ||
Storage Devices
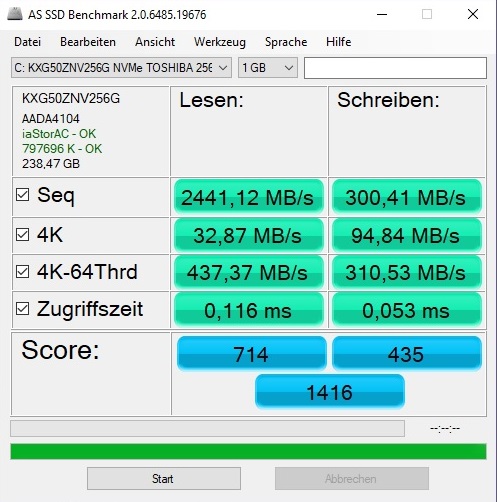
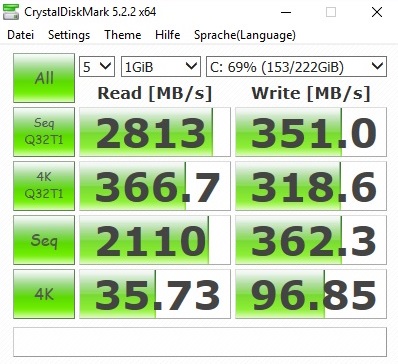
The 15 R4 has two drives, a 256 GB Toshiba XG5 KXG50ZNV256G M.2-2280 NVMe SSD and a 1 TB HGST Travelstar 7K1000 7,200 RPM HDD.
Our test device had a few SSD related driver issues, which meant that AS SSD benchmark occasionally recorded incorrect speeds. As a result, benchmark performance is a mixed bag. On the one hand, the Toshiba XG5 has excellent 4K Write and Sequential Read speeds, but its 300 MB Sequential Write speed is evocative of SATA III SSDs and not NVMe drives. Overall, the SSD in our test device is considerably slower than those in our comparison devices.
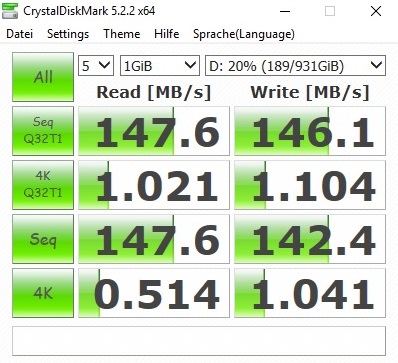
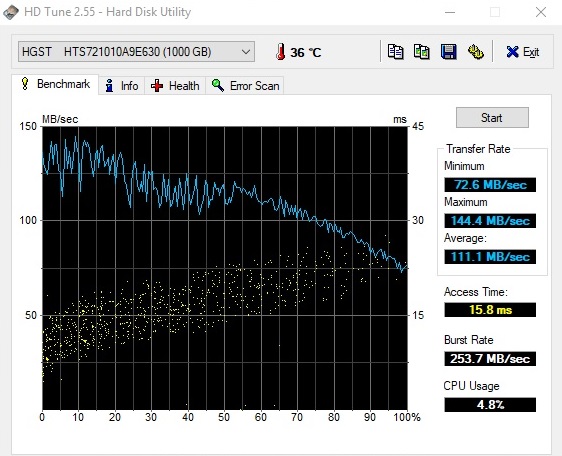
The 1 TB HDD is reasonably fast for an HDD, but it is still considerably slower than the 256 GB SSD. Hence, we would only recommend storing personal data and media as opposed to installing programs or the OS.
| Alienware 15 R4 Toshiba XG5 KXG50ZNV256G | Alienware 15 R3 | Aorus X5 v8 Toshiba NVMe THNSN5512GPU7 | Razer Blade 15 2018 Samsung PM961 NVMe MZVLW512HMJP | Gigabyte Aero 15X v8 Toshiba NVMe THNSN5512GPU7 | |
|---|---|---|---|---|---|
| AS SSD | 57% | 138% | 69% | ||
| Seq Read (MB/s) | 2441 | 1813 -26% | 2376 -3% | 2213 -9% | |
| Seq Write (MB/s) | 300.4 | 966 222% | 1521 406% | 1163 287% | |
| 4K Read (MB/s) | 32.87 | 23.21 -29% | 46.45 41% | 23.36 -29% | |
| 4K Write (MB/s) | 94.8 | 84.5 -11% | 93.6 -1% | 80.4 -15% | |
| Score Read (Points) | 714 | 1061 49% | 1584 122% | 1092 53% | |
| Score Write (Points) | 435 | 954 119% | 1450 233% | 939 116% | |
| Score Total (Points) | 1416 | 2515 78% | 3806 169% | 2536 79% |

Graphics Card
Dell offers the choice between three GPUs, an NVIDIA GeForce GTX 1060, a GeForce GTX 1070 or a GeForce GTX 1080 Max-Q. The GeForce GTX 1060 should be powerful enough to run games in high to maximum details on the Full HD panel. If you choose the 120 Hz TN panel, we would recommend pairing it with the GeForce GTX 1070 to take advantage of higher framerates. The GeForce GTX 1080 Max-Q is on par with the GeForce GTX 1070, which makes it unsuitable for 4K gaming. Hence, it would have been better had Dell offered the standard GeForce GTX 1080 as an option.
| 3DMark - 1920x1080 Fire Strike Graphics | |
| Average of class Gaming (2913 - 62849, n=147, last 2 years) | |
| Alienware 15 R3 | |
| Alienware 15 R4 | |
| Aorus X5 v8 | |
| Razer Blade 15 2018 | |
| Gigabyte Aero 15X v8 | |
| 3DMark 11 - 1280x720 Performance GPU | |
| Average of class Gaming (10741 - 76300, n=131, last 2 years) | |
| Alienware 15 R4 | |
| Alienware 15 R3 | |
| Aorus X5 v8 | |
| Razer Blade 15 2018 | |
| Gigabyte Aero 15X v8 | |
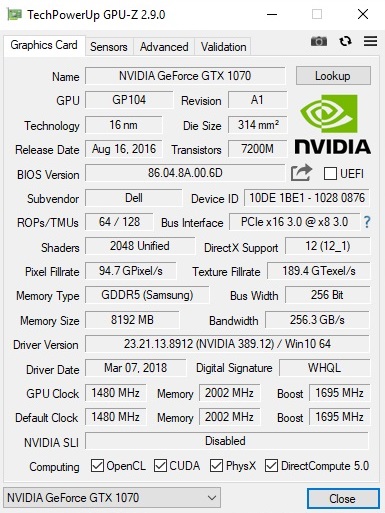
Our test device is equipped with a GeForce GTX 1070. GPU performance is comparable to other GeForce GTX 1070 notebooks such as the 15 R3 or the AORUS X5 v8. By contrast, the 15 R4 is between 12-22% faster than our comparison devices with GeForce GTX 1070 Max-Q GPUs.
| 3DMark 11 Performance | 18159 points | |
| 3DMark Ice Storm Standard Score | 174480 points | |
| 3DMark Cloud Gate Standard Score | 32574 points | |
| 3DMark Fire Strike Score | 14903 points | |
Help | ||
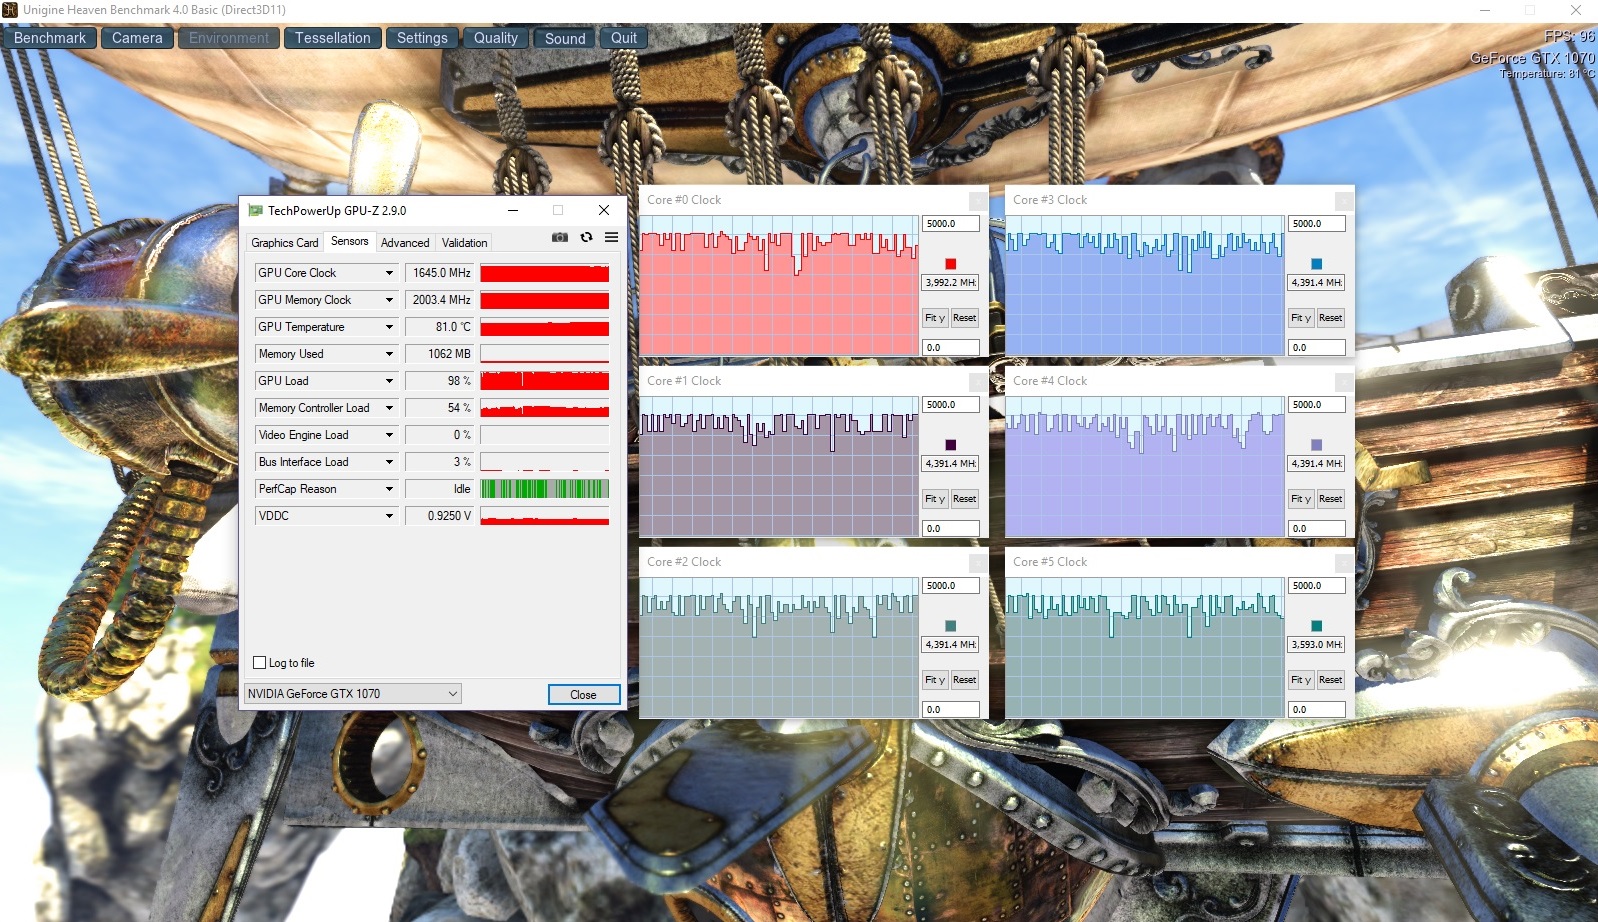
The GPU has much better turbo performance than the CPU. The GeForce GTX 1070 has a 1,443 MHz base clock speed, which can boost up to 1,645 MHz when required. Our test device maintained its full turbo speed after playing “The Witcher 3” for an hour at Ultra detail in 1,920x1,080.
Gaming Performance
Playing games in 1,920x1,080 rarely makes the GeForce GTX 1070 sweat. Our test device ran six of the nine games that we tested in over 100 FPS at maximum details, which makes the 120 Hz a good optional purchase. In short, the 15 R4 will be able to handle any game that you throw at it with ease.
| The Witcher 3 - 1920x1080 Ultra Graphics & Postprocessing (HBAO+) | |
| Average of class Gaming (18.4 - 224, n=68, last 2 years) | |
| Aorus X5 v8 | |
| Alienware 15 R4 | |
| Razer Blade 15 2018 | |
| Gigabyte Aero 15X v8 | |
Our test device has G-Sync support too, which is designed to improve the overall gaming experience by eliminating screen tearing. It is worth bearing in mind that not every user notices this at first glance though.
| low | med. | high | ultra | |
|---|---|---|---|---|
| The Witcher 3 (2015) | 108 | 59.5 | ||
| Rainbow Six Siege (2015) | 209 | 178 | ||
| Farming Simulator 17 (2016) | 278 | 250 | ||
| FIFA 18 (2017) | 357 | 341 | ||
| Destiny 2 (2017) | 135 | 121 | ||
| Wolfenstein II: The New Colossus (2017) | 110 | 103 | ||
| Need for Speed Payback (2017) | 116 | 110 | ||
| Far Cry 5 (2018) | 93 | 88 | ||
| The Crew 2 (2018) | 60 | 60 |
Emissions
Fan Noise
The 15 R4 is a loud device, regardless of what it is doing. Our test device averages 33 dB(A) at idle, but this can increase up to 50 dB(A). Likewise, the fans can reach up to 51 dB(A) under load, which is so loud that we would recommend using headphones if you are gaming.
The competition has similarly loud fans too, which is an unfortunate consequence of housing powerful components in a slim case.
Dell needs to fine-tune the 15 R4’s fan behavior at idle as the fans can suddenly kick in at full throttle without any reason. Ideally, the fans should run so quiet that we can only hear the subtle noise of the HDD, but the apparently random loud fan noise at idle quickly becomes annoying.
Noise Level
| Idle |
| 32 / 33 / 50 dB(A) |
| HDD |
| 32 dB(A) |
| Load |
| 50 / 51 dB(A) |
 | ||
30 dB silent 40 dB(A) audible 50 dB(A) loud |
||
min: | ||
| Alienware 15 R4 i9-8950HK, GeForce GTX 1070 Mobile | Alienware 15 R3 i7-7700HQ, GeForce GTX 1070 Mobile | Aorus X5 v8 i7-8850H, GeForce GTX 1070 Mobile | Razer Blade 15 2018 i7-8750H, GeForce GTX 1070 Max-Q | Gigabyte Aero 15X v8 i7-8750H, GeForce GTX 1070 Max-Q | Average of class Gaming | |
|---|---|---|---|---|---|---|
| Noise | 4% | 2% | 9% | 5% | 17% | |
| off / environment * (dB) | 29 | 30 -3% | 30 -3% | 29 -0% | 29 -0% | 24.1 ? 17% |
| Idle Minimum * (dB) | 32 | 31 3% | 33 -3% | 29 9% | 30 6% | 26.1 ? 18% |
| Idle Average * (dB) | 33 | 32 3% | 35 -6% | 30 9% | 31 6% | 27.7 ? 16% |
| Idle Maximum * (dB) | 50 | 42 16% | 40 20% | 38 24% | 35 30% | 30.4 ? 39% |
| Load Average * (dB) | 50 | 49 2% | 45 10% | 46 8% | 49 2% | 42.8 ? 14% |
| Witcher 3 ultra * (dB) | 51 | 50 2% | 49 4% | 51 -0% | ||
| Load Maximum * (dB) | 51 | 50 2% | 55 -8% | 46 10% | 54 -6% | 53.7 ? -5% |
* ... smaller is better
Temperature
The 15 R4 struggles to manage its surface temperatures despite its loud fan. The palm rest averages 30 °C (~86 °F) under maximum load, which is passable.
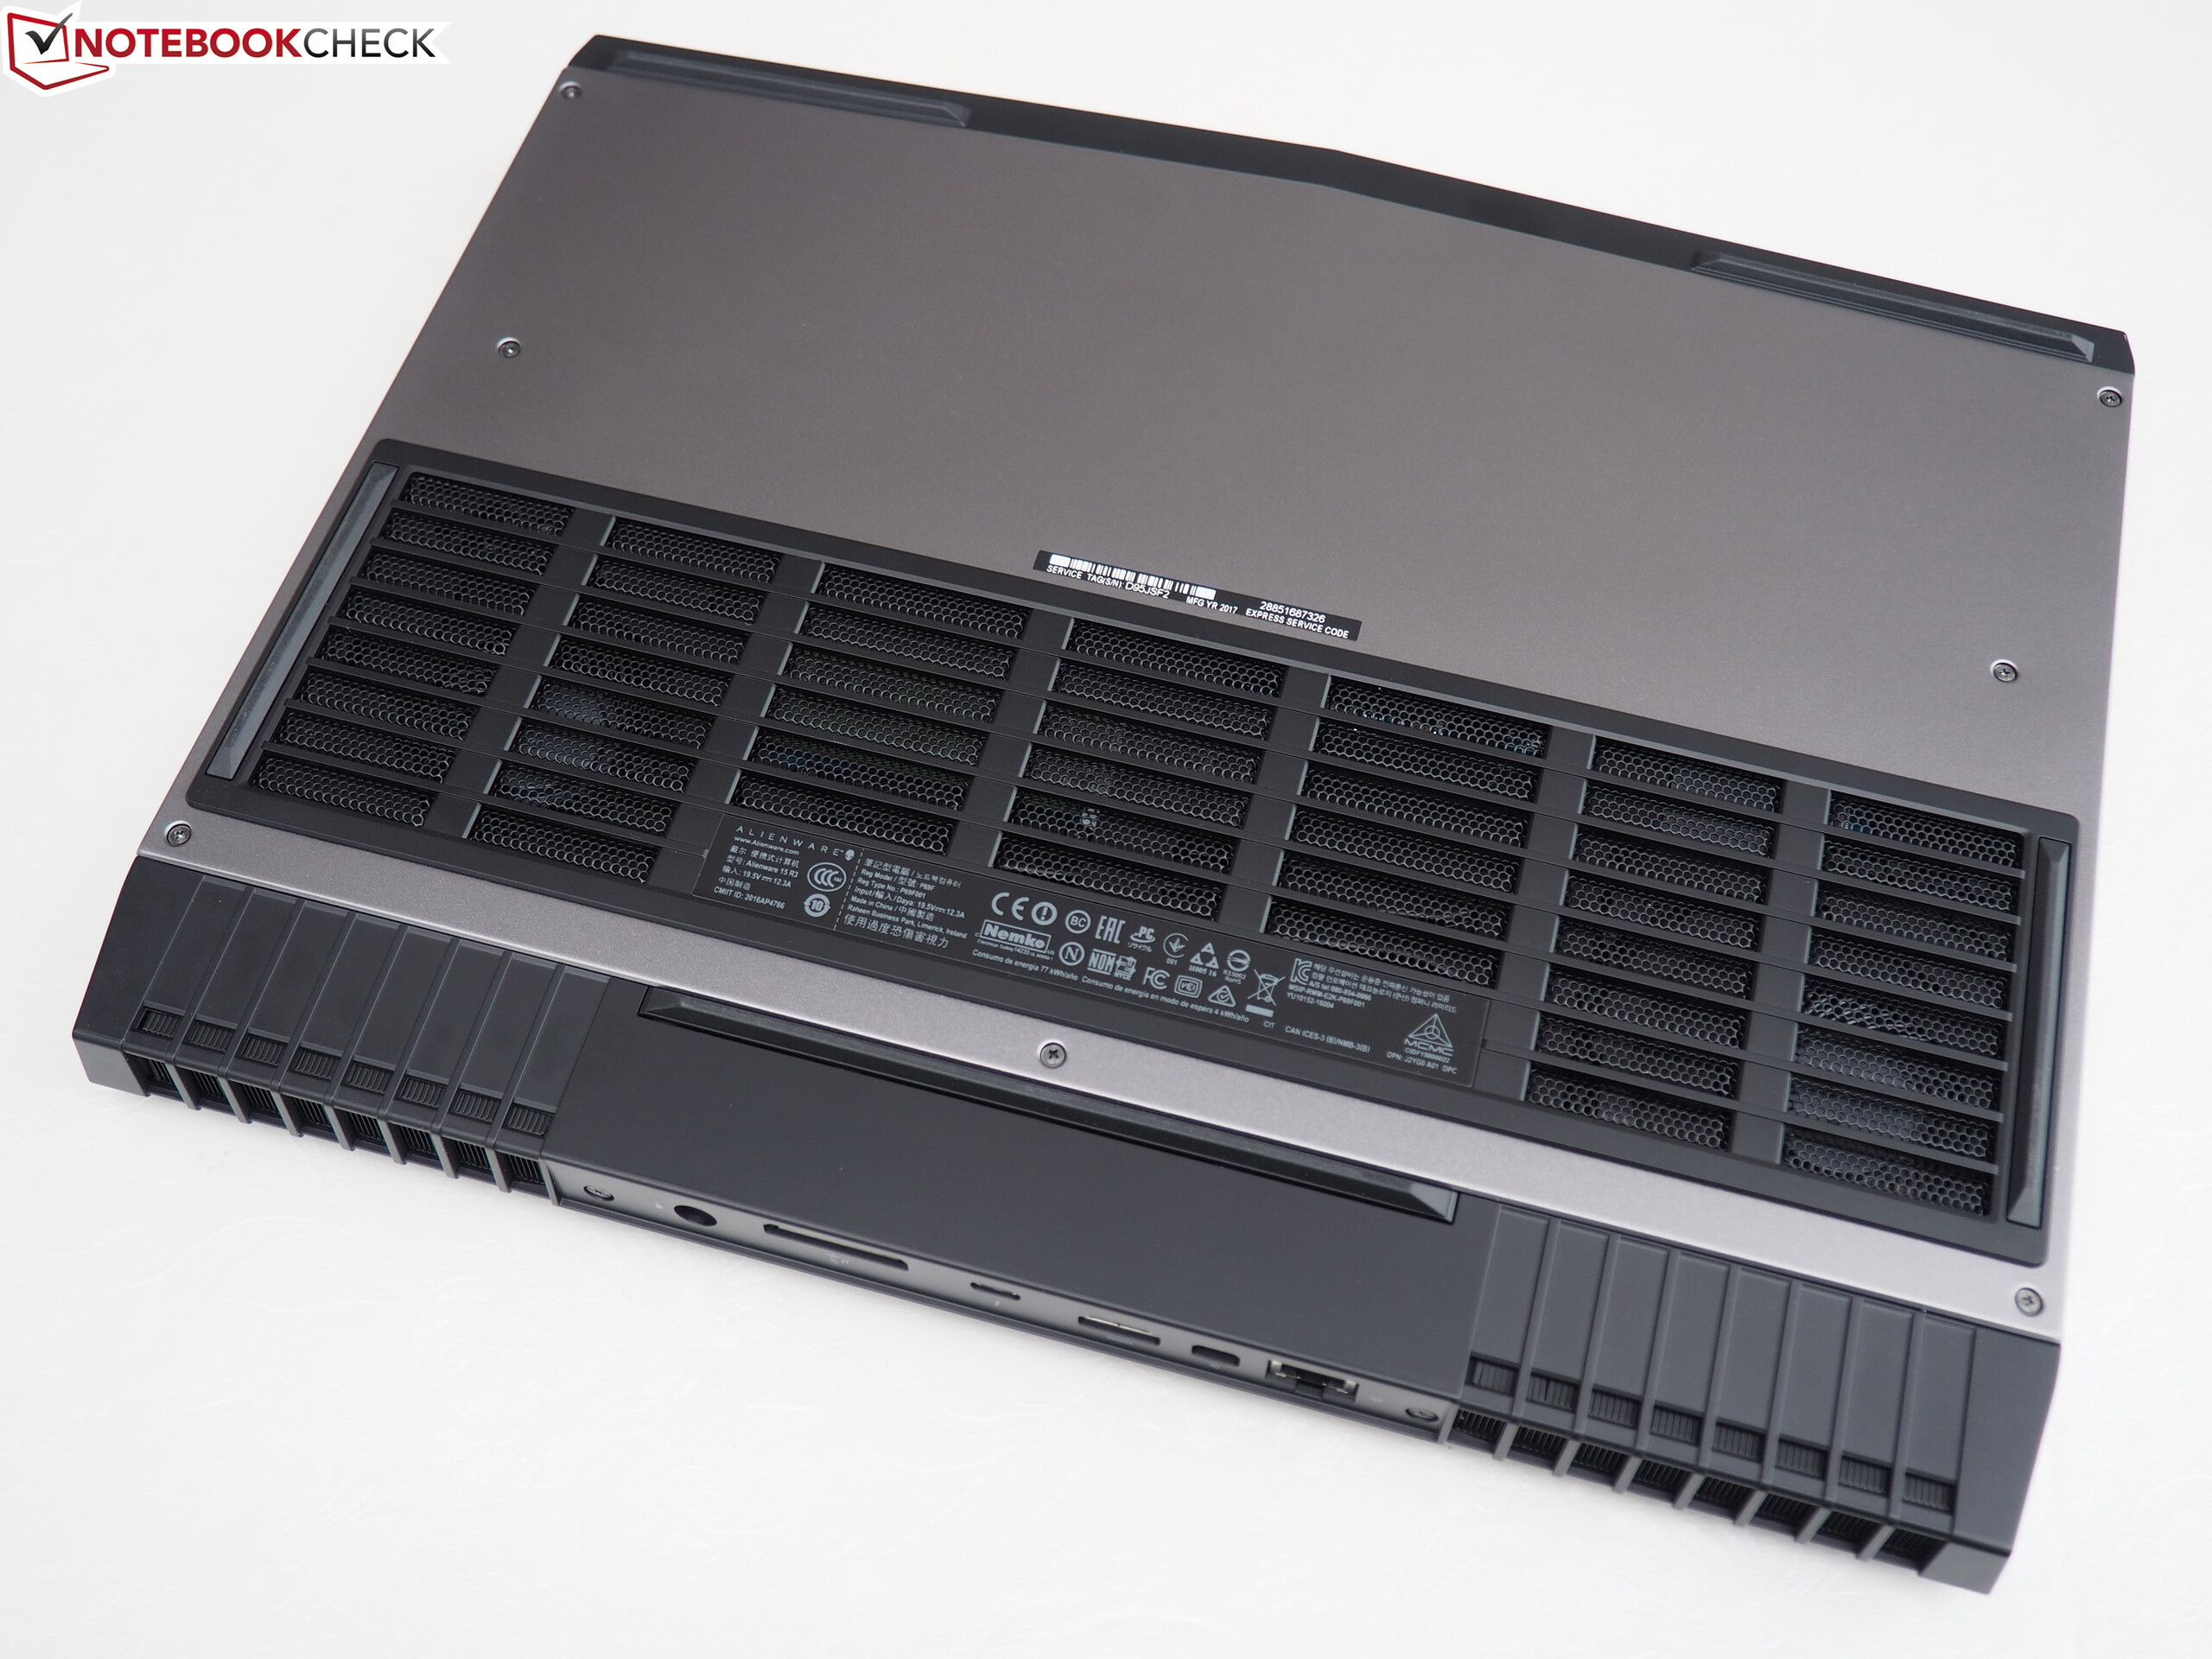
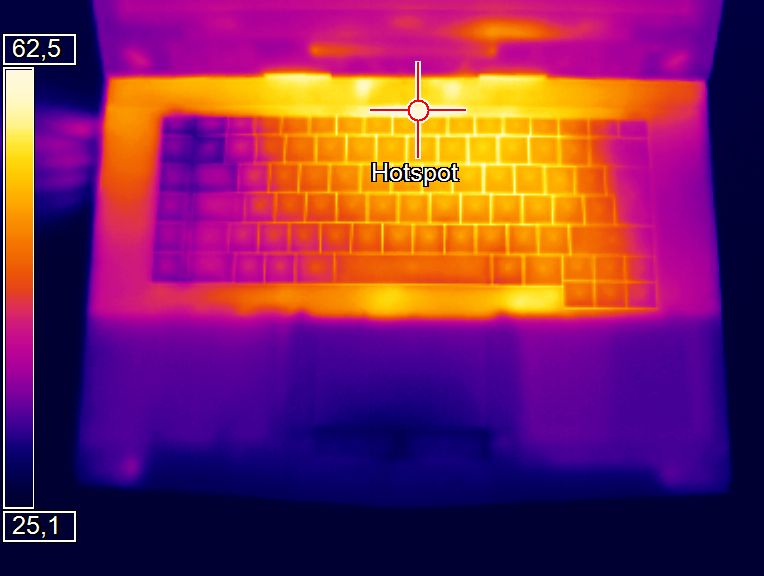
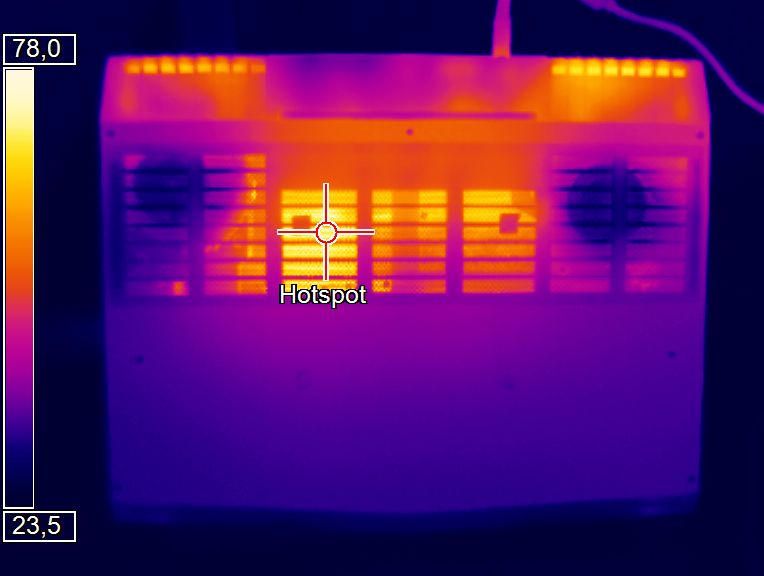
Likewise, the corresponding underside averages just over 36 °C (~97 °F), which is relatively cool. However, the rest of the device is exceedingly hot. The top case averaged 43.2 °C (~110 °F) under maximum load, while the bottom case averaged 54.6 °C (~130 °F). Most of the top case exceeds 50 °C (~122 °F) though, with much of the bottom case nearing 70 °C (~158). Surface temperatures dropped by a few degrees when playing “The Witcher 3”, but these are still too hot to have the 15 R4 on your lap while gaming.
The 15 R4 is relatively hot at idle too, because the fans cycle between being off and running loudly. Our test device averages 35.2 °C (~95 °F) at idle and reaches a maximum of 39 °C (~102 °F) .
Our test device has higher surface temperatures than all our comparison devices and is 21% hotter than the average surface temperatures of the gaming notebooks that we have tested. In short, the 15 R4 is a hot device.
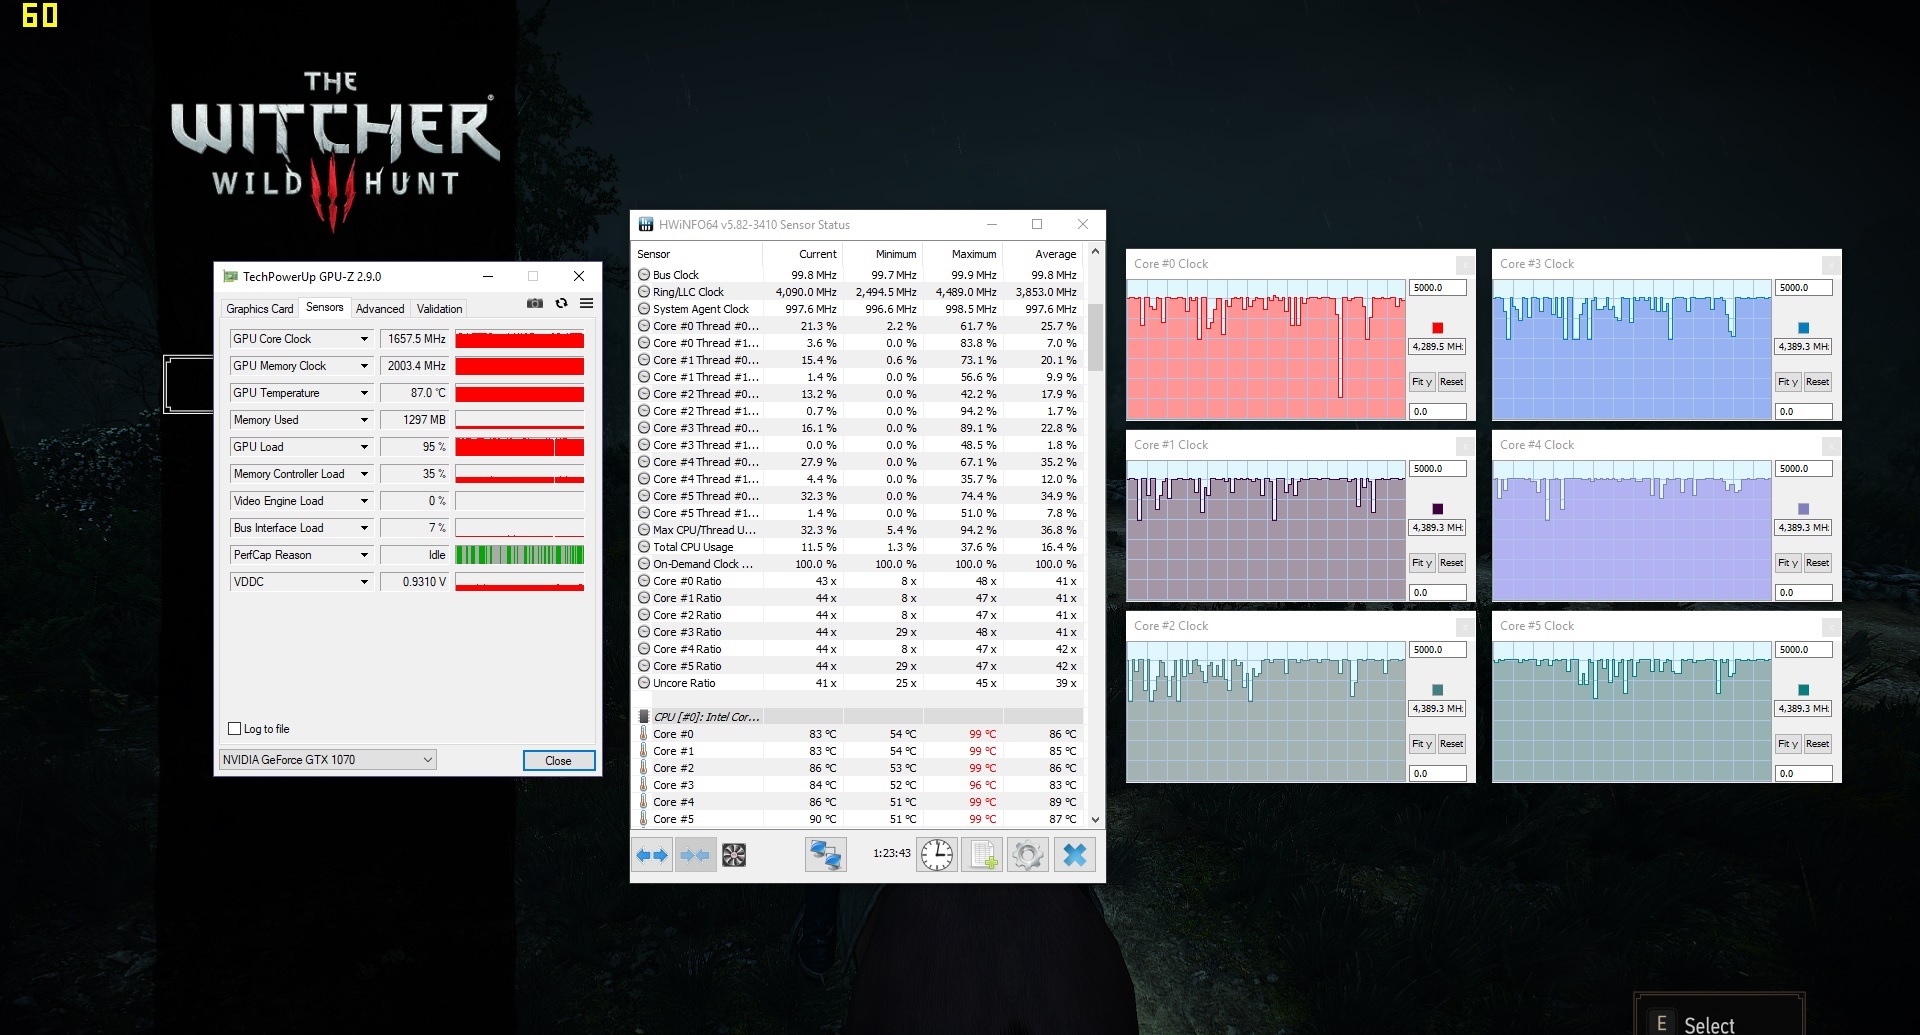
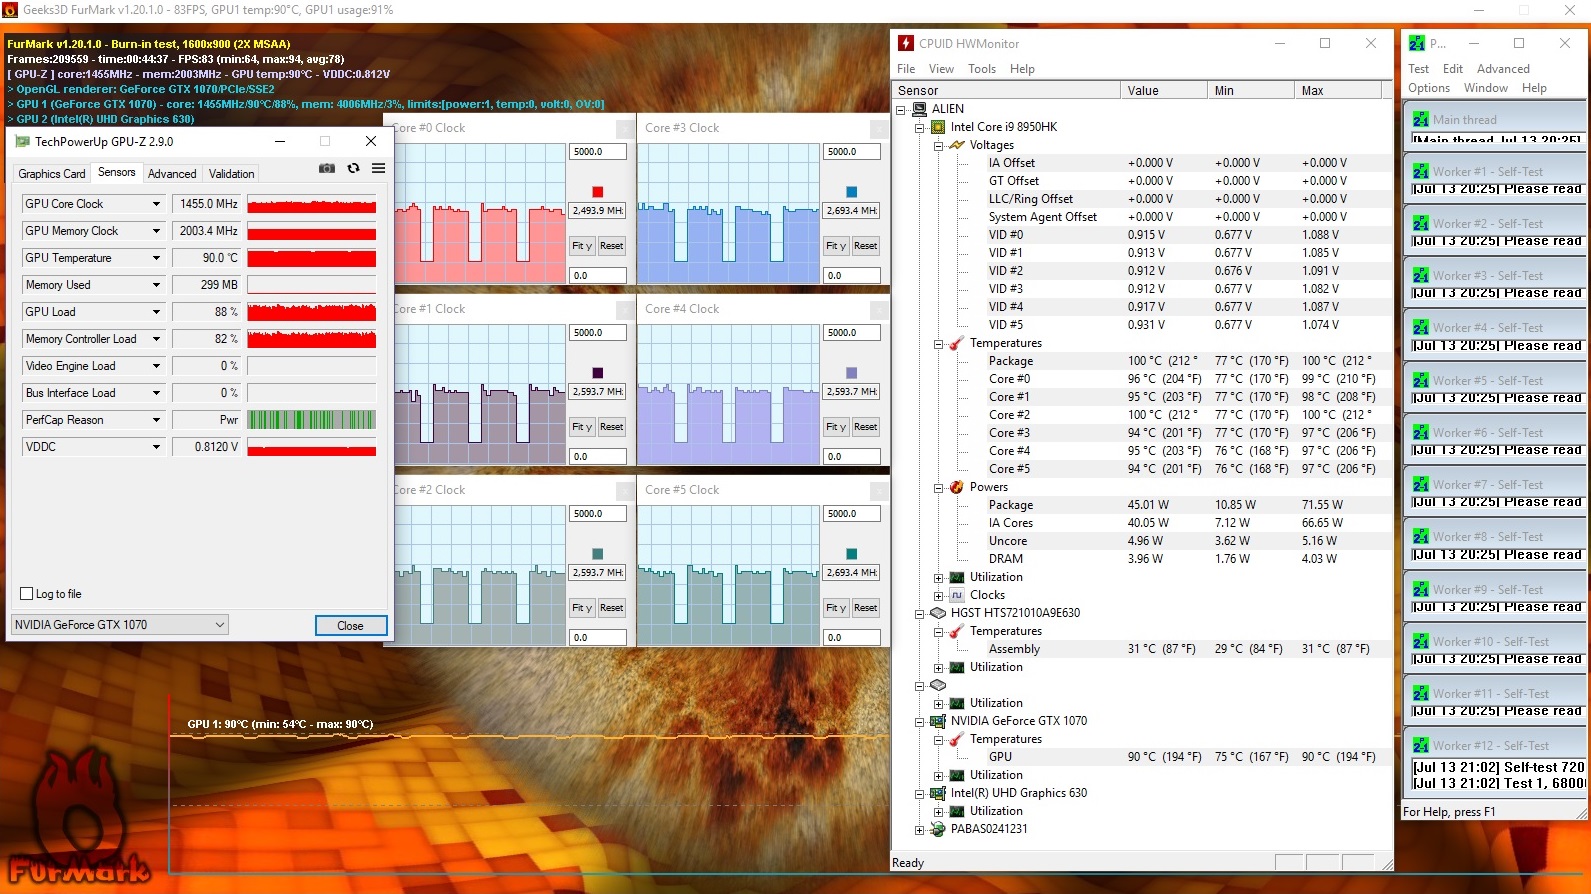
The 15 R4 has high internal temperatures too. The GPU core temperature reached 90 °C (~194 °F) during our sixty-minute stress test, which resulted in some slight thermal throttling. Likewise, the GPU reached 87 °C (~189 °F) in our hour-long “The Witcher 3” benchmark.
The CPU hit 100 °C (~212 °F) in our combined FurMark and Prime95 stress test, which causes the CPU to thermal throttle heavily. This degree of throttling under load is disappointing given that the 15 R4 is designed to play games that will stress the system.
(-) The maximum temperature on the upper side is 53 °C / 127 F, compared to the average of 40.5 °C / 105 F, ranging from 21.2 to 68.8 °C for the class Gaming.
(-) The bottom heats up to a maximum of 68 °C / 154 F, compared to the average of 43.3 °C / 110 F
(±) In idle usage, the average temperature for the upper side is 34.6 °C / 94 F, compared to the device average of 33.9 °C / 93 F.
(-) Playing The Witcher 3, the average temperature for the upper side is 42.6 °C / 109 F, compared to the device average of 33.9 °C / 93 F.
(+) The palmrests and touchpad are reaching skin temperature as a maximum (33 °C / 91.4 F) and are therefore not hot.
(-) The average temperature of the palmrest area of similar devices was 28.9 °C / 84 F (-4.1 °C / -7.4 F).
| Alienware 15 R4 i9-8950HK, GeForce GTX 1070 Mobile | Alienware 15 R3 i7-7700HQ, GeForce GTX 1070 Mobile | Aorus X5 v8 i7-8850H, GeForce GTX 1070 Mobile | Razer Blade 15 2018 i7-8750H, GeForce GTX 1070 Max-Q | Gigabyte Aero 15X v8 i7-8750H, GeForce GTX 1070 Max-Q | Average of class Gaming | |
|---|---|---|---|---|---|---|
| Heat | 11% | 18% | 9% | 15% | 19% | |
| Maximum Upper Side * (°C) | 53 | 46 13% | 50 6% | 56 -6% | 53 -0% | 45.6 ? 14% |
| Maximum Bottom * (°C) | 68 | 51.8 24% | 62 9% | 59 13% | 65 4% | 48.3 ? 29% |
| Idle Upper Side * (°C) | 39 | 36.5 6% | 27 31% | 33 15% | 26 33% | 31.5 ? 19% |
| Idle Bottom * (°C) | 39 | 38.2 2% | 29 26% | 34 13% | 30 23% | 34.5 ? 12% |
* ... smaller is better
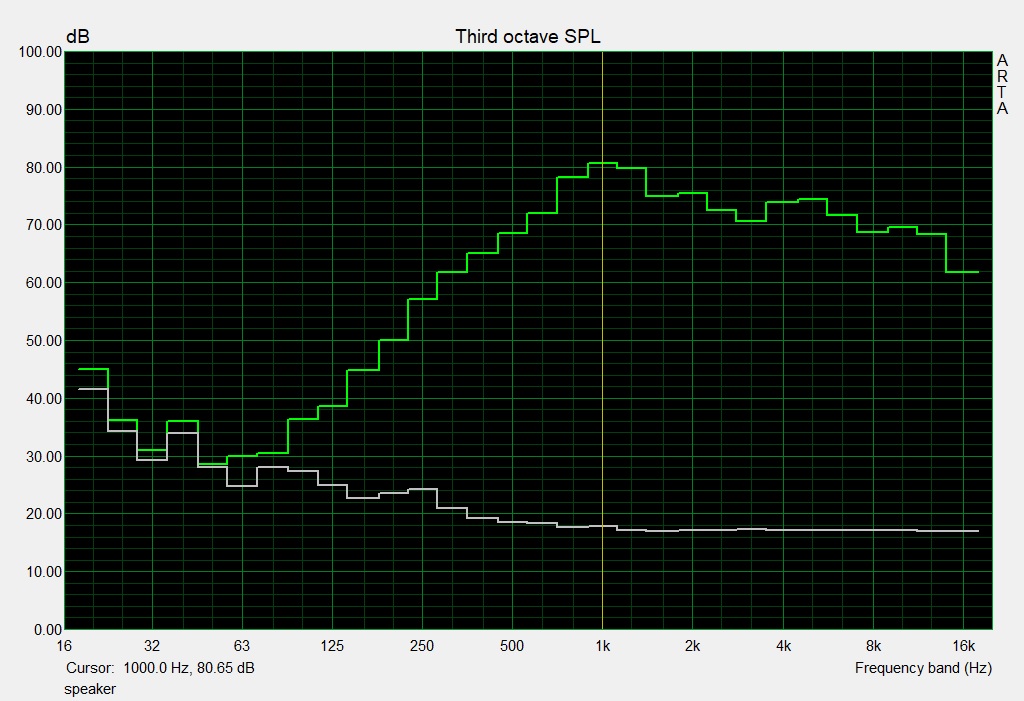
Speakers
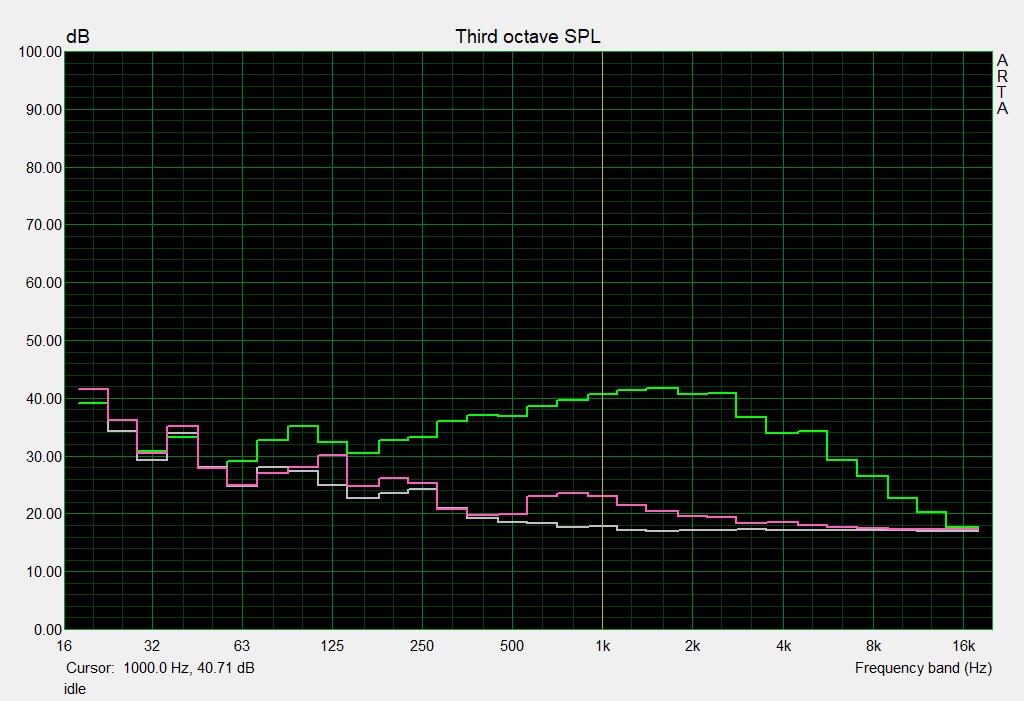
Alienware 15 R4 audio analysis
(+) | speakers can play relatively loud (87 dB)
Bass 100 - 315 Hz
(-) | nearly no bass - on average 21% lower than median
(±) | linearity of bass is average (9.8% delta to prev. frequency)
Mids 400 - 2000 Hz
(±) | higher mids - on average 6.1% higher than median
(+) | mids are linear (5.8% delta to prev. frequency)
Highs 2 - 16 kHz
(+) | balanced highs - only 2.2% away from median
(+) | highs are linear (4.3% delta to prev. frequency)
Overall 100 - 16.000 Hz
(±) | linearity of overall sound is average (16.6% difference to median)
Compared to same class
» 43% of all tested devices in this class were better, 7% similar, 51% worse
» The best had a delta of 6%, average was 18%, worst was 132%
Compared to all devices tested
» 27% of all tested devices were better, 6% similar, 67% worse
» The best had a delta of 4%, average was 24%, worst was 134%
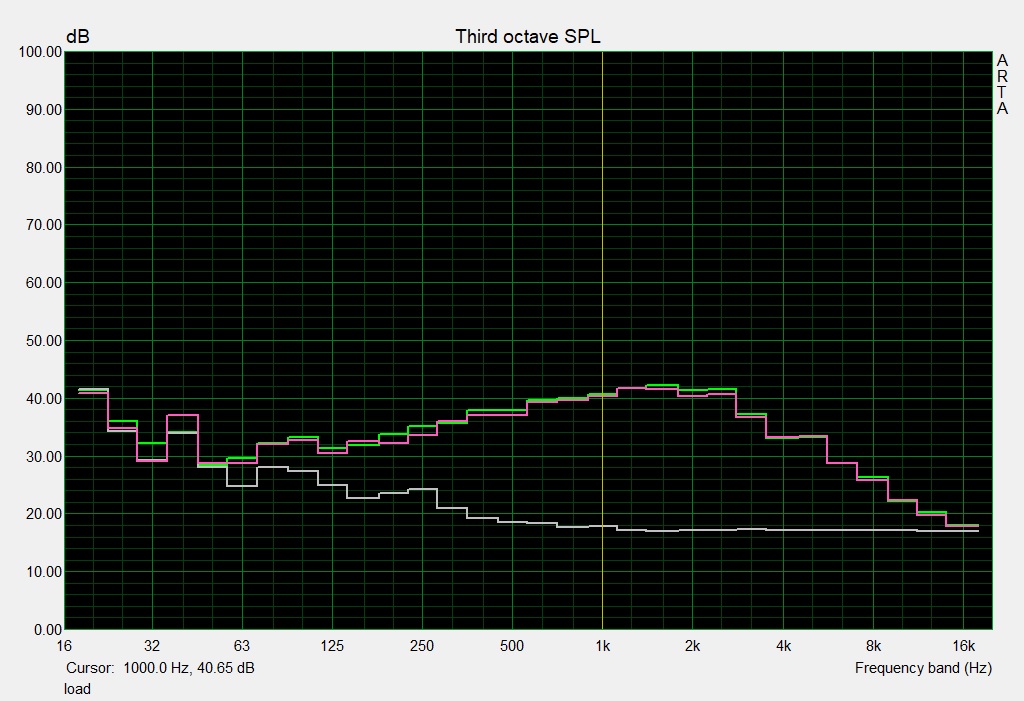
Aorus X5 v8 audio analysis
(±) | speaker loudness is average but good (75 dB)
Bass 100 - 315 Hz
(±) | reduced bass - on average 12.8% lower than median
(±) | linearity of bass is average (10.6% delta to prev. frequency)
Mids 400 - 2000 Hz
(+) | balanced mids - only 2% away from median
(+) | mids are linear (4.7% delta to prev. frequency)
Highs 2 - 16 kHz
(+) | balanced highs - only 1.4% away from median
(+) | highs are linear (4.1% delta to prev. frequency)
Overall 100 - 16.000 Hz
(+) | overall sound is linear (13.8% difference to median)
Compared to same class
» 21% of all tested devices in this class were better, 7% similar, 72% worse
» The best had a delta of 6%, average was 18%, worst was 132%
Compared to all devices tested
» 14% of all tested devices were better, 4% similar, 82% worse
» The best had a delta of 4%, average was 24%, worst was 134%
Power Management
Power Consumption
The 15 R4 consumes slightly more power than most of our comparison devices. Our test device consumes between 23-30 W at idle and between 111-222 W under load, which is typical of other GeForce GTX 1070 equipped laptops.
We would recommend considering the Blade 15 or the Aero 15X v8 if you would prefer a more economical device as these devices consume 27% less than the 15 R4.
| Off / Standby | |
| Idle | |
| Load |
|
Key:
min: | |
| Alienware 15 R4 i9-8950HK, GeForce GTX 1070 Mobile | Alienware 15 R3 i7-7700HQ, GeForce GTX 1070 Mobile | Aorus X5 v8 i7-8850H, GeForce GTX 1070 Mobile | Razer Blade 15 2018 i7-8750H, GeForce GTX 1070 Max-Q | Gigabyte Aero 15X v8 i7-8750H, GeForce GTX 1070 Max-Q | Average of class Gaming | |
|---|---|---|---|---|---|---|
| Power Consumption | 14% | -8% | 27% | 27% | 10% | |
| Idle Minimum * (Watt) | 23 | 19 17% | 25 -9% | 14 39% | 14 39% | 14.3 ? 38% |
| Idle Average * (Watt) | 26 | 23 12% | 31 -19% | 17 35% | 18 31% | 20.4 ? 22% |
| Idle Maximum * (Watt) | 30 | 29 3% | 33 -10% | 21 30% | 22 27% | 27.4 ? 9% |
| Load Average * (Watt) | 111 | 85 23% | 102 8% | 95 14% | 91 18% | 110.4 ? 1% |
| Witcher 3 ultra * (Watt) | 182 | 194 -7% | 141 23% | 142 22% | ||
| Load Maximum * (Watt) | 222 | 192 14% | 239 -8% | 179 19% | 173 22% | 262 ? -18% |
* ... smaller is better
Battery Life
The 15 R4 lacks support for NVIDIA Optimus, which allows devices to switch between integrated graphics and a dedicated GPU. This saves on power and in turn, improves battery life. Dell counteracts this by equipping the 15 R4 with a 99 Wh battery; 99.9 Wh is the battery capacity limit for most manufacturers.
We subjected our test device to three battery runtime tests. Our test device lasted six hours and ten minutes when running at idle with the Wi-Fi off and brightness set to a minimum. We see a similar runtime in our Wi-Fi battery life test, in which our test device lasted five hours and four minutes. During this test, we set the 15 R4 to medium energy savings and the brightness to 150 cd/m². We then run a script that simulates the load required to render websites.
Finally, our test device lasted fifty-eight minutes under full load with the brightness set to maximum. This is the only scenario where the 15 R4 falls well short of the competition.
Overall, the 15 R4 has a respectable battery life that is slightly lower than most of our comparison devices. The Aero 15x v8 is the only device that lasts significantly longer than the 15 R4, but this has a weaker CPU, GPU and supports NVIDIA Optimus.
| Alienware 15 R4 i9-8950HK, GeForce GTX 1070 Mobile, 99 Wh | Alienware 15 R3 i7-7700HQ, GeForce GTX 1070 Mobile, 99 Wh | Aorus X5 v8 i7-8850H, GeForce GTX 1070 Mobile, 92.24 Wh | Razer Blade 15 2018 i7-8750H, GeForce GTX 1070 Max-Q, 80 Wh | Gigabyte Aero 15X v8 i7-8750H, GeForce GTX 1070 Max-Q, 94.24 Wh | Average of class Gaming | |
|---|---|---|---|---|---|---|
| Battery Runtime | 20% | 15% | 10% | 111% | 42% | |
| Reader / Idle (h) | 6.2 | 6.4 3% | 4.9 -21% | 6.4 3% | 12.7 105% | 9.71 ? 57% |
| WiFi v1.3 (h) | 5.1 | 4.4 -14% | 5.4 6% | 8.6 69% | 6.49 ? 27% | |
| Load (h) | 1 | 1.7 70% | 1.5 50% | 1.2 20% | 2.6 160% | 1.431 ? 43% |
| H.264 (h) | 4.4 | 3.6 | 5.4 | 8.4 | 7.77 ? |
Verdict
Pros
Cons
In short, the Alienware 15 R4 is a good device, but it misses out on our gaming laptop top 10 because of some serious shortcomings.
The main issues with the 15 R4 are its CPU performance, fan noise and surface temperatures. The cooling system is inadequate to appropriately cool the Core i9-8950HK. Core temperatures reach up to 100 °C (~212 °F), which means that the CPU thermal throttles heavily and it also cannot reach its full Turbo Boost potential. The inadequate cooling has the compounding effect of causing extremely high surface temperatures and intrusively loud fans.
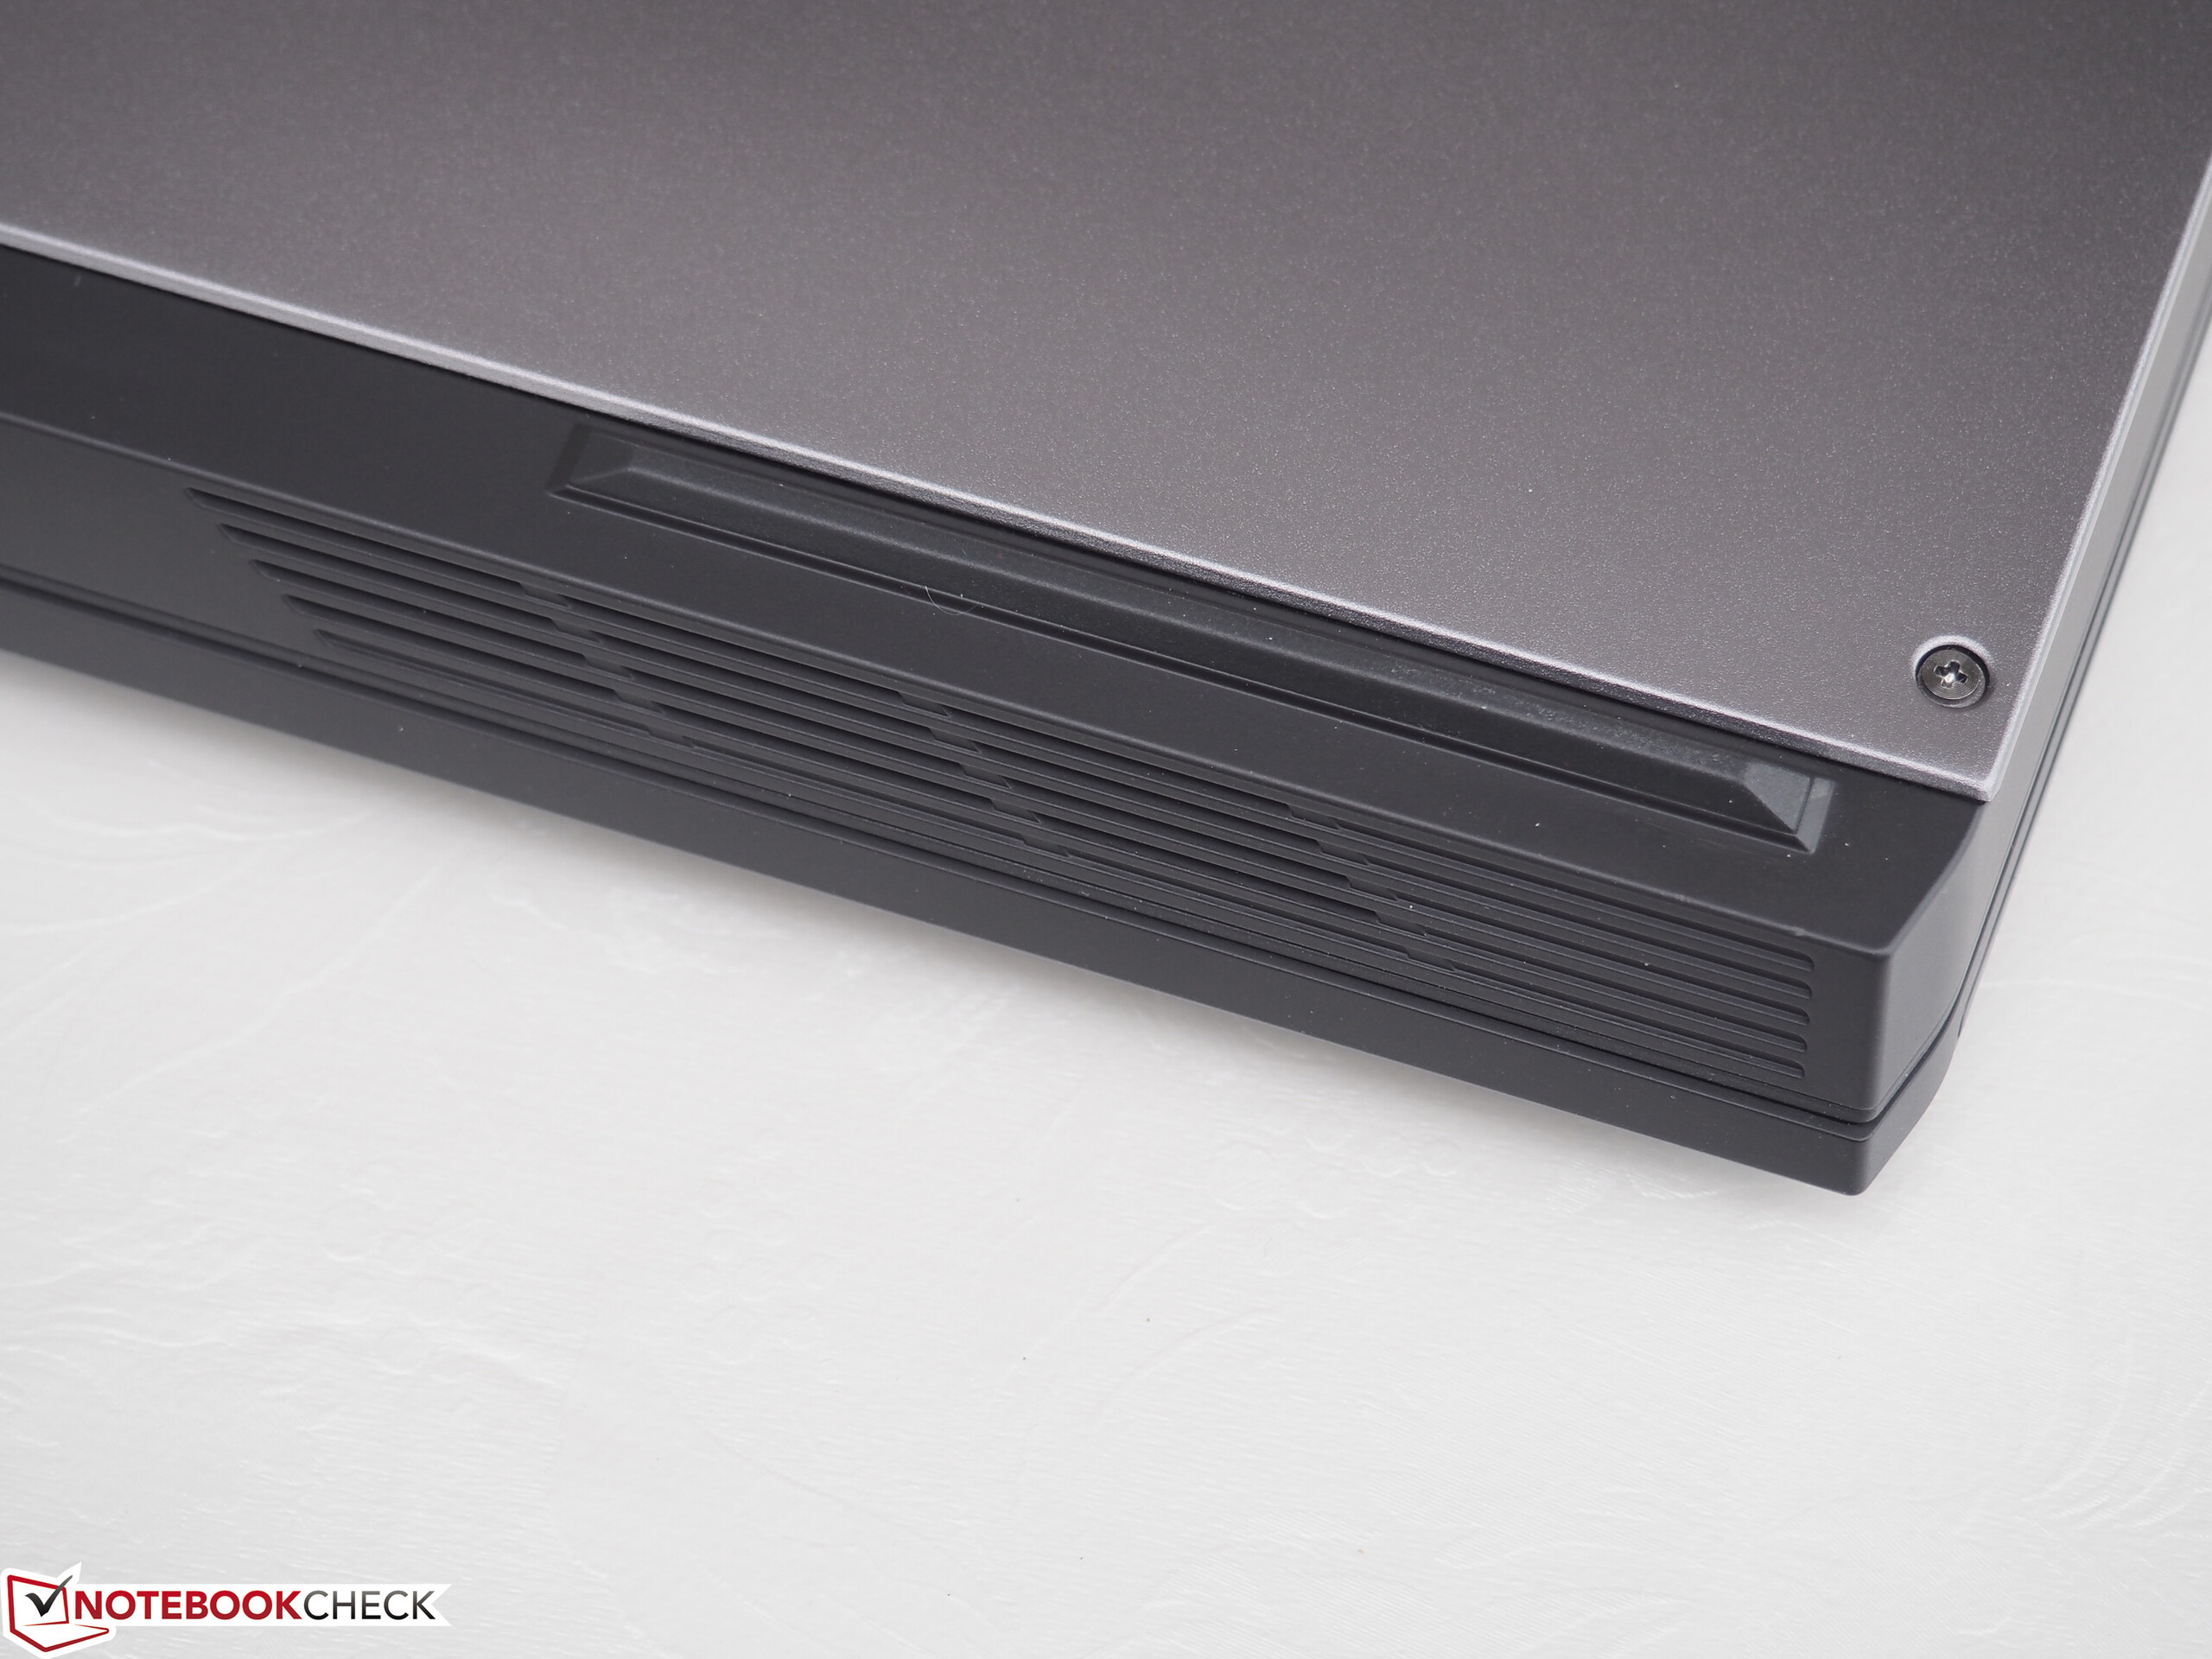
The system would benefit from a slightly deeper case. This would give the 15 R4 improved airflow and allow the device to run cooler.
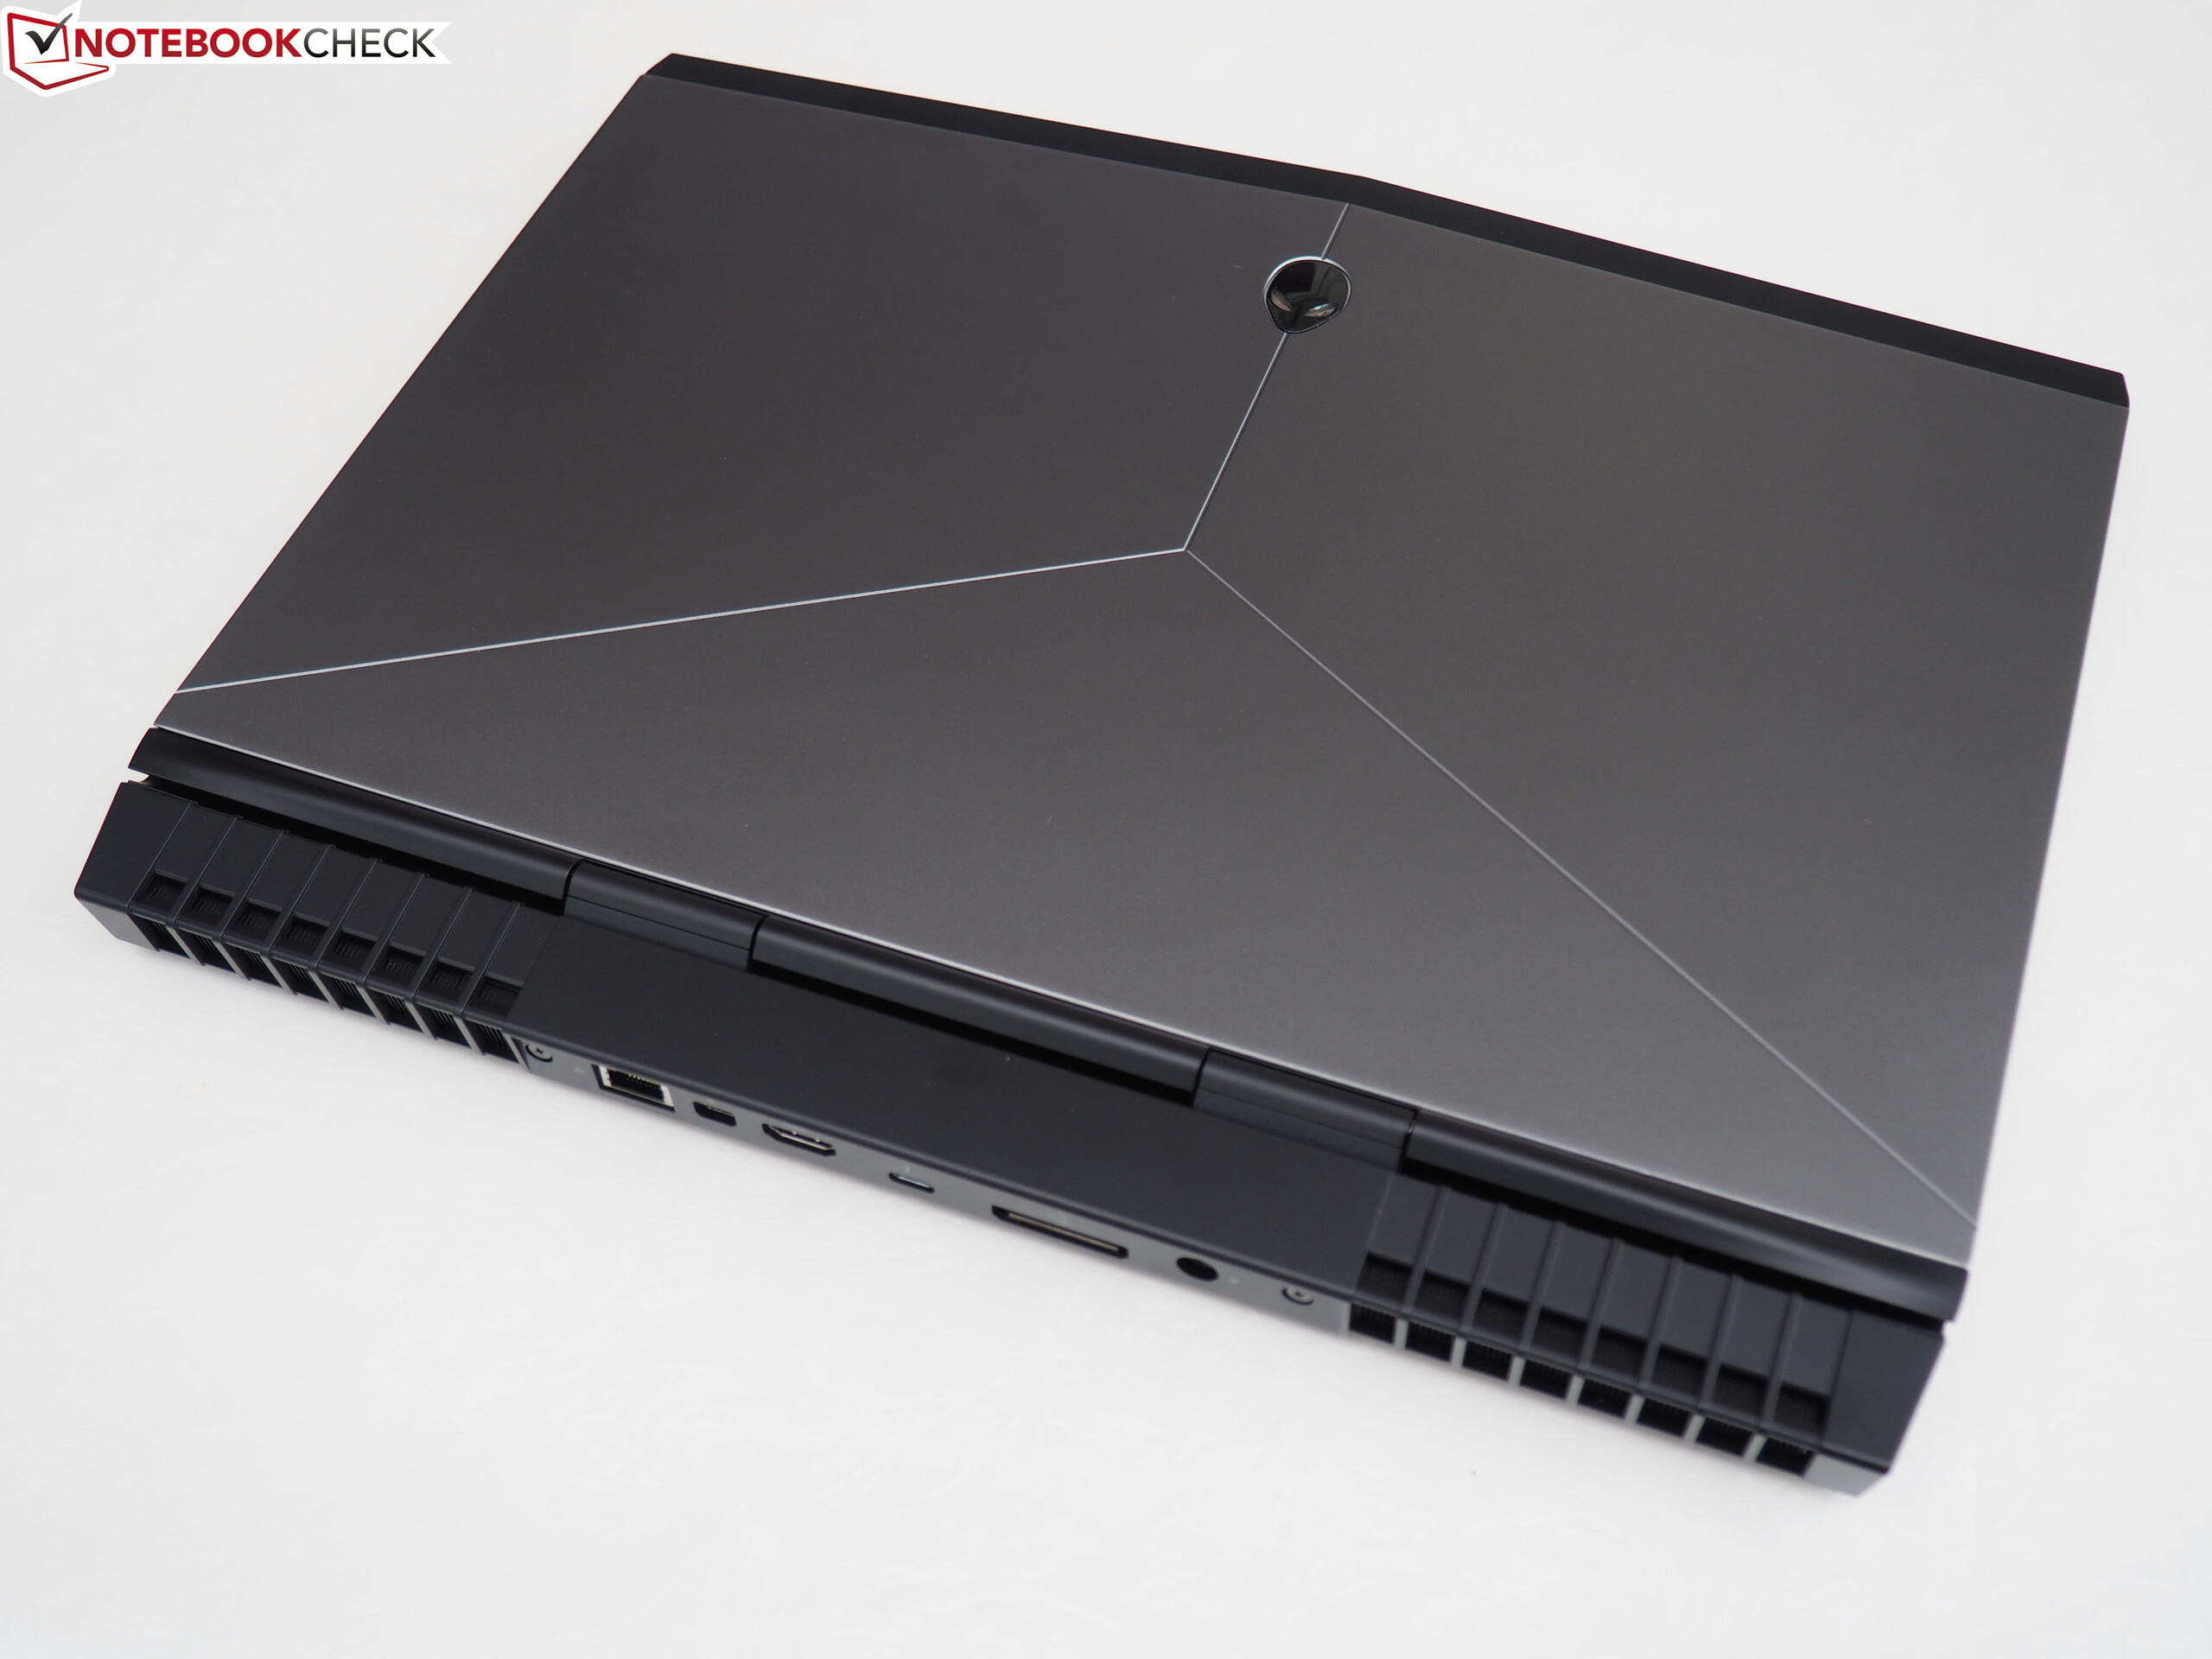
On the other hand, the case is stylish, stable and has full RGB lighting, albeit it is comparatively thick. Likewise, the input devices are impressive, as is the selection of ports, particularly the inclusion of Thunderbolt 3. The 15 R4 has good battery life too, while the default display and speakers are passable.
Alienware 15 R4
- 07/14/2018 v6 (old)
Florian Glaser


Price comparison

