Notebookcheck Logo

Intel Core i9-13905H vs Intel Core i5-13500

Intel Core i9-13905H

► remove from comparison Intel i9-13905H

The Intel Core i9-13905H is a high-end mobile CPU for laptops based on the Raptor Lake-H series (Alder Lake architecture). It was announced in early 2023 and offers 6 performance cores (P-cores, Golden Cove architecture) and 8 efficient cores (E-cores, Gracemont architecture). The P-cores support Hyper-Threading leading to 20 supported threads when combined with the E-cores. The clock rate ranges from 2.6 to 5.4 GHz (single core turbo, all-core 4.9 GHz) on the performance cluster and 1.9 to 4.1 GHz on the efficiency cluster. The performance of the E-cores should be similar to old Skylake cores (compare with the Core i7-6920HQ). All cores can use up to 24 MB L3 cache. Similar to the i9-13900H but without vPro support and the 13905H uses a different package and socket.

Performance

Thanks to the high core count and high clock speed, the Core i9-13905H is (together with the 13900HK) the fastest 45W CPU for laptops and only bested by Raptor Lake-HX based models with more cores and improved P-cores (e.g., the i9-13980HX). Still, the CPU is very well suited for all demanding use cases like gaming, content creation, and scientific calculations.

Features

The integrated memory controller supports various memory types up to DDR5-5200 (up from 4800 MHz for the 12th gen). The Thread Director (in hardware) can support the operating system to decide which thread to use on the performance or efficient cores for the best performance. For AI tasks, the CPU also integrates GNA 3.0 and DL Boost (via AVX2). Quick Sync in version 8 is the same as in the Rocket Lake CPUs and supports MPEG-2, AVC, VC-1 decode, JPEG, VP8 decode, VP9, HEVC, and AV1 decode in hardware. The CPU now supports PCIe 5.0 x8 for a GPU and two PCIe 4.0 x4 for SSDs.

The integrated graphics card is based on the Xe-architecture and offers 96 EUs (Execution Units) .

The CPU is rated at 45 W base power (115 W PL2) but most laptops will use a PL1 of around 60 Watt. The SoC is manufactured in a 10nm process at Intel, which is known as Intel 7 (improved over the 12th Gen).

Intel Core i5-13500

► remove from comparison Intel i5-13500

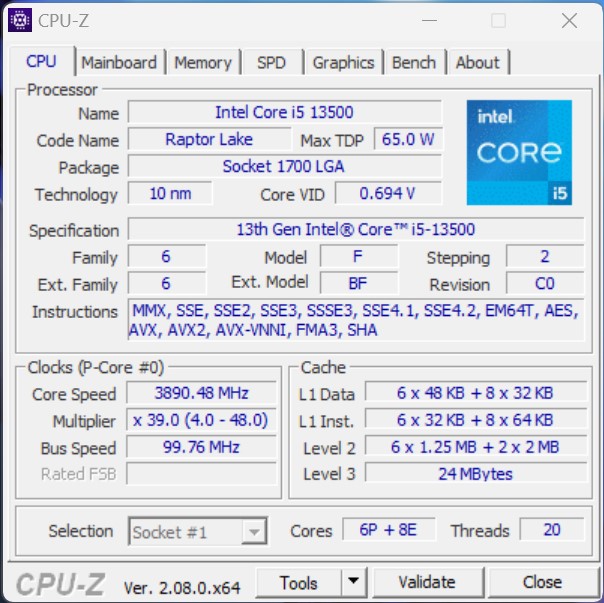
The Intel Core i5-13500 is a fast and relatively power efficient desktop processor based on the Raptor Lake architecture, which was introduced in October 2022. The processor offers a base clock of 2.5 GHz and reaches up to 4.8 GHz in Turbo. The hybrid CPU architecture introduced with Alder Lake is also used in the Raptor Lake processors. Compared to the Intel Core i5-12500, the Intel Core i5-13500 offers more cores, which means a higher overall performance can be achieved. In total, the Intel Core i5-13500 can process up to 20 threads in parallel. The performance cores (P cores) offer hyperthreading for this purpose, which is withheld from the energy-efficient cores (E cores).

Performance

Due to the higher number of physical computing units, the Intel Core i5-13500 offers noticeably more performance compared to the Intel Core i5-12500. Both processors have 6 P-cores, although only the Intel Core i5-13500 is additionally equipped with 8 E-cores.

Graphics unit

Like the Intel Core i5-12600K, the Intel Core i5-13500 offers an integrated graphics unit. The Intel Iris Xe architecture continues to serve as the basis. In terms of performance, however, not much has changed with the new Intel UHD Graphics 770.

Power consumption

The TDP of the Intel Core i5-13500 is 65 watts, with the option to increase this to up to 154 watts in Turbo mode. Compared to the Intel Core i5-12500, the energy requirement increases slightly.

ModelIntel Core i9-13905HIntel Core i5-13500
CodenameRaptor Lake-HRaptor Lake
SeriesIntel Raptor Lake-HIntel Raptor Lake-S
Series: Raptor Lake-S Raptor Lake
Intel Core i9-13900HK compare1.9 - 5.4 GHz14 / 20 cores24 MB L3
Intel Core i9-13905H « 1.9 - 5.4 GHz14 / 20 cores24 MB L3
Intel Core i9-13900H compare1.9 - 5.4 GHz14 / 20 cores24 MB L3
Intel Core i7-13800H compare1.8 - 5.2 GHz14 / 20 cores24 MB L3
Intel Core i7-13705H compare1.8 - 5 GHz14 / 20 cores24 MB L3
Intel Core i7-13700H compare1.8 - 5 GHz14 / 20 cores24 MB L3
Intel Core i7-13620H compare1.8 - 4.9 GHz10 / 16 cores24 MB L3
Intel Core i5-13600H compare2.1 - 4.8 GHz12 / 16 cores18 MB L3
Intel Core i5-13505H compare1.9 - 4.7 GHz12 / 16 cores18 MB L3
Intel Core i5-13500H compare1.9 - 4.7 GHz12 / 16 cores18 MB L3
Intel Core i5-13420H compare1.5 - 4.6 GHz8 / 12 cores12 MB L3
Intel Core i9-13900K compare3 - 5.8 GHz24 / 32 cores36 MB L3
Intel Core i7-13700K compare3.4 - 5.4 GHz16 / 24 cores30 MB L3
Intel Core i5-13600K compare3.5 - 5.1 GHz14 / 20 cores24 MB L3
Intel Core i7-14701TE compare2.1 - 5.2 GHz8 / 16 cores33 MB L3
Intel Core i5-13500 « 2.5 - 4.8 GHz14 / 20 cores24 MB L3
Intel Core i5-14501TE compare2.2 - 5.1 GHz6 / 12 cores12 MB L3
Intel Core i5-14501E compare3.3 - 5.2 GHz6 / 12 cores24 MB L3
Intel Core i5-14401E compare2.5 - 4.7 GHz6 / 12 cores12 MB L3
Intel Core i5-14401TE compare2 - 4.5 GHz6 / 12 cores12 MB L3
Intel Core i5-13500T compare1.6 - 4.6 GHz14 / 20 cores24 MB L3
Clock1900 - 5400 MHz2500 - 4800 MHz
L1 Cache1.2 MB
L2 Cache11.5 MB11.5 MB
L3 Cache24 MB24 MB
Cores / Threads14 / 20
6 x 5.4 GHz Intel Golden Cove P-Core
8 x 4.1 GHz Intel Gracemont E-Core
14 / 20
6 x 4.8 GHz Intel Raptor Cove P-Core
8 x 3.5 GHz Intel Gracemont E-Core
TDP45 Watt65 Watt
Technology10 nm10 nm
max. Temp.100 °C100 °C
SocketFCBGA1792LGA 1700
FeaturesThread DirectorIntel UHD Graphics 770, DDR5 4800 MT/s, DDR4 3200 MT/s
iGPUIntel Iris Xe Graphics G7 96EUs ( - 1500 MHz)Intel UHD Graphics 770 (300 - 1550 MHz)
Architecturex86x86
Announced
Manufacturerark.intel.comwww.intel.de
TDP Turbo PL2154 Watt
Die Size215 mm2

Benchmarks

Performance Rating - CB R15 + R20 + 7-Zip + X265 + Blender + 3DM11 CPU - i9-13905H
37.7 pt (63%)
Restrict / Search: Model: Max. age: years
Performance Rating - CB R15 + R20 + 7-Zip + X265 + Blender + 3DM11 CPU - i5-13500
38.3 pt (64%)
Restrict / Search: Model: Max. age: years
Cinebench 2024 - Cinebench 2024 CPU Single Core
107 Points (60%)
Cinebench 2024 - Cinebench 2024 CPU Multi Core
822 Points (15%)
Cinebench R23 - Cinebench R23 Multi Core
min: 17880     avg: 19384     median: 20034 (19%)     max: 20237 Points
14573 Points (14%)
Cinebench R23 - Cinebench R23 Single Core
min: 1652     avg: 1901     median: 2020 (85%)     max: 2030 Points
1780 Points (75%)
Cinebench R20 - Cinebench R20 CPU (Single Core)
min: 622     avg: 679     median: 639 (70%)     max: 775 Points
685 Points (75%)
Cinebench R20 - Cinebench R20 CPU (Multi Core)
min: 6462     avg: 7028     median: 7152 (17%)     max: 7469 Points
5633 Points (14%)
Cinebench R15 - Cinebench R15 CPU Multi 64 Bit
min: 2676     avg: 2821     median: 2857 (18%)     max: 2931 Points
2405 Points (15%)
Cinebench R15 - Cinebench R15 CPU Single 64 Bit
min: 235     avg: 255.3     median: 246 (68%)     max: 285 Points
256 Points (71%)
Cinebench R11.5 - Cinebench R11.5 CPU Multi 64 Bit
28.4 Points (37%)
Cinebench R11.5 - Cinebench R11.5 CPU Single 64 Bit
3.1 Points (74%)
Cinebench R10 - Cinebench R10 Rend. Single (32bit)
8875 Points (54%)
Cinebench R10 - Cinebench R10 Rend. Multi (32bit)
49300 Points (36%)
Cinebench R10 - Cinebench R10 Rend. Multi (64bit)
79625 Points (51%)
Cinebench R10 - Cinebench R10 Rend. Single (64bit)
14282 Points (17%)
wPrime 2.10 - wPrime 2.0 1024m *
100.7 s (1%)
wPrime 2.10 - wPrime 2.0 32m *
4 s (1%)
WinRAR - WinRAR 4.0
7704 Points (12%)
7-Zip 18.03 - 7-Zip 18.03 Multi Thread 4 runs
min: 68880     avg: 71701     median: 69892 (40%)     max: 76332 MIPS
55528 MIPS (32%)
7-Zip 18.03 - 7-Zip 18.03 Single Thread 4 runs
min: 4871     avg: 5487     median: 5520 (65%)     max: 6069 MIPS
5887 MIPS (69%)
X264 HD Benchmark 4.0 - x264 Pass 2
134.6 fps (45%)
X264 HD Benchmark 4.0 - x264 Pass 1
306 fps (71%)
HWBOT x265 Benchmark v2.2 - HWBOT x265 4k Preset
min: 20.5     avg: 21.5     median: 21.2 (37%)     max: 22.9 fps
16.3 fps (29%)
TrueCrypt - TrueCrypt Serpent
1.3 GB/s (38%)
TrueCrypt - TrueCrypt Twofish
2.3 GB/s (40%)
TrueCrypt - TrueCrypt AES
12 GB/s (31%)
Blender - Blender 3.3 Classroom CPU *
min: 280     avg: 296     median: 302 (4%)     max: 306 Seconds
399 Seconds (5%)
Blender - Blender 2.79 BMW27 CPU *
min: 163     avg: 171.3     median: 173 (1%)     max: 178 Seconds
223 Seconds (2%)
R Benchmark 2.5 - R Benchmark 2.5 *
min: 0.4178     avg: 0.5     median: 0.5 (10%)     max: 0.4974 sec
0.4 sec (10%)
3DMark 06 - CPU - 3DMark 06 - CPU
14875 Points (32%)
Super Pi mod 1.5 XS 1M - Super Pi mod 1.5 XS 1M *
7.8 s (2%)
Super Pi mod 1.5 XS 2M - Super Pi mod 1.5 XS 2M *
17.2 s (1%)
3DMark Vantage - 3DM Vant. Perf. CPU no Physx
69725 Points (54%)
3DMark 11 - 3DM11 Performance Physics
min: 22494     avg: 23911     median: 23894 (59%)     max: 25346 Points
18026 Points (44%)
3DMark - 3DMark Ice Storm Physics
84456 Points (69%)
3DMark - 3DMark Ice Storm Extreme Physics
83392 Points (68%)
3DMark - 3DMark Ice Storm Unlimited Physics
81778 Points (68%)
3DMark - 3DMark Cloud Gate Physics
21588 Points (55%)
17891 Points (45%)
3DMark - 3DMark Fire Strike Standard Physics
min: 27625     avg: 29475     median: 29193 (52%)     max: 31606 Points
26263 Points (47%)
3DMark - 3DMark Time Spy CPU
min: 12800     avg: 13567     median: 13653 (58%)     max: 14249 Points
9655 Points (41%)
Geekbench 6.4 - Geekbench 6.4 Single-Core
2404 Points (60%)
2483 Points (62%)
Geekbench 6.4 - Geekbench 6.4 Multi-Core
14212 Points (55%)
10348 Points (40%)
Geekbench 6.0 - Geekbench 6.0 Single-Core
2152 Points (68%)
3105 Points (99%)
Geekbench 6.0 - Geekbench 6.0 Multi-Core
12937 Points (53%)
21003 Points (86%)
Geekbench 5.5 - Geekbench 5.1 - 5.5 64 Bit Single-Core
min: 1672     avg: 1774     median: 1685 (66%)     max: 1966 Points
1805 Points (71%)
Geekbench 5.5 - Geekbench 5.1 - 5.5 64 Bit Multi-Core
min: 13661     avg: 14122     median: 13707 (25%)     max: 14999 Points
10322 Points (18%)
Geekbench 5.0 - Geekbench 5.0 64 Bit Single-Core
1898 Points (8%)
1749 Points (8%)
Geekbench 5.0 - Geekbench 5.0 64 Bit Multi-Core
14690 Points (46%)
10213 Points (32%)
Geekbench 4.4 - Geekbench 4.1 - 4.4 64 Bit Single-Core
7379 Points (74%)
Geekbench 4.4 - Geekbench 4.1 - 4.4 64 Bit Multi-Core
39094 Points (39%)
Mozilla Kraken 1.1 - Kraken 1.1 Total Score *
min: 465     avg: 522     median: 545 (1%)     max: 557 ms
519 ms (1%)
WebXPRT 4 - WebXPRT 4 Score
min: 243     avg: 265.5     median: 265.5 (73%)     max: 288 Points
254 Points (70%)
WebXPRT 3 - WebXPRT 3 Score
min: 267     avg: 301.5     median: 301.5 (54%)     max: 336 Points
266 Points (48%)
CrossMark - CrossMark Overall
min: 1774     avg: 1884     median: 1883.5 (70%)     max: 1993 Points
1549 Points (58%)
Power Consumption - Prime95 Power Consumption - external Monitor *
min: 139.4     avg: 140     median: 140 (24%)     max: 140.6 Watt
98.7 Watt (17%)
Power Consumption - Cinebench R15 Multi Power Consumption - external Monitor *
168.6 Watt (31%)
121 Watt (22%)
Power Consumption - Idle Power Consumption - external Monitor *
min: 16     avg: 16.6     median: 16.6 (11%)     max: 17.2 Watt
7.9 Watt (5%)
Power Consumption - Idle Power Consumption 150cd 1min *
min: 11.7     avg: 15.8     median: 15.8 (17%)     max: 19.9 Watt
Power Consumption - Power Efficiency - Cinebench R15 Multi external Monitor
16.9 Points per Watt (13%)
19.9 Points per Watt (15%)

Average Benchmarks Intel Core i9-13905H → 100% n=28

Average Benchmarks Intel Core i5-13500 → 92% n=28

- Range of benchmark values for this graphics card
red legend - Average benchmark values for this graphics card
* Smaller numbers mean a higher performance
1 This benchmark is not used for the average calculation

Add one or more devices and compare

In the following list you can select (and also search for) devices that should be added to the comparison. You can select more than one device.

restrict list:
v1.33
log 01. 22:00:33

#0 ran 0s before starting gpusingle class +0s ... 0s

#1 checking url part for id 14983 +0s ... 0s

#2 checking url part for id 17901 +0s ... 0s

#3 redirected to Ajax server, took 1754078433s time from redirect:0 +0s ... 0s

#4 did not recreate cache, as it is less than 5 days old! Created at Fri, 01 Aug 2025 05:18:38 +0200 +0s ... 0s

#5 composed specs +0.005s ... 0.006s

#6 did output specs +0s ... 0.006s

#7 getting avg benchmarks for device 14983 +0.003s ... 0.009s

#8 got single benchmarks 14983 +0.006s ... 0.015s

#9 getting avg benchmarks for device 17901 +0.004s ... 0.019s

#10 got single benchmarks 17901 +0.004s ... 0.023s

#11 got avg benchmarks for devices +0s ... 0.023s

#12 min, max, avg, median took s +0.035s ... 0.058s

#13 return log +0.002s ... 0.061s

Please share our article, every link counts!
Mail Logo
> Expert Reviews and News on Laptops, Smartphones and Tech Innovations > Benchmarks / Tech > Processor Comparison - Head 2 Head
Redaktion, 2017-09- 8 (Update: 2023-07- 1)