Notebookcheck Logo

Intel Core i5-11500B vs Apple M2 vs Apple M2 Pro

Intel Core i5-11500B

► remove from comparison Intel i5-11500B

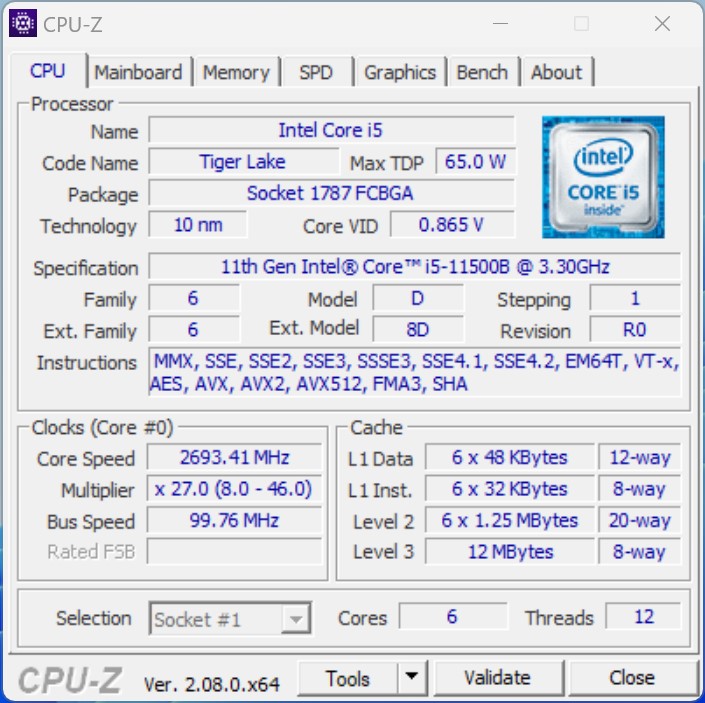
The Intel Core i5-11500B is a hexa-core processor for desktops and mini PCs. It is based on the Tiger Lake architecture (H45) and was presented in Q2 2021. The chip offers a TDP of 65 watts (configurable). The six processor cores can clock from 3.3 to 4.6 GHz (single-core turbo). The processor offers 12 MB level 3 cache and supports DDR4 RAM with up to 3,200 MT/s. The integrated graphics are based on the Xe architecture and are named UHD Graphics (32 EUs). In the 11500B it clocks from 350 to 1,450 MHz. The chip is manufactured using the 10 nm SuperFin process.

Performance

The performance of the Intel Core i5-11500B depends primarily on the performance of the installed cooling unit. The TDP of the SoC can also be lowered. In principle, however, the Intel Core i5-11500B should offer slightly more performance than an Intel Core i5-11400H (6 cores 2.7 - 4.5 GHz).

Features

As with the smaller Tiger Lake chips, Wi-Fi (Wi-Fi 6E) and Thunderbolt 4 / USB 4 are (partially) integrated into the chip for faster, cheaper and space-saving implementations in desktops and mini-PCs. The i5-11500B also offers 20 PCIe 4.0 lanes.

Apple M2

► remove from comparison Apple M2

The Apple M2 is a System on a Chip (SoC) from Apple that is found in the late 2022 MacBook Air and, MacBook Pro 13. It offers 8 cores divided in four performance cores and four power-efficiency cores. The big cores offer 192 KB instruction cache, 128 KB data cache, and 16 MB shared L2 cache (up from 12 MB). The four efficiency cores are a lot smaller and offer only 128 KB instruction cache, 64 KB data cache, and 4 MB shared cache. The efficiency cores (E cluster) clock with  up to 2,4 GHz, the performance cores (P cluster) with up to 3,5 GHz and therefore higher than the M1 cores. The architecture should be similar to the A15 (iPhone 13) with Avalanche and Blizzard cores.

The chip features a unified memory architecture for the CPU and GPU cores and supports up to 24 GB LPDDR5-6400 for a bandwidth of up to 100GB/s.

According to Apple, the M2 offers a 18% higher CPU performance at the same power consumption level compared to the Apple M1. In our tests, the MacBook Pro 13 with active cooling was able to reach the 18% in Geekbench Multi. In other benchmarks we measured 12 to 15% gains compared to the M1. Therefore, the performance is now near the M1 Pro with 8 cores. The passively cooled MacBook Air may however suffer from throttling in longer load scenarios.

The integrated graphics card in the M2 offers 8 or 10 cores and a peak performance of 3.6 TFLOPs.

Furthermore, the SoC integrates a fast 16 core neural engine with a peak performance of 16 TOPS (for AI hardware acceleration), a secure enclave (e.g., for encryption), Thunderbolt / USB 4 controller, an ISP, and media de- and encoders.

The Apple M2 includes 20 billion transistors (up from the 16 billion of the M1) and is manufactured in the second generation 5nm process at TSMC (most likely N5P). The power consumption is rated at 20W what we also measured under CPU load.

Apple M2 Pro

► remove from comparison Apple M2 Pro

The Apple M2 Pro is a System on a Chip (SoC) from Apple that is found in the early 2023 MacBook Pro 14 and 16-inch models. It offers all 12 cores available in the chip divided in eight performance cores (P-cores) and four power-efficiency cores (E-cores). The E-cores clock with up to 3.4 GHz, the P-Cores up to 3.7 GHz (mostly 3.3 GHz in multi-threaded workloads and 3.4 GHz in single threaded).

The big cores (codename Avalanche) offer 192 KB instruction cache, 128 KB data cache, and 36 MB shared L2 cache (up from 24 MB in the M1 Pro). The four efficiency cores (codename Blizzard) are a lot smaller and offer only 128 KB instruction cache, 64 KB data cache, and 4 MB shared cache. CPU and GPU can both use the 24 MB SLC (System Level Cache). 

The unified memory (16 or 32 GB LPDDR5-6400) next to the chip is connected by a 256 Bit memory controller (200 GB/s bandwidth) and can be used by the GPU and CPU.

Apple states that the M2 Pro has a 25% higher performance than the M1 Pro in Xcode compiling.

The integrated graphics card in the M1 Pro offers all 19 cores.

Furthermore, the SoC integrates a fast 16 core neural engine (faster than M1 Pro), a secure enclave (e.g., for encryption), a unified memory architecture, Thunderbolt 4 controller, an ISP, and media de- and encoders (including ProRes).

The M2 Pro is manufactured in 5 nm at TSMC (second generation) and integrates 40 billion transistors. 

ModelIntel Core i5-11500BApple M2Apple M2 Pro
CodenameTiger Lake-H
SeriesIntel Tiger LakeApple M2Apple M2
Series: M2
Intel Core i9-11900KB3.3 - 5.3 GHz8 / 16 cores24 MB L3
Intel Core i9-11900H2.5 - 4.9 GHz8 / 16 cores24 MB L3
Intel Core i9-11950H2.6 - 5 GHz8 / 16 cores24 MB L3
Intel Xeon W-11955M2.6 - 5 GHz8 / 16 cores24 MB L3
Intel Core i7-11850H2.5 - 4.8 GHz8 / 16 cores24 MB L3
Intel Core i7-11800H2.3 - 4.6 GHz8 / 16 cores24 MB L3
Intel Xeon W-11855M3.2 - 4.9 GHz6 / 12 cores18 MB L3
Intel Core i5-11500B « 3.3 - 4.6 GHz6 / 12 cores12 MB L3
Intel Core i5-11400H2.7 - 4.5 GHz6 / 12 cores12 MB L3
Intel Core i5-11260H2.6 - 4.4 GHz6 / 12 cores12 MB L3
Apple M2 Max2.42 - 3.7 GHz12 / 12 cores48 MB L3
Apple M2 Pro2.42 - 3.5 GHz12 / 12 cores24 MB L3
Apple M2 Pro 10-Core2.42 - 3.7 GHz10 / 10 cores24 MB L3
Apple M2 « 2.42 - 3.48 GHz8 / 8 cores8 MB L3
Apple M2 Max2.42 - 3.7 GHz12 / 12 cores48 MB L3
Apple M2 Pro « 2.42 - 3.5 GHz12 / 12 cores24 MB L3
Apple M2 Pro 10-Core2.42 - 3.7 GHz10 / 10 cores24 MB L3
Apple M22.42 - 3.48 GHz8 / 8 cores8 MB L3
Clock3300 - 4600 MHz2424 - 3480 MHz2424 - 3504 MHz
L1 Cache480 KB2 MB3.3 MB
L2 Cache7.5 MB20 MB36 MB
L3 Cache12 MB8 MB24 MB
Cores / Threads6 / 128 / 812 / 12
TDP65 Watt20 Watt
Technology10 nm5 nm5 nm
max. Temp.100 °C
SocketBGA1787
FeaturesDDR4-3200 RAM, PCIe 4, 8 GT/s bus, DL Boost, GNA, MMX, SSE, SSE2, SSE3, SSSE3, SSE4.1, SSE4.2, AVX, AVX2, AVX-512, BMI2, ABM, FMA, ADX, VMX, SMEP, SMAP, EIST, TM1, TM2, HT, Turbo, SST, AES-NI, RDRAND, RDSEED, SHAARMv8 Instruction SetARMv8 Instruction Set
iGPUIntel UHD Graphics Xe 32EUs (Tiger Lake-H) (350 - 1450 MHz)Apple M2 10-Core GPU ( - 1398 MHz)Apple M2 Pro 19-Core GPU
Architecturex86ARMARM
Transistors20000 Million40000 Million
Chip AI15.8 TOPS INT815.8 TOPS INT8
Announced
Manufacturerwww.apple.com

Benchmarks

Performance Rating - CB R15 + R20 + 7-Zip + X265 + Blender + 3DM11 CPU - i5-11500B
33.7 pt (56%)
Restrict / Search: Model: Max. age: years
Cinebench 2024 - Cinebench 2024 CPU Single Core
88 Points (49%)
138%
M2 +
121 Points (68%)
123 Points (69%)
Cinebench 2024 - Cinebench 2024 CPU Multi Core
451 Points (8%)
114%
M2 +
513 Points (10%)
1030 Points (19%)
Cinebench R23 - Cinebench R23 Multi Core
8318 Points (8%)
104%
M2 +
min: 8517     avg: 8654     median: 8667 (8%)     max: 8772 Points
min: 14787     avg: 14795     median: 14794.5 (14%)     max: 14802 Points
Cinebench R23 - Cinebench R23 Single Core
1484 Points (62%)
107%
M2 +
min: 1580     avg: 1595     median: 1585 (67%)     max: 1638 Points
min: 1647     avg: 1648     median: 1647.5 (69%)     max: 1648 Points
Cinebench R20 - Cinebench R20 CPU (Single Core)
566 Points (62%)
67%
M2 +
min: 216     avg: 370.8     median: 381 (42%)     max: 446 Points
min: 446     avg: 446.5     median: 446.5 (49%)     max: 447 Points
Cinebench R20 - Cinebench R20 CPU (Multi Core)
3236 Points (8%)
72%
M2 +
min: 2231     avg: 2325     median: 2324 (6%)     max: 2416 Points
min: 4018     avg: 4031     median: 4031 (10%)     max: 4044 Points
Cinebench R15 - Cinebench R15 CPU Multi 64 Bit
1322 Points (8%)
92%
M2 +
min: 1209.9     avg: 1222     median: 1215 (8%)     max: 1243 Points
2069 Points (13%)
Cinebench R15 - Cinebench R15 CPU Single 64 Bit
223 Points (62%)
100%
M2 +
min: 222     avg: 223.8     median: 223 (62%)     max: 229 Points
230 Points (64%)
Cinebench R11.5 - Cinebench R11.5 CPU Multi 64 Bit
15 Points (19%)
Cinebench R11.5 - Cinebench R11.5 CPU Single 64 Bit
2.6 Points (62%)
Cinebench R10 - Cinebench R10 Rend. Single (32bit)
9000 Points (54%)
Cinebench R10 - Cinebench R10 Rend. Multi (32bit)
41001 Points (30%)
Cinebench R10 - Cinebench R10 Rend. Multi (64bit)
54928 Points (35%)
Cinebench R10 - Cinebench R10 Rend. Single (64bit)
11802 Points (14%)
wPrime 2.10 - wPrime 2.0 1024m *
152 s (2%)
wPrime 2.10 - wPrime 2.0 32m *
4.6 s (1%)
WinRAR - WinRAR 4.0
6789 Points (11%)
7-Zip 18.03 - 7-Zip 18.03 Multi Thread 4 runs
36194 MIPS (21%)
7-Zip 18.03 - 7-Zip 18.03 Single Thread 4 runs
5498 MIPS (65%)
X264 HD Benchmark 4.0 - x264 Pass 2
68.7 fps (2%)
X264 HD Benchmark 4.0 - x264 Pass 1
234.5 fps (6%)
HWBOT x265 Benchmark v2.2 - HWBOT x265 4k Preset
10.3 fps (18%)
TrueCrypt - TrueCrypt Serpent
0.8 GB/s (24%)
TrueCrypt - TrueCrypt Twofish
1.3 GB/s (22%)
TrueCrypt - TrueCrypt AES
8.3 GB/s (22%)
Blender - Blender 3.3 Classroom CPU *
673 Seconds (9%)
109%
M2 +
min: 540     avg: 620     median: 619.5 (8%)     max: 702 Seconds
331 Seconds (4%)
Blender - Blender 2.79 BMW27 CPU *
379 Seconds (3%)
63%
1 M2 +
min: 549     avg: 614     median: 597 (4%)     max: 713 Seconds
R Benchmark 2.5 - R Benchmark 2.5 *
0.6 sec (12%)
133%
1 M2 Pro +
0.4 sec (9%)
3DMark 06 - CPU - 3DMark 06 - CPU
12580 Points (27%)
Super Pi mod 1.5 XS 1M - Super Pi mod 1.5 XS 1M *
7.3 s (2%)
Super Pi mod 1.5 XS 2M - Super Pi mod 1.5 XS 2M *
16 s (1%)
Super Pi Mod 1.5 XS 32M - Super Pi mod 1.5 XS 32M *
373 s (2%)
3DMark Vantage - 3DM Vant. Perf. CPU no Physx
47824 Points (37%)
3DMark 11 - 3DM11 Performance Physics
13784 Points (34%)
3DMark - 3DMark Ice Storm Physics
70795 Points (58%)
3DMark - 3DMark Ice Storm Extreme Physics
70878 Points (58%)
3DMark - 3DMark Ice Storm Unlimited Physics
74085 Points (59%)
3DMark - 3DMark Cloud Gate Physics
12557 Points (32%)
3DMark - 3DMark Fire Strike Standard Physics
19930 Points (36%)
3DMark - 3DMark Time Spy CPU
7021 Points (30%)
Geekbench 6.5 - Geekbench 6.5 Single-Core
2173 Points (53%)
120%
M2 +
min: 2587     avg: 2609     median: 2599 (63%)     max: 2650 Points
2663 Points (64%)
Geekbench 6.5 - Geekbench 6.5 Multi-Core
8148 Points (32%)
124%
M2 +
min: 10034     avg: 10083     median: 10089 (39%)     max: 10120 Points
14568 Points (57%)
Geekbench 6.0 - Geekbench 6.0 Single-Core
2058 Points (65%)
Geekbench 6.0 - Geekbench 6.0 Multi-Core
7760 Points (32%)
Geekbench 5.5 - Geekbench 5.1 - 5.5 64 Bit Single-Core
1566 Points (59%)
122%
M2 +
min: 1887     avg: 1914     median: 1915.5 (73%)     max: 1953 Points
min: 1952     avg: 1957     median: 1957 (74%)     max: 1961 Points
Geekbench 5.5 - Geekbench 5.1 - 5.5 64 Bit Multi-Core
7132 Points (13%)
126%
M2 +
min: 8491     avg: 8812     median: 8956 (16%)     max: 8994 Points
min: 14859     avg: 14961     median: 15010 (27%)     max: 15013 Points
Geekbench 5.0 - Geekbench 5.0 64 Bit Single-Core
1535 Points (7%)
Geekbench 5.0 - Geekbench 5.0 64 Bit Multi-Core
7012 Points (22%)
Geekbench 4.4 - Geekbench 4.1 - 4.4 64 Bit Single-Core
6663 Points (67%)
Geekbench 4.4 - Geekbench 4.1 - 4.4 64 Bit Multi-Core
28454 Points (28%)
Mozilla Kraken 1.1 - Kraken 1.1 Total Score *
649 ms (1%)
144%
M2 +
min: 440     avg: 450.1     median: 449.2 (1%)     max: 466.8 ms
443.8 ms (1%)
Octane V2 - Octane V2 Total Score
100%
1 M2 +
min: 72484     avg: 75019     median: 74878 (55%)     max: 78736 Points
102%
1 M2 Pro +
76205 Points (56%)
WebXPRT 4 - WebXPRT 4 Score
100%
1 M2 +
min: 223     avg: 237.8     median: 235 (65%)     max: 256 Points
108%
1 M2 Pro +
253 Points (70%)
WebXPRT 3 - WebXPRT 3 Score
271 Points (49%)
139%
M2 +
min: 342     avg: 366.5     median: 376 (68%)     max: 387 Points
386 Points (69%)
Antutu v9 - AnTuTu v9 Total Score
100%
1 M2 +
min: 1257990     avg: 1337360     median: 1337360 (65%)     max: 1416730 Points
Antutu v9 - AnTuTu v9 CPU
100%
1 M2 +
min: 294643     avg: 298254     median: 298254 (74%)     max: 301865 Points
Antutu v10 - AnTuTu v10 Total Score
100%
1 M2 +
min: 1936540     avg: 1954930     median: 1961470 (63%)     max: 1966790 Points
Antutu v10 - AnTuTu v10 CPU
100%
1 M2 +
min: 535127     avg: 540446     median: 537292 (54%)     max: 548919 Points
CrossMark - CrossMark Overall
1416 Points (53%)
106%
M2 +
min: 1437     avg: 1515     median: 1507 (56%)     max: 1585 Points
min: 1797     avg: 1805     median: 1804.5 (67%)     max: 1812 Points
Power Consumption - Prime95 Power Consumption - external Monitor *
75.7 Watt (13%)
Power Consumption - Cinebench R15 Multi Power Consumption - external Monitor *
95 Watt (17%)
328%
1 M2 +
29 Watt (5%)
Power Consumption - Geekbench 5.5 Power Consumption 150cd *
100%
1 M2 +
min: 6.86     avg: 8.3     median: 8.4 (4%)     max: 9.71 Watt
Power Consumption - Idle Power Consumption - external Monitor *
14.5 Watt (10%)
594%
1 M2 +
min: 2.03     avg: 2.6     median: 2.4 (2%)     max: 3.98 Watt
Power Consumption - Idle Power Consumption 150cd 1min *
100%
1 M2 +
min: 1.631     avg: 3.5     median: 3.6 (4%)     max: 5.32 Watt
Power Consumption - Power Efficiency - Cinebench R15 Multi external Monitor
13.9 Points per Watt (10%)
305%
1 M2 +
42.4 Points per Watt (32%)

Average Benchmarks Intel Core i5-11500B → 100% n=16

Average Benchmarks Apple M2 → 111% n=16

Average Benchmarks Apple M2 Pro → 149% n=16

- Range of benchmark values for this graphics card
red legend - Average benchmark values for this graphics card
* Smaller numbers mean a higher performance
1 This benchmark is not used for the average calculation

v1.34
log 02. 19:46:05

#0 ran 0s before starting gpusingle class +0s ... 0s

#1 checking url part for id 17400 +0s ... 0s

#2 checking url part for id 14521 +0s ... 0s

#3 checking url part for id 14973 +0s ... 0s

#4 redirected to Ajax server, took 1759427164s time from redirect:1 +0s ... 0s

#5 did not recreate cache, as it is less than 5 days old! Created at Thu, 02 Oct 2025 12:30:24 +0200 +0s ... 0s

#6 composed specs +0.006s ... 0.006s

#7 did output specs +0s ... 0.006s

#8 getting avg benchmarks for device 17400 +0.005s ... 0.011s

#9 got single benchmarks 17400 +0.004s ... 0.015s

#10 getting avg benchmarks for device 14521 +0.001s ... 0.016s

#11 got single benchmarks 14521 +0.009s ... 0.024s

#12 getting avg benchmarks for device 14973 +0.001s ... 0.025s

#13 got single benchmarks 14973 +0.005s ... 0.029s

#14 got avg benchmarks for devices +0s ... 0.029s

#15 min, max, avg, median took s +0.049s ... 0.078s

#16 return log +0s ... 0.078s

Please share our article, every link counts!
Mail Logo
> Expert Reviews and News on Laptops, Smartphones and Tech Innovations > Benchmarks / Tech > Processor Comparison - Head 2 Head
Redaktion, 2017-09- 8 (Update: 2023-07- 1)