Notebookcheck Logo

First AMD Ryzen 7 6800U benchmarks: Closer to Core i7-1260P in multi-core, Radeon 680M impresses in synthetics but lags in gaming

AMD Ryzen 7 6800U and Radeon 680M bring decent performance gains provided there's enough TDP headroom. (Image via AMD/Asus with edits)
We have with us the first benchmarks of AMD's latest Ryzen 6800U APU from an Asus ZenBook S 13 OLED laptop. We see that the Ryzen 6800U offers decent improvements in multi-core over a Ryzen 7 5800U but loses out to the Core i7-1260P in single-core. The biggest advantage, however, is with the Radeon 680M iGPU that can ably compete with the likes of a GTX 1650 Max-Q in some tests, though it might require some upscaling impetus in gaming.

AMD first announced the new Ryzen 6000 series back during CES 2022 followed by the Ryzen Pro 6000 series in April. Devices with Ryzen 6000 processors have now started to become available.

We now have access to the new Asus ZenBook S 13 OLED laptop, which is based on the AMD Ryzen 7 6800U and the integrated Radeon 680M GPU. Asus's implementation allows the Ryzen 7 6800U to work at a sustained PL1 of 17 W with short PL2 bursts up to 30 W in the Performance power profile.

In this article, we take a preliminary look at the performance of the Ryzen 7 6800U and the Radeon 680M in the Asus ZenBook S 13 OLED. A holistic review of the device will follow shortly. Since these are still initial performance data, we have also included reference scores from Asus's reviewer's guide for the ZenBook S 13 wherever available.

Ryzen 7 6800U CPU performance: Targets Core i7-1260P in multi-core, equals Ryzen 9 5900HS in single-core

Despite being housed in a compact 13-inch form factor, the Ryzen 7 6800U puts up an impressive show in CPU benchmarks. Improvements to single-core performance finally see the Ryzen 7 6800U equaling the likes of an average 35 W Ryzen 9 5900HS in Cinebench R23. That being said, the actual performance delta between an average Ryzen 7 5800U and an average Ryzen 9 5900HS isn't really significant to begin with. 

The average Core i5-1240P lags behind the Ryzen 7 6800U by 22% in Cinebench R23 single-core while an average Core i7-1260P manages a 20% lead. It helps to note here that the Core i7-1260P in the Lenovo Yoga 9i 14 actually runs at more than 2x the TDP under load (38 W). A more complete picture will be available as we get to test additional Alder Lake-P devices.

Cinebench R23 multi-core sees the Ryzen 7 6800U faring 20% better compared to an average Ryzen 7 5800U, which is not a bad improvement for an interim refresh. The advantage with the Ryzen 9 5900HS diminishes here owing to the higher wattage of the Cezanne chip. Still, the Ryzen 7 6800U nearly ties with an average Core i7-1260P, which in turn is about 18% faster than an average Ryzen 7 5800U. 

In Blender CPU, we see the Ryzen 7 6800U to be about 9% faster at completing the render compared to an average Ryzen 7 5800U. The new Rembrandt-U APU nearly ties with the Core i7-1260P and is 24% faster than a Core i5-1240P.

Overall system performance in PCMark 10 is about 5% better with the Ryzen 7 6800U than an average Ryzen 7 5800U and a decent 10% higher compared to the Core i7-1260P-powered laptops.

Cinebench R23
Single Core
Lenovo Yoga 9i 14 2022 i7-1260P
Iris Xe G7 96EUs, i7-1260P, Samsung PM9A1 MZVL21T0HCLR
1793 Points
Average Intel Core i7-1260P
  (1155 - 1812, n=25)
1674 Points
Average AMD Ryzen 9 5900HS
  (1457 - 1488, n=4)
1474 Points
Asus ZenBook 13 OLED UM5302T
Radeon 680M, R7 6800U
1472 Points
Lenovo Yoga Slim 7 Pro 14 OLED Ryzen 9
GeForce MX450, R9 5900HS, SK Hynix PC711 1TB HFS001TDE9X084N
1468 Points
Average Intel Core i7-1185G7
  (1251 - 1532, n=24)
1449 Points
Average Intel Core i5-1240P
  (640 - 1689, n=18)
1436 Points
Average AMD Ryzen 7 5800U
  (1415 - 1430, n=5)
1425 Points
HP ProBook x360 435 G8 R7-5800U
Vega 8, R7 5800U, Samsung PM991 MZVLQ512HALU
1423 Points
Multi Core
Average AMD Ryzen 9 5900HS
  (11426 - 13214, n=4)
12533 Points
Lenovo Yoga Slim 7 Pro 14 OLED Ryzen 9
GeForce MX450, R9 5900HS, SK Hynix PC711 1TB HFS001TDE9X084N
11426 Points
Lenovo Yoga 9i 14 2022 i7-1260P
Iris Xe G7 96EUs, i7-1260P, Samsung PM9A1 MZVL21T0HCLR
10735 Points
Asus ZenBook 13 OLED UM5302T
Radeon 680M, R7 6800U
10127 Points
HP ProBook x360 435 G8 R7-5800U
Vega 8, R7 5800U, Samsung PM991 MZVLQ512HALU
9539 Points
Average Intel Core i7-1260P
  (3173 - 12150, n=27)
9314 Points
Average AMD Ryzen 7 5800U
  (7872 - 10624, n=5)
8851 Points
Average Intel Core i5-1240P
  (277 - 11556, n=20)
7949 Points
Average Intel Core i7-1185G7
  (3610 - 6383, n=24)
5324 Points
Cinebench R20
CPU (Single Core)
Lenovo Yoga 9i 14 2022 i7-1260P
Iris Xe G7 96EUs, i7-1260P, Samsung PM9A1 MZVL21T0HCLR
657 Points +13%
Average Intel Core i7-1260P
  (448 - 698, n=25)
645 Points +11%
Asus Zenbook S 13 OLED AMD Reference Values
Radeon 680M, R7 6800U
579 Points
Lenovo Yoga Slim 7 Pro 14 OLED Ryzen 9
GeForce MX450, R9 5900HS, SK Hynix PC711 1TB HFS001TDE9X084N
575 Points -1%
Average AMD Ryzen 9 5900HS
  (560 - 584, n=4)
572 Points -1%
Average Intel Core i7-1185G7
  (489 - 593, n=28)
557 Points -4%
HP ProBook x360 435 G8 R7-5800U
Vega 8, R7 5800U, Samsung PM991 MZVLQ512HALU
555 Points -4%
Average AMD Ryzen 7 5800U
  (551 - 560, n=5)
555 Points -4%
Asus ZenBook 13 OLED UM5302T
Radeon 680M, R7 6800U
554 Points -4%
Average Intel Core i5-1240P
  (251 - 653, n=16)
549 Points -5%
CPU (Multi Core)
Average AMD Ryzen 9 5900HS
  (4414 - 5167, n=4)
4843 Points +21%
Lenovo Yoga Slim 7 Pro 14 OLED Ryzen 9
GeForce MX450, R9 5900HS, SK Hynix PC711 1TB HFS001TDE9X084N
4414 Points +10%
Lenovo Yoga 9i 14 2022 i7-1260P
Iris Xe G7 96EUs, i7-1260P, Samsung PM9A1 MZVL21T0HCLR
4048 Points +1%
Asus Zenbook S 13 OLED AMD Reference Values
Radeon 680M, R7 6800U
4018 Points
Asus ZenBook 13 OLED UM5302T
Radeon 680M, R7 6800U
3837 Points -5%
HP ProBook x360 435 G8 R7-5800U
Vega 8, R7 5800U, Samsung PM991 MZVLQ512HALU
3691 Points -8%
Average Intel Core i7-1260P
  (1234 - 4748, n=25)
3595 Points -11%
Average AMD Ryzen 7 5800U
  (2995 - 3691, n=5)
3347 Points -17%
Average Intel Core i5-1240P
  (763 - 4456, n=16)
3077 Points -23%
Average Intel Core i7-1185G7
  (1425 - 2493, n=28)
2039 Points -49%
Cinebench R15
CPU Single 64Bit
Lenovo Yoga 9i 14 2022 i7-1260P
Iris Xe G7 96EUs, i7-1260P, Samsung PM9A1 MZVL21T0HCLR
243 Points
Lenovo Yoga Slim 7 Pro 14 OLED Ryzen 9
GeForce MX450, R9 5900HS, SK Hynix PC711 1TB HFS001TDE9X084N
238 Points
Average Intel Core i7-1260P
  (165.4 - 260, n=27)
232 Points
Average AMD Ryzen 9 5900HS
  (211 - 240, n=4)
231 Points
HP ProBook x360 435 G8 R7-5800U
Vega 8, R7 5800U, Samsung PM991 MZVLQ512HALU
229 Points
Average AMD Ryzen 7 5800U
  (227 - 229, n=4)
229 Points
Average Intel Core i7-1185G7
  (168 - 230, n=27)
215 Points
Average Intel Core i5-1240P
  (91.8 - 243, n=18)
205 Points
CPU Multi 64Bit
Average AMD Ryzen 9 5900HS
  (1927 - 2180, n=5)
2053 Points
Lenovo Yoga Slim 7 Pro 14 OLED Ryzen 9
GeForce MX450, R9 5900HS, SK Hynix PC711 1TB HFS001TDE9X084N
1927 (1860.38min - 1927max) Points
Lenovo Yoga 9i 14 2022 i7-1260P
Iris Xe G7 96EUs, i7-1260P, Samsung PM9A1 MZVL21T0HCLR
1805 (1600.9min - 1805.05max) Points
Asus ZenBook 13 OLED UM5302T
Radeon 680M, R7 6800U
1690 Points
Average AMD Ryzen 7 5800U
  (1390 - 1925, n=5)
1628 Points
HP ProBook x360 435 G8 R7-5800U
Vega 8, R7 5800U, Samsung PM991 MZVLQ512HALU
1613 (1461.4min - 1613.49max) Points
Average Intel Core i7-1260P
  (549 - 2034, n=29)
1553 Points
Average Intel Core i5-1240P
  (407 - 2007, n=19)
1487 Points
Average Intel Core i7-1185G7
  (617 - 1066, n=32)
859 Points
Blender - v2.79 BMW27 CPU
Average Intel Core i7-1185G7
  (478 - 745, n=28)
588 Seconds *
Average Intel Core i5-1240P
  (285 - 1926, n=16)
503 Seconds *
Average Intel Core i7-1260P
  (264 - 906, n=26)
366 Seconds *
Average AMD Ryzen 7 5800U
  (319 - 391, n=4)
353 Seconds *
Asus ZenBook 13 OLED UM5302T
Radeon 680M, R7 6800U
321.5 Seconds *
HP ProBook x360 435 G8 R7-5800U
Vega 8, R7 5800U, Samsung PM991 MZVLQ512HALU
319 Seconds *
Lenovo Yoga Slim 7 Pro 14 OLED Ryzen 9
GeForce MX450, R9 5900HS, SK Hynix PC711 1TB HFS001TDE9X084N
305 Seconds *
Lenovo Yoga 9i 14 2022 i7-1260P
Iris Xe G7 96EUs, i7-1260P, Samsung PM9A1 MZVL21T0HCLR
300 Seconds *
Average AMD Ryzen 9 5900HS
  (231 - 305, n=4)
254 Seconds *
Geekbench 5.5
Single-Core
Lenovo Yoga 9i 14 2022 i7-1260P
Iris Xe G7 96EUs, i7-1260P, Samsung PM9A1 MZVL21T0HCLR
1764 Points +16%
Average Intel Core i7-1260P
  (1436 - 1786, n=25)
1693 Points +11%
Average Intel Core i5-1240P
  (672 - 1658, n=15)
1523 Points 0%
Average Intel Core i7-1185G7
  (1398 - 1626, n=21)
1520 Points 0%
Asus Zenbook S 13 OLED AMD Reference Values
Radeon 680M, R7 6800U
1519 Points
Lenovo Yoga Slim 7 Pro 14 OLED Ryzen 9
GeForce MX450, R9 5900HS, SK Hynix PC711 1TB HFS001TDE9X084N
1497 Points -1%
Average AMD Ryzen 9 5900HS
  (1410 - 1547, n=3)
1485 Points -2%
Asus ZenBook 13 OLED UM5302T
Radeon 680M, R7 6800U
1472 Points -3%
Average AMD Ryzen 7 5800U
  (1411 - 1450, n=4)
1430 Points -6%
HP ProBook x360 435 G8 R7-5800U
Vega 8, R7 5800U, Samsung PM991 MZVLQ512HALU
1411 Points -7%
Multi-Core
Lenovo Yoga 9i 14 2022 i7-1260P
Iris Xe G7 96EUs, i7-1260P, Samsung PM9A1 MZVL21T0HCLR
10321 Points +34%
Average Intel Core i7-1260P
  (3866 - 10570, n=25)
8763 Points +14%
Lenovo Yoga Slim 7 Pro 14 OLED Ryzen 9
GeForce MX450, R9 5900HS, SK Hynix PC711 1TB HFS001TDE9X084N
7867 Points +2%
Average AMD Ryzen 9 5900HS
  (7767 - 7910, n=3)
7848 Points +2%
Asus Zenbook S 13 OLED AMD Reference Values
Radeon 680M, R7 6800U
7678 Points
Average Intel Core i5-1240P
  (1763 - 10112, n=15)
7594 Points -1%
Asus ZenBook 13 OLED UM5302T
Radeon 680M, R7 6800U
7522 Points -2%
Average AMD Ryzen 7 5800U
  (6093 - 7026, n=4)
6641 Points -14%
HP ProBook x360 435 G8 R7-5800U
Vega 8, R7 5800U, Samsung PM991 MZVLQ512HALU
6093 Points -21%
Average Intel Core i7-1185G7
  (4620 - 5944, n=21)
5460 Points -29%
PCMark 10 - Score
Average AMD Ryzen 9 5900HS
  (5844 - 6896, n=4)
6533 Points +6%
Asus Zenbook S 13 OLED AMD Reference Values
Radeon 680M, R7 6800U
6149 Points
Lenovo Yoga Slim 7 Pro 14 OLED Ryzen 9
GeForce MX450, R9 5900HS, SK Hynix PC711 1TB HFS001TDE9X084N
5844 Points -5%
Average AMD Ryzen 7 5800U
  (5334 - 6090, n=4)
5797 Points -6%
Lenovo Yoga 9i 14 2022 i7-1260P
Iris Xe G7 96EUs, i7-1260P, Samsung PM9A1 MZVL21T0HCLR
5738 Points -7%
Average Intel Core i7-1260P
  (4796 - 6909, n=25)
5701 Points -7%
HP ProBook x360 435 G8 R7-5800U
Vega 8, R7 5800U, Samsung PM991 MZVLQ512HALU
5334 Points -13%
Average Intel Core i5-1240P
  (4881 - 5898, n=14)
5253 Points -15%
Average Intel Core i7-1185G7
  (4746 - 5880, n=24)
5089 Points -17%

* ... smaller is better

Ryzen 7 6800U: Sustained performance affected by chassis constraints

The Ryzen 7 6800U does seem to be capable of decent sustained performance in a Cinebench R15 loop. However, in this test, we see the chassis limitations of the Asus ZenBook S 13 OLED affecting the CPU's ability to fully stretch its muscles. The HP ProBook x360 435 with a Ryzen 7 5800U is able to offer higher scores and a better sustained performance comparatively.

095190285380475570665760855950104511401235133014251520161517101805Tooltip
Asus ZenBook 13 OLED UM5302T Radeon 680M, R7 6800U: Ø1378 (1323.71-1602.82)
Lenovo Yoga 9i 14 2022 i7-1260P Iris Xe G7 96EUs, i7-1260P, Samsung PM9A1 MZVL21T0HCLR: Ø1634 (1600.9-1805.05)
HP ProBook x360 435 G8 R7-5800U Vega 8, R7 5800U, Samsung PM991 MZVLQ512HALU: Ø1520 (1461.4-1613.49)
Lenovo Yoga Slim 7i Pro 14IAP G7 Iris Xe G7 80EUs, i5-1240P, Samsung PM9A1 MZVL2512HCJQ: Ø1675 (1651.8-1830.66)
Samsung Galaxy Book2 Pro 13 NP930XED-KA1DE Iris Xe G7 80EUs, i5-1240P, Samsung PM991a MZVLQ256HBJD: Ø878 (859.75-883.65)

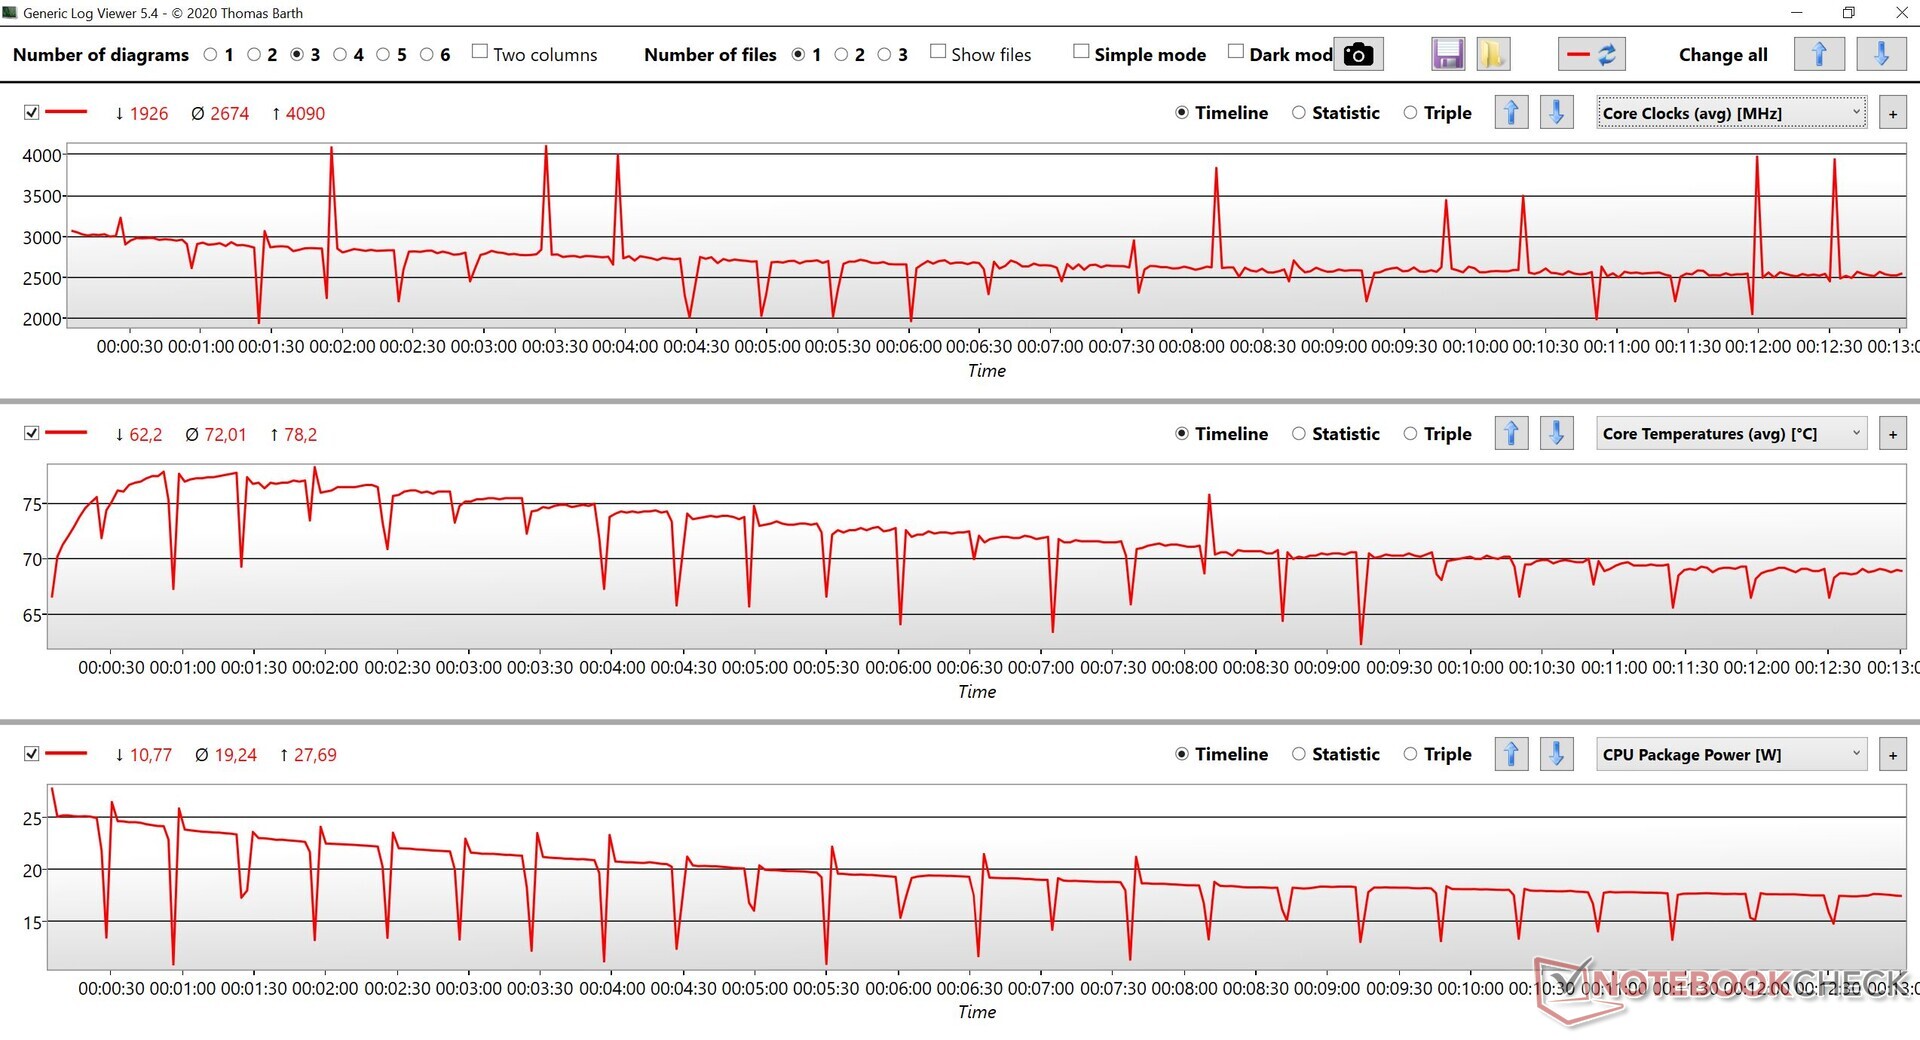
During the run, we observed that the laptop isn't quite capable of sustaining the 30 W peak TDP. It gradually settles down to about 17 W with the core clocks eventually levelling off near the 2.5 GHz mark and temperatures settling around 70 °C.

Ryzen 7 6800U: CPU clocks, temperature, and package power during a Cinebench R15 multi-core loop

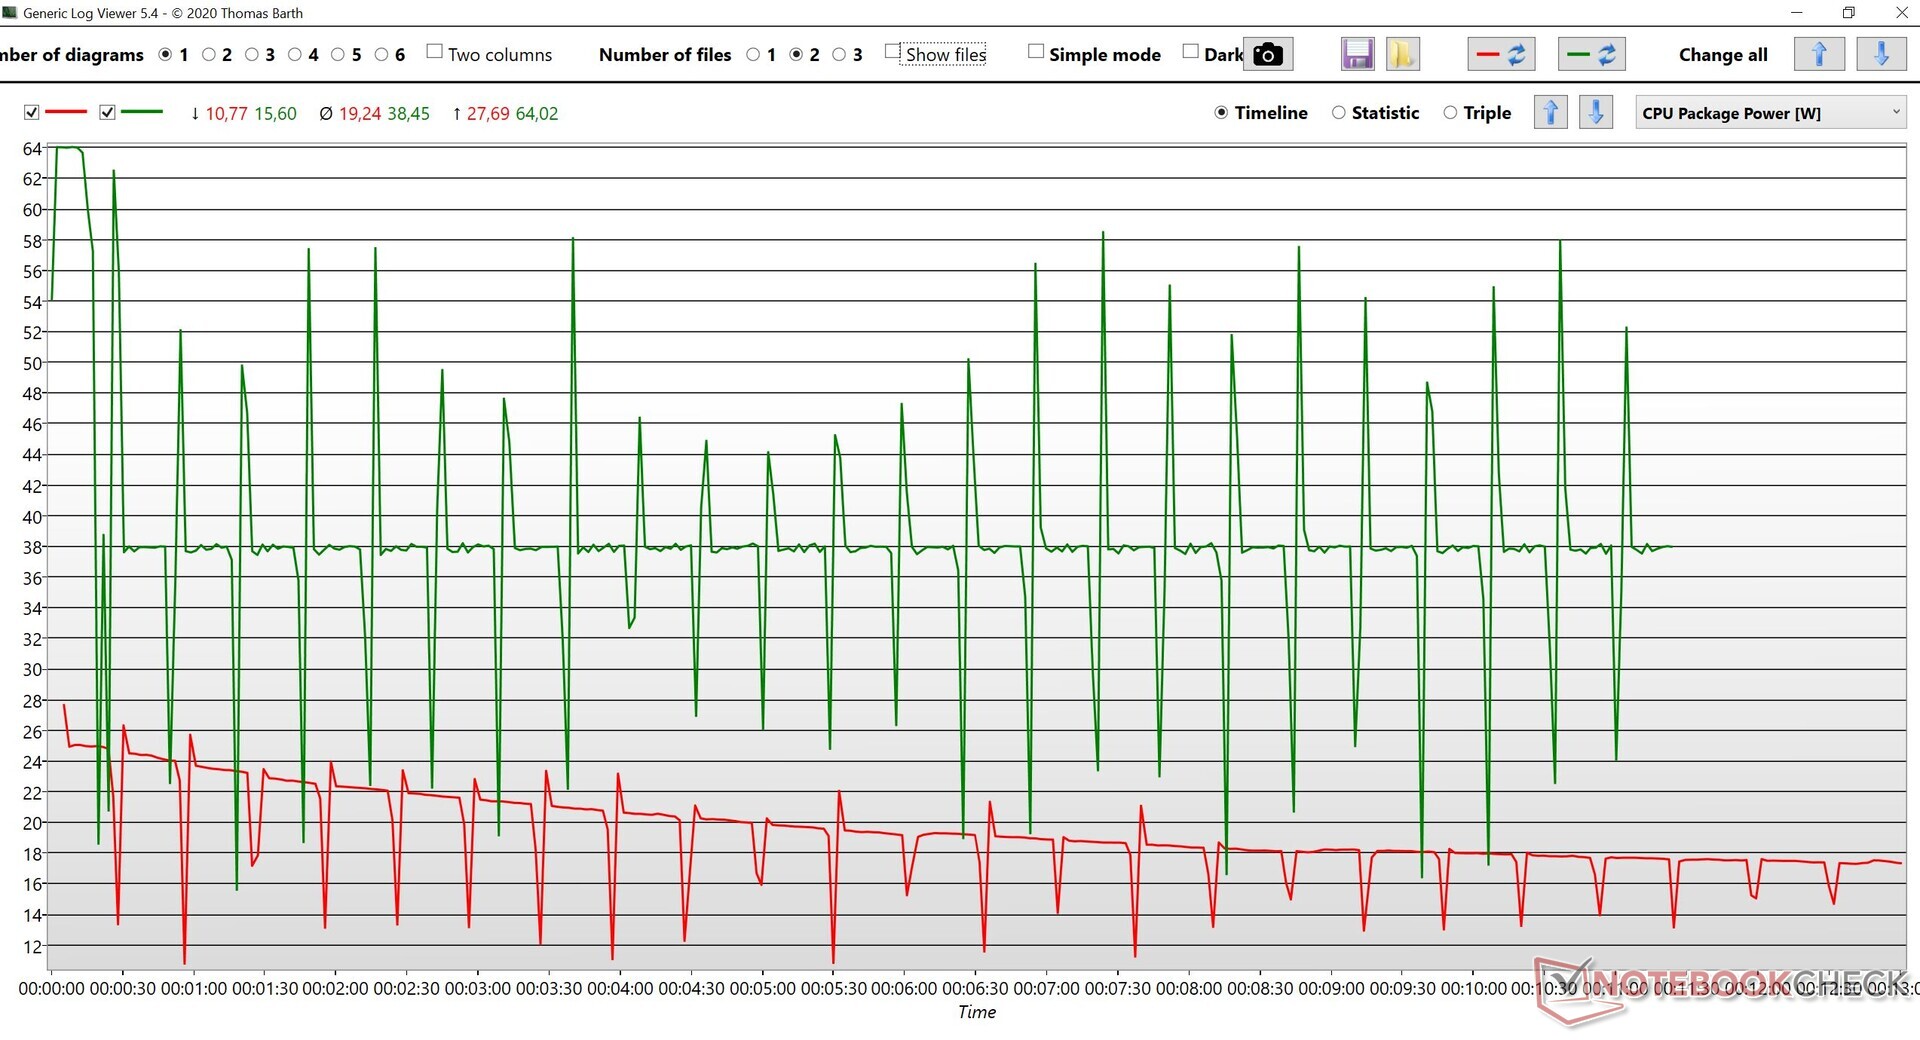
Compared to the Lenovo Yoga 9i 14 with a Core i7-1260P, the Asus ZenBook S 13 OLED is at a disadvantage. The Core i7-1260P is able to raise the PL2 to as much as 64 W, which affords much higher boosts while the Ryzen 7 6800U can only attain 30 W PL2 in the ZenBook S 13's Performance mode.

Ryzen 7 6800U vs Core i7-1260P: CPU package powers during a Cinebench R15 multi-core loop

Radeon 680M iGPU: Beats the MX450 in synthetics but not in gaming, requires FSR

One of the main USPs of the Ryzen 6000 generation is the introduction of an RDNA 2-based iGPU that should finally negate the need for an entry-level dGPU like the GeForce MX450.

In Geekbench 5.3 compute tests, the Radeon 680M is able to handily beat an average MX450 in both OpenCL and Vulkan tests with comparable performance to that of an average GTX 1650 Mobile. In 3DMark, the Radeon 680M is able to lead an average MX450 by as much as 37% in Fire Strike Graphics and 25% in Time Spy Graphics. However, it loses out to the GTX 1650 Mobile and the GTX 1650 Max-Q in this test.

Gaming presents a strange conundrum. We have scores only from Dota 2: Reborn for the moment, but the Radeon 680M trails the average MX450 and the average GTX 1650 Max-Q by 21% and 28%, respectively in 1080p High. This performance gap between the GPUs further increases by up to 7% at 1080p Ultra. The deltas are somewhat lower at lower resolutions and settings.

We will be testing more games with this GPU, but first impressions indicate that performance can be potentially further enhanced with FidelityFX Super Resolution (FSR) 2.0 upscaling in supported games or via Radeon Super Resolution (RSR) in the driver.

Geekbench 5.5
OpenCL Score
Average NVIDIA GeForce RTX 3050 4GB Laptop GPU
  (42735 - 60557, n=19)
54484 Points
Average NVIDIA GeForce GTX 1650 Max-Q
  ()
36507 Points
Lenovo Yoga Slim 7 Pro 14 OLED Ryzen 9
GeForce MX450, R9 5900HS, SK Hynix PC711 1TB HFS001TDE9X084N
33703 Points
Asus ZenBook 13 OLED UM5302T
Radeon 680M, R7 6800U
31716 Points
Average NVIDIA GeForce GTX 1650 Mobile
  (6025 - 40979, n=14)
31228 Points
Average NVIDIA GeForce MX450
  (9083 - 33703, n=21)
28822 Points
Lenovo Yoga 9i 14 2022 i7-1260P
Iris Xe G7 96EUs, i7-1260P, Samsung PM9A1 MZVL21T0HCLR
20391 Points
Average Intel Iris Xe Graphics G7 96EUs
  (11261 - 28770, n=198)
17744 Points
Average AMD Radeon RX Vega 8 (Ryzen 4000/5000)
  (11298 - 19234, n=54)
15078 Points
HP ProBook x360 435 G8 R7-5800U
Vega 8, R7 5800U, Samsung PM991 MZVLQ512HALU
13045 Points
Vulkan Score
Average NVIDIA GeForce GTX 1650 Mobile
  (12185 - 34431, n=14)
28995 Points
Asus ZenBook 13 OLED UM5302T
Radeon 680M, R7 6800U
25243 Points
Average NVIDIA GeForce RTX 3050 4GB Laptop GPU
  (4239 - 44208, n=19)
22852 Points
Lenovo Yoga 9i 14 2022 i7-1260P
Iris Xe G7 96EUs, i7-1260P, Samsung PM9A1 MZVL21T0HCLR
19510 Points
Lenovo Yoga Slim 7 Pro 14 OLED Ryzen 9
GeForce MX450, R9 5900HS, SK Hynix PC711 1TB HFS001TDE9X084N
19285 Points
Average NVIDIA GeForce MX450
  (9955 - 28854, n=21)
18938 Points
Average NVIDIA GeForce GTX 1650 Max-Q
  ()
18595 Points
Average AMD Radeon RX Vega 8 (Ryzen 4000/5000)
  (10358 - 22015, n=54)
16921 Points
Average Intel Iris Xe Graphics G7 96EUs
  (10358 - 21312, n=199)
16579 Points
HP ProBook x360 435 G8 R7-5800U
Vega 8, R7 5800U, Samsung PM991 MZVLQ512HALU
13123 Points
3DMark
2560x1440 Time Spy Graphics
Average NVIDIA GeForce RTX 3050 4GB Laptop GPU
  (3281 - 5295, n=21)
4517 Points
Average NVIDIA GeForce GTX 1650 Mobile
  (2900 - 3700, n=31)
3430 Points
Average NVIDIA GeForce GTX 1650 Max-Q
  (2836 - 3238, n=10)
2998 Points
Lenovo Yoga Slim 7 Pro 14 OLED Ryzen 9
GeForce MX450, R9 5900HS, SK Hynix PC711 1TB HFS001TDE9X084N
2297 Points
Asus ZenBook 13 OLED UM5302T
Radeon 680M, R7 6800U
2244 Points
Average NVIDIA GeForce MX450
  (1086 - 2300, n=16)
1796 Points
Lenovo Yoga 9i 14 2022 i7-1260P
Iris Xe G7 96EUs, i7-1260P, Samsung PM9A1 MZVL21T0HCLR
1784 Points
Average Intel Iris Xe Graphics G7 96EUs
  (707 - 1871, n=204)
1494 Points
Average AMD Radeon RX Vega 8 (Ryzen 4000/5000)
  (540 - 1557, n=54)
1156 Points
HP ProBook x360 435 G8 R7-5800U
Vega 8, R7 5800U, Samsung PM991 MZVLQ512HALU
863 Points
1920x1080 Fire Strike Graphics
Average NVIDIA GeForce RTX 3050 4GB Laptop GPU
  (9138 - 14157, n=20)
11915 Points
Average NVIDIA GeForce GTX 1650 Mobile
  (7741 - 9810, n=32)
9195 Points
Average NVIDIA GeForce GTX 1650 Max-Q
  (6985 - 8618, n=12)
7853 Points
Asus ZenBook 13 OLED UM5302T
Radeon 680M, R7 6800U
6665 Points
Lenovo Yoga Slim 7 Pro 14 OLED Ryzen 9
GeForce MX450, R9 5900HS, SK Hynix PC711 1TB HFS001TDE9X084N
5540 Points
Lenovo Yoga 9i 14 2022 i7-1260P
Iris Xe G7 96EUs, i7-1260P, Samsung PM9A1 MZVL21T0HCLR
5479 Points
Average Intel Iris Xe Graphics G7 96EUs
  (2286 - 6143, n=207)
4905 Points
Average NVIDIA GeForce MX450
  (4336 - 5753, n=17)
4869 Points
Average AMD Radeon RX Vega 8 (Ryzen 4000/5000)
  (1694 - 5041, n=54)
3676 Points
HP ProBook x360 435 G8 R7-5800U
Vega 8, R7 5800U, Samsung PM991 MZVLQ512HALU
2659 Points
Dota 2 Reborn
1280x720 min (0/3) fastest
Average NVIDIA GeForce RTX 3050 4GB Laptop GPU
  (91.1 - 187, n=20)
142.2 fps
Lenovo Yoga Slim 7 Pro 14 OLED Ryzen 9
GeForce MX450, R9 5900HS, SK Hynix PC711 1TB HFS001TDE9X084N
136 (122.3min) fps
Average NVIDIA GeForce MX450
  (36.1 - 144, n=21)
121.1 fps
Average NVIDIA GeForce GTX 1650 Mobile
  (75.8 - 148, n=20)
120.7 fps
Average NVIDIA GeForce GTX 1650 Max-Q
  (61.2 - 158.2, n=5)
111.6 fps
Lenovo Yoga 9i 14 2022 i7-1260P
Iris Xe G7 96EUs, i7-1260P, Samsung PM9A1 MZVL21T0HCLR
110.8 (88.4min) fps
Asus ZenBook 13 OLED UM5302T
Radeon 680M, R7 6800U
110.3 (94.8min) fps
Average AMD Radeon RX Vega 8 (Ryzen 4000/5000)
  (67.9 - 152, n=57)
108.1 fps
HP ProBook x360 435 G8 R7-5800U
Vega 8, R7 5800U, Samsung PM991 MZVLQ512HALU
108 (91.4min) fps
Average Intel Iris Xe Graphics G7 96EUs
  (36 - 148, n=207)
100 fps
1366x768 med (1/3)
Lenovo Yoga Slim 7 Pro 14 OLED Ryzen 9
GeForce MX450, R9 5900HS, SK Hynix PC711 1TB HFS001TDE9X084N
133 (116.7min) fps
Average NVIDIA GeForce RTX 3050 4GB Laptop GPU
  (90.3 - 170.8, n=20)
130 fps
Average NVIDIA GeForce GTX 1650 Mobile
  (69.1 - 136, n=20)
109.1 fps
Average NVIDIA GeForce MX450
  (35.5 - 133, n=21)
107.9 fps
Average NVIDIA GeForce GTX 1650 Max-Q
  (76.5 - 130.9, n=5)
103.6 fps
Asus ZenBook 13 OLED UM5302T
Radeon 680M, R7 6800U
93.6 (77.6min) fps
Average AMD Radeon RX Vega 8 (Ryzen 4000/5000)
  (49.9 - 122.3, n=57)
86.1 fps
Lenovo Yoga 9i 14 2022 i7-1260P
Iris Xe G7 96EUs, i7-1260P, Samsung PM9A1 MZVL21T0HCLR
83.6 (66min) fps
HP ProBook x360 435 G8 R7-5800U
Vega 8, R7 5800U, Samsung PM991 MZVLQ512HALU
79.2 (65.5min) fps
Average Intel Iris Xe Graphics G7 96EUs
  (31.6 - 108.5, n=207)
75.5 fps
1920x1080 high (2/3)
Average NVIDIA GeForce RTX 3050 4GB Laptop GPU
  (84 - 160.3, n=20)
122.1 fps
Lenovo Yoga Slim 7 Pro 14 OLED Ryzen 9
GeForce MX450, R9 5900HS, SK Hynix PC711 1TB HFS001TDE9X084N
106 (94.6min) fps
Average NVIDIA GeForce GTX 1650 Mobile
  (63.3 - 127, n=20)
99.2 fps
Average NVIDIA GeForce GTX 1650 Max-Q
  (71.2 - 128, n=5)
97.1 fps
Average NVIDIA GeForce MX450
  (35.4 - 115, n=21)
87.7 fps
Asus ZenBook 13 OLED UM5302T
Radeon 680M, R7 6800U
69.8 (59.9min) fps
Lenovo Yoga 9i 14 2022 i7-1260P
Iris Xe G7 96EUs, i7-1260P, Samsung PM9A1 MZVL21T0HCLR
67.8 (58.8min) fps
Average Intel Iris Xe Graphics G7 96EUs
  (23.2 - 88.1, n=207)
53.8 fps
Average AMD Radeon RX Vega 8 (Ryzen 4000/5000)
  (25.5 - 76.7, n=57)
51.8 fps
HP ProBook x360 435 G8 R7-5800U
Vega 8, R7 5800U, Samsung PM991 MZVLQ512HALU
38.6 (35.2min) fps
1920x1080 ultra (3/3) best looking
Average NVIDIA GeForce RTX 3050 4GB Laptop GPU
  (82.8 - 147.7, n=20)
114.8 fps
Lenovo Yoga Slim 7 Pro 14 OLED Ryzen 9
GeForce MX450, R9 5900HS, SK Hynix PC711 1TB HFS001TDE9X084N
96.1 (84.7min) fps
Average NVIDIA GeForce GTX 1650 Mobile
  (58.5 - 119, n=20)
93.2 fps
Average NVIDIA GeForce GTX 1650 Max-Q
  (64.4 - 105.6, n=5)
85.6 fps
Average NVIDIA GeForce MX450
  (34.9 - 104.6, n=20)
79.9 fps
Lenovo Yoga 9i 14 2022 i7-1260P
Iris Xe G7 96EUs, i7-1260P, Samsung PM9A1 MZVL21T0HCLR
62.7 (53.2min) fps
Asus ZenBook 13 OLED UM5302T
Radeon 680M, R7 6800U
57.7 (50min) fps
Average Intel Iris Xe Graphics G7 96EUs
  (20.6 - 78.5, n=207)
49 fps
Average AMD Radeon RX Vega 8 (Ryzen 4000/5000)
  (23.3 - 72, n=57)
48.6 fps
HP ProBook x360 435 G8 R7-5800U
Vega 8, R7 5800U, Samsung PM991 MZVLQ512HALU
36.4 (33.2min) fps

Overall, the Ryzen 7 6800U does impress on several counts even though the actual processor itself isn't too different from previous Cezanne offerings. Sustained performance definitely has room for improvement, but it is more likely to be a limitation of the Asus ZenBook S 13 OLED's compact chassis than the processor itself.

We now have an iGPU that performs comparably to entry-level dGPUs thanks to the RDNA 2-based Radeon 680M. Though we found the Radeon 680M to perform well in compute and synthetics tests, it looks like it does require some additional impetus in gaming via FSR or RSR.

We will be evaluating other metrics of the Asus ZenBook S 13 OLED in our full review that is coming up soon and will also be testing more Ryzen 6000 and Alder Lake offerings in the days to come for a more holistic picture, so stay tuned.

Source(s)

Own

Pricecompare

Read all 9 comments / answer
static version load dynamic
Loading Comments
Comment on this article
Please share our article, every link counts!
> Expert Reviews and News on Laptops, Smartphones and Tech Innovations > News > News Archive > Newsarchive 2022 05 > First AMD Ryzen 7 6800U benchmarks: Closer to Core i7-1260P in multi-core, Radeon 680M impresses in synthetics but lags in gaming
Vaidyanathan Subramaniam, 2022-05-19 (Update: 2022-05-31)