

Intel Atom x7-Z8700 vs Intel Celeron N4120 vs Intel Atom x7-Z8750
Intel Atom x7-Z8700
► remove from comparison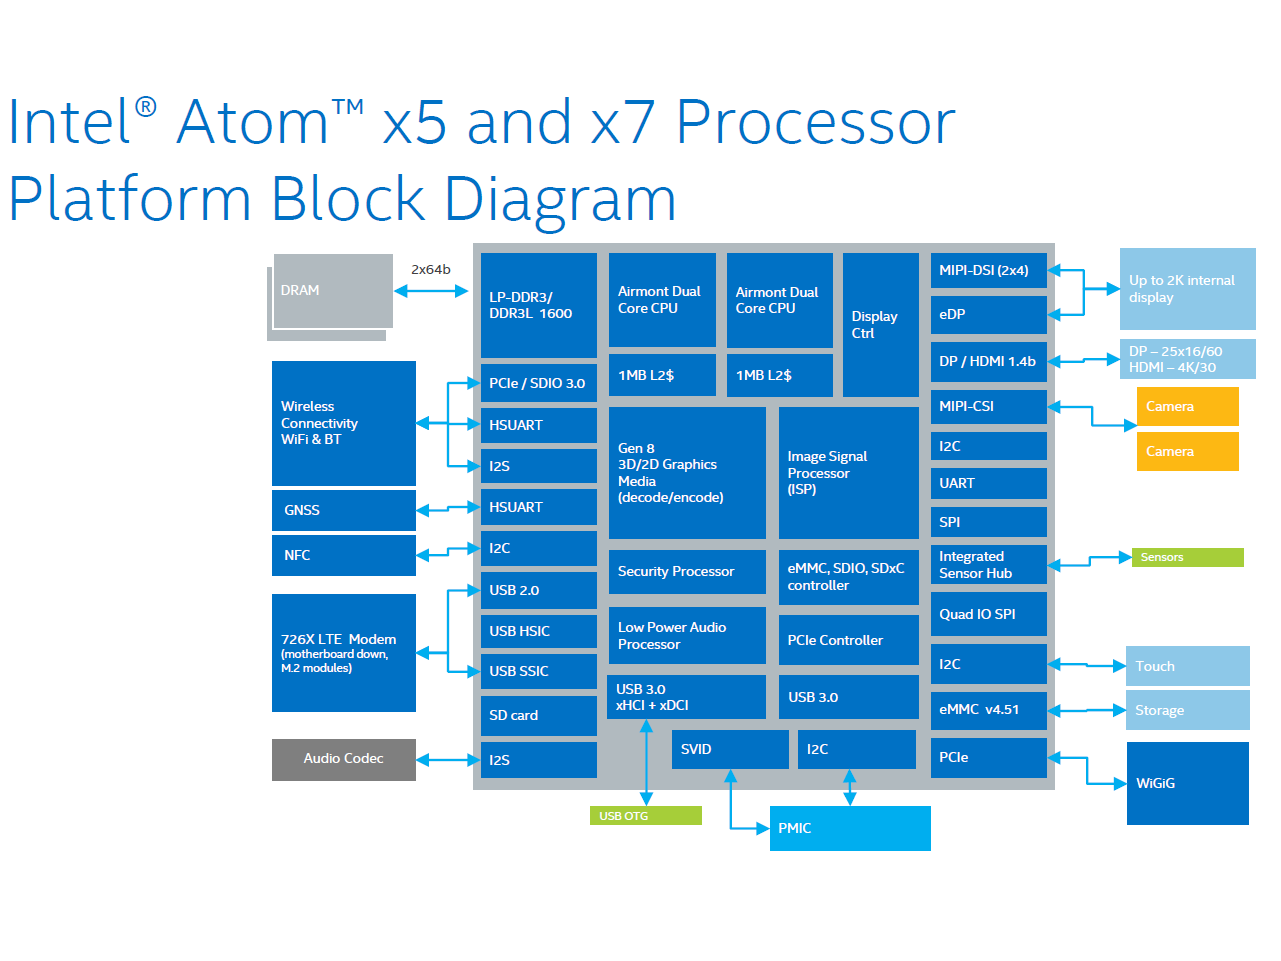
The Intel Atom x7-Z8700 is a power efficient quad-core SoC for Windows and Android devices (tablets and convertibles), which has been presented in March 2015. It is clocked at 1.6 - 2.4 GHz and part of the Cherry Trail platform. Thanks to its new 14 nanometer low-power process (P1273) with tri-gate transistors, energy efficiency has been significantly improved compared to its predecessor Bay Trail-T (e.g. Atom Z3795). In addition to the CPU cores, the SoC offers a DirectX 11.2-capable GPU as well as a LPDDR3 Memory Controller (2x 64 bit, 25.6 GB/s).
Architecture
The processor cores are based on the Airmont architecture, which is basically a slightly modified shrink of the previous Silvermont core. While performance per clock has not been improved, the more efficient 14 nm process leads to a better utilization of the CPU Burst (alias Turbo Boost) and a therefore somewhat higher overall performance.
Performance
Compared to the Atom Z3795, the Atom x7-Z8700 offers about 5 percent more performance and is similar fast as an AMD A6-6210 APU or high-end ARM SoCs, e.g. the Snapdragon 810 or Exynos 7420.
Using Windows, the performance is adequate for everyday tasks such as Internet or Office, but not for very complex software or modern games.
Graphics
The HD Graphics (Cherry Trail) is based on the Intel Gen8 architecture, which supports DirectX 11.2 and is also found in the Broadwell series (e.g. HD Graphics 5300). With 16 EUs (Execution Units) and a clock speed of up to 600 MHz, the GPU is about twice as fast as the HD Graphics (Bay Trail) and will handle older and less demandig Windows games (e.g. Counter-Strike: GO) in low settings at decent frame rates. The GPU also supports 4K/H.265 video acceleration.
Compared to ARM SoCs, the HD Graphics offers a performance somewhere between the Qualcomm Adreno 330 / PowerVR G6430 and the Adreno 420 / PowerVR GX6450.
Power Consumption
The entire SoC is rated at an SDP of 2 watts, which indicates a TDP of less than 4 watts. Thus, the chip can be used in passively cooled tablets.
Intel Celeron N4120
► remove from comparison
The Intel Celeron N4120 is a quad-core SoC primarily for inexpensive notebooks and was announced late 2019. It runs at 1.1-2.6 GHz (Single Core Burst) and is based on the Gemini Lake platform. Compared to the predecessor, the Celeron N4100, the refresh offers a 200 MHz higher Boost clock. Similar to the Apollo Lake predecessors, the chip is manufactured in a 14 nm process with FinFETs but offers slightly improved processor cores, double the amount of L2 cache, a smaller package, a new generation of monitor outputs (Gen 10) and a partly integrated WiFi chip. Besides four CPU cores, the chip also includes a DirectX 12 capable GPU as well as a DDR4/LPDDR4 memory controller (dual-channel, up to 2400 MHz). The SoC is not replaceable as it is directly soldered to the mainboard.
Architecture
The processor architecture ist still called Goldmont Plus. Compared to the older Goldmont cores in Apollo Lake, they feature an increased level 2 cache (to 4 MB). That means the per-clock-performance should be a bit better, but not near the Core CPUs like Kaby Lake Y.
Performance
The average N4120 in our database is not much faster than AMD's Zen-based, affordable Athlon Silver 3050e, as far as multi-thread benchmark scores are concerned, with the Intel Celeron 6305 and the Core i5-7Y54 found close nearby as well. It's a very basic CPU that we're talking about here. While it does have four cores, these are some seriously slow cores, dashing hopes of anybody looking to get a Core i3-like performance for cheap.
GPU Performance
The UHD Graphics 600 (Gemini Lake) is based on Intel's Gen9 architecture, which supports DirectX 12 and is also used for the Kaby Lake / Skylake / Apollo Lake graphics adapters (like HD Graphics 520). Equipped with 12 EUs and a clock of up to 700 MHz, the performance should be roughly on par with the older HD Graphics 500 (Apollo Lake).
The chip also includes an advanced video engine with hardware support for the playback of VP9 and H.265 material (8-bit color-depth).
Power Consumption
Just like most other N-class Intel processors, Celeron N4120 has a default TDP of 6 W (also known as PL1), making it a good option for passively cooled laptops, tablets, mini-PCs. It's manufactured on a very old (as of late 2022) 14 nm process, though, making for poor energy efficiency.
Intel Atom x7-Z8750
► remove from comparison
The Atom x7-Z8750 is a quad-core SoC for entry-level laptops and passive-cooled tablets, which has been presented in early 2016. It is clocked at 1.1 - 2.56 GHz and part of the Cherry Trail platform. Thanks to its new 14 nanometer low-power process (P1273) with tri-gate transistors, energy efficiency has been significantly improved compared to its predecessor Bay Trail. In addition to the CPU cores, the SoC offers a DirectX 11.2-capable GPU as well as a DDR3L Memory Controller (2x 64 bit, 25.6 GB/s).
Compared to the similar Pentium N3710, the Atom x7-Z8750 is tuned for less power consumption and offers less PCI-Express lanes (2 instead of 4) and less USB 3.0 ports (3 instead of 5). Furthermore, the integrated GPU clocks only at 600 (instead of 700) MHz and the memory controller supports LPDDR3-1600.
Architecture
The processor cores are based on the Airmont architecture, which is basically a slightly modified shrink of the previous Silvermont core. While performance per clock has not been improved, the more efficient 14 nm process leads to a better utilization of the CPU Burst (alias Turbo Boost) and a therefore somewhat higher overall performance.
Performance
Due to the passive cooling and lower TDP, the Atom x7-Z8750 is a bit slower than the similar clocked Pentium N3710. The boost frequency of the CPU cores wont be used as long as in an average Pentium based laptop. However, if TDP and cooling are similar, the performance should be comparable. Using Windows, the CPU is adequate for everyday tasks such as Internet browsing or office applications, but may struggle in more demanding software or multitasking.
Graphics
The HD Graphics 405 (Braswell) is based on the Intel Gen8 architecture, which supports DirectX 11.2 and is also found in the Broadwell series (e.g. HD Graphics 5300). With 16 EUs (Execution Units) and a clock speed of up to 600 MHz, the GPU is about twice as fast as the HD Graphics (Bay Trail), but still not powerful enough to handle demanding 3D games of 2015. The GPU also supports 4K/H.265 video acceleration.
Power Consumption
The entire SoC is not rated with a TDP, but only an SDP (Scenario Design Power) of 2 Watt (N3710 SDP 4 Watt, TDP 6 Watt). Thus, the chip can be cooled passively.
| Model | Intel Atom x7-Z8700 | Intel Celeron N4120 | Intel Atom x7-Z8750 | ||||||||||||||||||||||||||||||||||||||||
| Codename | Cherry Trail | Gemini Lake Refresh | Cherry Trail | ||||||||||||||||||||||||||||||||||||||||
| Series | Intel Atom x7 | Intel Gemini Lake | Intel Atom x7 | ||||||||||||||||||||||||||||||||||||||||
| Series: Atom x7 Cherry Trail |
|
|
| ||||||||||||||||||||||||||||||||||||||||
| Clock | 1600 - 2400 MHz | 1100 - 2600 MHz | 1600 - 2560 MHz | ||||||||||||||||||||||||||||||||||||||||
| L2 Cache | 2 MB | 4 MB | 2 MB | ||||||||||||||||||||||||||||||||||||||||
| Cores / Threads | 4 / 4 | 4 / 4 | 4 / 4 | ||||||||||||||||||||||||||||||||||||||||
| Technology | 14 nm | 14 nm | 14 nm | ||||||||||||||||||||||||||||||||||||||||
| max. Temp. | 90 °C | 105 °C | 90 °C | ||||||||||||||||||||||||||||||||||||||||
| Features | Intel HD Graphics (Cherry Trail, 200 - 600 MHz), Wireless Display, AES-NI, max. 8 GB Dual-Channel LPDDR3-1600 (25,6 GB/s), 3x USB 3.0, 2x PCIe 2.0 | DDR4-2400/LPDDR4-2400 RAM, PCIe 2, MMX, SSE, SSE2, SSE3, SSSE3, SSE4.1, SSE4.2, VMX, SMEP, SMAP, MPX, EIST, TM1, TM2, Turbo, AES-NI, RDRAND, RDSEED, SHA, SGX | Intel HD Graphics 405 (Braswell, 600 MHz), Wireless Display, Quick Sync, AES-NI, max. 8 GB Dual-Channel DDR3L-1600 (25,6 GB/s), 3x USB 3.0, 4x PCIe 2.0, 2x SATA 6.0 Gbit/s | ||||||||||||||||||||||||||||||||||||||||
| iGPU | Intel HD Graphics (Cherry Trail) (200 - 600 MHz) | Intel UHD Graphics 600 (200 - 700 MHz) | Intel HD Graphics 405 (Braswell) (400 - 600 MHz) | ||||||||||||||||||||||||||||||||||||||||
| Architecture | x86 | x86 | x86 | ||||||||||||||||||||||||||||||||||||||||
| Announced | |||||||||||||||||||||||||||||||||||||||||||
| Manufacturer | ark.intel.com | ark.intel.com | ark.intel.com | ||||||||||||||||||||||||||||||||||||||||
| TDP | 6 Watt | ||||||||||||||||||||||||||||||||||||||||||
| Socket | BGA1090 | UTFCBGA1380 | |||||||||||||||||||||||||||||||||||||||||
| $37 U.S. |

Benchmarks

Average Benchmarks Intel Atom x7-Z8700 → 100% n=8
Average Benchmarks Intel Celeron N4120 → 287% n=8
Average Benchmarks Intel Atom x7-Z8750 → 188% n=8
* Smaller numbers mean a higher performance
1 This benchmark is not used for the average calculation