 Deutsch
 English
 Español
 Français
 Italiano
 Nederlands
 Polski
 Português
 Русский
 Türkçe
 Svenska
 Chinese
 Magyar
Intel Atom x5-Z8500 vs Intel Atom Z3775 vs Intel Pentium N3530
Intel Atom x5-Z8500
► remove from comparison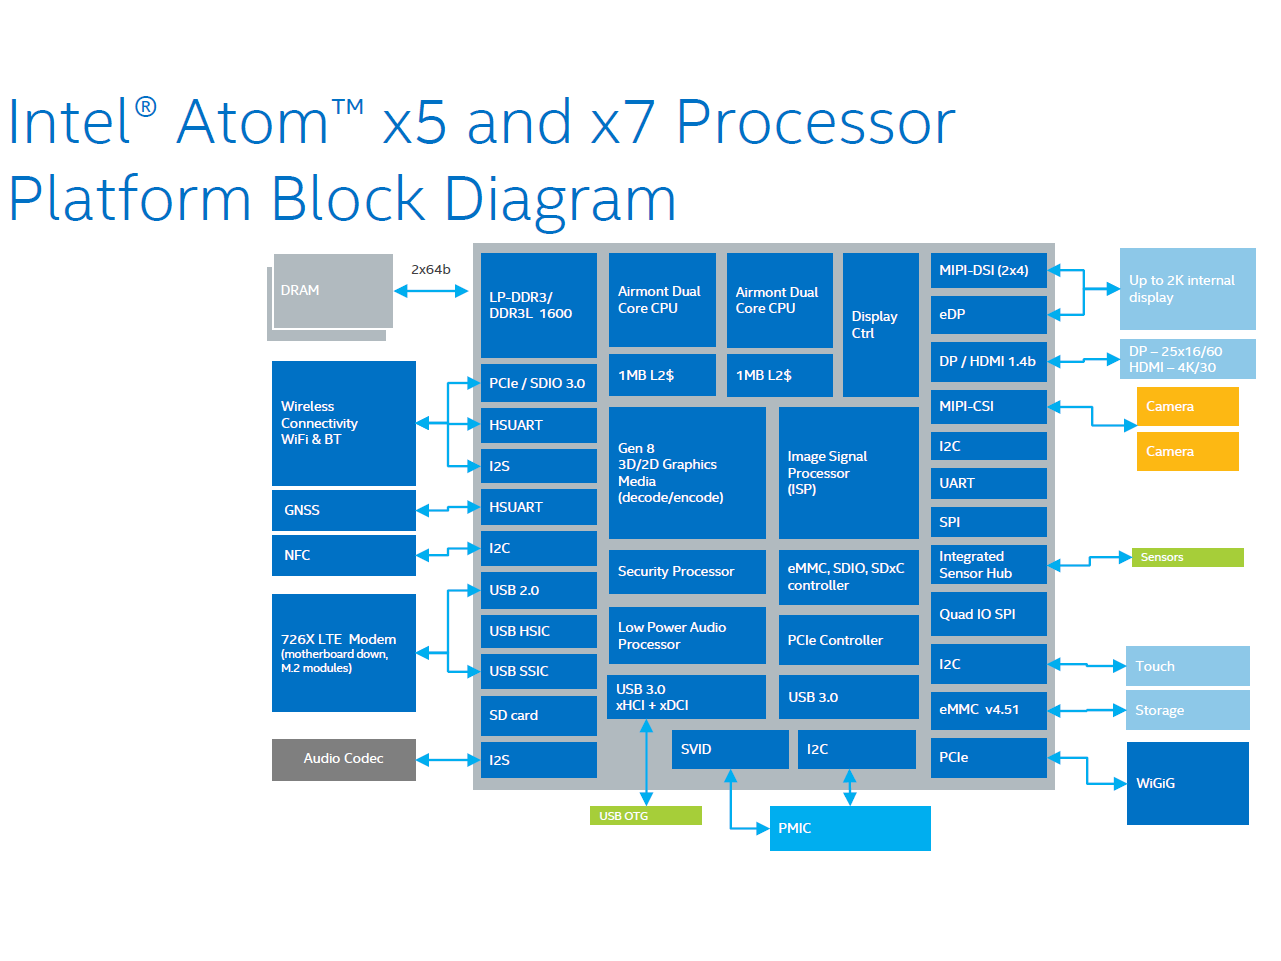
The Intel Atom x5-Z8500 is a power efficient quad-core SoC for Windows and Android devices (tablets and convertibles), which has been presented in March 2015. It is clocked at 1.44 - 2.24 GHz and part of the Cherry Trail platform. Thanks to its new 14 nanometer low-power process (P1273) with tri-gate transistors, energy efficiency has been significantly improved over its predecessor Bay Trail-T (e.g. Atom Z3795). In addition to the CPU cores, the SoC offers a DirectX 11.2-capable GPU as well as a LPDDR3 Memory Controller (2x 64 bit, 25.6 GB/s).
Architecture
The processor cores are based on the Airmont architecture, which is basically a slightly modified shrink of the previous Silvermont core. While performance per clock has not been improved, the more efficient 14 nm process may lead to a better utilization of the CPU Burst (alias Turbo Boost) and therefore a somewhat higher performance in certain situations.
Performance
Compared to the Atom x7-Z8700, the Atom x5-Z8500 is clocked slightly lower and therefore 5 - 10 percent slower. However, the x5 still beats most ARM-based SoCs and offers a performance similar to a Qualcomm Snapdragon 810.
Using Windows, the chip is adequate for everyday tasks such as Internet or Office, but not for very complex software or modern games.
Graphics
The HD Graphics (Cherry Trail) is based on the Intel Gen8 architecture, which supports DirectX 11.2 and is also found in the Broadwell series (e.g. HD Graphics 5300). With 12 EUs (Execution Units) and a clock speed of up to 600 MHz, the GPU is about twice as fast as the HD Graphics (Bay Trail) and will handle older and less demandig Windows games (e.g. Counter-Strike: GO) in very low settings at decent frame rates. The GPU also supports 4K/H.265 video acceleration.
Compared to ARM SoCs, the HD Graphics offers a performance similar to the Qualcomm Adreno 330 or PowerVR G6430.
Power Consumption
The entire SoC is rated at an SDP of 2 watts, which indicates a TDP of less than 4 watts. Thus, the chip can be used in passively cooled tablets.
Intel Atom Z3775
► remove from comparison
The Intel Atom Z3775 is a power efficient quad-core SoC for Windows and Android tablets. It is clocked at 1.46 - 2.39 GHz and part of the Bay Trail-T platform. Thanks to the specially optimized 22 nanometer low-power process (P1271) with tri-gate transistors, performance and energy efficiency have been significantly improved compared to its predecessor.
Compared to the Z3770, the Z3775 is based on the new C0 stepping and offers a slightly increased GPU clock rate.
Architecture
The processor cores are based on the new Silvermont architecture, which is an out-of-order design for the first time. The increased utilization of the pipeline and many other improvements (optimized branch prediction, increased buffers, enhanced decoders) have increased the performance per clock by about 50 percent. At the same time, however, the Hyper-Threading feature of the previous generation has been removed. Other major changes are the support for new instruction set extensions such as SSE 4.1 and 4.2 as well as AES-NI (depending on the model).
Performance
Thanks to 4 CPU cores and a clock speed of 1.46 - 2.39 GHz, the Z3775 is significantly faster than previous Intel Atoms, e.g. the Z2760. The Z3775 even beats some of the Kabini APUs like the AMD A4-5000, as well as ARM SoCs like Tegra 4 and the Snapdragon 800. For everyday tasks such as Internet or Office the performance is adequate, but not for very complex software or modern games.
Graphics
The HD Graphics (Bay Trail) is based on the Intel Gen7 architecture, which supports DirectX 11 and is also found in the Ivy Bridge series (e.g. HD Graphics 4000). With only 4 EUs (Execution Units) and a relatively low clock speed of up to 778 MHz, the GPU is even slower than the HD Graphics (Ivy Bridge) and comparable to the Qualcomm Adreno 320 (as found in the Snapdragon 600). Therefore, only older and less demanding Windows games will run fluently. However, video acceleration and display resolutions up to 2560 x 1600 pixels are no problem for the chip.
Power Consumption
The entire SoC is rated at an SDP of 2 watts, which indicates a TDP of less than 4 watts. Thus, the chip can be used in passively cooled tablets.
Intel Pentium N3530
► remove from comparison
The Intel Pentium N3530 is a power efficient quad-core SoC for entry-level notebooks. It is clocked at 2.16 GHz base clock and can boost up to 2.58 GHz (Burst clock speed). The Pentium is part of the Bay Trail-M platform. Thanks to the specially optimized 22 nanometer low-power process (P1271) with tri-gate transistors, performance and energy efficiency have been significantly improved compared to previous Intel Atom CPUs.
Architecture
The processor cores are based on the new Silvermont architecture, which is an out-of-order design for the first time. The increased utilization of the pipeline and many other improvements (optimized branch prediction, increased buffers, enhanced decoders) have increased the performance per clock by about 50 percent. At the same time, however, the Hyper-Threading feature of the previous generation has been removed. Other major changes are the support for new instruction set extensions such as SSE 4.1 and 4.2 as well as AES-NI (depending on the model).
Performance
Thanks to 4 CPU cores and a clock speed of up to 2.6 GHz, the Pentium N3530 is significantly faster than previous Intel Atoms, e.g. the N2800. According to our benchmark tests, the performance is somewhere between the AMD Kabini APUs A4-5100 and A6-5200. For everyday tasks such as Internet or Office the N3530 is adequate, but not for very complex software or modern games.
Graphics
The HD Graphics (Bay Trail) is based on the Intel Gen7 architecture, which supports DirectX 11 and is also found in the Ivy Bridge series (e.g. HD Graphics 4000). With only 4 EUs (Execution Units) and a relatively low clock speed of 313 - 896 MHz, the GPU is even slower than the HD Graphics (Ivy Bridge). Therefore, only older and less demanding games will run fluently. Compared to the HD Graphics in the slower Pentium N3510 and N3520, the N3530 is clocked slightly faster (750/854 MHz vs. 896 MHz).
Power Consumption
The entire SoC is rated at a TDP of 7.5 Watts (4.5 SDP - Scenario Design Power). Thus, the chip can be used in compact subnotebooks and convertibles.
| Model | Intel Atom x5-Z8500 | Intel Atom Z3775 | Intel Pentium N3530 | ||||||||||||||||||||||||||||||||||||||||||||||||||||||||||||||||||||||||||||||||||||||||||||||||||||||||||||
| Series | Intel Atom x5 | Intel Atom | Intel Pentium | ||||||||||||||||||||||||||||||||||||||||||||||||||||||||||||||||||||||||||||||||||||||||||||||||||||||||||||
| Codename | Cherry Trail | Bay Trail-T | Bay Trail-M | ||||||||||||||||||||||||||||||||||||||||||||||||||||||||||||||||||||||||||||||||||||||||||||||||||||||||||||
| Series: Pentium Bay Trail-M |
|
|
| ||||||||||||||||||||||||||||||||||||||||||||||||||||||||||||||||||||||||||||||||||||||||||||||||||||||||||||
| Clock | 1440 - 2240 MHz | 1460 - 2390 MHz | 2160 - 2580 MHz | ||||||||||||||||||||||||||||||||||||||||||||||||||||||||||||||||||||||||||||||||||||||||||||||||||||||||||||
| L2 Cache | 2 MB | 2 MB | 2 MB | ||||||||||||||||||||||||||||||||||||||||||||||||||||||||||||||||||||||||||||||||||||||||||||||||||||||||||||
| Cores / Threads | 4 / 4 | 4 / 4 | 4 / 4 | ||||||||||||||||||||||||||||||||||||||||||||||||||||||||||||||||||||||||||||||||||||||||||||||||||||||||||||
| Technology | 14 nm | 22 nm | 22 nm | ||||||||||||||||||||||||||||||||||||||||||||||||||||||||||||||||||||||||||||||||||||||||||||||||||||||||||||
| max. Temp. | 90 °C | 100 °C | |||||||||||||||||||||||||||||||||||||||||||||||||||||||||||||||||||||||||||||||||||||||||||||||||||||||||||||
| Features | Intel HD Graphics (Cherry Trail, 200 - 600 MHz), Wireless Display, AES-NI, max. 8 GB Dual-Channel LPDDR3-1600 (25,6 GB/s), 3x USB 3.0, 2x PCIe 2.0 | Intel HD Graphics (Bay Trail, 311 - 778 MHz), Quick Sync, Wireless Display, Clear Video HD, Intel 64, SSE 4.1, SSE 4.2, AES-NI, Secure Key, Anti-Theft, Identify-Protection, max. 4 GB Dual-Channel LPDDR3-1067 | Intel HD Graphics (Bay Trail, 313 - 896 MHz), Intel 64, SSE 4.1, SSE 4.2, Quick Sync, Wireless Display | ||||||||||||||||||||||||||||||||||||||||||||||||||||||||||||||||||||||||||||||||||||||||||||||||||||||||||||
| iGPU | Intel HD Graphics (Cherry Trail) (200 - 600 MHz) | Intel HD Graphics (Bay Trail) (311 - 778 MHz) | Intel HD Graphics (Bay Trail) (313 - 896 MHz) | ||||||||||||||||||||||||||||||||||||||||||||||||||||||||||||||||||||||||||||||||||||||||||||||||||||||||||||
| Architecture | x86 | x86 | x86 | ||||||||||||||||||||||||||||||||||||||||||||||||||||||||||||||||||||||||||||||||||||||||||||||||||||||||||||
| Announced | |||||||||||||||||||||||||||||||||||||||||||||||||||||||||||||||||||||||||||||||||||||||||||||||||||||||||||||||
| Manufacturer | ark.intel.com | ark.intel.com | ark.intel.com | ||||||||||||||||||||||||||||||||||||||||||||||||||||||||||||||||||||||||||||||||||||||||||||||||||||||||||||
| L1 Cache | 224 KB | 224 KB | |||||||||||||||||||||||||||||||||||||||||||||||||||||||||||||||||||||||||||||||||||||||||||||||||||||||||||||
| TDP | <4 Watt | 7.5 Watt | |||||||||||||||||||||||||||||||||||||||||||||||||||||||||||||||||||||||||||||||||||||||||||||||||||||||||||||
| Socket | UTFCBGA1380 | FCBGA1170 | |||||||||||||||||||||||||||||||||||||||||||||||||||||||||||||||||||||||||||||||||||||||||||||||||||||||||||||
| $35 U.S. |

