Western Digital WD_BLACK SN850 WDS100T1X0E vs Gigabyte AG4512G-SI B10
Western Digital WD_BLACK SN850 WDS100T1X0E
► remove from comparison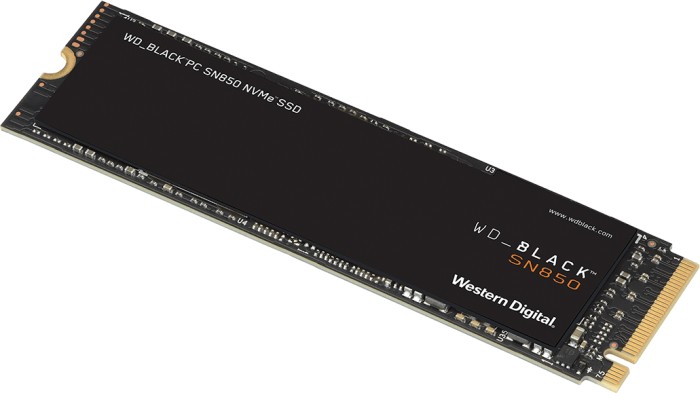
The Western Digital WD_BLACK SN850 NVMe SSD 1TB (WDS100T1X0E) is a fast M.2 2280 solid state disk. It uses the WD Black G2 controller and 1GB DDR4-2666 Cache. It is specified at 7000MB/s read and 5300MB/s write (SLC cached). The TBW is specified at 600 TB and WD offers 5 years limited warranty. As memory modules, WD uses 3D-NAND TLC from Toshiba/WD with 96 layers.
Gigabyte AG4512G-SI B10
► remove from comparison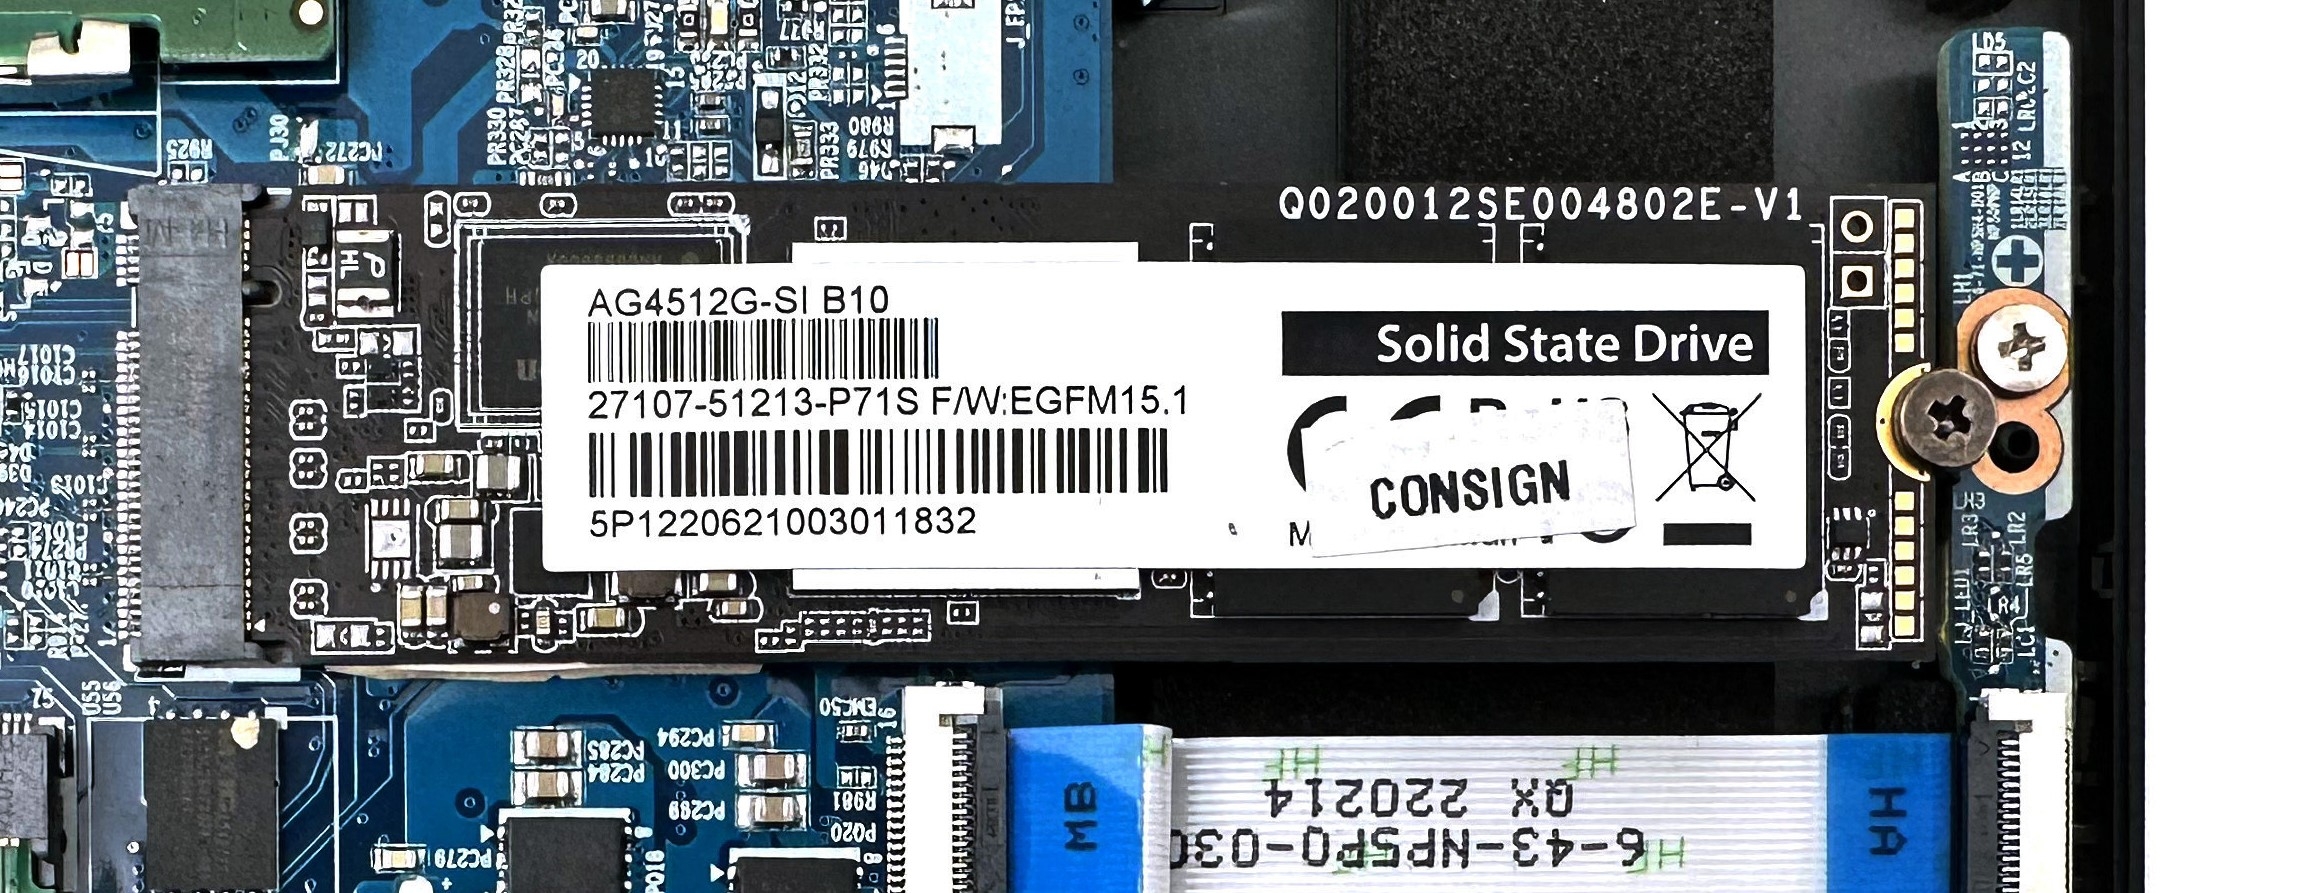
The Gigabyte AG4512G-SI B10 is a fast high end PCIe Gen4 NVMe SSD. It is used in fast gaming laptops and uses the M.2 2280 format.
| Western Digital WD_BLACK SN850 WDS100T1X0E | Gigabyte AG4512G-SI B10 | |
| Type | SSD | SSD |
| Size | M.2 2280 | |
| Capacity | 1024 GB | 512 GB |
| Interface | NVMe | NVMe |
| Announced | 22.07.2021 | 08.04.2022 |
Benchmarks
Performance Rating - DiskSpd - WDS100T1X0E
49.6 pt (56%)
Seagate ST1000LM014 Solid State Hybrid Drive
...
Corsair MP600 GS
Samsung 9100 Pro 2 TB
Western Digital WD_BLACK SN850 WDS100T1X0E
Sabrent Rocket 4.0 Plus 2TB
Kingston KC3000 2048G SKC3000D2048G
...
Kingston Fury Renegade G5 4TB
0%
100%
Performance Rating - DiskSpd - AG4512G-SI B10
36.3 pt (41%)
Seagate ST1000LM014 Solid State Hybrid Drive
...
1x Samsung PM9E1 MZVLC2T0HBLD-00BT7 + 2x Samsung PM9A1 MZVL22T0HDLB-00BT7 (RAID 0)
Kingston OM8PGP41024N-A0
Phison EM2804TBMTCB47
SK Hynix HFS002TEJ9X162N
Gigabyte AG4512G-SI B10
Lexar NM790 2TB
Western Digital SN740 SDDPTQE-2T00
...
Kingston Fury Renegade G5 4TB
0%
100%
78%
AG4512G-SI B10 +1461 MB/s (24%)
87%
AG4512G-SI B10 +828 MB/s (31%)
56%
AG4512G-SI B10 +1077 MB/s (4%)
78%
AG4512G-SI B10 +5541 Points (34%)
85%
AG4512G-SI B10 +2388 Points (33%)
74%
AG4512G-SI B10 +2128 Points (34%)
338%
AG4512G-SI B10 +0 ms (0%)
48%
AG4512G-SI B10 +0.1 ms (0%)
91%
AG4512G-SI B10 +1865 MB/s (32%)
75%
AG4512G-SI B10 +1676 MB/s (33%)
122%
AG4512G-SI B10 +312.1 MB/s (61%)
102%
AG4512G-SI B10 +82.5 MB/s (26%)
43%
AG4512G-SI B10 +2106 MB/s (19%)
66%
AG4512G-SI B10 +3698 MB/s (29%)
101%
AG4512G-SI B10 +303.3 MB/s (27%)
73%
AG4512G-SI B10 +64.3 MB/s (2%)
43%
AG4512G-SI B10 +2258 MB/s (12%)
60%
AG4512G-SI B10 +2561 MB/s (27%)
73%
AG4512G-SI B10 +621 MB/s (13%)
96%
AG4512G-SI B10 +866 MB/s (13%)
44%
AG4512G-SI B10 +2264 MB/s (15%)
68%
AG4512G-SI B10 +4717 MB/s (25%)
119%
AG4512G-SI B10 +369 MB/s (85%)
71%
AG4512G-SI B10 +62.6 MB/s (18%)
99%
AG4512G-SI B10 +2234 MB/s (33%)
45%
AG4512G-SI B10 +1323 MB/s (16%)
45%
AG4512G-SI B10 +2230 MB/s (22%)
55%
AG4512G-SI B10 +2390 MB/s (25%)
44%
AG4512G-SI B10 +2255 MB/s (15%)
68%
AG4512G-SI B10 +4725 MB/s (29%)
33%
AG4512G-SI B10 +2113 MB/s (13%)
- Range of benchmark values for this graphics card
 - Average benchmark values for this graphics card
* Smaller numbers mean a higher performance
* Smaller numbers mean a higher performance
Average Benchmarks
Western Digital WD_BLACK SN850 WDS100T1X0E → 100% n=31
Gigabyte AG4512G-SI B10 → 80% n=31
Average of the median scores above. 1 ... This benchmark is not used for the average calculation
- $222.51WD_BLACK SN850X 1TB NVMe SSD - M.2 2280, Up to 7,300 MB/s Read speeds, Up to 6,300 MB/s write speeds, Gaming Expansion, High Performance Internal Solid State Drive - WDS100T2X0E
- $295.00WD_BLACK 1TB SN850 NVMe Internal Gaming SSD Solid State Drive - Gen4 PCIe, M.2 2280, 3D NAND, Up to 7,000 MB/s - WDS100T1X0E
- $314.99Western Digital WD Black SN850 2TB NVMe PCIe 4.0 M.2 Internal Gaming SSD with Heatsink
- $223.47Western Digital 1TB SN850 NVMe SSD for PS5 Consoles Solid State Drive with Heatsink - Gen4 PCIe, M.2 2280, Up to 7,000 MB/s - WDBBKW0010BBK-WRSN
- $389.00Western Digital 2TB SN850 NVMe SSD for PS5 Consoles Solid State Drive with Heatsink - Gen4 PCIe, M.2 2280, Up to 7,000 MB/s - WDBBKW0020BBK-WRSN
v1.35