Notebookcheck Logo

Qualcomm Snapdragon 732G vs Mediatek Helio G99

Qualcomm Snapdragon 732G

► remove from comparison Qualcomm SD 732G

The Qualcomm Snapdragon 732G (SD732G Mobile Platform) is a fast mid-range ARM-based SoC largely found on Android tablets and smartphones. It integrates eight cores (octa-core) divided into two clusters. A fast performance cluster contains two ARM Cortex-A76 cores clocked at up to 2.3 GHz and a power efficiency cluster with six small ARM Cortex-A55 cores at up to 1.8 GHz. Depending on the workload only single clusters or all cores can run at different clock speeds. Compared to the 730G, the 732G offers a 100 MHz higher A76 CPU clock.

Compared to the normal Snapdragon 730, the 732G is optimized for gaming. This means the graphics card is higher clocked (also compared to the 730G, Qualcomm stateds 15% more performance) and the chip also offers optimized WiFi. The GPU also supports higher resolutions. Furthermore, the SoC is able to record videos in 720p with up to 960 fps.

The chip includes a range of other features like a fast X15 LTE radio (800 Mbits Cat 15 download, 150 Mbps Cat 13 upload), one of the first Wi-Fi 6 wireless radios (802.11ax), satellite positioning (GPS, QZSS, GLONASS, SBAS, Beidou, Galileo), USB-C 3.1, Spectra 350 ISP, Hexagon 688 DSP, H.265 4K30 video en- and decode, an LPDDR4X-3733 dual-channel memory controller and a Adreno 618 Grafikkarte.

The Snapdragon 732G is manufactured in the modern 8 nm process at Samsung.

Mediatek Helio G99

► remove from comparison Mediatek Helio G99

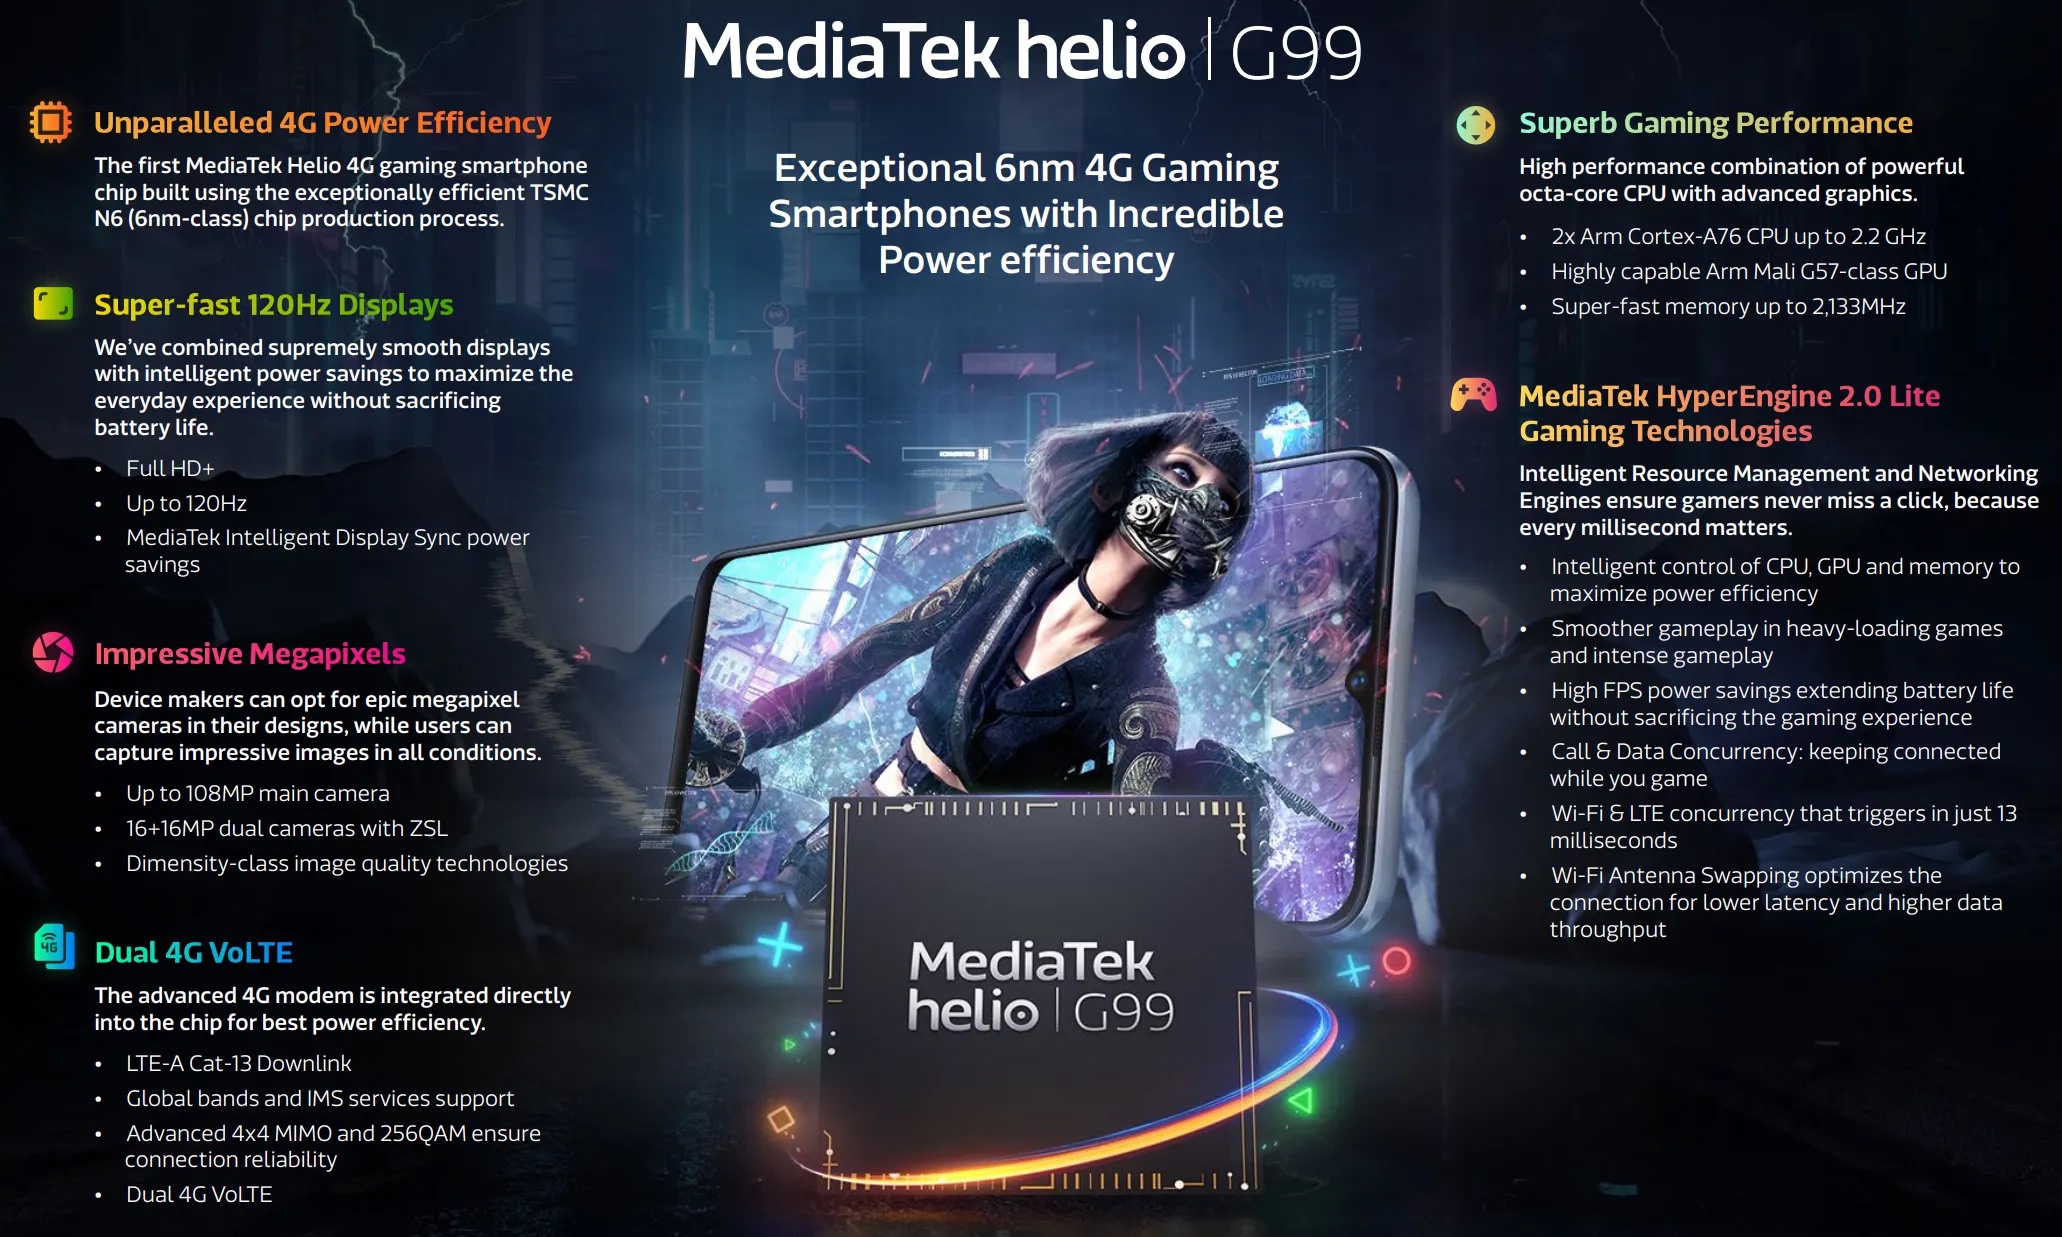
The Mediatek Helio G99 is a mainstream ARM SoC for smartphones (mainly Android based) that was introduced in 2022. It is manufactured in a 6 nm FinFET process and is equipped with 2x big ARM Cortex-A76 cores with up to 2.2 GHz and 6x small and power efficient ARM Cortex-A55 cores (max. 2 GHz) in two clusters (bigLITTLE). The chip integrates an ARM Mali-G57 MC2 (two cores). Compared to the older Helio G96, the G99 is manufactured in the more recent 6nm process and clocks higher.

Furthermore, the integrated LTE / 4G modem supports Cat-13 download speeds. Wi-Fi 5 is also integrated (a/b/g/n/ac). The memory controller supportsLPDDR4x with up to 4,266 Mbps.

ModelQualcomm Snapdragon 732GMediatek Helio G99
CodenameKryo 470 Gold / SilverCortex-A76 / A55
SeriesQualcomm SnapdragonMediatek Mediatek Helio G
Series: Mediatek Helio G Cortex-A76 / A55
Qualcomm Snapdragon 732G « 2.3 GHz8 / 8 cores Kryo 470 Gold / Silver
Qualcomm Snapdragon 730G compare2.2 GHz8 / 8 cores Kryo 470 Gold / Silver
Qualcomm Snapdragon 730 compare2.2 GHz8 / 8 cores Kryo 470 Gold / Silver
Mediatek Helio G100 compare2 - 2.2 GHz8 / 8 cores Cortex-A76 / A55
Mediatek Helio G99 « 2 - 2.2 GHz8 / 8 cores Cortex-A76 / A55
Mediatek Helio G96 compare2 - 2.05 GHz8 / 8 cores Cortex-A76 / A55
Mediatek Helio G95 compare2 - 2.05 GHz8 / 8 cores Cortex-A76 / A55
Mediatek Helio G90T compare2.05 GHz8 / 8 cores Cortex-A76 / A55
Clock2300 MHz2000 - 2200 MHz
Cores / Threads8 / 88 / 8
2 x 2.2 GHz ARM Cortex-A76
6 x 2.0 GHz ARM Cortex-A55
Technology8 nm6 nm
FeaturesAdreno 618 GPU, X15 LTE Modem, Hexagon 688 DSP, Specra ISP2x Cortex-A76, 6x Cortex-A55, 4G LTE Cat-12/13, 64MP AI-Camera support, LPDDR3/LPDDR4x-2133, eMMC 5.1, UFS 2.1, Beidou, Galileo, Glonass, GPS, Wi-Fi 5 (a/b/g/n/ac), AI Accelerator up to 1 TMACs, H.264 / H.265 / HEVC video encoding (4k30)
iGPUQualcomm Adreno 618ARM Mali-G57 MP2
ArchitectureARMARM
Announced
Manufacturerwww.qualcomm.comwww.mediatek.com

Benchmarks

Performance Rating - Geekbench 5.5, PCM Work, Sling Shot Physics, Antutu v8 CPU - SD 732G
0.6 pt (49%)
Restrict / Search: Model: Max. age: years
3DMark - 3DMark Ice Storm Unlimited Physics
100%
1 SD 732G +
20797 Points (17%)
3DMark - 3DMark Sling Shot Extreme (ES 3.1) Unlimited Physics
min: 3311     avg: 3383     median: 3400 (32%)     max: 3438 Points
3DMark - 3DMark Sling Shot (ES 3.0) Unlimited Physics
min: 3125     avg: 3307     median: 3372 (39%)     max: 3425 Points
min: 3438     avg: 3596     median: 3630.5 (41%)     max: 3685 Points
Geekbench 6.0 - Geekbench 6.0 Single-Core
min: 714     avg: 717     median: 717 (23%)     max: 720 Points
Geekbench 6.0 - Geekbench 6.0 Multi-Core
min: 1916     avg: 1941     median: 1940.5 (8%)     max: 1965 Points
Geekbench 5.5 - Geekbench 5.1 - 5.5 64 Bit Single-Core
min: 563     avg: 565     median: 565 (22%)     max: 567 Points
Geekbench 5.5 - Geekbench 5.1 - 5.5 64 Bit Multi-Core
min: 1728     avg: 1769     median: 1787 (3%)     max: 1792 Points
Geekbench 5.0 - Geekbench 5.0 64 Bit Single-Core
555 Points (2%)
Geekbench 5.0 - Geekbench 5.0 64 Bit Multi-Core
1921 Points (6%)
Geekbench 4.4 - Geekbench 4.1 - 4.4 64 Bit Single-Core
min: 2594     avg: 2616     median: 2616 (26%)     max: 2638 Points
min: 2512     avg: 2620     median: 2672 (27%)     max: 2675 Points
Geekbench 4.4 - Geekbench 4.1 - 4.4 64 Bit Multi-Core
min: 6943     avg: 7037     median: 7036.5 (7%)     max: 7130 Points
min: 7018     avg: 7608     median: 7896 (8%)     max: 7911 Points
Geekbench 4.0 - Geekbench 4.0 64 Bit Single-Core
2625 Points (29%)
Geekbench 4.0 - Geekbench 4.0 64 Bit Multi-Core
min: 7492     avg: 7532     median: 7531.5 (10%)     max: 7571 Points
Geekbench 3 - Geekbench 3 64 Bit Multi-Core
min: 7124     avg: 7934     median: 7933.5 (12%)     max: 8743 Points
Geekbench 3 - Geekbench 3 64 Bit Single-Core
min: 2334     avg: 2555     median: 2555 (38%)     max: 2776 Points
Geekbench 2 - 32 Bit - Geekbench Stream
100%
1 SD 732G +
3256 Points (17%)
Geekbench 2 - 32 Bit - Geekbench Memory
100%
1 SD 732G +
3075 Points (21%)
Geekbench 2 - 32 Bit - Geekbench Floating Point
100%
1 SD 732G +
11323 Points (22%)
Geekbench 2 - 32 Bit - Geekbench Integer
100%
1 SD 732G +
5344 Points (11%)
Geekbench 2 - 32 Bit - Geekbench Total Score
100%
1 SD 732G +
6709 Points (18%)
Mozilla Kraken 1.1 - Kraken 1.1 Total Score *
min: 2673     avg: 2753     median: 2752.5 (3%)     max: 2832 ms
min: 1628.6     avg: 2004     median: 1971 (2%)     max: 2443.7 ms
Sunspider - Sunspider 1.0 Total Score *
100%
1 SD 732G +
430 ms (5%)
Octane V2 - Octane V2 Total Score
min: 17293     avg: 17503     median: 17398 (13%)     max: 17817 Points
min: 17228     avg: 21975     median: 22187 (16%)     max: 26476 Points
WebXPRT 4 - WebXPRT 4 Score
min: 39     avg: 73.1     median: 81 (22%)     max: 89 Points
WebXPRT 3 - WebXPRT 3 Score
min: 71     avg: 72     median: 72 (13%)     max: 73 Points
min: 80     avg: 95.4     median: 93.5 (17%)     max: 112 Points
AnTuTu v8 - AnTuTu v8 UX
100%
1 SD 732G +
min: 52391     avg: 57447     median: 58484 (49%)     max: 61466 Points
AnTuTu v8 - AnTuTu v8 MEM
100%
1 SD 732G +
min: 47239     avg: 51901     median: 53784 (43%)     max: 54681 Points
AnTuTu v8 - AnTuTu v8 GPU
100%
1 SD 732G +
min: 77705     avg: 78197     median: 78399 (14%)     max: 78488 Points
AnTuTu v8 - AnTuTu v8 CPU
100%
1 SD 732G +
min: 96656     avg: 99057     median: 99495 (36%)     max: 101019 Points
AnTuTu v8 - AnTuTu v8 Total Score
100%
1 SD 732G +
min: 279048     avg: 286602     median: 288309 (28%)     max: 292450 Points
Antutu v9 - AnTuTu v9 Total Score
min: 345356     avg: 350034     median: 352259 (17%)     max: 352487 Points
Antutu v9 - AnTuTu v9 CPU
min: 103924     avg: 104930     median: 104215 (26%)     max: 106650 Points
Antutu v10 - AnTuTu v10 Total Score
min: 383511     avg: 405846     median: 403256 (13%)     max: 422936 Points
Antutu v10 - AnTuTu v10 CPU
min: 120432     avg: 130531     median: 129105 (4%)     max: 139789 Points
PCMark for Android - PCM f. Android Storage 2.0 score
min: 13093     avg: 13127     median: 13127 (6%)     max: 13161 Points
min: 14042     avg: 22881     median: 26431 (12%)     max: 28259 Points
PCMark for Android - PCM f. Android Work Score 3.0
min: 8793     avg: 8796     median: 8796 (32%)     max: 8799 Points
PCMark for Android - PCM f. Android Computer Vision
100%
1 SD 732G +
min: 4177     avg: 4250     median: 4249.5 (22%)     max: 4322 Points
PCMark for Android - PCM f. Android Storage
100%
1 SD 732G +
min: 14235     avg: 14278     median: 14278 (31%)     max: 14321 Points
PCMark for Android - PCM f. Android Work Score 2.0
100%
1 SD 732G +
min: 8064     avg: 8284     median: 8101 (53%)     max: 8688 Points
PCMark for Android - PCM f. Android Work Score
100%
1 SD 732G +
min: 8543     avg: 8658     median: 8658 (43%)     max: 8773 Points
PCMark for Android - PCM f. Android Storage 2.0 random write internal
min: 30.8     avg: 56     median: 63.7 (43%)     max: 71.8 MB/s
PCMark for Android - PCM f. Android Storage 2.0 seq write internal
min: 184.1     avg: 571     median: 681 (19%)     max: 830 MB/s
PCMark for Android - PCM f. Android Storage 2.0 random read internal
min: 17.6     avg: 33.8     median: 40.4 (20%)     max: 45.4 MB/s
PCMark for Android - PCM f. Android Storage 2.0 seq read internal
min: 719.36     avg: 789     median: 796 (20%)     max: 858 MB/s
CrossMark - CrossMark Overall
445 Points (17%)
Power Consumption - Geekbench 5.5 Power Consumption 150cd *
100%
1 SD 732G +
3.8 Watt (2%)
Power Consumption - Idle Power Consumption 150cd 1min *
100%
1 SD 732G +
1.2 Watt (1%)

Average Benchmarks Qualcomm Snapdragon 732G → 100% n=14

Average Benchmarks Mediatek Helio G99 → 118% n=14

- Range of benchmark values for this graphics card
red legend - Average benchmark values for this graphics card
* Smaller numbers mean a higher performance
1 This benchmark is not used for the average calculation

Add one or more devices and compare

In the following list you can select (and also search for) devices that should be added to the comparison. You can select more than one device.

restrict list:
v1.33
log 15. 03:37:35

#0 ran 0s before starting gpusingle class +0s ... 0s

#1 checking url part for id 12763 +0s ... 0s

#2 checking url part for id 14649 +0s ... 0s

#3 redirected to Ajax server, took 1757900254s time from redirect:0 +0s ... 0s

#4 did not recreate cache, as it is less than 5 days old! Created at Sat, 13 Sep 2025 14:08:46 +0200 +0s ... 0s

#5 composed specs +0.004s ... 0.004s

#6 did output specs +0s ... 0.004s

#7 getting avg benchmarks for device 12763 +0.003s ... 0.007s

#8 got single benchmarks 12763 +0.006s ... 0.013s

#9 getting avg benchmarks for device 14649 +0s ... 0.014s

#10 got single benchmarks 14649 +0.016s ... 0.03s

#11 got avg benchmarks for devices +0s ... 0.03s

#12 min, max, avg, median took s +0.023s ... 0.053s

#13 return log +0.001s ... 0.054s

Please share our article, every link counts!
Mail Logo
> Expert Reviews and News on Laptops, Smartphones and Tech Innovations > Benchmarks / Tech > Processor Comparison - Head 2 Head
Redaktion, 2017-09- 8 (Update: 2023-07- 1)