Notebookcheck Logo

Qualcomm Snapdragon 690 5G vs Qualcomm Snapdragon 662

Qualcomm Snapdragon 690 5G

► remove from comparison Qualcomm SD 690 5G

The Qualcomm Snapdragon 690 5G (SD690) is a fast mid-range ARM-based SoC largely found on Android tablets and smartphones. It features 8 Kryo 560 called cores (64-Bit capable) that are divided in two clusters. A fast cluster of two cores with up to 2 GHz and  based on the ARM Cortex-A77 design. And a power saving efficiency cluster with up to 1.7 GHz and based on much smaller ARM Cortex-A55 cores. Both clusters can also used together.

In addition to the 8 CPU cores, the SoC integrates a lower mid range Adreno 619L GPU, a X51 5G radio (up to 2.5 Gbits download, no mmWave), a 802.11ax (Wi-Fi 6, 8x8 sounding, WPA3, Dual Band, 2x2), a Bluetooth 5.1 radio, satellite positioning (GPS, QZSS, GLONASS, SBAS, Beidou and Galileo) and a video engine (support for H.265, H.264, VP8 and VP9).

Performance

Due to the two big A77 cores, the performance of the SoC in our benchmarks is on par with mid range SoCs like the Snapdragon 765 or the Dimensity 800U.

The Snapdragon 690 is produced in the 8nm LPP (Low Power Plus) process at Samsung.

Qualcomm Snapdragon 662

► remove from comparison Qualcomm SD 662

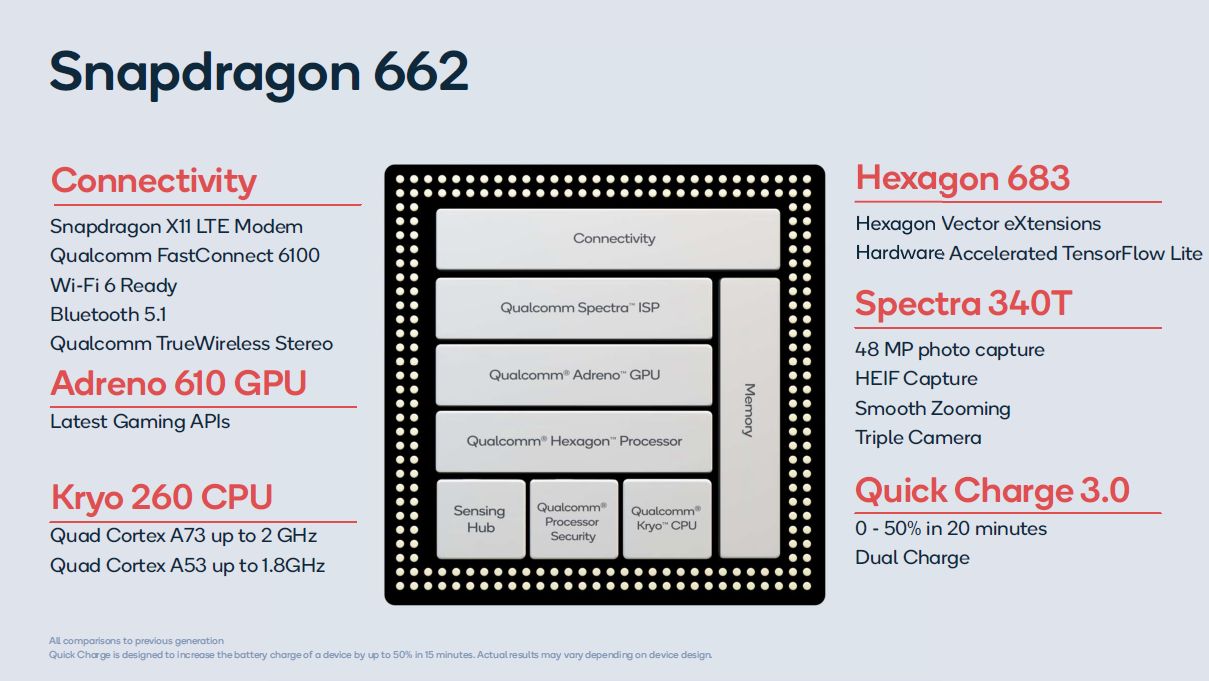
The Qualcomm Snapdragon 662 is a lower mid-range ARM-based SoC largely found in Android tablets and smartphones. It features 8 Kryo 260 cores (custom design, 64-Bit capable) that are divided in two clusters. A fast cluster of four cores with up to 2 GHz (Kryo 260 Gold - Cortex-A73 derivate) and a power saving efficiency cluster with up to 1.8 GHz (Kryo 260 Silver - Cortex A53 derivate). Both clusters can also be used together.

In addition to the 8 CPU cores, the SoC integrates a mid range Adreno 610 GPU with a LPDDR4 memory controller (dual-channel)  and supports Wi-Fi (802.11ac + MIMO, max. 867 Mbps), Bluetooth 5, and LTE (X12 LTE modem with up to 600 Mbps download and 150 Mbps upload).

Power Consumption

Thanks to the new 11 nm LPP process, the energy efficiency should be quite good.

ModelQualcomm Snapdragon 690 5GQualcomm Snapdragon 662
SeriesQualcomm SnapdragonQualcomm Snapdragon
CodenameKryo 560 Gold (Cortex-A77) / Silver (Cortex-A55)Kryo 260
Clock1700 - 2000 MHz1800 - 2000 MHz
Cores / Threads8 / 88 / 8
Technology8 nm11 nm
FeaturesAdreno 619L GPU, X51 5G Modem, Hexagon 692 DSP, Spectra 355L ISPAdreno 610 GPU, X11 LTE Modem, Hexagon 683 DSP, Specra 340T ISP
iGPUQualcomm Adreno 619LQualcomm Adreno 610
ArchitectureARMARM
Announced
Manufacturerwww.qualcomm.comwww.qualcomm.com
Series: Snapdragon Kryo 260
Qualcomm Snapdragon 665 compare2.2 GHz8 / 8 cores Kryo 260
Qualcomm Snapdragon 662 « 1.8 - 2 GHz8 / 8 cores Kryo 260
Qualcomm Snapdragon 660 compare2.2 GHz8 / 8 cores Kryo 260
Qualcomm Snapdragon 636 compare1.8 GHz8 / 8 cores Kryo 260

Benchmarks

Performance Rating - Geekbench 5.5, PCM Work, Sling Shot Physics, Antutu v8 CPU - SD 690 5G
0.6 pt (49%)
Performance Rating - Geekbench 5.5, PCM Work, Sling Shot Physics, Antutu v8 CPU - SD 662
0.5 pt (36%)
3DMark - 3DMark Ice Storm Unlimited Physics
19976 Points (17%)
min: 18647     avg: 19225     median: 19223.5 (16%)     max: 19804 Points
3DMark - 3DMark Sling Shot Extreme (ES 3.1) Unlimited Physics
min: 3344     avg: 3359     median: 3359 (40%)     max: 3374 Points
3DMark - 3DMark Sling Shot (ES 3.0) Unlimited Physics
min: 2593     avg: 3289     median: 3288.5 (38%)     max: 3984 Points
Geekbench 6.2 - Geekbench 6.2 Single-Core
100%
1 SD 662 +
min: 330     avg: 331.5     median: 331.5 (9%)     max: 333 Points
Geekbench 6.2 - Geekbench 6.2 Multi-Core
100%
1 SD 662 +
min: 1111     avg: 1129     median: 1129 (4%)     max: 1147 Points
Geekbench 5.5 - Geekbench 5.1 - 5.4 64 Bit Single-Core
min: 590     avg: 600     median: 600 (25%)     max: 610 Points
Geekbench 5.5 - Geekbench 5.1 - 5.4 64 Bit Multi-Core
min: 1716     avg: 1795     median: 1794.5 (3%)     max: 1873 Points
Geekbench 4.4 - Geekbench 4.1 - 4.4 64 Bit Single-Core
min: 2662     avg: 2740     median: 2739.5 (27%)     max: 2817 Points
1472 Points (15%)
Geekbench 4.4 - Geekbench 4.1 - 4.4 64 Bit Multi-Core
min: 6273     avg: 6837     median: 6837 (8%)     max: 7401 Points
4938 Points (5%)
Geekbench 4.0 - Geekbench 4.0 64 Bit Single-Core
2648 Points (36%)
Geekbench 4.0 - Geekbench 4.0 64 Bit Multi-Core
6274 Points (15%)
Geekbench 3 - Geekbench 3 64 Bit Multi-Core
5921 Points (9%)
Geekbench 3 - Geekbench 3 64 Bit Single-Core
2265 Points (34%)
Geekbench 2 - 32 Bit - Geekbench Stream
2479 Points (20%)
Geekbench 2 - 32 Bit - Geekbench Memory
4352 Points (39%)
Geekbench 2 - 32 Bit - Geekbench Floating Point
11863 Points (23%)
Geekbench 2 - 32 Bit - Geekbench Integer
5836 Points (12%)
Geekbench 2 - 32 Bit - Geekbench Total Score
7298 Points (19%)
Mozilla Kraken 1.1 - Kraken 1.1 Total Score *
min: 2506     avg: 7349     median: 7349 (9%)     max: 12192 ms
min: 3779     avg: 4379     median: 4502 (5%)     max: 4650 ms
Sunspider - Sunspider 1.0 Total Score *
481.5 ms (5%)
Octane V2 - Octane V2 Total Score
min: 4395     avg: 10631     median: 10630.5 (10%)     max: 16866 Points
min: 8893     avg: 9495     median: 9485.5 (9%)     max: 10247 Points
WebXPRT 3 - WebXPRT 3 Score
min: 29     avg: 51.5     median: 51.5 (11%)     max: 74 Points
min: 51     avg: 53.2     median: 52 (11%)     max: 59 Points
AnTuTu v8 - AnTuTu v8 UX
min: 55299     avg: 57173     median: 57172.5 (48%)     max: 59046 Points
AnTuTu v8 - AnTuTu v8 MEM
min: 58041     avg: 61739     median: 61739 (50%)     max: 65437 Points
AnTuTu v8 - AnTuTu v8 GPU
min: 61533     avg: 61812     median: 61811.5 (11%)     max: 62090 Points
AnTuTu v8 - AnTuTu v8 CPU
min: 105940     avg: 106448     median: 106448 (39%)     max: 106955 Points
AnTuTu v8 - AnTuTu v8 Total Score
min: 282385     avg: 287171     median: 287170 (28%)     max: 291956 Points
min: 167471     avg: 177411     median: 177145 (17%)     max: 185542 Points
Antutu v9 - AnTuTu v9 Total Score
344070 Points (21%)
min: 194505     avg: 200601     median: 198172 (12%)     max: 211557 Points
Antutu v9 - AnTuTu v9 CPU
103794 Points (28%)
min: 64163     avg: 66339     median: 66230 (18%)     max: 68731 Points
PassMark PerformanceTest Mobile V1 - PerformanceTest Mobile V1 CPU Tests
515836 Points (68%)
16222 Points (2%)
PCMark for Android - PCM f. Android Storage 2.0 score
15297 Points (24%)
min: 10366     avg: 11330     median: 10740 (17%)     max: 12884 Points
PCMark for Android - PCM f. Android Work Score 3.0
8273 Points (38%)
min: 3195     avg: 5608     median: 5689.5 (26%)     max: 7554 Points
PCMark for Android - PCM f. Android Storage
4356 Points (9%)
min: 8075     avg: 8811     median: 8076 (17%)     max: 10283 Points
PCMark for Android - PCM f. Android Work Score 2.0
min: 7356     avg: 7689     median: 7688.5 (50%)     max: 8021 Points
PCMark for Android - PCM f. Android Work Score
10321 Points (52%)
PCMark for Android - PCM f. Android Storage 2.0 random write internal
100%
1 SD 662 +
min: 21.7     avg: 22.3     median: 22.3 (16%)     max: 22.9 MB/s
PCMark for Android - PCM f. Android Storage 2.0 seq write internal
100%
1 SD 662 +
min: 111.1     avg: 112.5     median: 112.5 (3%)     max: 113.8 MB/s
PCMark for Android - PCM f. Android Storage 2.0 random read internal
100%
1 SD 662 +
min: 15.3     avg: 15.5     median: 15.5 (19%)     max: 15.6 MB/s
PCMark for Android - PCM f. Android Storage 2.0 seq read internal
100%
1 SD 662 +
min: 403     avg: 414.5     median: 414.5 (12%)     max: 426 MB/s
PCMark for Android - PCM f. Android Computer Vision
100%
1 SD 662 +
min: 3090     avg: 3167     median: 3201 (17%)     max: 3211 Points
CrossMark - CrossMark Overall
100%
1 SD 662 +
328 Points (13%)
Power Consumption - Geekbench 5.5 Power Consumption 150cd *
3.1 Watt (1%)
100%
1 SD 662 +
min: 3.34     avg: 3.6     median: 3.6 (2%)     max: 3.83 Watt
Power Consumption - Idle Power Consumption 150cd 1min *
0.6 Watt (1%)
99%
1 SD 662 +
min: 1.32     avg: 1.6     median: 1.6 (2%)     max: 1.953 Watt

Average Benchmarks Qualcomm Snapdragon 690 5G → 100% n=23

Average Benchmarks Qualcomm Snapdragon 662 → 74% n=23

- Range of benchmark values for this graphics card
- Average benchmark values for this graphics card
* Smaller numbers mean a higher performance
1 This benchmark is not used for the average calculation

Add one or more devices and compare

In the following list you can select (and also search for) devices that should be added to the comparison. You can select more than one device.

restrict list:

show all (including archived), 2024, 2023
v1.26
log 01. 12:28:10

#0 checking url part for id 12957 +0s ... 0s

#1 checking url part for id 12771 +0s ... 0s

#2 not redirecting to Ajax server +0s ... 0s

#3 did not recreate cache, as it is less than 5 days old! Created at Sat, 01 Jun 2024 05:37:57 +0200 +0.001s ... 0.001s

#4 composed specs +0.02s ... 0.021s

#5 did output specs +0s ... 0.021s

#6 getting avg benchmarks for device 12957 +0.014s ... 0.035s

#7 got single benchmarks 12957 +0.012s ... 0.046s

#8 getting avg benchmarks for device 12771 +0.016s ... 0.063s

#9 got single benchmarks 12771 +0.032s ... 0.095s

#10 got avg benchmarks for devices +0s ... 0.095s

#11 min, max, avg, median took s +0.145s ... 0.24s

#12 return log +0.022s ... 0.262s

Please share our article, every link counts!
> Expert Reviews and News on Laptops, Smartphones and Tech Innovations > Benchmarks / Tech > Processor Comparison - Head 2 Head
Redaktion, 2017-09- 8 (Update: 2023-07- 1)