Notebookcheck Logo

AMD Ryzen 9 5950X vs Apple M2 Pro vs Apple M2 Max

AMD Ryzen 9 5950X

► remove from comparison AMD R9 5950X

The AMD Ryzen 9 5950X is a high-end 16-core, hyperthreaded (SMT) Vermeer Series desktop processor. With 32 threads, the new flagship offers as many threads as the AMD Ryzen 9 3950X. Introduced on October 8, 2020, the Ryzen 9 5950X is the fastest 16-core processor and is specified at 105 watts TDP.

The Ryzen 9 5950X runs at 3.4 GHz to 4.9 GHz (single core). Wen all 16 cores are loaded, up to 4.5 GHz are still possible.

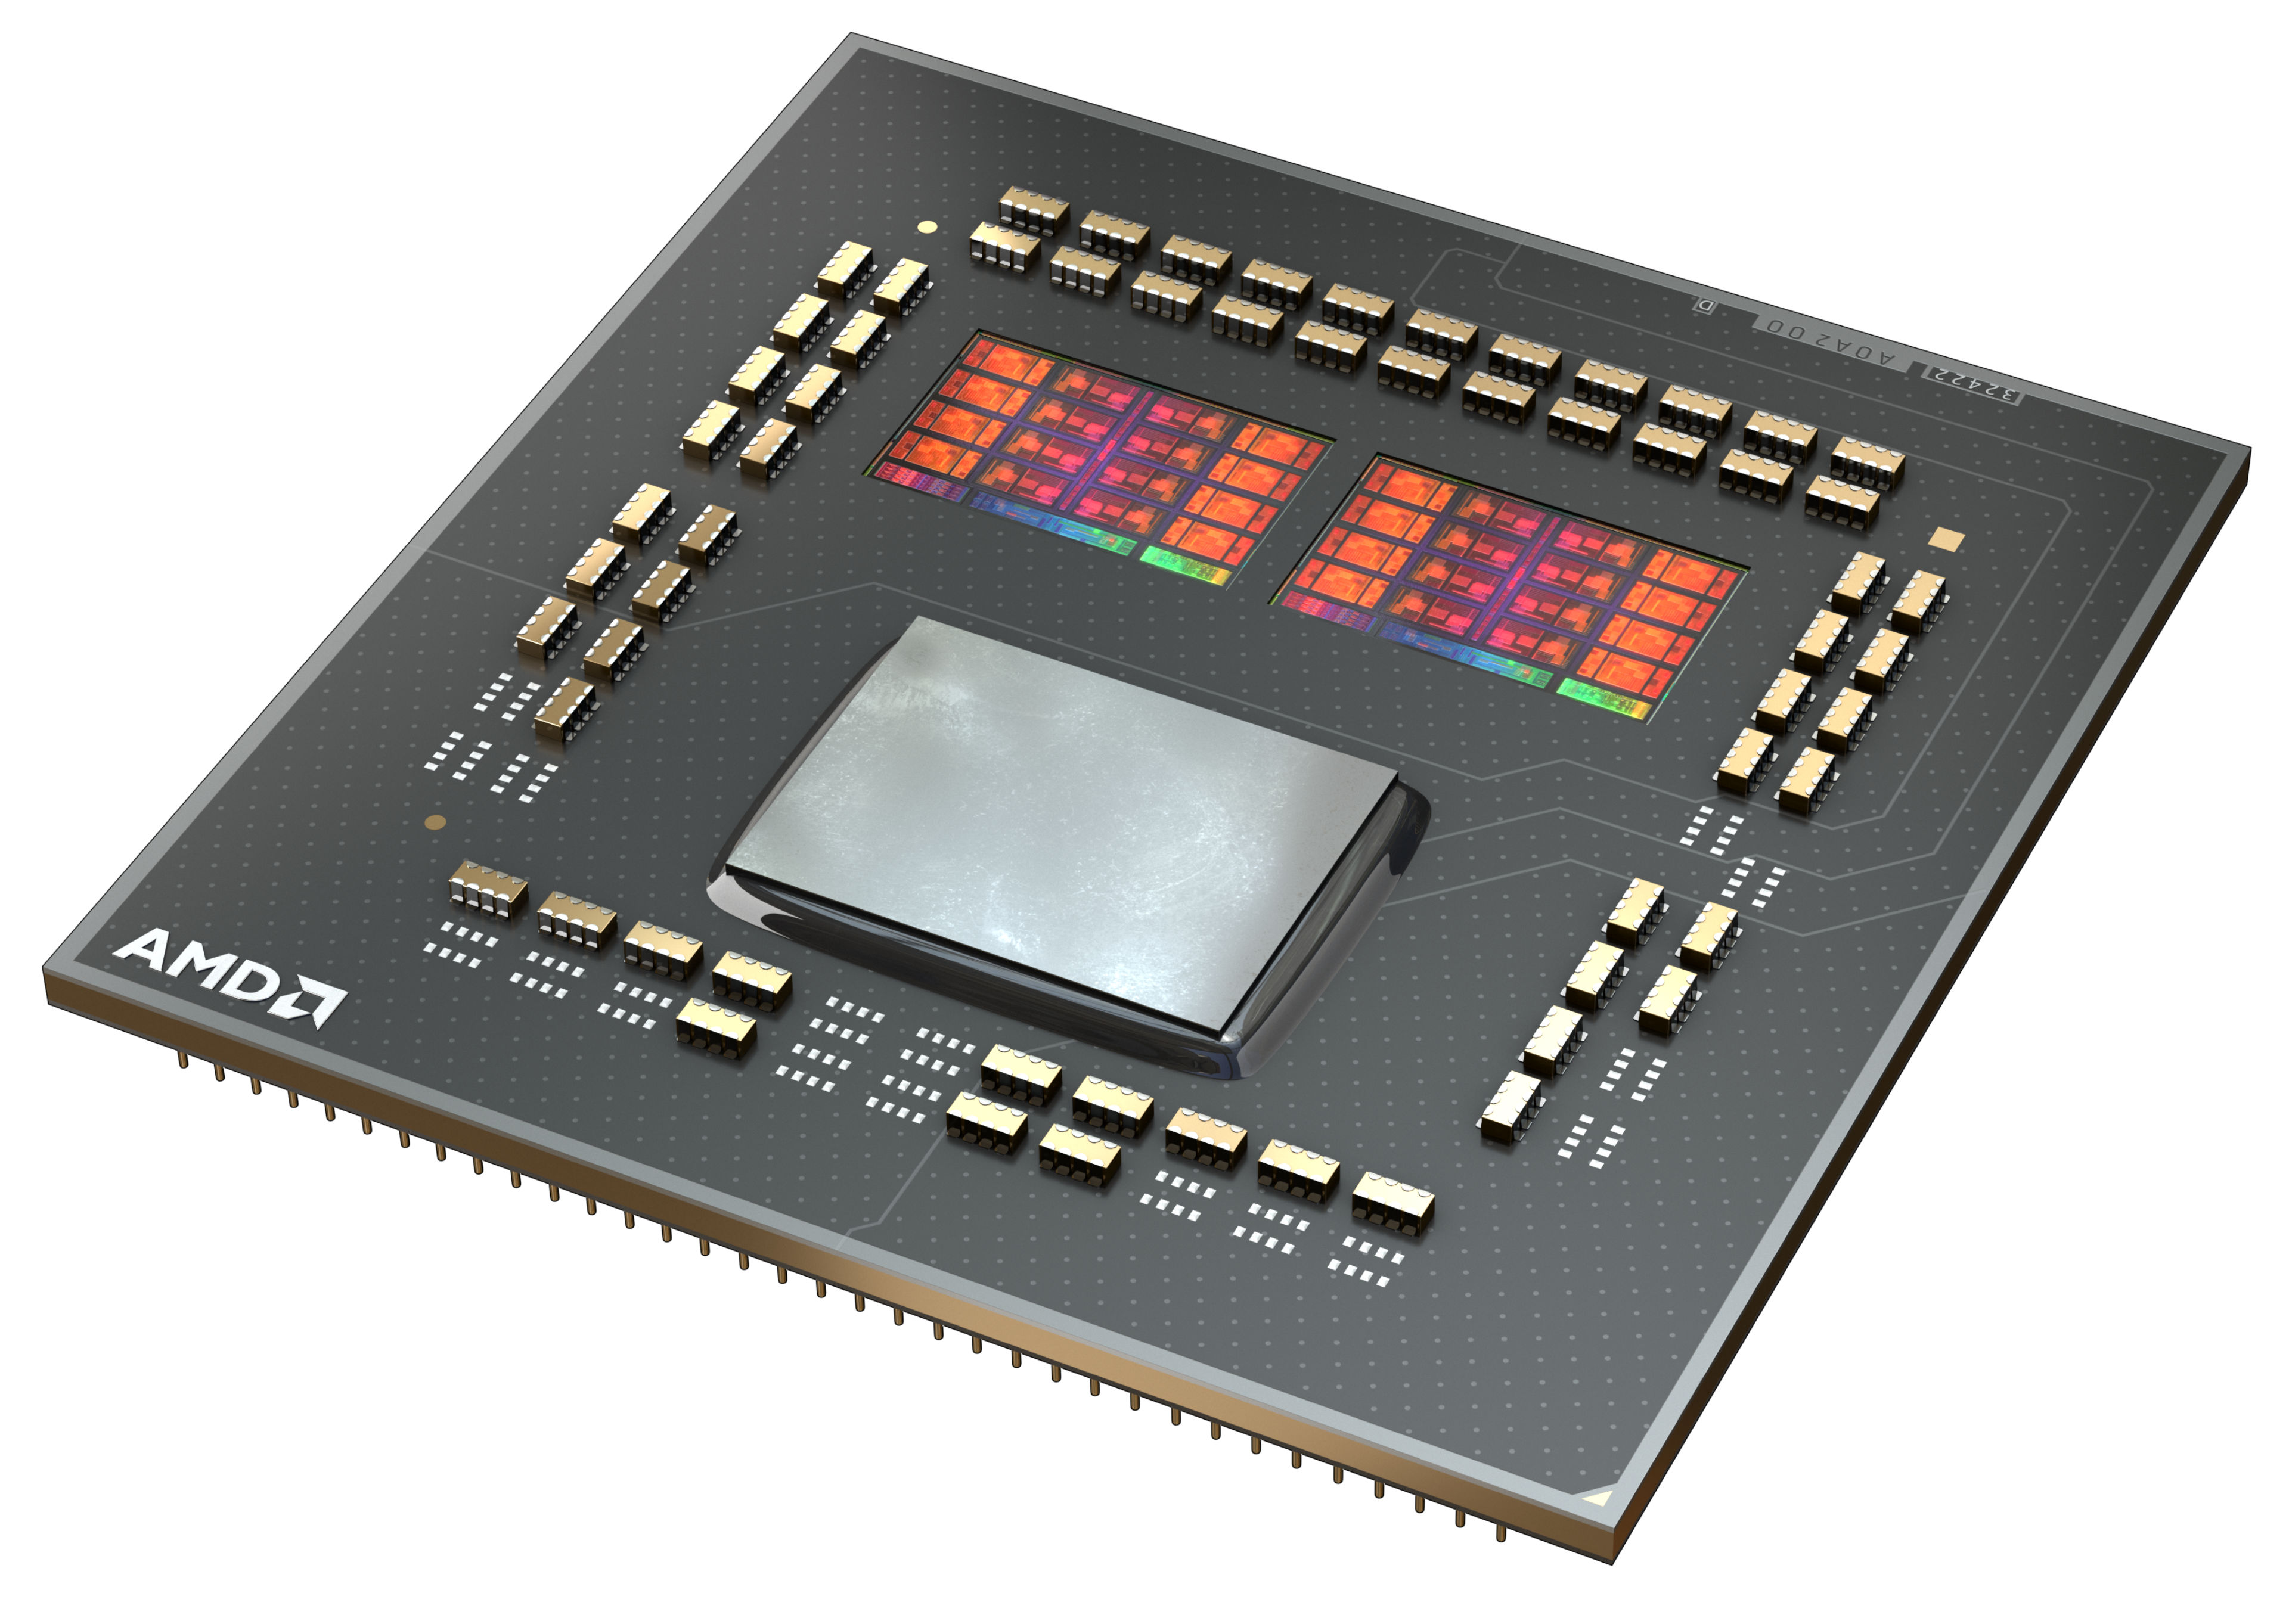
The internal structure of the processor has not changed fundamentally at first glance. The CCX structure has changed a bit compared to Zen 2, because now a CCX consists of up to 8 CPU cores. So each individual core can access the complete L3 cache (32 MByte). Furthermore the CCX modules are connected to each other via the same I/O die, which we already know from Zen2. According to AMD, the Infinity fabric should now reach clock rates of up to 2 Ghz, which in turn allows a RAM clock of 4,000 MHz without performance loss.

Performance

The average 5950X in our database matches the Core i9-12900K, the Core i9-12900HX and also the Ryzen Threadripper 2970WX in multi-thread performance, making this Ryzen a great processor for pretty much any task imaginable as of mid 2022.

Power consumption

This Ryzen 9 series chip has a default TDP (also known as the long-term power limit) of 105 W. It will, however, happily consume much more than that as long as the cooling solution is able to handle the heat - even before one starts considering the possibility of overclocking the thing.

The Ryzen 9 5950X is built with TSMC's 7 nm process for average, as of mid 2023, energy efficiency.

Apple M2 Pro

► remove from comparison Apple M2 Pro

The Apple M2 Pro is a System on a Chip (SoC) from Apple that is found in the early 2023 MacBook Pro 14 and 16-inch models. It offers all 12 cores available in the chip divided in eight performance cores (P-cores) and four power-efficiency cores (E-cores). The E-cores clock with up to 3.4 GHz, the P-Cores up to 3.7 GHz (mostly 3.3 GHz in multi-threaded workloads and 3.4 GHz in single threaded).

The big cores (codename Avalanche) offer 192 KB instruction cache, 128 KB data cache, and 36 MB shared L2 cache (up from 24 MB in the M1 Pro). The four efficiency cores (codename Blizzard) are a lot smaller and offer only 128 KB instruction cache, 64 KB data cache, and 4 MB shared cache. CPU and GPU can both use the 24 MB SLC (System Level Cache). 

The unified memory (16 or 32 GB LPDDR5-6400) next to the chip is connected by a 256 Bit memory controller (200 GB/s bandwidth) and can be used by the GPU and CPU.

Apple states that the M2 Pro has a 25% higher performance than the M1 Pro in Xcode compiling.

The integrated graphics card in the M1 Pro offers all 19 cores.

Furthermore, the SoC integrates a fast 16 core neural engine (faster than M1 Pro), a secure enclave (e.g., for encryption), a unified memory architecture, Thunderbolt 4 controller, an ISP, and media de- and encoders (including ProRes).

The M2 Pro is manufactured in 5 nm at TSMC (second generation) and integrates 40 billion transistors. 

Apple M2 Max

► remove from comparison Apple M2 Max

The Apple M2 Max is a System on a Chip (SoC) from Apple that is found in the early 2023 MacBook Pro 14 and 16-inch models. It offers all 12 CPU cores available in the chip divided in eight performance cores (P-cores) and four power-efficiency cores (E-cores). The E-cores clock with up to 3.4 GHz, the P-Cores up to 3.7 GHz (mostly 3.3 GHz in multi-threaded workloads and 3.4 GHz in single threaded).

The big cores (codename Avalanche) offer 192 KB instruction cache, 128 KB data cache, and 36 MB shared L2 cache (up from 24 MB in the M1 Pro). The four efficiency cores (codename Blizzard) are a lot smaller and offer only 128 KB instruction cache, 64 KB data cache, and 4 MB shared cache. CPU and GPU can both use the 49 MB SLC (System Level Cache). 

The unified memory (32, 64, or 96 GB LPDDR5-6400) next to the chip is connected by a 512 Bit memory controller (400 GB/s bandwidth) and can be used by the GPU and CPU.

The CPU performance should be quite similar to the M2 Pro as only the higher memory bandwidth and bigger L3 cache could make a difference for some workloads.

The integrated graphics card in the M1 Max offers a 30-core GPU or a GPU with all 38 cores.

Furthermore, the SoC integrates a fast 16 core neural engine (faster than M1 Max), a secure enclave (e.g., for encryption), a unified memory architecture, Thunderbolt 4 controller, an ISP, and media de- and encoders (including ProRes).

The M2 Max is manufactured in 5 nm at TSMC (second generation) and integrates 40 billion transistors. The power consumption of the CPU part is up to 36 Watt according to powermetrics. When fully loading the CPU and GPU cores, the chip uses up to 89 Watt and the CPU part is limited to 25 Watt.

ModelAMD Ryzen 9 5950XApple M2 ProApple M2 Max
SeriesAMD Vermeer (Ryzen 5000)Apple Apple M2Apple Apple M2
CodenameVermeer (Zen 3)
Series: Apple M2
AMD Ryzen 9 5950X « 3.4 - 4.9 GHz16 / 32 cores64 MB L3
AMD Ryzen 7 5800X3.8 - 4.7 GHz8 / 16 cores32 MB L3
AMD Ryzen 7 5700X3.4 - 4.6 GHz8 / 16 cores32 MB L3
AMD Ryzen 5 5600X3.7 - 4.6 GHz6 / 12 cores32 MB L3
Apple M2 Max2.42 - 3.7 GHz12 / 12 cores48 MB L3
Apple M2 Pro « 2.42 - 3.5 GHz12 / 12 cores24 MB L3
Apple M2 Pro 10-Core2.42 - 3.7 GHz10 / 10 cores24 MB L3
Apple M22.42 - 3.48 GHz8 / 8 cores8 MB L3
Apple M2 Max « 2.42 - 3.7 GHz12 / 12 cores48 MB L3
Apple M2 Pro2.42 - 3.5 GHz12 / 12 cores24 MB L3
Apple M2 Pro 10-Core2.42 - 3.7 GHz10 / 10 cores24 MB L3
Apple M22.42 - 3.48 GHz8 / 8 cores8 MB L3
Clock3400 - 4900 MHz2424 - 3504 MHz2424 - 3696 MHz
L1 Cache1 MB3.3 MB3.3 MB
L2 Cache8 MB36 MB36 MB
L3 Cache64 MB24 MB48 MB
Cores / Threads16 / 3212 / 1212 / 12
TDP105 Watt79 Watt
Technology7 nm5 nm5 nm
Die SizeCPU cores: 2x 80.7 sq. mm., I/O: 125 mm2
SocketAM4
FeaturesDDR4-3200 RAM, PCIe 4, MMX (+), SSE, SSE2, SSE3, SSSE3, SSE4.1, SSE4.2, SSE4A, AES, AVX, AVX2, FMA3, SHAARMv8 Instruction SetARMv8 Instruction Set
Architecturex86ARMARM
$799 U.S.
Announced
Manufacturerwww.amd.com
Transistors40000 Million67000 Million
iGPUApple M2 Pro 19-Core GPUApple M2 Max 38-Core GPU

Benchmarks

Performance Rating - CB R15 + R20 + 7-Zip + X265 + Blender + 3DM11 CPU - R9 5950X
50.5 pt (70%)
Cinebench 2024 - CB24 CPU Single Core
100%
1 M2 Pro +
122 Points (85%)
Cinebench 2024 - CB24 CPU Multi Core
100%
1 M2 Pro +
1028 Points (19%)
Cinebench R23 - Cinebench R23 Multi Core
min: 24972     avg: 26017     median: 26017 (24%)     max: 27062 Points
min: 14787     avg: 14795     median: 14794.5 (14%)     max: 14802 Points
min: 14738     avg: 14753     median: 14752.5 (14%)     max: 14767 Points
Cinebench R23 - Cinebench R23 Single Core
min: 1579     avg: 1614     median: 1614 (69%)     max: 1649 Points
min: 1647     avg: 1648     median: 1647.5 (70%)     max: 1648 Points
min: 1625     avg: 1644     median: 1643.5 (70%)     max: 1662 Points
Cinebench R20 - Cinebench R20 CPU (Single Core)
min: 617     avg: 629     median: 629 (70%)     max: 641 Points
min: 446     avg: 446.5     median: 446.5 (50%)     max: 447 Points
min: 451     avg: 455.5     median: 455.5 (51%)     max: 460 Points
Cinebench R20 - Cinebench R20 CPU (Multi Core)
min: 9640     avg: 10061     median: 10061 (25%)     max: 10482 Points
min: 4018     avg: 4031     median: 4031 (10%)     max: 4044 Points
min: 4044     avg: 4065     median: 4064.5 (10%)     max: 4085 Points
Cinebench R15 - Cinebench R15 CPU Multi 64 Bit
min: 4156     avg: 4324     median: 4324 (27%)     max: 4492 Points
2069 Points (13%)
min: 2074     avg: 2084     median: 2084 (13%)     max: 2094 Points
Cinebench R15 - Cinebench R15 CPU Single 64 Bit
min: 261     avg: 266.5     median: 266.5 (80%)     max: 272 Points
230 Points (69%)
min: 233     avg: 236     median: 236 (71%)     max: 239 Points
Cinebench R11.5 - Cinebench R11.5 CPU Multi 64 Bit
min: 46.05     avg: 47.8     median: 47.8 (62%)     max: 49.6 Points
Cinebench R11.5 - Cinebench R11.5 CPU Single 64 Bit
min: 3.02     avg: 3.1     median: 3.1 (77%)     max: 3.14 Points
Cinebench R10 - Cinebench R10 Rend. Single (32bit)
min: 6564     avg: 6690     median: 6689.5 (40%)     max: 6815 Points
Cinebench R10 - Cinebench R10 Rend. Multi (32bit)
min: 55185     avg: 56641     median: 56640.5 (41%)     max: 58096 Points
Cinebench R10 - Cinebench R10 Rend. Multi (64bit)
min: 99617     avg: 102128     median: 102128 (71%)     max: 104638 Points
Cinebench R10 - Cinebench R10 Rend. Single (64bit)
min: 12655     avg: 12967     median: 12967 (16%)     max: 13279 Points
wPrime 2.10 - wPrime 2.0 1024m *
min: 52     avg: 58.5     median: 58.5 (1%)     max: 64.9 s
wPrime 2.10 - wPrime 2.0 32m *
min: 2.538     avg: 4.2     median: 4.2 (1%)     max: 5.928 s
WinRAR - WinRAR 4.0
min: 12503     avg: 12736     median: 12735.5 (20%)     max: 12968 Points
7-Zip 18.03 - 7-Zip 18.03 Multli Thread 4 runs
min: 118165     avg: 122979     median: 122978 (71%)     max: 127792 MIPS
7-Zip 18.03 - 7-Zip 18.03 Single Thread 4 runs
min: 6729     avg: 6852     median: 6851.5 (82%)     max: 6974 MIPS
X264 HD Benchmark 4.0 - x264 Pass 2
min: 203     avg: 212     median: 212 (74%)     max: 221 fps
X264 HD Benchmark 4.0 - x264 Pass 1
min: 321.5     avg: 330     median: 330 (76%)     max: 338.5 fps
HWBOT x265 Benchmark v2.2 - HWBOT x265 4k Preset
min: 29.9     avg: 30.9     median: 30.9 (54%)     max: 31.8 fps
TrueCrypt - TrueCrypt Serpent
min: 2.3     avg: 2.4     median: 2.4 (0%)     max: 2.4 GB/s
TrueCrypt - TrueCrypt Twofish
min: 3.3     avg: 3.5     median: 3.5 (60%)     max: 3.7 GB/s
TrueCrypt - TrueCrypt AES
min: 25.1     avg: 26     median: 26 (68%)     max: 26.9 GB/s
Blender - Blender 3.3 Classroom CPU *
100%
1 M2 Pro +
331 Seconds (4%)
100%
1 M2 Max +
326 Seconds (4%)
Blender - Blender 2.79 BMW27 CPU *
min: 112.8     avg: 117.7     median: 117.7 (1%)     max: 122.5 Seconds
98%
1 M2 Max +
333 Seconds (2%)
R Benchmark 2.5 - R Benchmark 2.5 *
min: 0.4556     avg: 0.5     median: 0.5 (10%)     max: 0.4698 sec
101%
1 M2 Pro +
0.4 sec (9%)
3DMark 06 - CPU - 3DMark 06 - CPU
min: 17229     avg: 17657     median: 17656.5 (38%)     max: 18084 Points
Super Pi mod 1.5 XS 1M - Super Pi mod 1.5 XS 1M *
min: 7.065     avg: 7.2     median: 7.2 (2%)     max: 7.405 s
Super Pi mod 1.5 XS 2M - Super Pi mod 1.5 XS 2M *
min: 15.28     avg: 15.7     median: 15.7 (1%)     max: 16.02 s
Super Pi Mod 1.5 XS 32M - Super Pi mod 1.5 XS 32M *
min: 349.3     avg: 361.5     median: 361.5 (2%)     max: 373.7 s
3DMark Vantage - 3DM Vant. Perf. CPU no Physx
min: 84237     avg: 85367     median: 85367 (75%)     max: 86497 Points
3DMark 11 - 3DM11 Performance Physics
min: 23012     avg: 25067     median: 25154.5 (68%)     max: 27383 Points
3DMark - 3DMark Ice Storm Physics
min: 70120     avg: 77979     median: 79716 (65%)     max: 84100 Points
3DMark - 3DMark Ice Storm Extreme Physics
min: 69902     avg: 78121     median: 80185 (65%)     max: 84275 Points
3DMark - 3DMark Ice Storm Unlimited Physics
min: 82412     avg: 82452     median: 82452 (69%)     max: 82492 Points
3DMark - 3DMark Cloud Gate Physics
min: 21419     avg: 22558     median: 22436 (57%)     max: 23939 Points
3DMark - 3DMark Fire Strike Standard Physics
min: 34080     avg: 37236     median: 37498.5 (67%)     max: 39600 Points
3DMark - 3DMark Time Spy CPU
min: 11111     avg: 12919     median: 13441 (57%)     max: 14559 Points
Geekbench 6.2 - Geekbench 6.2 Single-Core
100%
1 M2 Pro +
2663 Points (72%)
101%
1 M2 Max +
2692 Points (72%)
Geekbench 6.2 - Geekbench 6.2 Multi-Core
100%
1 M2 Pro +
14568 Points (57%)
102%
1 M2 Max +
14863 Points (59%)
Geekbench 5.5 - Geekbench 5.1 - 5.4 64 Bit Single-Core
min: 1621     avg: 1652     median: 1651.5 (70%)     max: 1682 Points
min: 1952     avg: 1957     median: 1957 (83%)     max: 1961 Points
min: 1965     avg: 1970     median: 1967 (83%)     max: 1978 Points
Geekbench 5.5 - Geekbench 5.1 - 5.4 64 Bit Multi-Core
min: 15605     avg: 16248     median: 16248 (29%)     max: 16891 Points
min: 14859     avg: 14961     median: 15010 (27%)     max: 15013 Points
min: 15348     avg: 15388     median: 15373 (28%)     max: 15444 Points
Geekbench 5.0 - Geekbench 5.0 64 Bit Single-Core
min: 1625     avg: 1654     median: 1654 (7%)     max: 1683 Points
Geekbench 5.0 - Geekbench 5.0 64 Bit Multi-Core
min: 15396     avg: 15983     median: 15983 (50%)     max: 16570 Points
Geekbench 4.4 - Geekbench 4.1 - 4.4 64 Bit Single-Core
min: 7021     avg: 7119     median: 7118.5 (71%)     max: 7216 Points
Geekbench 4.4 - Geekbench 4.1 - 4.4 64 Bit Multi-Core
min: 57584     avg: 60409     median: 60408.5 (66%)     max: 63233 Points
Mozilla Kraken 1.1 - Kraken 1.1 Total Score *
min: 558     avg: 570     median: 569.5 (1%)     max: 581 ms
443.8 ms (1%)
min: 430.2     avg: 437.2     median: 437.2 (1%)     max: 444.2 ms
Octane V2 - Octane V2 Total Score
100%
1 M2 Pro +
76205 Points (69%)
102%
1 M2 Max +
min: 76610     avg: 77676     median: 77676 (70%)     max: 78742 Points
WebXPRT 4 - WebXPRT 4 Score
100%
1 M2 Pro +
253 Points (73%)
102%
1 M2 Max +
min: 258     avg: 259     median: 259 (74%)     max: 260 Points
WebXPRT 3 - WebXPRT 3 Score
min: 288     avg: 289.5     median: 289.5 (60%)     max: 291 Points
386 Points (80%)
min: 402     avg: 404.5     median: 404.5 (84%)     max: 407 Points
CrossMark - CrossMark Overall
1495 Points (57%)
min: 1797     avg: 1805     median: 1804.5 (69%)     max: 1812 Points
min: 1759     avg: 1835     median: 1834.5 (70%)     max: 1910 Points
Power Consumption - Prime95 Power Consumption - external Monitor *
min: 232.8     avg: 242.6     median: 242.6 (42%)     max: 252.3 Watt
Power Consumption - Cinebench R15 Multi Power Consumption - external Monitor *
min: 226.1     avg: 227.4     median: 227.4 (41%)     max: 228.7 Watt
148%
1 M2 Max +
72.8 Watt (13%)
Power Consumption - Idle Power Consumption - external Monitor *
100%
1 M2 Max +
9.2 Watt (6%)
Power Consumption - Cinebench R15 Multi Power Efficiency - external Monitor
min: 18.2     avg: 19.1     median: 19.1 (14%)     max: 19.9 Points per Watt
150%
1 M2 Max +
28.5 Points per Watt (21%)

Average Benchmarks AMD Ryzen 9 5950X → 100% n=11

Average Benchmarks Apple M2 Pro → 88% n=11

Average Benchmarks Apple M2 Max → 89% n=11

- Range of benchmark values for this graphics card
- Average benchmark values for this graphics card
* Smaller numbers mean a higher performance
1 This benchmark is not used for the average calculation

v1.27
log 16. 06:04:44

#0 checking url part for id 12787 +0s ... 0s

#1 checking url part for id 14973 +0s ... 0s

#2 checking url part for id 14975 +0s ... 0s

#3 not redirecting to Ajax server +0s ... 0s

#4 did not recreate cache, as it is less than 5 days old! Created at Sun, 16 Jun 2024 05:37:17 +0200 +0.001s ... 0.001s

#5 composed specs +0.032s ... 0.033s

#6 did output specs +0s ... 0.034s

#7 getting avg benchmarks for device 12787 +0.023s ... 0.056s

#8 got single benchmarks 12787 +0.027s ... 0.083s

#9 getting avg benchmarks for device 14973 +0.004s ... 0.087s

#10 got single benchmarks 14973 +0.009s ... 0.096s

#11 getting avg benchmarks for device 14975 +0.003s ... 0.1s

#12 got single benchmarks 14975 +0.011s ... 0.111s

#13 got avg benchmarks for devices +0s ... 0.111s

#14 min, max, avg, median took s +0.403s ... 0.515s

#15 return log +0s ... 0.515s

Please share our article, every link counts!
> Expert Reviews and News on Laptops, Smartphones and Tech Innovations > Benchmarks / Tech > Processor Comparison - Head 2 Head
Redaktion, 2017-09- 8 (Update: 2023-07- 1)