Notebookcheck Logo

AMD Ryzen 7 7800X3D vs AMD Ryzen 9 9950X

AMD Ryzen 7 7800X3D

► remove from comparison AMD R7 7800X3D

The AMD Ryzen 7 7800X3D is a high-end desktop processor from the Raphael series with 8 Zen 4 cores and SMT (Simultaneous Multithreading), allowing it to handle up to 16 threads simultaneously. After its announcement in January 2023 at CES in Las Vegas, it was launched in April 2023. Following the launch of the two top models, the AMD Ryzen 9 7900X3D and the AMD Ryzen 9 7950X3D, the third model was introduced, which offers significantly more gaming performance with the 3D V-Cache.

The CPU cores have a base clock of 4.2 GHz and can be boosted up to 5 GHz (single-core turbo). The AMD Ryzen 7 7800X3D features a CCD with 8 cores, which includes the fast 3D V-Cache. This differs significantly from the two Ryzen 9 models, as they have two CCDs, but only one of them can utilize the 3D V-Cache.

The performance of the AMD Ryzen 7 7800X3D is consistently good, although its multi-threaded performance suffers a bit due to the eight native compute cores. However, the real strength of the AMD Ryzen 7 7800X3D lies in gaming performance, where it excels. In tests, we see consistently high gaming performance, even surpassing that of an Intel Core i9-13900K.

In terms of power consumption, the AMD Ryzen 7 7800X3D aligns with the other two models featuring 3D V-Cache, making the 8-core processor extremely power-efficient. In numbers, this means that the AMD Ryzen 7 7800X3D is specified with a TDP of up to 120 watts. The PPT (Package Power Tracking) is also rated up to 162 watts. For comparison, an AMD Ryzen 9 7950X is specified with 170 watts (TDP) or 230 watts (PPT).

AMD Ryzen 9 9950X

► remove from comparison AMD Ryzen 9 9950X

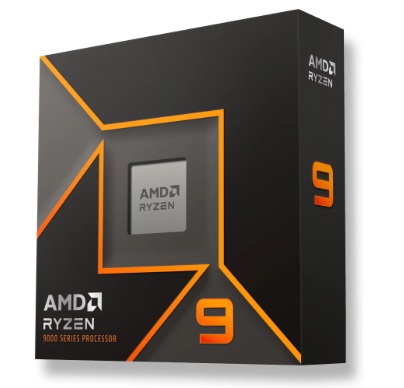
The Ryzen 9 9950X is a very, very powerful desktop CPU of the Granite Ridge product family that features 16 Zen 5 cores (32 threads), PCIe 5 support and a basic iGPU. The Ryzen was launched in June 2024, with sales slated to start in August.

The 9950X shares some of the specifications with the mighty Zen 4-powered Ryzen 9 7950X, including (but not limited to) the 16 MB L2 cache, the 64 MB L3 cache, the 5.7 GHz top clock speed and the 170 W long-term TDP.

Architecture and Features

Just like Strix Point APUs, Granite Ridge processors make use of the new Zen 5 microarchitecture. However, there are no efficient cores here; all of 9950X's cores are full Zen 5 cores. Furthermore, Granite Ridge is a multi-die design with only the CPU cores produced using a fairly modern 4 nm TSMC process. Strix Point processors are a single-die design, from what we know.

According to AMD, Zen 5 delivers a 16% IPC improvement over Zen 4 thanks to branch prediction improvements and other refinements.

Elsewhere, the 9950X has an impressive 64 MB of L3 cache and 24 direct PCIe 5 lanes (3.93 GB/s throughput per lane) with up to 12 additional PCIe 4 lanes available depending on the motherboard. It supports DDR5 RAM as fast as 5,600 MT/s (up to 8,000 MT/s if overclocked).

The 9950X is unlocked for overclocking. Naturally, the AM5 socket CPU supports Windows 11, 64-bit Windows 10 as well as many Linux distros.

Performance

According to early July leaks, its multi-thread performance is about as good as that of the 24-core Core i9-14900K Intel CPU. We'll definitely update this section once we get our hands on a system powered by the 9950X.

Graphics

The Radeon 610M comes equipped with just 128 unified shaders running at up to 2,200 MHz. Its gaming performance is slated to be extremely low and only just sufficient for pre-2020 games in resolutions such as 1024x768.

Power consumption

The CPU cores are built with TSMC's N4P process for good, as of mid 2024, power efficiency. (Apple is the leader in this regard with the second-generation 3 nm process.)

The Ryzen 9's long-term TDP is 170 W. It'll probably consume up to 250 W when under heavy short-term loads. If overclocked, the power consumption figures will increase significantly.

ModelAMD Ryzen 7 7800X3DAMD Ryzen 9 9950X
CodenameRaphael (Zen4)Granite Ridge
SeriesAMD Raphael (Zen 4, Ryzen 7000)AMD Granite Ridge (Zen 5, AM5)
Series: Granite Ridge (Zen 5, AM5) Granite Ridge
AMD Ryzen 9 7950X3D compare4.2 - 5.7 GHz16 / 32 cores128 MB L3
AMD Ryzen 9 7900X compare4.7 - 5.6 GHz12 / 24 cores64 MB L3
AMD Ryzen 9 7900 compare3.7 - 5.4 GHz12 / 24 cores64 MB L3
AMD Ryzen 7 7700X compare4.5 - 5.4 GHz8 / 16 cores32 MB L3
AMD Ryzen 7 7700 compare3.8 - 5.3 GHz8 / 16 cores32 MB L3
AMD Ryzen 7 7800X3D « 4.2 - 5 GHz8 / 16 cores96 MB L3
AMD Ryzen 5 7600X compare4.7 - 5.3 GHz6 / 12 cores32 MB L3
AMD Ryzen 5 7600 compare3.8 - 5.1 GHz6 / 12 cores32 MB L3
AMD Ryzen 9 9950X3D compare4.3 - 5.7 GHz16 / 32 cores128 MB L3
AMD Ryzen 9 9950X « 4.3 - 5.7 GHz16 / 32 cores64 MB L3
AMD Ryzen 9 9900X compare4.4 - 5.6 GHz12 / 24 cores64 MB L3
AMD Ryzen 7 9700X compare3.8 - 5.5 GHz8 / 16 cores32 MB L3
AMD Ryzen 7 9800X3D compare4.7 - 5.2 GHz8 / 16 cores96 MB L3
AMD Ryzen 5 9600X compare3.9 - 5.4 GHz6 / 12 cores32 MB L3
Clock4200 - 5000 MHz4300 - 5700 MHz
L1 Cache512 KB1 MB
L2 Cache8 MB16 MB
L3 Cache96 MB64 MB
Cores / Threads8 / 1616 / 32
16 x 5.7 GHz AMD Zen 5
TDP120 Watt170 Watt
TDP Turbo PL2162 Watt
Transistors6570 Million
Technology5 nm4 nm & 6 nm
Voltage1.1 - 1.2 V
Die Size193 mm2
max. Temp.89 °C95 °C
SocketAM5 (LGA 1718)AM5
FeaturesMMX, SSE, SSE2, SSE3, SSSE3, SSE4.1, SSE4.2, SSE4A, x86-64, AMD-V, AES, AVX, AVX2, AVX512, BMI1, BMI2, F16C, FMA3, AMD64, EVP, AMD-V, SMAP, SMEP, SMT SHA, XFR2, Precision Boost 2DDR5-5600 RAM, PCIe 5 + PCIe 4, SMT, AES, AVX, AVX2, AVX512, FMA3, MMX (+), SHA, SSE, SSE2, SSE3, SSSE3, SSE4.1, SSE4.2, SSE4A
iGPUAMD Radeon Graphics (Ryzen 7000) (400 - 2200 MHz)AMD Radeon 610M ( - 2200 MHz)
Architecturex86x86
$449 U.S.
Announced
Manufacturerwww.amd.com

Benchmarks

Performance Rating - CB R15 + R20 + 7-Zip + X265 + Blender + 3DM11 CPU - R7 7800X3D
42.3 pt (70%)
Restrict / Search: Model: Max. age: years
Performance Rating - CB R15 + R20 + 7-Zip + X265 + Blender + 3DM11 CPU - Ryzen 9 9950X
51.5 pt (86%)
Restrict / Search: Model: Max. age: years
Cinebench 2024 - Cinebench 2024 CPU Single Core
136 Points (68%)
Cinebench 2024 - Cinebench 2024 CPU Multi Core
2254 Points (42%)
Cinebench R23 - Cinebench R23 Multi Core
min: 16688     avg: 17197     median: 16817 (16%)     max: 18086 Points
40924 Points (38%)
Cinebench R23 - Cinebench R23 Single Core
min: 1646     avg: 1726     median: 1713 (70%)     max: 1820 Points
2202 Points (90%)
Cinebench R20 - Cinebench R20 CPU (Single Core)
min: 663     avg: 686     median: 686 (75%)     max: 709 Points
871 Points (95%)
Cinebench R20 - Cinebench R20 CPU (Multi Core)
min: 6488     avg: 6805     median: 6804.5 (17%)     max: 7121 Points
15788 Points (38%)
Cinebench R15 - Cinebench R15 CPU Multi 64 Bit
min: 2783     avg: 2879     median: 2878.5 (18%)     max: 2974 Points
6335 Points (40%)
Cinebench R15 - Cinebench R15 CPU Single 64 Bit
min: 272     avg: 281.5     median: 281.5 (78%)     max: 291 Points
344 Points (95%)
Cinebench R11.5 - Cinebench R11.5 CPU Multi 64 Bit
33.5 Points (43%)
72.3 Points (94%)
Cinebench R11.5 - Cinebench R11.5 CPU Single 64 Bit
3.4 Points (81%)
min: 4.03     avg: 4     median: 4 (96%)     max: 4.21 Points
Cinebench R10 - Cinebench R10 Rend. Single (32bit)
8026 Points (48%)
9402 Points (57%)
Cinebench R10 - Cinebench R10 Rend. Multi (32bit)
51950 Points (38%)
71611 Points (52%)
Cinebench R10 - Cinebench R10 Rend. Multi (64bit)
94035 Points (60%)
Cinebench R10 - Cinebench R10 Rend. Single (64bit)
14485 Points (18%)
wPrime 2.10 - wPrime 2.0 1024m *
62.7 s (1%)
29.3 s (0%)
wPrime 2.10 - wPrime 2.0 32m *
2.4 s (0%)
2.1 s (0%)
WinRAR - WinRAR 4.0
16585 Points (26%)
13778 Points (22%)
7-Zip 18.03 - 7-Zip 18.03 Multi Thread 4 runs
min: 75558     avg: 80313     median: 80312.5 (46%)     max: 85067 MIPS
160423 MIPS (92%)
7-Zip 18.03 - 7-Zip 18.03 Single Thread 4 runs
min: 7412     avg: 7824     median: 7823.5 (92%)     max: 8235 MIPS
7852 MIPS (93%)
X264 HD Benchmark 4.0 - x264 Pass 2
169.3 fps (4%)
271 fps (7%)
X264 HD Benchmark 4.0 - x264 Pass 1
344 fps (9%)
392 fps (10%)
HWBOT x265 Benchmark v2.2 - HWBOT x265 4k Preset
min: 22.1     avg: 23.3     median: 23.3 (41%)     max: 24.4 fps
45.1 fps (79%)
TrueCrypt - TrueCrypt Serpent
1.3 GB/s (38%)
3.4 GB/s (100%)
TrueCrypt - TrueCrypt Twofish
2.1 GB/s (36%)
5.6 GB/s (97%)
TrueCrypt - TrueCrypt AES
15.3 GB/s (40%)
32.4 GB/s (84%)
Blender - Blender 3.3 Classroom CPU *
min: 266     avg: 282.5     median: 282.5 (4%)     max: 299 Seconds
118 Seconds (2%)
Blender - Blender 2.79 BMW27 CPU *
min: 169     avg: 178     median: 178 (1%)     max: 187 Seconds
77 Seconds (1%)
R Benchmark 2.5 - R Benchmark 2.5 *
min: 0.4152     avg: 0.4     median: 0.4 (9%)     max: 0.4479 sec
0.3 sec (7%)
3DMark 06 - CPU - 3DMark 06 - CPU
16892 Points (36%)
21838 Points (46%)
Super Pi mod 1.5 XS 1M - Super Pi mod 1.5 XS 1M *
7.1 s (2%)
7.3 s (2%)
Super Pi mod 1.5 XS 2M - Super Pi mod 1.5 XS 2M *
15.3 s (1%)
15.6 s (1%)
Super Pi Mod 1.5 XS 32M - Super Pi mod 1.5 XS 32M *
337.6 s (1%)
3DMark Vantage - 3DM Vant. Perf. CPU no Physx
97391 Points (75%)
3DMark 11 - 3DM11 Performance Physics
min: 30767     avg: 32947     median: 32947 (81%)     max: 35127 Points
38269 Points (94%)
3DMark - 3DMark Ice Storm Physics
89617 Points (73%)
3DMark - 3DMark Ice Storm Extreme Physics
89287 Points (72%)
3DMark - 3DMark Ice Storm Unlimited Physics
91846 Points (74%)
3DMark - 3DMark Cloud Gate Physics
25510 Points (65%)
3DMark - 3DMark Fire Strike Standard Physics
min: 30333     avg: 31455     median: 30687 (55%)     max: 33345 Points
49522 Points (88%)
3DMark - 3DMark Time Spy CPU
min: 10908     avg: 12327     median: 11975 (50%)     max: 14098 Points
16112 Points (68%)
Geekbench 6.5 - Geekbench 6.5 Single-Core
2634 Points (61%)
3408 Points (79%)
Geekbench 6.5 - Geekbench 6.5 Multi-Core
14288 Points (55%)
21383 Points (83%)
Geekbench 6.0 - Geekbench 6.0 Single-Core
2175 Points (69%)
Geekbench 6.0 - Geekbench 6.0 Multi-Core
12046 Points (49%)
Geekbench 5.5 - Geekbench 5.1 - 5.5 64 Bit Single-Core
min: 1856     avg: 1934     median: 1920 (65%)     max: 2027 Points
2559 Points (86%)
Geekbench 5.5 - Geekbench 5.1 - 5.5 64 Bit Multi-Core
min: 12073     avg: 13013     median: 12715 (23%)     max: 14252 Points
23982 Points (43%)
Geekbench 5.0 - Geekbench 5.0 64 Bit Single-Core
1938 Points (8%)
2445 Points (11%)
Geekbench 5.0 - Geekbench 5.0 64 Bit Multi-Core
13888 Points (44%)
23387 Points (74%)
Geekbench 4.4 - Geekbench 4.1 - 4.4 64 Bit Single-Core
9097 Points (91%)
10016 Points (100%)
Geekbench 4.4 - Geekbench 4.1 - 4.4 64 Bit Multi-Core
54840 Points (54%)
100326 Points (98%)
Mozilla Kraken 1.1 - Kraken 1.1 Total Score *
min: 487     avg: 504     median: 503.5 (1%)     max: 520 ms
377 ms (0%)
WebXPRT 4 - WebXPRT 4 Score
282 Points (73%)
357 Points (93%)
WebXPRT 3 - WebXPRT 3 Score
353 Points (63%)
409 Points (73%)
CrossMark - CrossMark Overall
2216 Points (83%)
2451 Points (92%)
Power Consumption - Prime95 Power Consumption - external Monitor *
218 Watt (38%)
319 Watt (55%)
Power Consumption - Cinebench R15 Multi Power Consumption - external Monitor *
207 Watt (38%)
313 Watt (57%)
Power Consumption - Idle Power Consumption - external Monitor *
121.6 Watt (80%)
100 Watt (66%)
Power Consumption - Power Efficiency - Cinebench R15 Multi external Monitor
14.4 Points per Watt (11%)
20.2 Points per Watt (15%)

Average Benchmarks AMD Ryzen 7 7800X3D → 100% n=42

Average Benchmarks AMD Ryzen 9 9950X → 157% n=42

- Range of benchmark values for this graphics card
red legend - Average benchmark values for this graphics card
* Smaller numbers mean a higher performance
1 This benchmark is not used for the average calculation

Add one or more devices and compare

In the following list you can select (and also search for) devices that should be added to the comparison. You can select more than one device.

restrict list:
v1.34
log 25. 08:48:00

#0 ran 0s before starting gpusingle class +0s ... 0s

#1 checking url part for id 15064 +0s ... 0s

#2 checking url part for id 17637 +0s ... 0s

#3 redirected to Ajax server, took 1761374879s time from redirect:1 +0s ... 0s

#4 did not recreate cache, as it is less than 5 days old! Created at Sat, 25 Oct 2025 05:18:16 +0200 +0s ... 0s

#5 composed specs +0.005s ... 0.005s

#6 did output specs +0s ... 0.005s

#7 getting avg benchmarks for device 15064 +0.001s ... 0.006s

#8 got single benchmarks 15064 +0.001s ... 0.007s

#9 getting avg benchmarks for device 17637 +0.003s ... 0.01s

#10 got single benchmarks 17637 +0.005s ... 0.015s

#11 got avg benchmarks for devices +0s ... 0.015s

#12 min, max, avg, median took s +0.03s ... 0.045s

#13 return log +0.001s ... 0.047s

Please share our article, every link counts!
Mail Logo
> Expert Reviews and News on Laptops, Smartphones and Tech Innovations > Benchmarks / Tech > Processor Comparison - Head 2 Head
Redaktion, 2017-09- 8 (Update: 2023-07- 1)