Notebookcheck Logo

AMD Ryzen 7 3700X vs AMD Ryzen 5 7600X vs AMD Ryzen 7 7800X3D

AMD Ryzen 7 3700X

► remove from comparison AMD R7 3700X

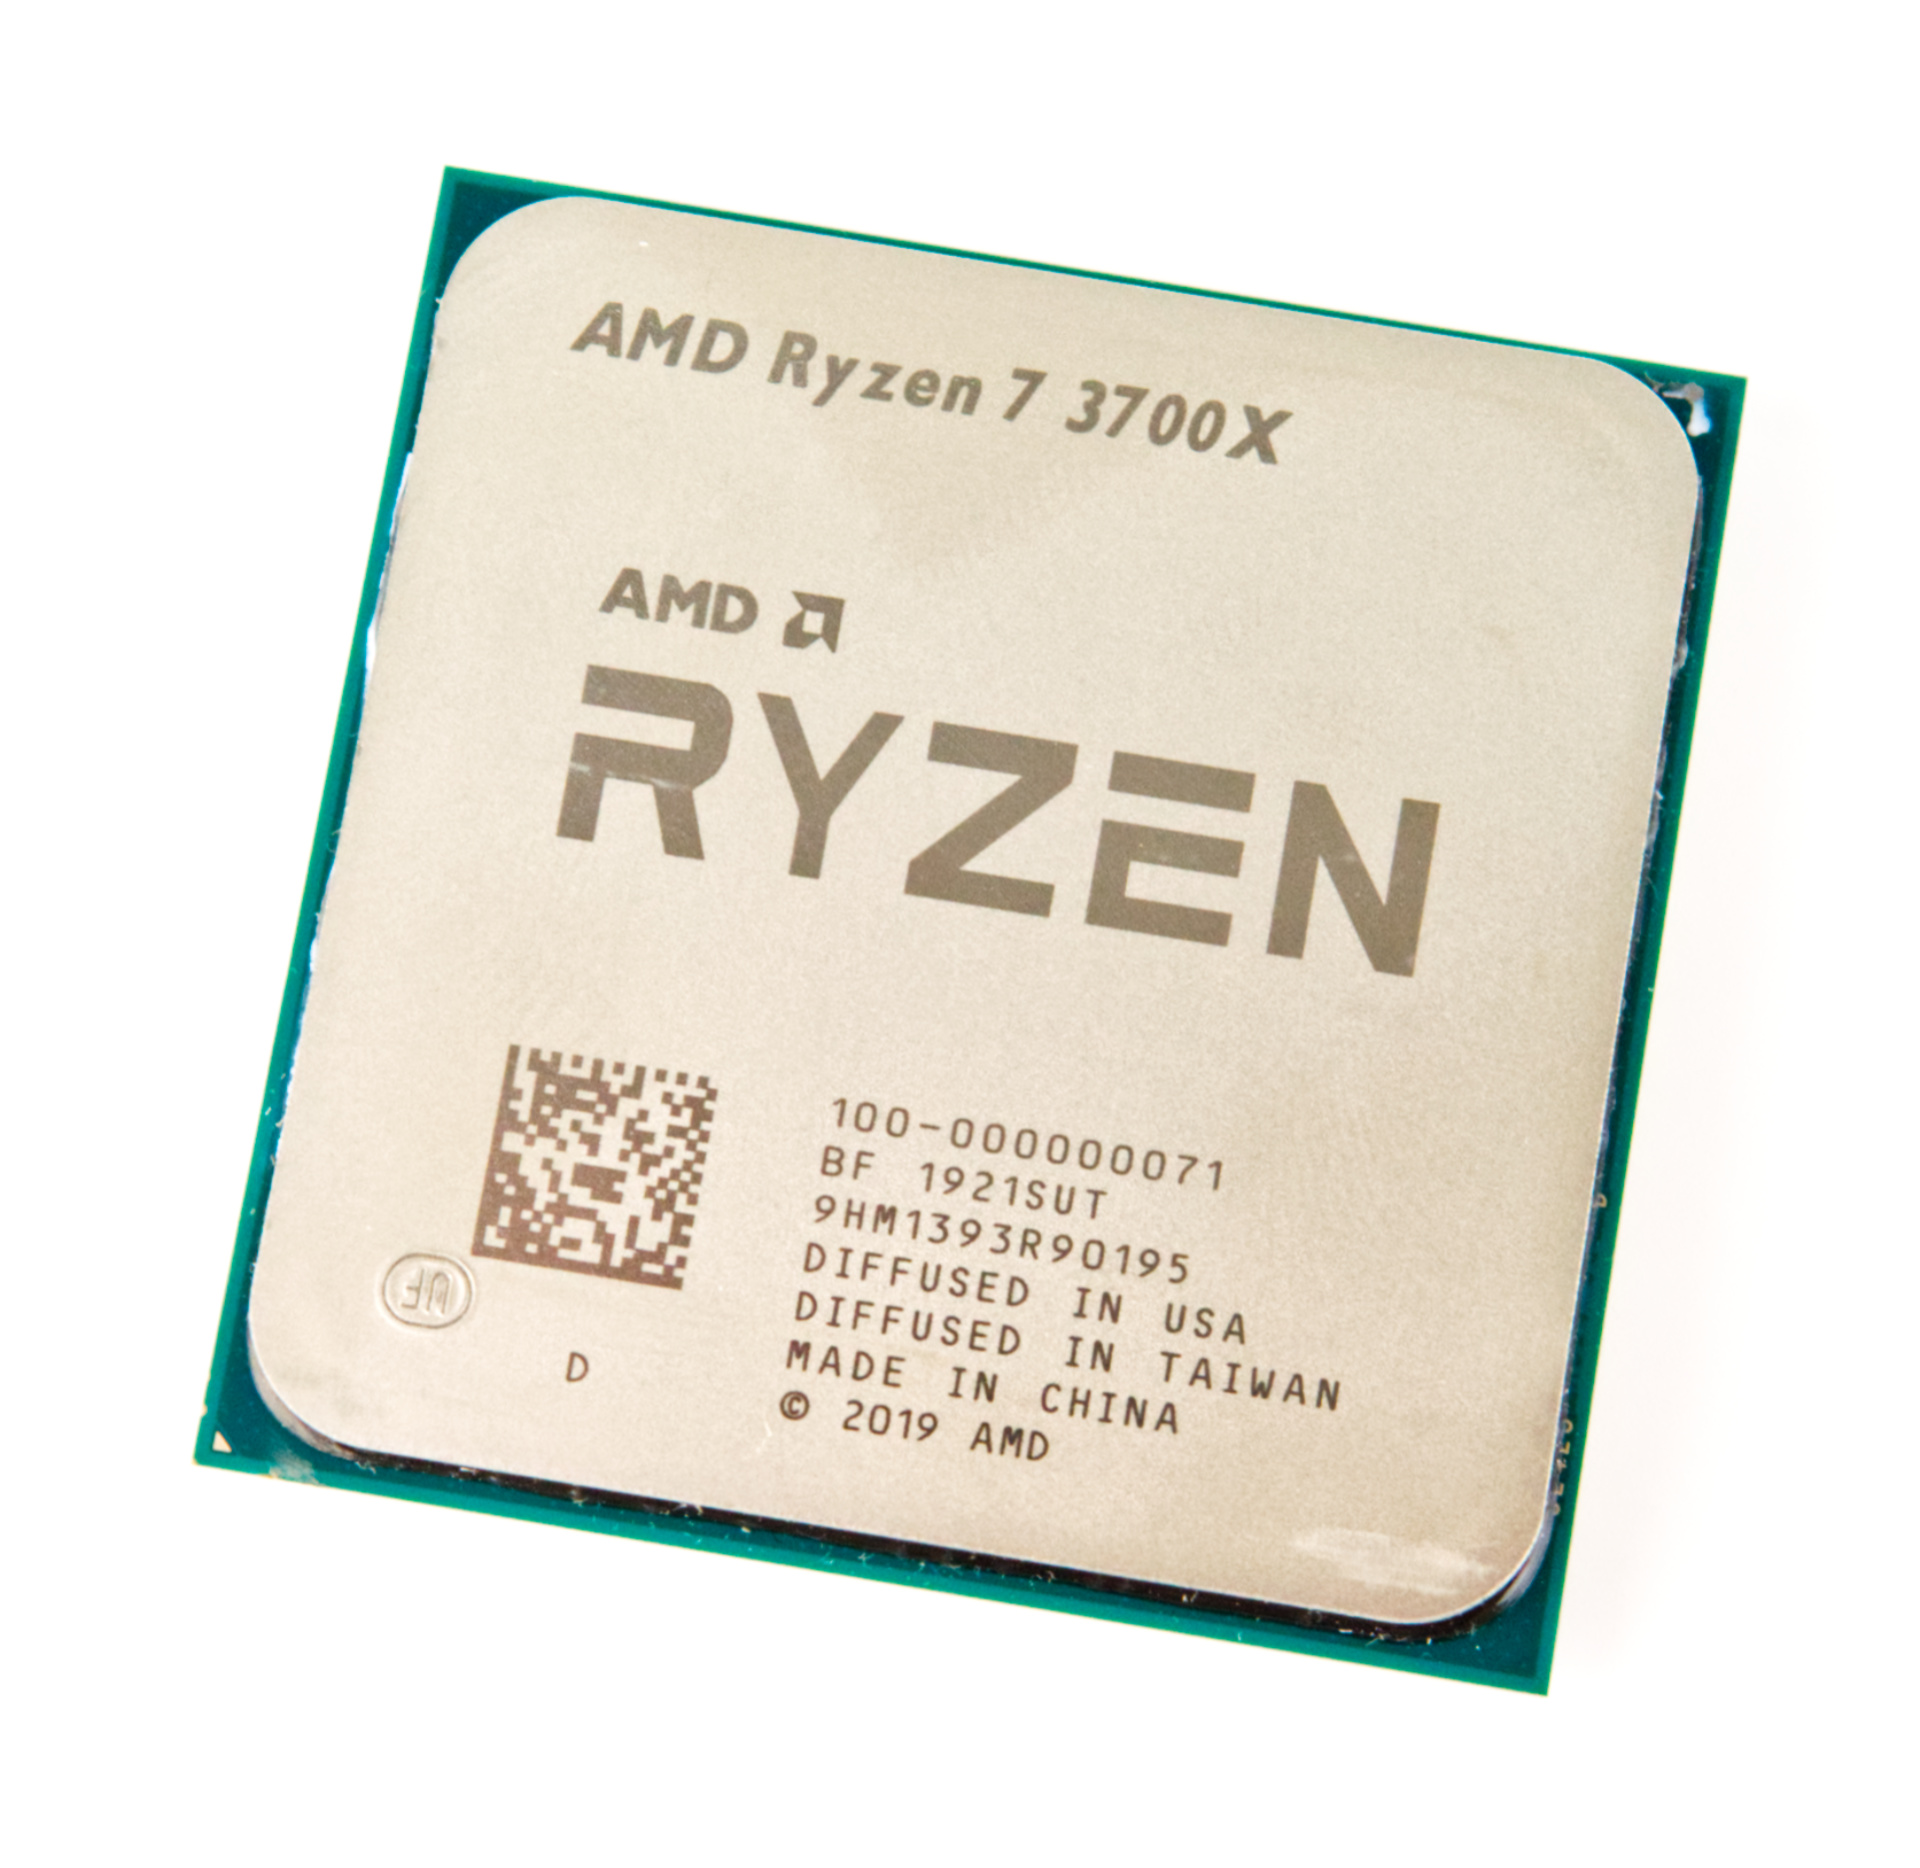
Der AMD Ryzen 7 3700X ist ein Desktop-Prozessor mit 8-Kernen und Hyperthreading (SMT), weshalb dieser 16 Threads gleichzeitig verarbeiten kann. Mit dem Launch am 07.07.2019 ist er nach dem Ryzen 7 3800X der zweitschnellste Ryzen 7 Prozessor und mit 65 Watt TDP deutlich sparsamer als das schnellste Ryzen 7 Modell.

Der Ryzen 7 3700X taktet mit 3,6 GHz Basistakt und kann per Turbo auf bis zu 4,4 GHz takten. Bei Last aller 8 Kerne erreicht der Ryzen 7 3700X maximal 4,1 GHz. Dank des Precision Boost 2 kann der Takt auf einem höheren Level gehalten werden, wie wir es schon von Zen+ her kennen.

Die Leistung des AMD Ryzen 7 3700X ist durchweg bei allen Anwendungen hervorragend. Vor allem bei Multi-Thread-Anwendungen kann hier der native 8-Kerner seine Stärken ausspielen und trotz der geringen TDP ist der Intel Core i9-9900K in Reichweite. Die beiden CCX-Cluster bestehend aus jeweils 4 CPU-Kernen befinden sich in einem CCD (je 4 Kerne mit eigenem 16 MByte L3 Cache). Dieser ist genau 74 mm² groß und wird im neuen 7 nm Verfahren bei TSMC gefertigt. Der I/O-Die ist separiert und kommt im mit der älteren 12 nm Strukturbreite daher, welcher weiterhin von Gobalfoundries gefertigt. 

Bei Spielen kann der AMD Ryzen 7 3700X dank der verbesserten IPC überzeugen. In Spielen erreicht der Ryzen 7 3700X etwa die Leistung eines Intel Core i7-8700K. Geschlagen geben muss sich der Ryzen momentan allerdings trotzdem, denn in den meisten Spielen bietet der Coffee-Lake-Prozessor etwas mehr Leistung. Zukünftige Unterstützung von mehr Kernen können das Blatt schnell wenden. 

AMD Ryzen 5 7600X

► remove from comparison AMD R5 7600X

The AMD Ryzen 5 7600X is a fast mid-range desktop processor of the Raphael series. It offers 6 cores based on the Zen 4 architecture that supports hyperthreading (12 threads). The cores clock from 4.7 (base) up to 5.7 GHz (single core boost). When all 6 cores are fully loaded, 5.3 GHz is the max. clock speed. 

The performance of the R5 7600X is clearly better than the old Ryzen 5 5600X thanks to the improved architecture and modern 5nm process. The single core performance is very good thanks to the high turbo clock speed (-400 MHz compared to the high end CPUs like the Ryzen 9 7950X). The multi-threaded performance is of course not that competitive due to only 6 cores.

The Raphael series still uses a chiplet design with two CCD-clusters (each with 8 possible cores) in 5nm and an IO-die (including the memory controller and the Radeon Graphics iGPU) in 6nm.

The R5 7600X is rated 105 Watt TDP and Raphael is rather power hungry compared to the 5000 series.

AMD Ryzen 7 7800X3D

► remove from comparison AMD R7 7800X3D

The AMD Ryzen 7 7800X3D is a high-end desktop processor from the Raphael series with 8 Zen 4 cores and SMT (Simultaneous Multithreading), allowing it to handle up to 16 threads simultaneously. After its announcement in January 2023 at CES in Las Vegas, it was launched in April 2023. Following the launch of the two top models, the AMD Ryzen 9 7900X3D and the AMD Ryzen 9 7950X3D, the third model was introduced, which offers significantly more gaming performance with the 3D V-Cache.

The CPU cores have a base clock of 4.2 GHz and can be boosted up to 5 GHz (single-core turbo). The AMD Ryzen 7 7800X3D features a CCD with 8 cores, which includes the fast 3D V-Cache. This differs significantly from the two Ryzen 9 models, as they have two CCDs, but only one of them can utilize the 3D V-Cache.

The performance of the AMD Ryzen 7 7800X3D is consistently good, although its multi-threaded performance suffers a bit due to the eight native compute cores. However, the real strength of the AMD Ryzen 7 7800X3D lies in gaming performance, where it excels. In tests, we see consistently high gaming performance, even surpassing that of an Intel Core i9-13900K.

In terms of power consumption, the AMD Ryzen 7 7800X3D aligns with the other two models featuring 3D V-Cache, making the 8-core processor extremely power-efficient. In numbers, this means that the AMD Ryzen 7 7800X3D is specified with a TDP of up to 120 watts. The PPT (Package Power Tracking) is also rated up to 162 watts. For comparison, an AMD Ryzen 9 7950X is specified with 170 watts (TDP) or 230 watts (PPT).

ModelAMD Ryzen 7 3700XAMD Ryzen 5 7600XAMD Ryzen 7 7800X3D
CodenameMatisse (Zen 2)Raphael (Zen4)Raphael (Zen4)
SeriesAMD Matisse (Ryzen 3000 Desktop)AMD Raphael (Zen 4, Ryzen 7000)AMD Raphael (Zen 4, Ryzen 7000)
Series: Raphael (Zen 4, Ryzen 7000) Raphael (Zen4)
AMD Ryzen 9 3950X3.5 - 4.7 GHz16 / 32 cores64 MB L3
AMD Ryzen 9 3900X3.8 - 4.6 GHz12 / 24 cores64 MB L3
AMD Ryzen 9 39003.1 - 4.3 GHz12 / 24 cores64 MB L3
AMD Ryzen 7 3800XT3.9 - 4.7 GHz8 / 16 cores32 MB L3
AMD Ryzen 7 3700X « 3.6 - 4.4 GHz8 / 16 cores32 MB L3
AMD Ryzen 3 3300X3.8 - 4.3 GHz4 / 8 cores16 MB L3
AMD Ryzen 3 31003.6 - 3.9 GHz4 / 8 cores16 MB L3
AMD Ryzen 9 7950X3D4.2 - 5.7 GHz16 / 32 cores128 MB L3
AMD Ryzen 9 7900X4.7 - 5.6 GHz12 / 24 cores64 MB L3
AMD Ryzen 9 79003.7 - 5.4 GHz12 / 24 cores64 MB L3
AMD Ryzen 7 7700X4.5 - 5.4 GHz8 / 16 cores32 MB L3
AMD Ryzen 7 77003.8 - 5.3 GHz8 / 16 cores32 MB L3
AMD Ryzen 7 7800X3D4.2 - 5 GHz8 / 16 cores96 MB L3
AMD Ryzen 5 7600X « 4.7 - 5.3 GHz6 / 12 cores32 MB L3
AMD Ryzen 5 76003.8 - 5.1 GHz6 / 12 cores32 MB L3
AMD Ryzen 9 7950X3D4.2 - 5.7 GHz16 / 32 cores128 MB L3
AMD Ryzen 9 7900X4.7 - 5.6 GHz12 / 24 cores64 MB L3
AMD Ryzen 9 79003.7 - 5.4 GHz12 / 24 cores64 MB L3
AMD Ryzen 7 7700X4.5 - 5.4 GHz8 / 16 cores32 MB L3
AMD Ryzen 7 77003.8 - 5.3 GHz8 / 16 cores32 MB L3
AMD Ryzen 7 7800X3D « 4.2 - 5 GHz8 / 16 cores96 MB L3
AMD Ryzen 5 7600X4.7 - 5.3 GHz6 / 12 cores32 MB L3
AMD Ryzen 5 76003.8 - 5.1 GHz6 / 12 cores32 MB L3
Clock3600 - 4400 MHz4700 - 5300 MHz4200 - 5000 MHz
L1 Cache512 KB384 KB512 KB
L2 Cache4 MB6 MB8 MB
L3 Cache32 MB32 MB96 MB
Cores / Threads8 / 166 / 128 / 16
TDP65 Watt105 Watt120 Watt
Technology7 nm5 nm5 nm
max. Temp.95 °C95 °C89 °C
SocketAM4 (LGA1331)AM5 (LGA 1718)AM5 (LGA 1718)
FeaturesDDR4-3200 RAM, PCIe 4, MMX, SSE, SSE2, SSE3, SSSE3, SSE4A, SSE4.1, SSE4.2, AVX, AVX2, BMI2, ABM, FMA, ADX, SMEP, SMAP, SMT, CPB, AES-NI, RDRAND, RDSEED, SHA, SMEMMX(+), SSE, SSE2, SSE3, SSSE3, SSE4.1, SSE4.2, SSE4A, x86-64, AMD-V, AES, AVX, AVX2, AVX512F, FMA3, SHA, Precision Boost 2MMX, SSE, SSE2, SSE3, SSSE3, SSE4.1, SSE4.2, SSE4A, x86-64, AMD-V, AES, AVX, AVX2, AVX512, BMI1, BMI2, F16C, FMA3, AMD64, EVP, AMD-V, SMAP, SMEP, SMT SHA, XFR2, Precision Boost 2
Architecturex86x86x86
$329 U.S.$449 U.S.
Announced
Manufacturerwww.amd.comwww.amd.com
TransistorsCCD: 6,5 Mrd + IOD: 3,4 Mrd Million6570 Million
Voltage0.650 - 1.475V V1.1 - 1.2 V
Die Size1x 70 (CCD) mm2 + 122 (I/O) mm2193 mm2
iGPUAMD Radeon Graphics (Ryzen 7000) (400 - 2200 MHz)AMD Radeon Graphics (Ryzen 7000) (400 - 2200 MHz)
TDP Turbo PL2162 Watt

Benchmarks

Performance Rating - CB R15 + R20 + 7-Zip + X265 + Blender + 3DM11 CPU - R7 3700X
33.3 pt (55%)
Restrict / Search: Model: Max. age: years
Performance Rating - CB R15 + R20 + 7-Zip + X265 + Blender + 3DM11 CPU - R5 7600X
44.1 pt (73%)
Restrict / Search: Model: Max. age: years
Performance Rating - CB R15 + R20 + 7-Zip + X265 + Blender + 3DM11 CPU - R7 7800X3D
42.3 pt (70%)
Restrict / Search: Model: Max. age: years
Cinebench R23 - Cinebench R23 Multi Core
min: 15006     avg: 15252     median: 15236 (14%)     max: 15510 Points
min: 16688     avg: 17197     median: 16817 (16%)     max: 18086 Points
Cinebench R23 - Cinebench R23 Single Core
min: 1953     avg: 1964     median: 1965 (83%)     max: 1967 Points
min: 1646     avg: 1726     median: 1713 (72%)     max: 1820 Points
Cinebench R20 - Cinebench R20 CPU (Single Core)
506 Points (55%)
min: 759     avg: 761     median: 761 (83%)     max: 764 Points
min: 663     avg: 686     median: 686 (75%)     max: 709 Points
Cinebench R20 - Cinebench R20 CPU (Multi Core)
4782 Points (12%)
min: 5882     avg: 5973     median: 5966 (15%)     max: 6076 Points
min: 6488     avg: 6805     median: 6804.5 (17%)     max: 7121 Points
Cinebench R15 - Cinebench R15 CPU Multi 64 Bit
2092 Points (13%)
min: 2434     avg: 2504     median: 2517 (16%)     max: 2536 Points
min: 2783     avg: 2879     median: 2878.5 (18%)     max: 2974 Points
Cinebench R15 - Cinebench R15 CPU Single 64 Bit
204 Points (57%)
min: 311     avg: 313.7     median: 314 (87%)     max: 315 Points
min: 272     avg: 281.5     median: 281.5 (78%)     max: 291 Points
Cinebench R11.5 - Cinebench R11.5 CPU Multi 64 Bit
23.2 Points (30%)
min: 27.79     avg: 28.3     median: 28.3 (37%)     max: 28.69 Points
33.5 Points (43%)
Cinebench R11.5 - Cinebench R11.5 CPU Single 64 Bit
2.3 Points (55%)
min: 3.68     avg: 3.7     median: 3.7 (88%)     max: 3.72 Points
3.4 Points (81%)
Cinebench R10 - Cinebench R10 Rend. Single (32bit)
5839 Points (35%)
min: 8212     avg: 8455     median: 8480 (51%)     max: 8631 Points
8026 Points (48%)
Cinebench R10 - Cinebench R10 Rend. Multi (32bit)
40439 Points (29%)
min: 48381     avg: 49427     median: 49430 (36%)     max: 49837 Points
51950 Points (38%)
Cinebench R10 - Cinebench R10 Rend. Multi (64bit)
66813 Points (43%)
min: 88546     avg: 90010     median: 90309 (58%)     max: 91222 Points
94035 Points (60%)
Cinebench R10 - Cinebench R10 Rend. Single (64bit)
10189 Points (12%)
min: 15797     avg: 15925     median: 15948 (19%)     max: 16010 Points
14485 Points (18%)
wPrime 2.10 - wPrime 2.0 1024m *
86.7 s (1%)
min: 74.491     avg: 78.5     median: 78.8 (1%)     max: 82.19 s
62.7 s (1%)
wPrime 2.10 - wPrime 2.0 32m *
3.7 s (1%)
min: 2.709     avg: 2.8     median: 2.8 (1%)     max: 2.933 s
2.4 s (0%)
WinRAR - WinRAR 4.0
7503 Points (12%)
16178 Points (26%)
16585 Points (26%)
7-Zip 18.03 - 7-Zip 18.03 Multi Thread 4 runs
57307 MIPS (33%)
min: 65569     avg: 68816     median: 69291 (40%)     max: 70615 MIPS
min: 75558     avg: 80313     median: 80312.5 (46%)     max: 85067 MIPS
7-Zip 18.03 - 7-Zip 18.03 Single Thread 4 runs
5333 MIPS (63%)
min: 7661     avg: 7993     median: 8058 (95%)     max: 8101 MIPS
min: 7412     avg: 7824     median: 7823.5 (92%)     max: 8235 MIPS
X264 HD Benchmark 4.0 - x264 Pass 2
115 fps (38%)
147.8 fps (49%)
169.3 fps (57%)
X264 HD Benchmark 4.0 - x264 Pass 1
269.5 fps (62%)
367 fps (85%)
344 fps (79%)
HWBOT x265 Benchmark v2.2 - HWBOT x265 4k Preset
15.4 fps (27%)
min: 20.2     avg: 20.9     median: 21 (37%)     max: 21.4 fps
min: 22.1     avg: 23.3     median: 23.3 (41%)     max: 24.4 fps
TrueCrypt - TrueCrypt Serpent
1.1 GB/s (32%)
1.1 GB/s (32%)
1.3 GB/s (38%)
TrueCrypt - TrueCrypt Twofish
2 GB/s (34%)
1.8 GB/s (31%)
2.1 GB/s (36%)
TrueCrypt - TrueCrypt AES
11.4 GB/s (30%)
13.2 GB/s (34%)
15.3 GB/s (40%)
Blender - Blender 3.3 Classroom CPU *
min: 322     avg: 329.6     median: 328 (4%)     max: 344 Seconds
min: 266     avg: 282.5     median: 282.5 (4%)     max: 299 Seconds
Blender - Blender 2.79 BMW27 CPU *
181.4 Seconds (1%)
min: 202     avg: 206.1     median: 205 (1%)     max: 214 Seconds
min: 169     avg: 178     median: 178 (1%)     max: 187 Seconds
R Benchmark 2.5 - R Benchmark 2.5 *
min: 0.3726     avg: 0.4     median: 0.4 (8%)     max: 0.395 sec
min: 0.4152     avg: 0.4     median: 0.4 (9%)     max: 0.4479 sec
3DMark 06 - CPU - 3DMark 06 - CPU
min: 13739     avg: 13815     median: 13814.5 (29%)     max: 13890 Points
min: 16979     avg: 17291     median: 17290.5 (37%)     max: 17602 Points
16892 Points (36%)
Super Pi mod 1.5 XS 1M - Super Pi mod 1.5 XS 1M *
9.4 s (2%)
7.4 s (2%)
7.1 s (2%)
Super Pi mod 1.5 XS 2M - Super Pi mod 1.5 XS 2M *
20.5 s (1%)
16 s (1%)
15.3 s (1%)
Super Pi Mod 1.5 XS 32M - Super Pi mod 1.5 XS 32M *
531 s (2%)
367.1 s (2%)
337.6 s (1%)
3DMark Vantage - 3DM Vant. Perf. CPU no Physx
min: 68137     avg: 68140     median: 68139.5 (52%)     max: 68142 Points
min: 82479     avg: 83000     median: 82999.5 (64%)     max: 83520 Points
97391 Points (75%)
3DMark 11 - 3DM11 Performance Physics
min: 18222     avg: 18284     median: 18283.5 (45%)     max: 18345 Points
min: 25396     avg: 25731     median: 25731 (63%)     max: 26066 Points
min: 30767     avg: 32947     median: 32947 (81%)     max: 35127 Points
3DMark - 3DMark Ice Storm Physics
min: 79765     avg: 80527     median: 80526.5 (65%)     max: 81288 Points
min: 92244     avg: 98319     median: 98318.5 (80%)     max: 104393 Points
89617 Points (73%)
3DMark - 3DMark Ice Storm Extreme Physics
min: 79983     avg: 80252     median: 80252 (65%)     max: 80521 Points
min: 92907     avg: 98466     median: 98466 (80%)     max: 104025 Points
89287 Points (72%)
3DMark - 3DMark Ice Storm Unlimited Physics
min: 83056     avg: 83138     median: 83137.5 (67%)     max: 83219 Points
min: 94868     avg: 99772     median: 99772 (80%)     max: 104676 Points
91846 Points (74%)
3DMark - 3DMark Cloud Gate Physics
min: 15953     avg: 16379     median: 16378.5 (41%)     max: 16804 Points
min: 19327     avg: 19377     median: 19377 (49%)     max: 19427 Points
25510 Points (65%)
3DMark - 3DMark Fire Strike Standard Physics
min: 23423     avg: 23951     median: 23951 (43%)     max: 24479 Points
min: 30671     avg: 30681     median: 30681 (55%)     max: 30691 Points
min: 30333     avg: 31455     median: 30687 (55%)     max: 33345 Points
3DMark - 3DMark Time Spy CPU
min: 9909     avg: 9944     median: 9943.5 (42%)     max: 9978 Points
min: 10458     avg: 10645     median: 10645 (45%)     max: 10832 Points
min: 10908     avg: 12327     median: 11975 (50%)     max: 14098 Points
Geekbench 6.4 - Geekbench 6.4 Single-Core
1740 Points (43%)
2634 Points (66%)
Geekbench 6.4 - Geekbench 6.4 Multi-Core
9145 Points (36%)
14288 Points (55%)
Geekbench 6.0 - Geekbench 6.0 Single-Core
2175 Points (69%)
Geekbench 6.0 - Geekbench 6.0 Multi-Core
12046 Points (49%)
Geekbench 5.5 - Geekbench 5.1 - 5.5 64 Bit Single-Core
1304 Points (51%)
min: 2159     avg: 2212     median: 2217 (87%)     max: 2230 Points
min: 1856     avg: 1934     median: 1920 (75%)     max: 2027 Points
Geekbench 5.5 - Geekbench 5.1 - 5.5 64 Bit Multi-Core
8960 Points (16%)
min: 11093     avg: 11914     median: 12003 (22%)     max: 12185 Points
min: 12073     avg: 13013     median: 12715 (23%)     max: 14252 Points
Geekbench 5.0 - Geekbench 5.0 64 Bit Single-Core
min: 2070     avg: 2120     median: 2126 (9%)     max: 2137 Points
1938 Points (8%)
Geekbench 5.0 - Geekbench 5.0 64 Bit Multi-Core
min: 11123     avg: 11886     median: 11982 (38%)     max: 12112 Points
13888 Points (44%)
Geekbench 4.4 - Geekbench 4.1 - 4.4 64 Bit Single-Core
5799 Points (58%)
min: 8596     avg: 8967     median: 9021 (90%)     max: 9048 Points
9097 Points (91%)
Geekbench 4.4 - Geekbench 4.1 - 4.4 64 Bit Multi-Core
34757 Points (35%)
min: 45422     avg: 47461     median: 47694 (48%)     max: 48205 Points
54840 Points (55%)
Mozilla Kraken 1.1 - Kraken 1.1 Total Score *
min: 441     avg: 447.8     median: 448 (1%)     max: 451 ms
min: 487     avg: 504     median: 503.5 (1%)     max: 520 ms
WebXPRT 4 - WebXPRT 4 Score
min: 295     avg: 298.3     median: 298 (82%)     max: 302 Points
282 Points (77%)
WebXPRT 3 - WebXPRT 3 Score
min: 356     avg: 373.3     median: 370.5 (67%)     max: 395 Points
353 Points (63%)
CrossMark - CrossMark Overall
min: 2104     avg: 2186     median: 2193 (82%)     max: 2256 Points
2216 Points (83%)
Power Consumption - Prime95 Power Consumption - external Monitor *
170.3 Watt (29%)
227 Watt (39%)
218 Watt (38%)
Power Consumption - Cinebench R15 Multi Power Consumption - external Monitor *
171.6 Watt (31%)
215 Watt (39%)
207 Watt (38%)
Power Consumption - Idle Power Consumption - external Monitor *
91.5 Watt (61%)
121.6 Watt (80%)
Power Consumption - Power Efficiency - Cinebench R15 Multi external Monitor
12.2 Points per Watt (9%)
11.7 Points per Watt (9%)
14.4 Points per Watt (11%)

Average Benchmarks AMD Ryzen 7 3700X → 100% n=38

Average Benchmarks AMD Ryzen 5 7600X → 132% n=38

Average Benchmarks AMD Ryzen 7 7800X3D → 139% n=38

- Range of benchmark values for this graphics card
red legend - Average benchmark values for this graphics card
* Smaller numbers mean a higher performance
1 This benchmark is not used for the average calculation

v1.33
log 11. 08:13:49

#0 ran 0s before starting gpusingle class +0s ... 0s

#1 checking url part for id 11443 +0s ... 0s

#2 checking url part for id 14615 +0s ... 0s

#3 checking url part for id 15064 +0s ... 0s

#4 redirected to Ajax server, took 1754892829s time from redirect:0 +0s ... 0s

#5 did not recreate cache, as it is less than 5 days old! Created at Sun, 10 Aug 2025 05:18:26 +0200 +0s ... 0s

#6 composed specs +0.004s ... 0.004s

#7 did output specs +0s ... 0.004s

#8 getting avg benchmarks for device 11443 +0.004s ... 0.008s

#9 got single benchmarks 11443 +0.005s ... 0.014s

#10 getting avg benchmarks for device 14615 +0.004s ... 0.017s

#11 got single benchmarks 14615 +0.009s ... 0.026s

#12 getting avg benchmarks for device 15064 +0.003s ... 0.03s

#13 got single benchmarks 15064 +0.001s ... 0.03s

#14 got avg benchmarks for devices +0s ... 0.03s

#15 min, max, avg, median took s +0.057s ... 0.087s

#16 return log +0s ... 0.087s

Please share our article, every link counts!
Mail Logo
> Expert Reviews and News on Laptops, Smartphones and Tech Innovations > Benchmarks / Tech > Processor Comparison - Head 2 Head
Redaktion, 2017-09- 8 (Update: 2023-07- 1)