AMD Ryzen 5 2600X vs AMD Ryzen 5 PRO 2500U
AMD Ryzen 5 2600X ► remove from comparison
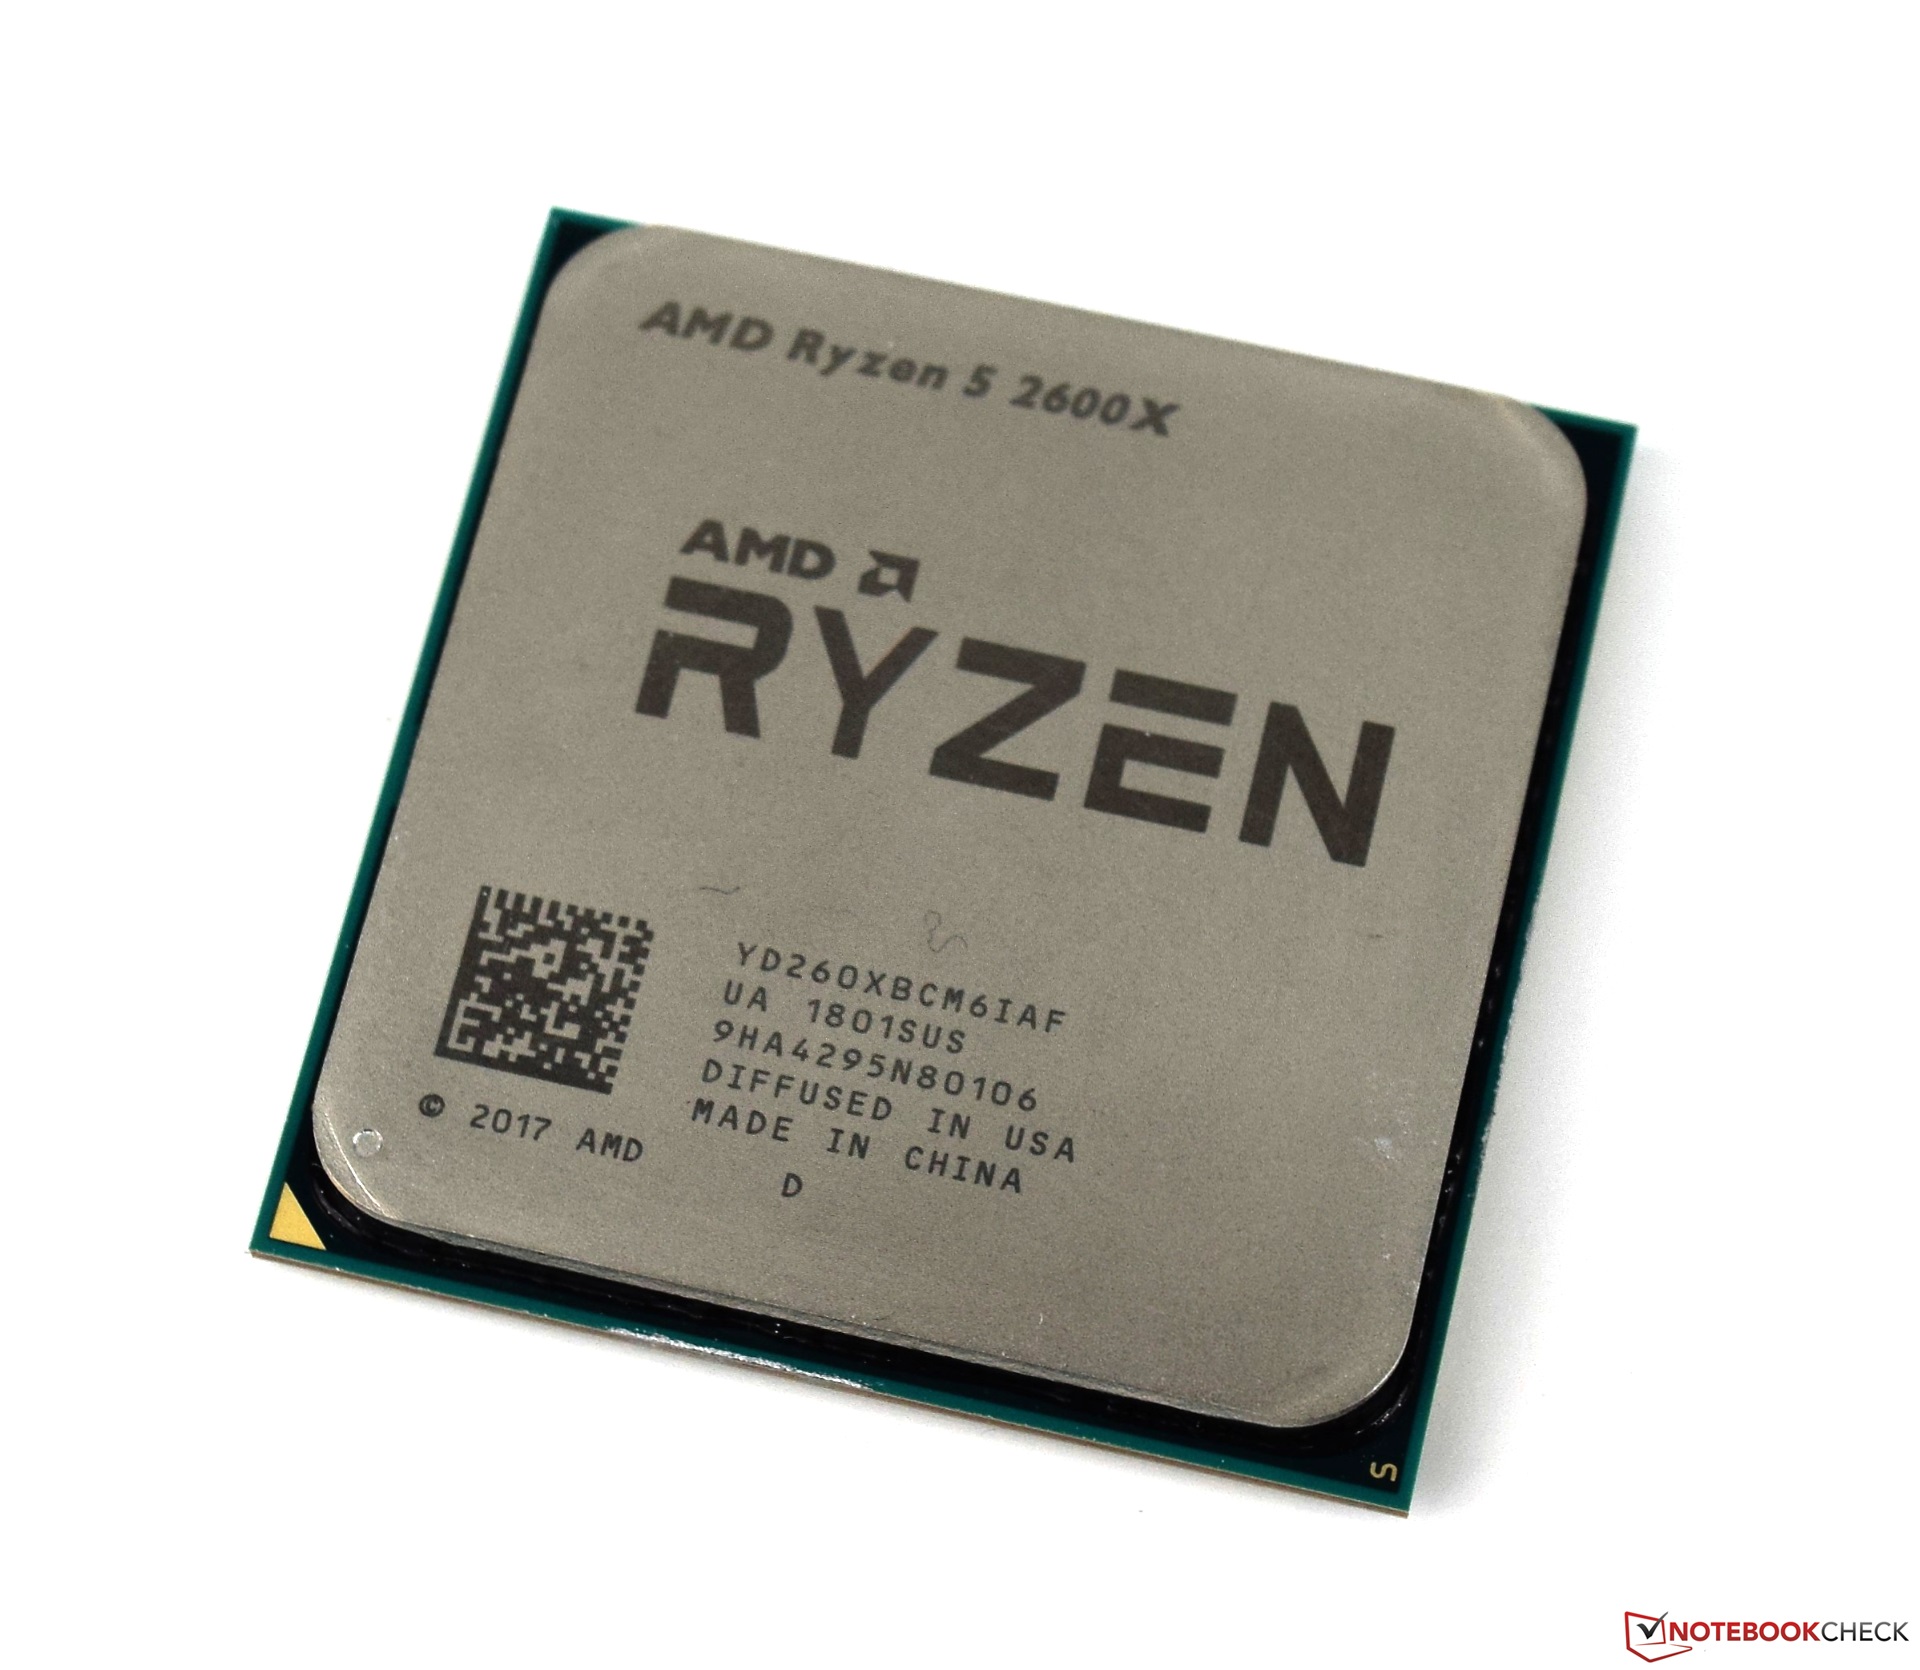
The AMD Ryzen 5 2600X is a high-end desktop processor with 6 cores (12 threads) that was announced early 2018. It is based on the revised Zen+ cores and at launch the second fastest Ryzen CPU behind the Ryzen 7 2700X. The CPU cores clock at 3.6 GHz base and using Precision Boost 2 up to 4.2 GHz. All 6 cores and 12 threads can clock up to 3.9 GHz. The 6 cores are divided in two cluster (3 cores each with own L3 cache) connected via Infinity Fabric.
Compared to the older first Ryzen generation (e.g., Ryzen 5 1600X), the second generation is manufactured in an improved process (12nm called), offers and improved Precision Boost 2 (especially in partial load of the cores) and faster cache and memory speeds.
See our second generation Ryzen review for detailed benchmarks and information.
AMD Ryzen 5 PRO 2500U ► remove from comparison
The AMD Ryzen 5 PRO 2500U is a mobile APU for thin and light business laptops that was announced in January 2017. Compared to the similar consumer Ryzen 5 2500U , the PRO 2500U offers additional security features and longer part availability / warranty.
It includes four Zen cores clocked at 2 to 3.6 GHz and offers 4 MB L3-Cache. The integrated graphics card is called Radeon RX Vega 8 and offers 8 CUs (512 Shaders) clocked at up to 1100 MHz. The TDP is configurable between 12 and 25 Watt (15 Watt nominal). More information on Raven Ridge can be found in our launch article.
Model AMD Ryzen 5 2600X AMD Ryzen 5 PRO 2500U Series AMD Ryzen 5 AMD Raven Ridge (Ryzen 2000 APU) Codename Zen+ Zen Clock 3600 - 4200 MHz 2000 - 3600 MHz L2 Cache 4 MB 2 MB L3 Cache 16 MB 4 MB Cores / Threads 6 / 12 4 / 8 TDP 95 Watt 15 Watt Transistors 4940 Million 4500 Million Technology 12 nm 14 nm Die Size 209.78 mm2 Socket AM4 (1331) AM4 Features SSE4.2, SSE4A, AMD-V, AES, AVX2, FMA3, SHA XFR, FMA3, SSE 4.2, AVX2, SMT Architecture x86 x86 $229 U.S. Announced Series: Raven Ridge (Ryzen 2000 APU) Zen L1 Cache 384 KB max. Temp. 105 °C iGPU AMD Radeon RX Vega 8 (Ryzen 2000/3000) ( - 1100 MHz)Manufacturer www.amd.com
Benchmarks Performance Rating - CB R15 + R20 + 7-Zip + X265 + Blender + 3DM11 CPU - R5 2600X
31 pt (43%)
...
...
Cinebench R20 - Cinebench R20 CPU (Single Core)
421 Points (47%)
Cinebench R20 - Cinebench R20 CPU (Multi Core)
2688 Points (7%)
Cinebench R15 - Cinebench R15 CPU Multi 64 Bit
1341 Points (8%)
min: 541 avg: 561 median: 553 (3%) max: 589 Points
Cinebench R15 - Cinebench R15 CPU Single 64 Bit
163 Points (49%)
min: 132 avg: 135 median: 134 (40%) max: 139 Points
Cinebench R11.5 - Cinebench R11.5 CPU Multi 64 Bit
14.6 Points (19%)
min: 6.04 avg: 6.3 median: 6.1 (8%) max: 6.74 Points
Cinebench R11.5 - Cinebench R11.5 CPU Single 64 Bit
1.8 Points (45%)
min: 1.5 avg: 1.5 median: 1.6 (39%) max: 1.58 Points
Cinebench R10 - Cinebench R10 Rend. Single (32bit)
4958 Points (30%)
min: 4204 avg: 4312 median: 4349 (26%) max: 4382 Points
Cinebench R10 - Cinebench R10 Rend. Multi (32bit)
29954 Points (22%)
min: 12294 avg: 14380 median: 14336 (10%) max: 16509 Points
Cinebench R10 - Cinebench R10 Rend. Multi (64bit)
48146 Points (33%)
min: 20209 avg: 20660 median: 20659.5 (14%) max: 21110 Points
Cinebench R10 - Cinebench R10 Rend. Single (64bit)
8272 Points (10%)
min: 6921 avg: 7052 median: 7052 (9%) max: 7183 Points
wPrime 2.10 - wPrime 2.0 1024m *
133.8 s (2%)
min: 386.4 avg: 386.6 median: 386.6 (5%) max: 386.7 s
wPrime 2.10 - wPrime 2.0 32m *
4.6 s (1%)
min: 12.25 avg: 12.4 median: 12.4 (2%) max: 12.47 s
4599 Points (7%)
min: 2677 avg: 2700 median: 2699.5 (4%) max: 2722 Points
7-Zip 18.03 - 7-Zip 18.03 Multli Thread 4 runs
33222 MIPS (19%)
2794 MIPS (2%)
7-Zip 18.03 - 7-Zip 18.03 Single Thread 4 runs
4293 MIPS (51%)
4102 MIPS (49%)
X264 HD Benchmark 4.0 - x264 Pass 2
80.5 fps (28%)
min: 32.42 avg: 33.9 median: 33.9 (12%) max: 35.4 fps
X264 HD Benchmark 4.0 - x264 Pass 1
207.4 fps (48%)
min: 68.4 avg: 97.7 median: 97.7 (23%) max: 127 fps
HWBOT x265 Benchmark v2.2 - HWBOT x265 4k Preset
8.3 fps (15%)
3 fps (5%)
TrueCrypt - TrueCrypt Serpent
0.8 GB/s (0%)
min: 0.376 avg: 0.4 median: 0.4 (0%) max: 0.409 GB/s
TrueCrypt - TrueCrypt Twofish
1.2 GB/s (21%)
min: 0.54 avg: 0.6 median: 0.6 (10%) max: 0.662 GB/s
TrueCrypt - TrueCrypt AES
8 GB/s (21%)
min: 3.3 avg: 3.4 median: 3.4 (9%) max: 3.5 GB/s
Blender - Blender 2.79 BMW27 CPU *
min: 350 avg: 352 median: 352 (2%) max: 353.9 Seconds
min: 900 avg: 1007 median: 1007 (7%) max: 1114 Seconds
R Benchmark 2.5 - R Benchmark 2.5 *
0.6 sec (14%)
3DMark 06 - CPU - 3DMark 06 - CPU
min: 3945 avg: 5161 median: 5635 (12%) max: 5904 Points
Super Pi mod 1.5 XS 1M - Super Pi mod 1.5 XS 1M *
11.4 s (2%)
min: 12.56 avg: 12.7 median: 12.7 (3%) max: 12.84 s
Super Pi mod 1.5 XS 2M - Super Pi mod 1.5 XS 2M *
24.8 s (1%)
min: 28.85 avg: 29.4 median: 29.3 (1%) max: 29.84 s
Super Pi Mod 1.5 XS 32M - Super Pi mod 1.5 XS 32M *
616 s (3%)
min: 714 avg: 729 median: 728.5 (3%) max: 743 s
3DMark Vantage - 3DM Vant. Perf. CPU no Physx
45760 Points (40%)
3DMark 11 - 3DM11 Performance Physics
12074 Points (33%)
min: 5540 avg: 5874 median: 5673 (15%) max: 6608 Points
3DMark - 3DMark Ice Storm Physics
73430 Points (60%)
min: 34587 avg: 35370 median: 35245 (29%) max: 36279 Points
3DMark - 3DMark Ice Storm Extreme Physics
73424 Points (60%)
min: 30318 avg: 33819 median: 35419 (29%) max: 35721 Points
3DMark - 3DMark Ice Storm Unlimited Physics
74442 Points (63%)
min: 28138 avg: 29521 median: 29789 (25%) max: 30637 Points
3DMark - 3DMark Cloud Gate Physics
11855 Points (30%)
min: 3259 avg: 5254 median: 5586.5 (14%) max: 6584 Points
3DMark - 3DMark Fire Strike Standard Physics
18091 Points (32%)
min: 6370 avg: 8014 median: 8405 (15%) max: 8877 Points
3DMark - 3DMark Time Spy CPU
6530 Points (28%)
min: 1922 avg: 2225 median: 2322 (10%) max: 2432 Points
Geekbench 5.5 - Geekbench 5.1 - 5.4 64 Bit Single-Core
min: 1066 avg: 1145 median: 1144.5 (48%) max: 1223 Points
887 Points (37%)
Geekbench 5.5 - Geekbench 5.1 - 5.4 64 Bit Multi-Core
min: 5816 avg: 6094 median: 6094 (11%) max: 6372 Points
3135 Points (6%)
Geekbench 5.0 - Geekbench 5.0 64 Bit Single-Core
1067 Points (5%)
Geekbench 5.0 - Geekbench 5.0 64 Bit Multi-Core
5939 Points (19%)
Geekbench 4.4 - Geekbench 4.1 - 4.4 64 Bit Single-Core
min: 4577 avg: 4642 median: 4641.5 (46%) max: 4706 Points
min: 3353 avg: 3492 median: 3492 (35%) max: 3631 Points
Geekbench 4.4 - Geekbench 4.1 - 4.4 64 Bit Multi-Core
min: 21616 avg: 22301 median: 22301 (24%) max: 22986 Points
min: 9096 avg: 9629 median: 9343 (10%) max: 10447 Points
Geekbench 4.0 - Geekbench 4.0 64 Bit Single-Core
min: 3430 avg: 3480 median: 3480 (47%) max: 3530 Points
Geekbench 4.0 - Geekbench 4.0 64 Bit Multi-Core
min: 9398 avg: 9760 median: 9759.5 (24%) max: 10121 Points
Geekbench 3 - Geekbench 3 32 Bit Multi-Core
min: 12111 avg: 12422 median: 12421.5 (22%) max: 12732 Points
Geekbench 3 - Geekbench 3 32 Bit Single-Core
min: 3218 avg: 3326 median: 3326 (65%) max: 3434 Points
Geekbench 3 - Geekbench 3 64 Bit Multi-Core
min: 12561 avg: 12956 median: 12956 (20%) max: 13351 Points
Geekbench 3 - Geekbench 3 64 Bit Single-Core
min: 3486 avg: 3600 median: 3600 (54%) max: 3714 Points
Geekbench 2 - 32 Bit - Geekbench Stream
min: 5889 avg: 6820 median: 6820 (55%) max: 7751 Points
Geekbench 2 - 32 Bit - Geekbench Memory
min: 5363 avg: 6035 median: 6034.5 (55%) max: 6706 Points
Geekbench 2 - 32 Bit - Geekbench Floating Point
min: 16158 avg: 16310 median: 16310 (32%) max: 16462 Points
Geekbench 2 - 32 Bit - Geekbench Integer
min: 10070 avg: 10169 median: 10168.5 (20%) max: 10267 Points
Geekbench 2 - 32 Bit - Geekbench Total Score
min: 10841 avg: 11156 median: 11156 (29%) max: 11471 Points
Mozilla Kraken 1.1 - Kraken 1.1 Total Score *
884 ms (1%)
min: 1376 avg: 1488 median: 1429 (2%) max: 1659 ms
Sunspider - Sunspider 1.0 Total Score *
138.1 ms (2%)
Octane V2 - Octane V2 Total Score
min: 23903 avg: 24308 median: 24308 (22%) max: 24713 Points
WebXPRT 3 - WebXPRT 3 Score
186 Points (39%)
Power Consumption - Prime95 Power Consumption - external Monitor *
171.7 Watt (30%)
Power Consumption - Cinebench R15 Multi Power Consumption - external Monitor *
164.4 Watt (30%)
Power Consumption - Cinebench R15 Multi Power Efficiency - external Monitor
8.2 Points per Watt (6%)
Average Benchmarks AMD Ryzen 5 2600X → 100% n=35 Average Benchmarks AMD Ryzen 5 PRO 2500U → 63% n=35
- Range of benchmark values for this graphics card
- Average benchmark values for this graphics card
* Smaller numbers mean a higher performance
1 This benchmark is not used for the average calculation
v1.26
log 02. 01:17:00
#0 checking url part for id 9980 +0s ... 0s
#1 checking url part for id 10130 +0s ... 0s
#2 not redirecting to Ajax server +0s ... 0s
#3 did not recreate cache, as it is less than 5 days old! Created at Sat, 01 Jun 2024 05:37:57 +0200 +0.001s ... 0.001s
#4 composed specs +0.023s ... 0.025s
#5 did output specs +0s ... 0.025s
#6 getting avg benchmarks for device 9980 +0.023s ... 0.048s
#7 got single benchmarks 9980 +0.013s ... 0.061s
#8 getting avg benchmarks for device 10130 +0.004s ... 0.065s
#9 got single benchmarks 10130 +0.019s ... 0.084s
#10 got avg benchmarks for devices +0s ... 0.084s
#11 min, max, avg, median took s +0.414s ... 0.498s
#12 return log +0.035s ... 0.533s
Please share our article, every link counts!
Redaktion, 2017-09- 8 (Update: 2023-07- 1)
 Deutsch
 English
 Español
 Français
 Italiano
 Nederlands
 Polski
 Português
 Русский
 Türkçe
 Svenska
 Chinese
 Magyar