

PowerVR G6430 vs Qualcomm Adreno 642L vs PowerVR G6400
PowerVR G6430
► remove from comparison
The PowerVR G6430 from Imagination Technologies is a fast mobile graphics solution that is used in ARM SoCs like the Apple A7 (iPhone 5S). The chip is available since Q3/2013 and is one of the fastest solutions of its class at the time of the introduction.
Architecture and Performance
The GPU is based on the series 6 (Rogue) and integrates four clusters with two TMUs each and a scalar Unified Shader architecture. The chip does offer more than twice of the performance compared to the SGX543MP3 from the Apple A6, while maintaining the same clocks. The exact clock is not yet confirmed unequivocally, but it should be north of 400 MHz (results in more than 100 GFLOPS). A comparison with other mobile graphics solutions shows that the G6430 is just slightly behind the tablet version of the Adreno 330 and it is therefore the fastest GPU of its class at the time of the introduction. Even very demanding mobile games can be played without problems (as of 2013). Among others, the GPU supports OpenGL 3.x/4.x, OpenGL ES 3.0 as well as DirectX 10.
Energy Consumption
The manufacturer designed the PowerVR G6430 as a comparatively "wide" chip to achieve a high performance and a high energy efficiency at the same time. As a result, SoCs with the G6430 can also be used in smaller smartphones like the iPhone 5S. However, it does occupy a comparatively large area on the chip in return.
Qualcomm Adreno 642L
► remove from comparison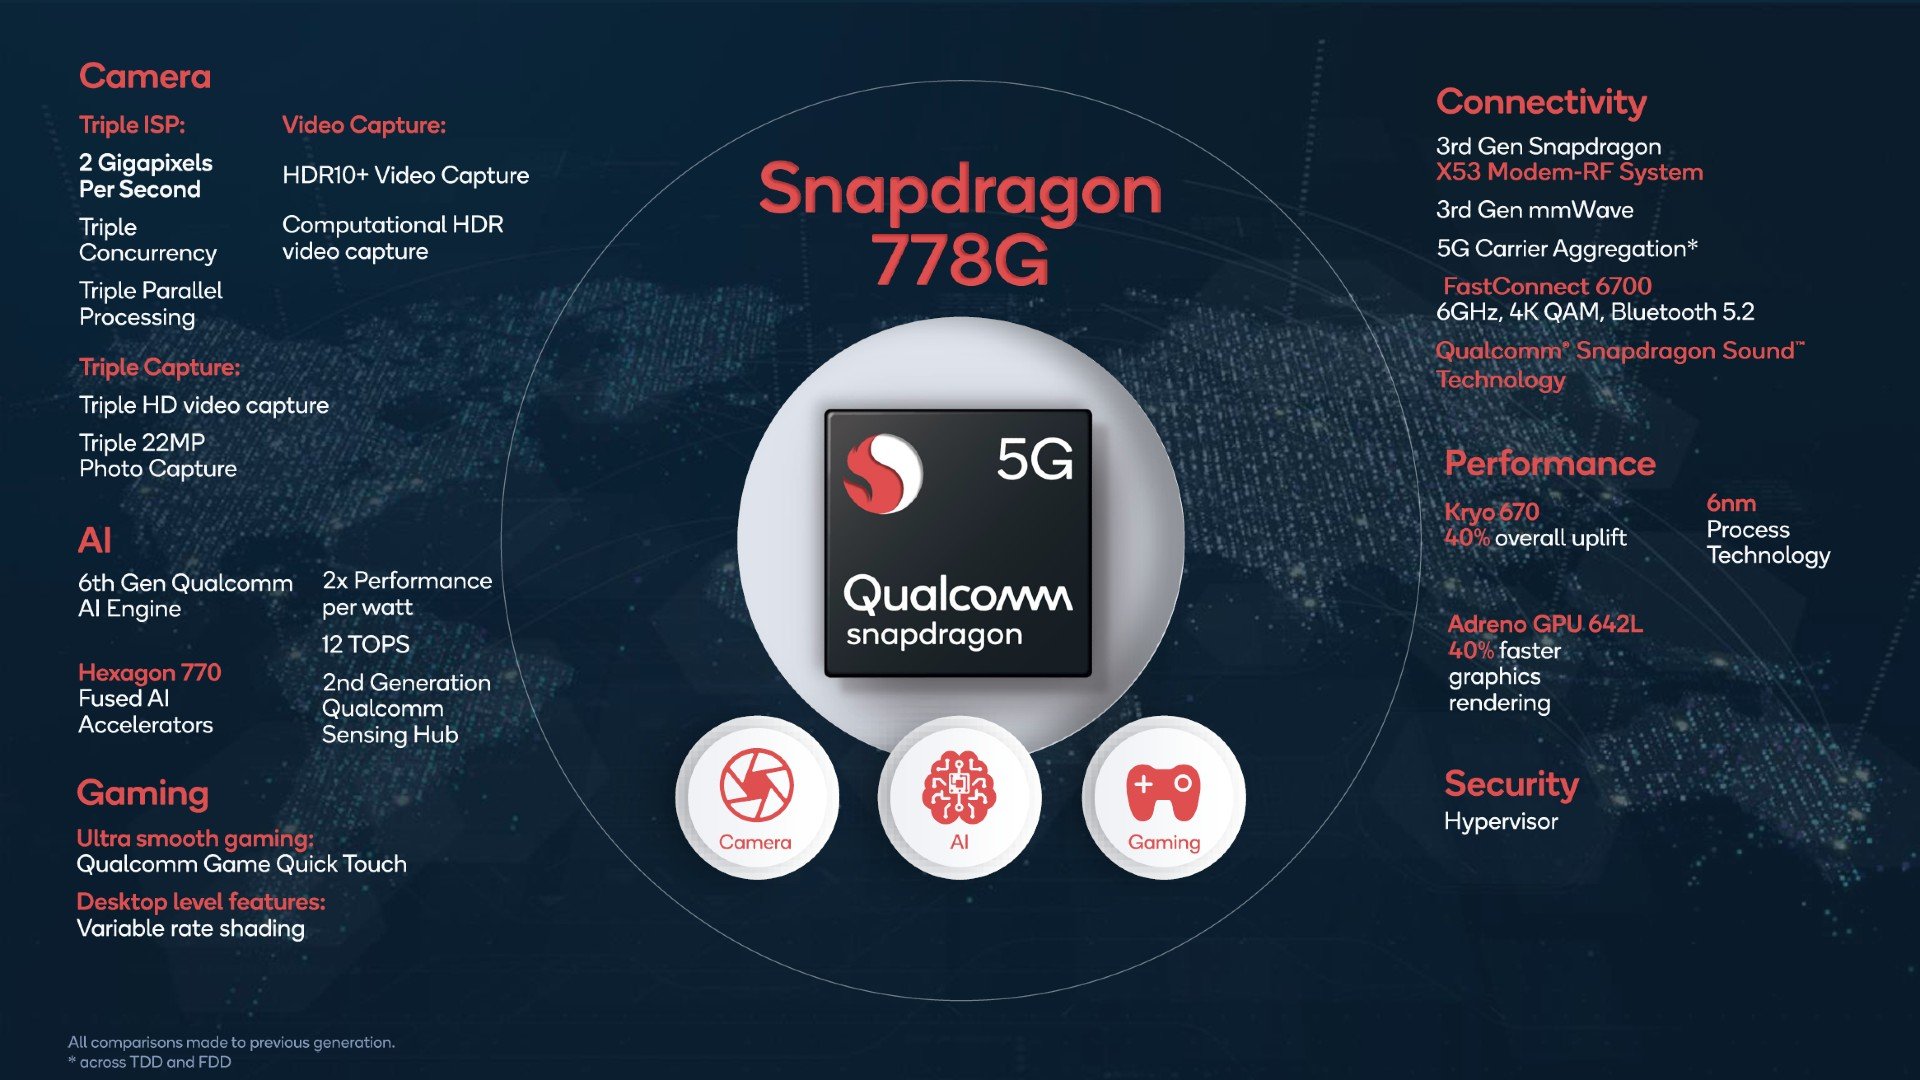
The Qualcomm Adreno 642L is a smartphone and tablet GPU that is integrated within the Qualcomm Snapdragon 778G SoC. The chip will be available from mid 2021 and will be used mainly in upper mid-range Android devices.
According to Qualcomm, the Adreno 642L GPU offers a 40% improved performance over the Adreno 620 (compared to the specified +50% of the 642 in the SD 780G), its predecessor, which is integrated in the Snapdragon 768G SoC. This is also thanks to the fast LPDDR4X-4200 memory support of the SoC.
The Adreno 642L supports OpenCL 2.0 FP, OpenGL ES 3.2 and Vulkan 1.1.
The Snapdragon 778G and therefore also the 642L is manufactured in the modern 6nm UEV process at TSMC that should provide a good power efficiency.
PowerVR G6400
► remove from comparison
The PowerVR G6400 from Imagination Technologies is a fast mobile graphics solution that is used in tablet and smartphone SoCs like the Intel Merrifield series (e.g., Atom Z3460). Chips including this GPU are available from G2 2014 on and the performance is situated in the low high-end.
Architecture and Performance
The GPU is based on the series 6 (Rogue) and integrates four clusters with two TMUs each and a scalar Unified Shader architecture. The chip does offer more than twice of the performance compared to the SGX543MP3 from the Apple A6, while maintaining the same clocks. Even very demanding mobile games can be played without problems (as of 2013). Among others, the GPU supports OpenGL 3.x/4.x, OpenGL ES 3.0 as well as DirectX 10.
Energy Consumption
The manufacturer designed the PowerVR G6400 as a comparatively "wide" chip to achieve a high performance and a high energy efficiency at the same time. As a result, SoCs with the G6400 can also be used in smartphones. However, it does occupy a comparatively large area on the chip in return.
| PowerVR G6430 | Qualcomm Adreno 642L | PowerVR G6400 | ||||||||||||||||||||||||||||||||||||||||||||||||||||||||||||||||||||||||||||
| PowerVR Series 6 (Rogue) Series |
|
|
| |||||||||||||||||||||||||||||||||||||||||||||||||||||||||||||||||||||||||||
| Codename | Rogue | Rogue | ||||||||||||||||||||||||||||||||||||||||||||||||||||||||||||||||||||||||||||
| Architecture | PowerVR Rogue | PowerVR Rogue | ||||||||||||||||||||||||||||||||||||||||||||||||||||||||||||||||||||||||||||
| Shared Memory | no | yes | no | |||||||||||||||||||||||||||||||||||||||||||||||||||||||||||||||||||||||||||
| API | DirectX 10, OpenGL 3.x, 4.x, OpenGL ES 3.0 | OpenGL ES 3.2 | DirectX 10, OpenGL 3.x, 4.x, OpenGL ES 3.1 | |||||||||||||||||||||||||||||||||||||||||||||||||||||||||||||||||||||||||||
| technology | 28 nm | 6 nm | ||||||||||||||||||||||||||||||||||||||||||||||||||||||||||||||||||||||||||||
| Features | OpenGL 3.x, 4.x, OpenGL ES 3.0 | OpenGL ES 3.2, OpenCL 2.0, DirectX 12, Vulkan 1.1 | OpenGL 3.x, 4.x, OpenGL ES 3.1 | |||||||||||||||||||||||||||||||||||||||||||||||||||||||||||||||||||||||||||
| Date of Announcement | 10.09.2013 | 07.05.2021 | 10.09.2013 | |||||||||||||||||||||||||||||||||||||||||||||||||||||||||||||||||||||||||||
| Link to Manufacturer Page | www.imgtec.com | www.imgtec.com | ||||||||||||||||||||||||||||||||||||||||||||||||||||||||||||||||||||||||||||
| Core Speed | 400 - 533 (Boost) MHz |
|
| |||||||||||||||||||||||||||||||||||||||||||||||||
Benchmarks
Cinebench R15 OpenGL 64 Bit + Qualcomm Adreno 642L
GFXBench T-Rex HD Offscreen C24Z16 + PowerVR G6430
Average Benchmarks PowerVR G6430 → 100% n=6
Average Benchmarks Qualcomm Adreno 642L → 1048% n=6
Average Benchmarks PowerVR G6400 → 92% n=6
* Smaller numbers mean a higher performance
1 This benchmark is not used for the average calculation
Game Benchmarks
The following benchmarks stem from our benchmarks of review laptops. The performance depends on the used graphics memory, clock rate, processor, system settings, drivers, and operating systems. So the results don't have to be representative for all laptops with this GPU. For detailed information on the benchmark results, click on the fps number.


League of Legends: Wild Rift
2020

PUBG Mobile
2018Dota 2 Reborn
2015Dead Trigger 2
2013

Subway Surfers
2012| PowerVR G6430 | Qualcomm Adreno 642L | PowerVR G6400 | |||||||||||||||||||
|---|---|---|---|---|---|---|---|---|---|---|---|---|---|---|---|---|---|---|---|---|---|
| low | med. | high | ultra | QHD | 4K | low | med. | high | ultra | QHD | 4K | low | med. | high | ultra | QHD | 4K | ||||
| Diablo Immortal | 59 | 56 | |||||||||||||||||||
| League of Legends: Wild Rift | 61 | ||||||||||||||||||||
| Armajet | 89 | ||||||||||||||||||||
| PUBG Mobile | 58 | 40 | 38 | ||||||||||||||||||
| Dota 2 Reborn | 35 | 26 | 15 | 13 | |||||||||||||||||
| Dead Trigger 2 | 60 | ||||||||||||||||||||
| Asphalt 9: Legends | 30 | 30 | |||||||||||||||||||
| Subway Surfers | 90 | ||||||||||||||||||||
| PowerVR G6430 | Qualcomm Adreno 642L | PowerVR G6400 | |||||||||||||||||||
| low | med. | high | ultra | QHD | 4K | low | med. | high | ultra | QHD | 4K | low | med. | high | ultra | QHD | 4K | < 30 fps < 60 fps < 120 fps ≥ 120 fps | | | | | | | < 30 fps < 60 fps < 120 fps ≥ 120 fps | 4 | 1 1 | 1 2 3 | 1 1 1 | | | < 30 fps < 60 fps < 120 fps ≥ 120 fps | | | | | | |
For more games that might be playable and a list of all games and graphics cards visit our Gaming List