 Deutsch
 English
 Español
 Français
 Italiano
 Nederlands
 Polski
 Português
 Русский
 Türkçe
 Svenska
 Chinese
 Magyar
Nvidia RTX 1000 Ada Generation Laptop GPU vs Apple M2 10-Core GPU vs Apple M2 Pro 16-Core GPU
Nvidia RTX 1000 Ada Generation Laptop GPU
► remove from comparison
The Nvidia RTX 1000 Ada Generation Laptop GPU, not to be confused with the A1000, P1000 or T1000, is a lower-end professional graphics card for use in laptops that sports 2,560 CUDA cores and 6 GB of GDDR6 VRAM. It would be fair to say that this is a GeForce RTX 4050 (Laptop) in disguise; consequently, both are powered by the AD107 chip and are fast enough to handle most games at 1080p with quality set to High. The product was launched in February 2024; it leverages TSMC's 5 nm process and the Ada Lovelace architecture. The Nvidia-recommended TGP range for the card is very wide at 35 W to 140 W leading to bizarre performance differences between different systems powered by what is supposed to be the same product.
Quadro series graphics cards ship with much different BIOS and drivers than GeForce cards and are targeted at professional users rather than gamers. Commercial product design, large-scale calculations, simulation, data mining, 24 x 7 operation, certified drivers - if any of this sounds familiar, then a Quadro card will make you happy.
Architecture and Features
Ada Lovelace brings a range of improvements over older graphics cards utilizing the outgoing Ampere architecture. It's not just a better manufacturing process and a higher number of CUDA cores that we have here; under-the-hood refinements are plentiful, including an immensely larger L2 cache, an optimized ray tracing routine (a different way to determine what is transparent and what isn't is used), and other changes. Naturally, these graphics cards can both encode and decode some of the most widely used video codecs, AVC, HEVC and AV1 included; they also support a host of proprietary Nvidia technologies, including Optimus and DLSS 3, and they can certainly be used for various AI applications.
The RTX 1000 Ada features 20 RT cores of the 3rd generation, 80 Tensor cores of the 4th generation and 2,560 CUDA cores. Increase those numbers by 20%, and you get the RTX 2000 Ada - as long as we pay no attention to clock speed differences, of course. Unlike costlier Ada Generation professional laptop graphics cards, the RTX 1000 comes with just 6 GB of non-ECC VRAM; the lack of error correction makes this card less suitable for super-important tasks and round-the-clock operation. The VRAM is just 96-bit wide, delivering a not-so-impressive bandwidth of ~192 GB/s.
The RTX 1000 Ada Generation makes use of the PCI-Express 4 protocol, just like Ampere-based cards did. 8K SUHD monitors are supported, however, DP 1.4a video outputs may prove to be a bottleneck down the line.
Performance
While we are yet to test a single laptop powered by an RTX 1000 Ada as of late February, we have plenty of performance data for the RTX 4050 Laptop. Based on that, we expect a run-of-the-mill RTX 2000 Ada to deliver:
- a Blender 3.3 Classroom CUDA score of around 54 seconds
- a 3DMark 11 GPU score of around 27,000 points
- around 50 fps in GTA V (1440p - Highest settings possible, 16x AF, 4x MSAA, FXAA)
- upwards of 30 fps in Cyberpunk 2077 (1440p - High settings, Ultra RT, "Quality" DLSS)
Nvidia's marketing materials mention "up to 12.1 TFLOPS" of performance, a downgrade compared to 14.5 TFLOPS delivered by the RTX 2000 Ada.
Your mileage may vary depending on how competent the cooling solution of your laptop is and how high the TGP power target of the RTX 1000 Ada is.
Power consumption
Nvidia no longer divides its laptop graphics cards into Max-Q and non-max-Q models. Instead, laptop makers are free to set the TGP according to their needs, and the range can sometimes be shockingly wide. This is exactly the case with the RTX 1000, as the lowest value recommended for it sits at just 35 W while the highest is 300% higher at 140 W (this most likely includes Dynamic Boost). The slowest system built around an RTX 1000 Ada can easily be half as fast as the fastest one.
Last but not the least, the improved 5 nm process (TSMC 4N) the RTX 1000 is built with makes for decent energy efficiency, as of early 2024.
Apple M2 10-Core GPU
► remove from comparison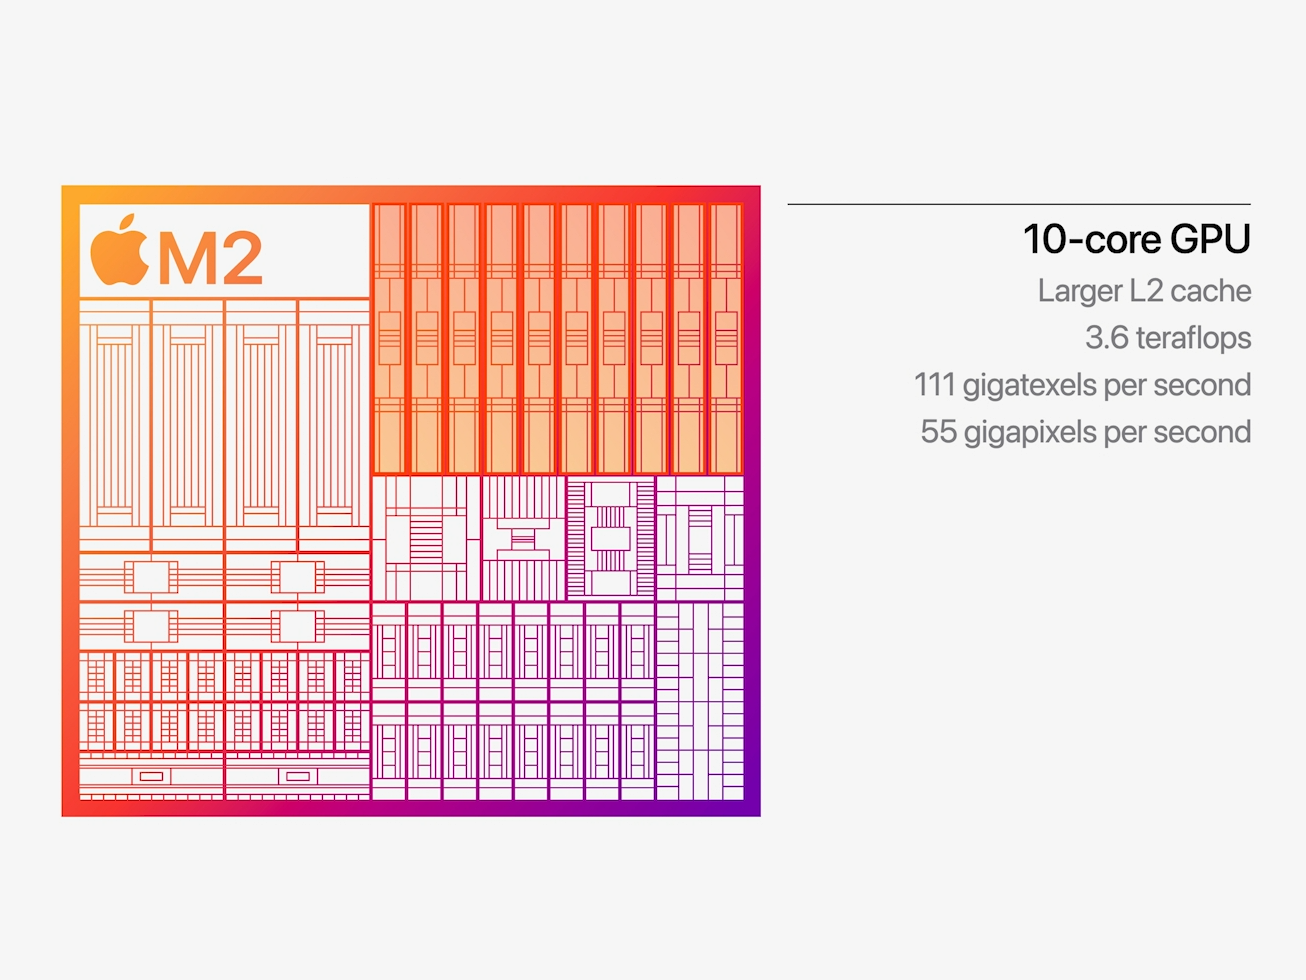
The Apple M2 GPU is an integrated graphics card offering 10 cores designed by Apple and integrated in the Apple M2 SoC. It uses the unified memory architecture of the M2 SoC (up to 24 GB LPDDR5-6400 with 100 GB/s bandwidth) and should offer 160 execution units.
According to Apple it offers a 25% higher performance at slightly higher power consumption. The theoretical performance is rated at 3.6 Teraflops and therefore 1 TFLOP higher than the M1 8-core GPU. In our benchmarks, the GPU was able to top the M1 with up to 40%, but still stays behind the 14-core GPU in the M1 Pro. Compared to other iGPUs from AMD and Intel, the M2 benefits greatly from the unified memory architecture and the high bandwidth.
The M2 chip is manufactured in the second generation 5nm process at TSMC (most likely N5P). The power consumption is around 13.5 Watt (in our tests under load of the MBP13) and up to 15W according to Apple.
Apple M2 Pro 16-Core GPU
► remove from comparison
The Apple M2 Pro 16-Core-GPU is an integrated graphics card by Apple offering all 16 of the 19 cores in the M2 Pro 10-Core Chip.
The graphics card has no dedicated graphics memory but can use the fast LPDDR5-6400 unified memory with a 256 bit bus (up to 200 GBit/s).
According to Apple, the performance of the 19-core-GPU should be 30% higher than the old 16-core-GPU in the M1 Pro. Therefore, the cut down 16-core version should still beat the old full-featured 16-core M1 Pro slightly and the old 14-core more clearly.
The GPU is intended to use Apple Metal 2 API and could still be based on the older PowerVR architectures (last used in the Apple A10). A new feature in the MacBook Pro 14 of 2023 is the support for HDMI 2.1 and 8k output.
The Apple M2 Pro is manufactured in the second generation 5nm process at TSMC.
| Nvidia RTX 1000 Ada Generation Laptop GPU | Apple M2 10-Core GPU | Apple M2 Pro 16-Core GPU | ||||||||||||||||||||||||||||||||||||||||||||||||||||||||||
| Apple M2 Series |
|
|
| |||||||||||||||||||||||||||||||||||||||||||||||||||||||||
| Codename | GN21-X2 | |||||||||||||||||||||||||||||||||||||||||||||||||||||||||||
| Architecture | Ada Lovelace | |||||||||||||||||||||||||||||||||||||||||||||||||||||||||||
| Pipelines | 2560 - unified | 10 - unified | 16 - unified | |||||||||||||||||||||||||||||||||||||||||||||||||||||||||
| TMUs | 80 | |||||||||||||||||||||||||||||||||||||||||||||||||||||||||||
| ROPs | 32 | |||||||||||||||||||||||||||||||||||||||||||||||||||||||||||
| Raytracing Cores | 20 | |||||||||||||||||||||||||||||||||||||||||||||||||||||||||||
| Tensor / AI Cores | 80 | |||||||||||||||||||||||||||||||||||||||||||||||||||||||||||
| Cache | L2: 12 MB | |||||||||||||||||||||||||||||||||||||||||||||||||||||||||||
| Memory Speed | 16000 effective = 2000 MHz | |||||||||||||||||||||||||||||||||||||||||||||||||||||||||||
| Memory Bus Width | 96 Bit | |||||||||||||||||||||||||||||||||||||||||||||||||||||||||||
| Memory Type | GDDR6 | LPDDR5-6400 | LPDDR5-6400 | |||||||||||||||||||||||||||||||||||||||||||||||||||||||||
| Max. Amount of Memory | 6 GB | |||||||||||||||||||||||||||||||||||||||||||||||||||||||||||
| Shared Memory | no | no | no | |||||||||||||||||||||||||||||||||||||||||||||||||||||||||
| Memory Bandwidth | 192 GB/s | |||||||||||||||||||||||||||||||||||||||||||||||||||||||||||
| API | DirectX 12 Ultimate, Shader 6.7, OpenGL 4.6, OpenCL 3.0, Vulkan 1.3 | |||||||||||||||||||||||||||||||||||||||||||||||||||||||||||
| Power Consumption | 115 Watt (35 - 115 Watt TGP) | 15 Watt | ||||||||||||||||||||||||||||||||||||||||||||||||||||||||||
| technology | 5 nm | 5 nm | 5 nm | |||||||||||||||||||||||||||||||||||||||||||||||||||||||||
| PCIe | 4.0 x16 | |||||||||||||||||||||||||||||||||||||||||||||||||||||||||||
| Displays | 4 Displays (max.), HDMI 2.1, DisplayPort 1.4a | |||||||||||||||||||||||||||||||||||||||||||||||||||||||||||
| Notebook Size | large | medium sized | ||||||||||||||||||||||||||||||||||||||||||||||||||||||||||
| Date of Announcement | 27.02.2024 | 06.06.2022 | 17.01.2023 | |||||||||||||||||||||||||||||||||||||||||||||||||||||||||
| Link to Manufacturer Page | images.nvidia.com | |||||||||||||||||||||||||||||||||||||||||||||||||||||||||||
| Core Speed | 1398 (Boost) MHz | |||||||||||||||||||||||||||||||||||||||||||||||||||||||||||
| Predecessor | M1 8-Core GPU |
|
| |||||||||||||||||


