Notebookcheck Logo

Apple M1 Pro 16-Core GPU vs NVIDIA Quadro P4000 vs Apple M1 7-Core GPU

Apple M1 Pro 16-Core GPU

► remove from comparison Apple M1 Pro 16-Core GPU

The Apple M1 Pro 16-Core-GPU is an integrated graphics card by Apple offering all 16 cores in the M1 Pro Chip. The 2048 ALUs offer a theoretical performance of up to 5.3 Teraflops. 

The graphics card has no dedicated graphics memory but can use the fast LPDDR5-6400 unified memory with a 256 bit bus (up to 200 GBit/s).

The GPU clocks between 389 and 1296 MHz and offers no short term boost (389, 486, 648, 778, 972, 1296 MHz steps according to Powermetrics). The GPU is intended to use Apple Metal 2 API and could still be based on the older PowerVR architectures (last used in the Apple A10).

The Apple M1 Pro is manufactured in the modern 5nm process at TSMC and offers an excellent energy efficiency. According to the internal sensors, the GPU uses 15 Watt (Valley) to 20.6 W (Eve Online) under full load.

NVIDIA Quadro P4000

► remove from comparison NVIDIA Quadro P4000

The Nvidia Quadro P4000 is a mobile high-end workstation graphics card for notebooks. There is currently no consumer counterpart and the GPU is sitting between the Quadro P3000 (GTX 1060) and Quadro P5000 (GTX 1070). It is equipped with 1792 shaders and should therefore use the same GP104 chip from the P5000 (2048 shaders). It has 8 GB GDDR-VRAM at the same bandwidth and has the similar 100-Watt TGP according to Nvidia.

The Quadro GPUs offer certified drivers, which are optimized for stability and performance in professional applications (CAD, DCC, medical, prospection, and visualizing applications). The performance in these areas is therefore much better compared to corresponding consumer GPUs.

Apple M1 7-Core GPU

► remove from comparison Apple M1 7-Core GPU

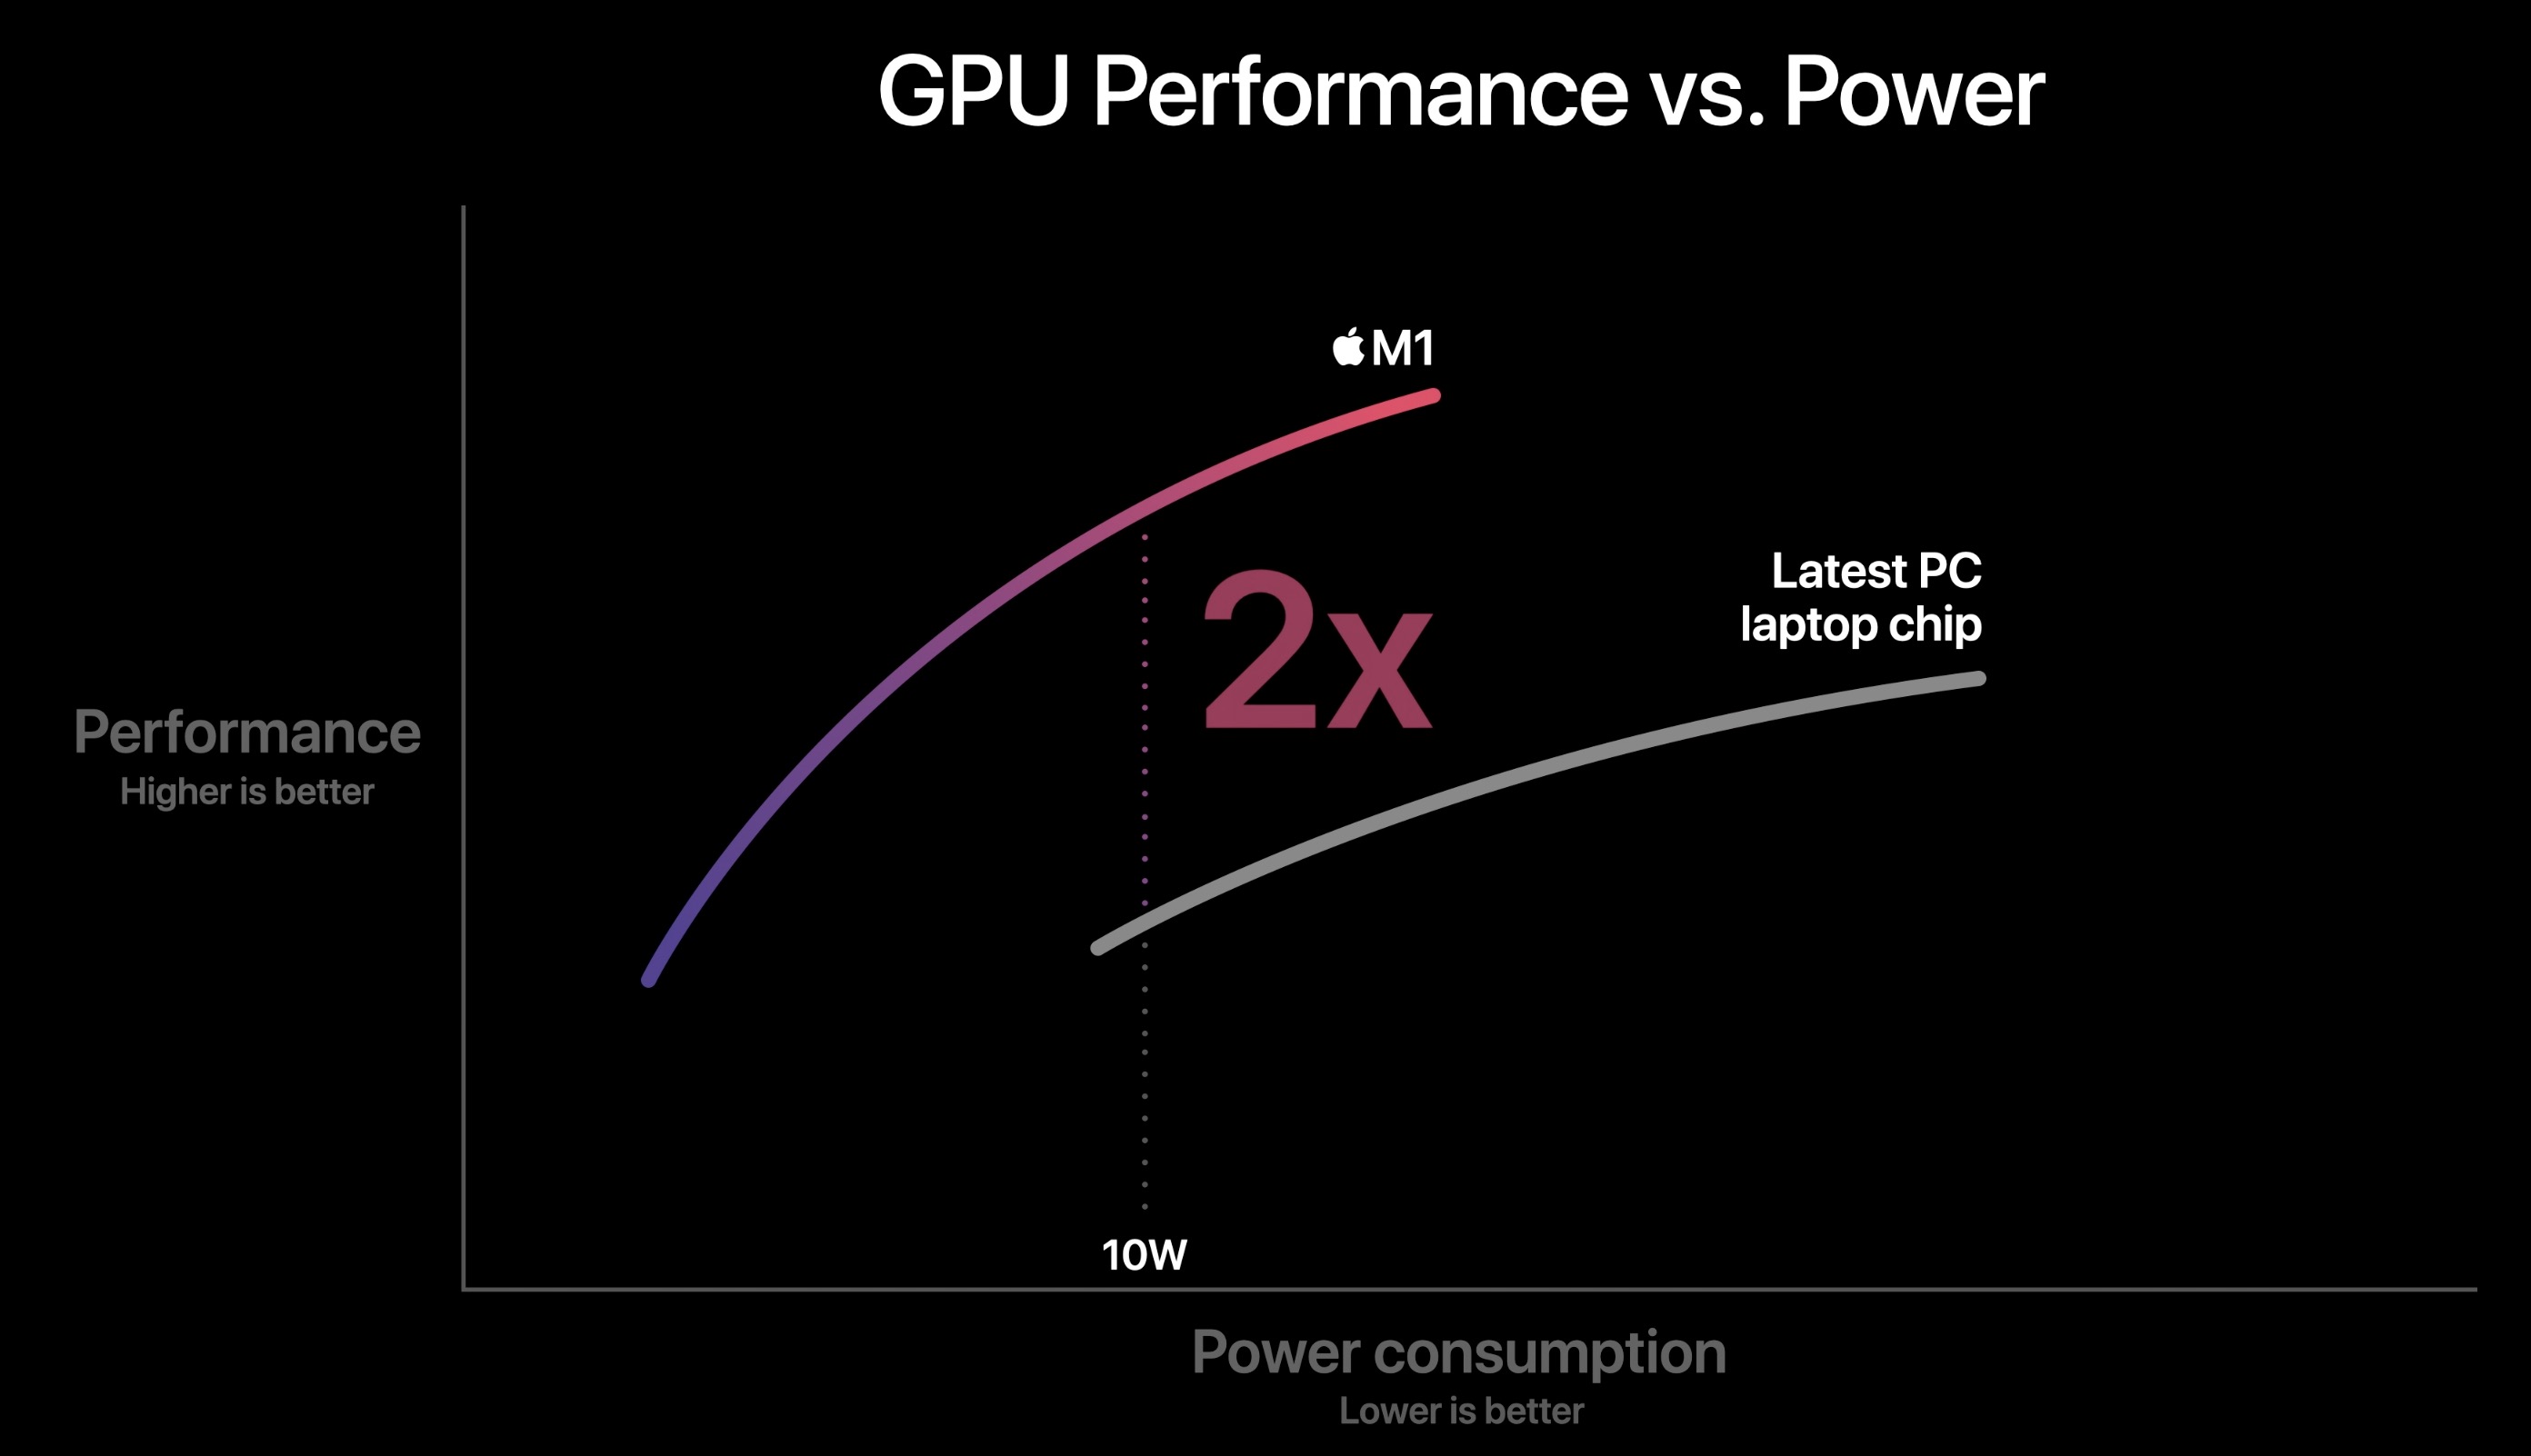
The Apple M1 GPU is an integrated graphics card offering 7 cores (1 deactivated core in the entry MacBook Air) designed by Apple and integrated in the Apple M1 SoC. According to Apple it is faster and more energy efficient as competing products (like the Tiger Lake Xe GPU). The peak performance of the high end variant with 8 cores is 2.6 teraflops, therefore the 7 core version should offer around 2.3 teraflops. Thanks to the unified memory architecture it should have fast access to the RAM.

The Apple M1 is manufactured in the modern 5nm process at TSMC and should offer an excellent energy efficiency.

Apple M1 Pro 16-Core GPUNVIDIA Quadro P4000Apple M1 7-Core GPU
Apple M1 Series
M1 Max 32-Core GPU 32 @ 1.3 GHz512 Bit
M1 Max 24-Core GPU 24 @ 1.3 GHz
M1 Pro 16-Core GPU 16 @ 1.3 GHz
M1 Pro 14-Core GPU 14 @ 1.3 GHz
M1 8-Core GPU 8 @ 1.28 GHz
M1 7-Core GPU 7 @ 1.28 GHz
Quadro P5200 2560 @ 1.32 - 1.57 GHz256 Bit @ 7216 MHz
Quadro P4200 2304 @ 1.22 - 1.48 GHz256 Bit @ 7132 MHz
Quadro P5000 2048 @ 1.16 - 1.51 GHz256 Bit @ 6006 MHz
Quadro P5000 Max-Q 2048 @ 1.1 - 1.37 GHz256 Bit @ 6006 MHz
Quadro P4000 1792 @ 1.2 - 1.23 GHz256 Bit @ 6006 MHz
Quadro P4000 Max-Q 1792 @ 1.11 - 1.24 GHz256 Bit @ 6006 MHz
Quadro P3200 1792 @ 0.71 - 1.23 GHz192 Bit @ 7008 MHz
Quadro P3000 1280 @ 1.09 - 1.22 GHz192 Bit @ 7008 MHz
Quadro P3000 Max-Q 1280 @ 1.08 - 1.24 GHz192 Bit @ 7008 MHz
Quadro P2000 768 @ 1.22 - 1.47 GHz128 Bit @ 6008 MHz
Quadro P2000 Max-Q 768 @ 1.22 - 1.47 GHz128 Bit @ 6008 MHz
Quadro P1000 512 @ 1.49 - 1.52 GHz128 Bit @ 6008 MHz
Quadro P620 512 @ 1.18 - 1.44 GHz128 Bit @ 6000 MHz
M1 Max 32-Core GPU 32 @ 1.3 GHz512 Bit
M1 Max 24-Core GPU 24 @ 1.3 GHz
M1 Pro 16-Core GPU 16 @ 1.3 GHz
M1 Pro 14-Core GPU 14 @ 1.3 GHz
M1 8-Core GPU 8 @ 1.28 GHz
M1 7-Core GPU 7 @ 1.28 GHz
Pipelines16 - unified1792 - unified7 - unified
Core Speed1296 MHz1202 - 1228 (Boost) MHz1278 MHz
Memory TypeLPDDR5-6400GDDR5LPDDR4X-4266
Shared Memorynonono
Power Consumption10 Watt73.4 Watt
technology5 nm16 nm5 nm
Date of Announcement10.11.2020 11.01.2017 10.11.2020
CodenameN17E-Q3
ArchitecturePascal
Memory Speed6006 MHz
Memory Bus Width256 Bit
Max. Amount of Memory16 GB
APIDirectX 12_1, Shader 5.0, OpenGL 4.5
FeaturesOptimus, PhysX, 3D Vision Pro, nView, Optimus
Notebook Sizelarge
Link to Manufacturer Pagewww.nvidia.com
CPU in M1 Pro 16-Core GPUGPU Base SpeedGPU Boost / Turbo
Apple M1 Pro10 x 2064 MHz? MHz? MHz

Benchmarks

Performance Rating - 3DMark 11 + Fire Strike + Time Spy - Quadro P4000
4.6 pt (14%)
Restrict / Search: Model: Max. age: years
3DMark - 3DMark Time Spy Score
3825 Points (10%)
3DMark - 3DMark Time Spy Graphics
3960 Points (8%)
3DMark - 3DMark Ice Storm Unlimited Graphics
369407 Points (37%)
3DMark - 3DMark Cloud Gate Score
18726 Points (18%)
3DMark - 3DMark Cloud Gate Graphics
53834 Points (13%)
3DMark - 3DMark Fire Strike Standard Score
10158 Points (15%)
3DMark - 3DMark Fire Strike Standard Graphics
12259 Points (11%)
3DMark - 3DMark Ice Storm Graphics
81998 Points (9%)
3DMark - 3DMark Wild Life Unlimited
16159 Points (8%)
3DMark - 3DMark Wild Life Extreme Unlimited
10352 Points (12%)
4515 Points (5%)
3DMark 11 - 3DM11 Performance Score
12346 Points (15%)
3DMark 11 - 3DM11 Performance GPU
15433 Points (12%)
3DMark Vantage
3DM Vant. Perf. total + NVIDIA Quadro P4000
3DMark Vantage - 3DM Vant. Perf. total
36260 Points (11%)
3DM Vant. Perf. GPU no PhysX + NVIDIA Quadro P4000
3DMark Vantage - 3DM Vant. Perf. GPU no PhysX
42370 Points (23%)
3DMark 06 3DMark 06 - Standard 1280x1024 + NVIDIA Quadro P4000
3DMark 06
29155 Points (38%)
Unigine Heaven 3.0 - Unigine Heaven 3.0 OpenGL
36.4 fps (16%)
Blender - Blender 3.3 Classroom METAL *
956 Seconds (100%)
SPECviewperf 11
specvp11 snx-01 + NVIDIA Quadro P4000
SPECviewperf 11 - specvp11 snx-01
53 fps (32%)
specvp11 tcvis-02 + NVIDIA Quadro P4000
SPECviewperf 11 - specvp11 tcvis-02
49.9 fps (28%)
specvp11 sw-02 + NVIDIA Quadro P4000
SPECviewperf 11 - specvp11 sw-02
50.9 fps (39%)
specvp11 proe-05 + NVIDIA Quadro P4000
SPECviewperf 11 - specvp11 proe-05
19.7 fps (23%)
specvp11 maya-03 + NVIDIA Quadro P4000
SPECviewperf 11 - specvp11 maya-03
57.8 fps (44%)
specvp11 lightwave-01 + NVIDIA Quadro P4000
SPECviewperf 11 - specvp11 lightwave-01
52.2 fps (56%)
specvp11 ensight-04 + NVIDIA Quadro P4000
SPECviewperf 11 - specvp11 ensight-04
59.2 fps (28%)
specvp11 catia-03 + NVIDIA Quadro P4000
SPECviewperf 11 - specvp11 catia-03
48.4 fps (25%)
SPECviewperf 12
specvp12 sw-03 + NVIDIA Quadro P4000
SPECviewperf 12 - specvp12 sw-03
117.1 fps (29%)
specvp12 snx-02 + NVIDIA Quadro P4000
SPECviewperf 12 - specvp12 snx-02
83.1 fps (12%)
specvp12 showcase-01 + NVIDIA Quadro P4000
SPECviewperf 12 - specvp12 showcase-01
67.2 fps (12%)
specvp12 mediacal-01 + NVIDIA Quadro P4000
SPECviewperf 12 - specvp12 mediacal-01
39.4 fps (10%)
specvp12 maya-04 + NVIDIA Quadro P4000
SPECviewperf 12 - specvp12 maya-04
77.9 fps (21%)
specvp12 energy-01 + NVIDIA Quadro P4000
SPECviewperf 12 - specvp12 energy-01
10.3 fps (9%)
specvp12 creo-01 + NVIDIA Quadro P4000
SPECviewperf 12 - specvp12 creo-01
97.1 fps (39%)
specvp12 catia-04 + NVIDIA Quadro P4000
SPECviewperf 12 - specvp12 catia-04
115.2 fps (19%)
specvp12 3dsmax-05 + NVIDIA Quadro P4000
SPECviewperf 12 - specvp12 3dsmax-05
93.6 fps (14%)
Cinebench R10 Cinebench R10 Shading (32bit) + NVIDIA Quadro P4000
Cinebench R10 - Cinebench R10 Shading (32bit)
6831 Points (5%)
Cinebench R11.5 Cinebench R11.5 OpenGL 64 Bit + NVIDIA Quadro P4000
Cinebench R11.5 - Cinebench R11.5 OpenGL 64 Bit
105.6 fps (35%)
Cinebench R15
Cinebench R15 OpenGL 64 Bit + Apple M1 Pro 16-Core GPU
Cinebench R15 - Cinebench R15 OpenGL 64 Bit
85.5 fps (5%)
Cinebench R15 OpenGL 64 Bit + NVIDIA Quadro P4000
107.2 fps (6%)
Cinebench R15 OpenGL 64 Bit + Apple M1 7-Core GPU
90 fps (5%)
Cinebench R15 OpenGL Ref. Match 64 Bit + Apple M1 Pro 16-Core GPU
Cinebench R15 - Cinebench R15 OpenGL Ref. Match 64 Bit
99.5 % (100%)
Cinebench R15 OpenGL Ref. Match 64 Bit + NVIDIA Quadro P4000
99.6 % (100%)
Cinebench R15 OpenGL Ref. Match 64 Bit + Apple M1 7-Core GPU
99.5 % (100%)
GFXBench - GFXBench 5.0 4K Aztec Ruins High Tier Offscreen
71.7 fps (27%)
GFXBench - GFXBench 5.0 Aztec Ruins High Tier Offscreen
166 fps (30%)
72.4 fps (13%)
GFXBench - GFXBench 5.0 Aztec Ruins Normal Tier Offscreen
436 fps (32%)
192 fps (14%)
GFXBench - GFXBench Car Chase Offscreen
345 fps (33%)
209.8 fps (20%)
162 fps (15%)
GFXBench 3.1 - GFXBench Manhattan ES 3.1 Offscreen
544 fps (11%)
318 fps (7%)
240 fps (5%)
GFXBench 3.0 - GFXBench 3.0 Manhattan Offscreen
869 fps (36%)
408.4 fps (17%)
376 fps (16%)
GFXBench (DX / GLBenchmark) 2.7
GFXBench T-Rex HD Offscreen C24Z16 + Apple M1 Pro 16-Core GPU
GFXBench (DX / GLBenchmark) 2.7 - GFXBench T-Rex HD Offscreen C24Z16
1561 fps (12%)
GFXBench T-Rex HD Offscreen C24Z16 + NVIDIA Quadro P4000
1114 fps (9%)
GFXBench T-Rex HD Offscreen C24Z16 + Apple M1 7-Core GPU
620 fps (5%)
Geekbench 6.4 - Geekbench 6.4 GPU OpenCL
42189 Points (11%)
18341 Points (5%)
Geekbench 6.4 - Geekbench 6.4 GPU Metal
69083 Points (38%)
30112 Points (17%)
LuxMark v2.0 64Bit - LuxMark v2.0 Room GPU
1847 Samples/s (7%)
LuxMark v2.0 64Bit - LuxMark v2.0 Sala GPU
3564 Samples/s (6%)
ComputeMark v2.1 - ComputeMark v2.1 Result
8609 Points (7%)
Power Consumption - Furmark Stress Test Power Consumption - external Monitor *
80.8 Watt (11%)
Power Consumption - The Witcher 3 Power Consumption - external Monitor *
99.5 Watt (14%)
Power Consumption - GFXBench Aztec Ruins Normal Tier Offscreen Power Consumption 150cd *
40.7 Watt (16%)
19.5 Watt (8%)
Power Consumption - Power Efficiency - Witcher 3 ultra external Monitor
0.4 fps per Watt (34%)

Average Benchmarks Apple M1 Pro 16-Core GPU → 100% n=6

Average Benchmarks NVIDIA Quadro P4000 → 77% n=6

Average Benchmarks Apple M1 7-Core GPU → 63% n=6

- Range of benchmark values for this graphics card
red legend - Average benchmark values for this graphics card
* Smaller numbers mean a higher performance
1 This benchmark is not used for the average calculation

Game Benchmarks

The following benchmarks stem from our benchmarks of review laptops. The performance depends on the used graphics memory, clock rate, processor, system settings, drivers, and operating systems. So the results don't have to be representative for all laptops with this GPU. For detailed information on the benchmark results, click on the fps number.

QHD 2560x1440
M1 7-Core GPU:
58  fps
low 1280x720
100%
M1 Pro 16-Core GPU:
56.6  fps
80%
M1 7-Core GPU:
45.2  fps
med. 1920x1080
100%
M1 Pro 16-Core GPU:
48  fps
58%
M1 7-Core GPU:
28  fps
high 1920x1080
100%
M1 Pro 16-Core GPU:
34.8  fps
51%
M1 7-Core GPU:
17.7  fps
ultra 1920x1080
100%
M1 Pro 16-Core GPU:
26.2  fps
low 1280x720
100%
M1 Pro 16-Core GPU:
114  fps
84%
M1 7-Core GPU:
95.2 (!)  fps
med. 1920x1080
100%
M1 Pro 16-Core GPU:
69.6  fps
38%
M1 7-Core GPU:
26.3 (!)  fps
high 1920x1080
100%
M1 Pro 16-Core GPU:
43.8  fps
40%
M1 7-Core GPU:
17.4 (!)  fps
ultra 1920x1080
100%
M1 Pro 16-Core GPU:
31.8  fps
low 1280x720
M1 7-Core GPU:
65  fps
med. 1920x1080
100%
M1 Pro 16-Core GPU:
63  fps
35%
M1 7-Core GPU:
22  fps
high 1920x1080
100%
M1 Pro 16-Core GPU:
57  fps
ultra 1920x1080
100%
M1 Pro 16-Core GPU:
50  fps
F1 2017

F1 2017

2017
low 1280x720
M1 7-Core GPU:
60  fps
med. 1920x1080
M1 7-Core GPU:
54  fps
high 1920x1080
M1 7-Core GPU:
43  fps
low 1280x720
Quadro P4000:
70.3  fps
M1 7-Core GPU:
43.9  fps
med. 1920x1080
Quadro P4000:
61.6  fps
M1 7-Core GPU:
32.5  fps
high 1920x1080
Quadro P4000:
58.8  fps
ultra 1920x1080
Quadro P4000:
54  fps
low 1024x768
Quadro P4000:
66.7  fps
M1 7-Core GPU:
80.3  fps
med. 1366x768
Quadro P4000:
55.2  fps
high 1920x1080
100%
M1 Pro 16-Core GPU:
45.5  fps
99%
Quadro P4000:
45.1  fps
66%
M1 7-Core GPU:
30.1  fps
ultra 1920x1080
100%
M1 Pro 16-Core GPU:
45.5  fps
96%
Quadro P4000:
43.7  fps
59%
M1 7-Core GPU:
27  fps
4K 3840x2160
M1 7-Core GPU:
15.8  fps
low 1280x720
M1 7-Core GPU:
47.6  fps
med. 1366x768
M1 7-Core GPU:
35.3  fps
high 1920x1080
100%
M1 Pro 16-Core GPU:
54.2  fps
35%
M1 7-Core GPU:
19  fps
ultra 1920x1080
100%
M1 Pro 16-Core GPU:
43.1  fps
Doom

Doom

2016
low 1280x720
Quadro P4000:
119.5  fps
med. 1366x768
Quadro P4000:
112.4  fps
high 1920x1080
Quadro P4000:
91  fps
ultra 1920x1080
Quadro P4000:
87.1  fps
low 1024x768
Quadro P4000:
115.9  fps
med. 1366x768
Quadro P4000:
103.2  fps
high 1920x1080
Quadro P4000:
76.8  fps
ultra 1920x1080
Quadro P4000:
65.5  fps
low 1024x768
Quadro P4000:
122.5  fps
med. 1366x768
Quadro P4000:
116.4  fps
high 1920x1080
Quadro P4000:
89.2  fps
ultra 1920x1080
Quadro P4000:
85.7  fps
low 1024x768
Quadro P4000:
159.7  fps
med. 1366x768
Quadro P4000:
113.6  fps
high 1920x1080
Quadro P4000:
77.2  fps
ultra 1920x1080
Quadro P4000:
41.1  fps
low 1024x768
Quadro P4000:
153.8  fps
med. 1366x768
Quadro P4000:
106.3  fps
high 1920x1080
Quadro P4000:
96.9  fps
ultra 1920x1080
Quadro P4000:
84.5  fps
low 1024x768
Quadro P4000:
236.7  fps
med. 1366x768
Quadro P4000:
184.1  fps
high 1366x768
Quadro P4000:
151.4  fps
ultra 1920x1080
Quadro P4000:
63.3  fps
low 1024x768
Quadro P4000:
67.6  fps
med. 1366x768
Quadro P4000:
61.1  fps
high 1366x768
Quadro P4000:
59.7  fps
ultra 1920x1080
Quadro P4000:
44.9  fps
low 1280x720
Quadro P4000:
196.9  fps
med. 1366x768
Quadro P4000:
174.4  fps
high 1366x768
Quadro P4000:
162.4  fps
ultra 1920x1080
Quadro P4000:
96  fps
low 1024x768
M1 7-Core GPU:
109  fps
high 1366x768
M1 7-Core GPU:
69  fps
ultra 1920x1080
M1 7-Core GPU:
44.4  fps
high 1366x768
M1 7-Core GPU:
86  fps
ultra 1920x1080
M1 7-Core GPU:
47  fps

Average Gaming Apple M1 Pro 16-Core GPU → 100%

Average Gaming 30-70 fps → 100%

Average Gaming NVIDIA Quadro P4000 → 98%

Average Gaming 30-70 fps → 98%

Average Gaming Apple M1 7-Core GPU → 55%

Average Gaming 30-70 fps → 73%

Apple M1 Pro 16-Core GPUNVIDIA Quadro P4000Apple M1 7-Core GPU
lowmed.highultraQHD4Klowmed.highultraQHD4Klowmed.highultraQHD4K
Hearthstone58
Borderlands 356.64834.826.245.22817.7
Total War: Three Kingdoms11469.643.831.895.226.317.4
Shadow of the Tomb Raider6357506522
F1 2017605443
Warhammer 40.000: Dawn of War III70.361.658.85443.932.5
Civilization 645.545.566.755.245.1343.780.330.12715.8
Deus Ex Mankind Divided54.243.147.635.319
Counter-Strike: GO1096944.4
Batman: Arkham City8647
Apple M1 Pro 16-Core GPUNVIDIA Quadro P4000Apple M1 7-Core GPU
lowmed.highultraQHD4Klowmed.highultraQHD4Klowmed.highultraQHD4K
< 30 fps
< 60 fps
< 120 fps
≥ 120 fps

1
1

1
2

5

1
4


< 30 fps
< 60 fps
< 120 fps
≥ 120 fps


2

1
1

2


2


< 30 fps
< 60 fps
< 120 fps
≥ 120 fps

3
5
3
3

3
2
2
1
2


1

1


For more games that might be playable and a list of all games and graphics cards visit our Gaming List

v1.33
log 18. 11:24:27

#0 ran 0s before starting gpusingle class +0s ... 0s

#1 checking url part for id 10963 +0s ... 0s

#2 checking url part for id 7666 +0s ... 0s

#3 checking url part for id 10560 +0s ... 0s

#4 redirected to Ajax server, took 1755509067s time from redirect:0 +0s ... 0s

#5 did not recreate cache, as it is less than 5 days old! Created at Sat, 16 Aug 2025 05:18:43 +0200 +0s ... 0s

#6 composed specs +0.049s ... 0.049s

#7 did output specs +0s ... 0.049s

#8 start showIntegratedCPUs +0s ... 0.049s

#9 getting avg benchmarks for device 10963 +0.021s ... 0.07s

#10 got single benchmarks 10963 +0.003s ... 0.073s

#11 getting avg benchmarks for device 7666 +0.004s ... 0.077s

#12 got single benchmarks 7666 +0.004s ... 0.081s

#13 getting avg benchmarks for device 10560 +0s ... 0.082s

#14 got single benchmarks 10560 +0.003s ... 0.085s

#15 got avg benchmarks for devices +0s ... 0.085s

#16 min, max, avg, median took s +0.031s ... 0.115s

#17 before gaming benchmark output +0s ... 0.115s

#18 Got 81 rows for game benchmarks. +0.007s ... 0.122s

#19 composed SQL query for gamebenchmarks +0s ... 0.122s

#20 got data and put it in $dataArray +0.002s ... 0.124s

#21 benchmarks composed for output. +0.008s ... 0.132s

#22 calculated avg scores. +0s ... 0.132s

#23 return log +0s ... 0.133s

Please share our article, every link counts!
Mail Logo
> Expert Reviews and News on Laptops, Smartphones and Tech Innovations > Benchmarks / Tech > Graphics Card Comparison - Head 2 Head
Redaktion, 2017-09- 8 (Update: 2023-07- 1)