HiSilicon Kirin 710 vs Qualcomm Snapdragon 662 vs Qualcomm Snapdragon 636
HiSilicon Kirin 710 ► remove from comparison
The HiSilicon Kirin 710 is a ARM-based mid-range Octa-Core-SoC for Android based smartphones and tablets. It was announced mid 2018 and contains 8 processor cores (4x Cortex-A73 at up to 2.2 GHz, 4x Cortex-A53 at up to 1.7 GHz, BigLITTLE), an ARM Mali G51 MP4, a dual-channel LPDDR4 memory controller and a LTE radio (600 Mbps down, 150 Mbps up). Therefore, the CPU part is similar to the Kirin 960 and 970 (both higher clocked), but the graphics card is a lot slower.
The Kirin 710 is manufactured at TSMC in 12 nm (compared to the 16nm Kirin 960 and 10nm Kirin 970).
The HiSilicon Kirin 710F is the same chip with a different package (FCCSP - Flip Chip Chip Scale Package) and offers the same specifications (see e.g. our review of the Huawei P Smart Z).
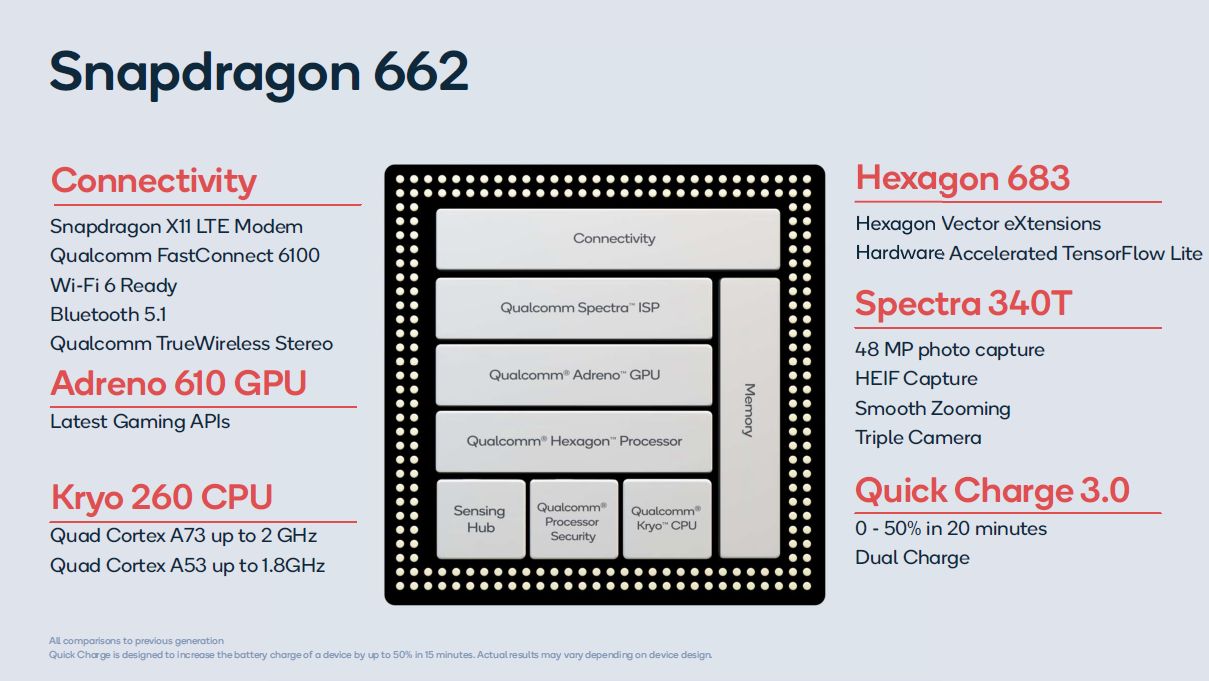
Qualcomm Snapdragon 662 ► remove from comparison
The Qualcomm Snapdragon 662 is a lower mid-range ARM-based SoC largely found in Android tablets and smartphones. It features 8 Kryo 260 cores (custom design, 64-Bit capable) that are divided in two clusters. A fast cluster of four cores with up to 2 GHz (Kryo 260 Gold - Cortex-A73 derivate) and a power saving efficiency cluster with up to 1.8 GHz (Kryo 260 Silver - Cortex A53 derivate). Both clusters can also be used together.
In addition to the 8 CPU cores, the SoC integrates a mid range Adreno 610 GPU with a LPDDR4 memory controller (dual-channel) and supports Wi-Fi (802.11ac + MIMO, max. 867 Mbps), Bluetooth 5, and LTE (X12 LTE modem with up to 600 Mbps download and 150 Mbps upload).
Power Consumption
Thanks to the new 11 nm LPP process, the energy efficiency should be quite good.
Qualcomm Snapdragon 636 ► remove from comparison
The Qualcomm Snapdragon 636 (SDM636) is a mid-range octa-core SoC with eight custom Kryo 260 cores at up to 1.8 GHz, an Adreno 509 GPU, a LPDDR4-2666 memory controller (1333 MHz) and a X12 LTE (Cat 12/13, 300 Mbps down, 150 Mbps up) modem. Furthermore, the chip supports 802.11ac WiFi and Bluetooth 5.0. It is manufactured in 14nm FinFet. Qualcomm states a 40% faster performance compared to the old Snapdragon 630 (8x ARM Cortex-A53).
Model HiSilicon Kirin 710 Qualcomm Snapdragon 662 Qualcomm Snapdragon 636 Series HiSilicon Qualcomm Snapdragon Qualcomm Snapdragon Codename Cortex-A73/-A53 Kryo 260 Kryo 260 Series: Snapdragon Kryo 260 Clock 2200 MHz 1800 - 2000 MHz 1800 MHz Cores / Threads 8 / 8 8 / 8 8 / 8 Transistors 5500 Million Technology 12 nm 11 nm 14 nm Features ARM Mali-G51 MP4 GPU, 4x Cortex-A73 (2.2 GHz) + 4x Cortex-A53 (1.7 GHz, big.LITTLE), LTE Cat-12 600 Mbps Downlink, Cat-13 150 Mbps Uplink, Bluetooth 4.2, WiFi a/b/g/n 2.4 GHz, AGPS, Glonass, Baidou Adreno 610 GPU, X11 LTE Modem, Hexagon 683 DSP, Specra 340T ISP Adreno 509 GPU, X12 LTE Modem, Hexagon 680 DSP, Spectra 160 ISP iGPU ARM Mali-G51 MP4 Qualcomm Adreno 610 Qualcomm Adreno 509 Architecture ARM ARM ARM Announced Manufacturer www.qualcomm.com www.qualcomm.com
Benchmarks Performance Rating - Geekbench 5.5, PCM Work, Sling Shot Physics, Antutu v8 CPU - Kirin 710
0.5 pt (37%)
...
...
Performance Rating - Geekbench 5.5, PCM Work, Sling Shot Physics, Antutu v8 CPU - SD 662
0.5 pt (36%)
...
...
3DMark - 3DMark Ice Storm Unlimited Physics
min: 11158 avg: 16572 median: 17232.5 (15%) max: 22668 Points
min: 18647 avg: 19225 median: 19223.5 (16%) max: 19804 Points
min: 15766 avg: 17020 median: 16939 (14%) max: 19365 Points
3DMark - 3DMark Sling Shot Extreme (ES 3.1) Unlimited Physics
min: 1851 avg: 2350 median: 2478 (29%) max: 2789 Points
min: 1588 avg: 2240 median: 2272 (27%) max: 2534 Points
min: 2258 avg: 2372 median: 2345 (28%) max: 2644 Points
3DMark - 3DMark Sling Shot (ES 3.0) Unlimited Physics
min: 1656 avg: 2358 median: 2459 (28%) max: 2723 Points
min: 2146 avg: 2330 median: 2384 (27%) max: 2502 Points
min: 2288 avg: 2386 median: 2359 (27%) max: 2683 Points
Geekbench 6.2 - Geekbench 6.2 Single-Core
min: 330 avg: 331.5 median: 331.5 (9%) max: 333 Points
Geekbench 6.2 - Geekbench 6.2 Multi-Core
min: 1111 avg: 1129 median: 1129 (4%) max: 1147 Points
Geekbench 5.5 - Geekbench 5.1 - 5.4 64 Bit Single-Core
min: 330 avg: 330.5 median: 330.5 (14%) max: 331 Points
min: 275 avg: 308.3 median: 309 (13%) max: 316 Points
Geekbench 5.5 - Geekbench 5.1 - 5.4 64 Bit Multi-Core
min: 1320 avg: 1338 median: 1338 (2%) max: 1356 Points
min: 763 avg: 1299 median: 1295 (2%) max: 1453 Points
Geekbench 5.0 - Geekbench 5.0 64 Bit Single-Core
min: 319 avg: 327 median: 327 (1%) max: 335 Points
278 Points (1%)
Geekbench 5.0 - Geekbench 5.0 64 Bit Multi-Core
min: 1266 avg: 1339 median: 1339 (4%) max: 1412 Points
1256 Points (4%)
Geekbench 4.4 - Geekbench 4.1 - 4.4 64 Bit Single-Core
min: 1523 avg: 1560 median: 1550 (15%) max: 1614 Points
1472 Points (15%)
min: 1323 avg: 1351 median: 1337 (13%) max: 1506 Points
Geekbench 4.4 - Geekbench 4.1 - 4.4 64 Bit Multi-Core
min: 5266 avg: 5454 median: 5430 (6%) max: 5615 Points
4938 Points (5%)
min: 4781 avg: 4960 median: 4941 (5%) max: 5426 Points
Geekbench 4.0 - Geekbench 4.0 64 Bit Single-Core
min: 1612 avg: 1623 median: 1623 (22%) max: 1634 Points
Geekbench 4.0 - Geekbench 4.0 64 Bit Multi-Core
min: 5377 avg: 5447 median: 5447 (13%) max: 5517 Points
Geekbench 3 - Geekbench 3 32 Bit Single-Core
0 Points (0%)
Geekbench 3 - Geekbench 3 64 Bit Multi-Core
5456 Points (9%)
Geekbench 3 - Geekbench 3 64 Bit Single-Core
1517 Points (23%)
Geekbench 2 - 32 Bit - Geekbench Stream
min: 1356 avg: 1702 median: 1701.5 (14%) max: 2047 Points
2016 Points (16%)
Geekbench 2 - 32 Bit - Geekbench Memory
min: 2488 avg: 3017 median: 3017 (27%) max: 3546 Points
2801 Points (25%)
Geekbench 2 - 32 Bit - Geekbench Floating Point
min: 9096 avg: 9764 median: 9763.5 (19%) max: 10431 Points
8155 Points (16%)
Geekbench 2 - 32 Bit - Geekbench Integer
min: 4429 avg: 4767 median: 4766.5 (10%) max: 5104 Points
4063 Points (8%)
Geekbench 2 - 32 Bit - Geekbench Total Score
min: 5366 avg: 5857 median: 5856.5 (15%) max: 6347 Points
5063 Points (13%)
Mozilla Kraken 1.1 - Kraken 1.1 Total Score *
min: 3999 avg: 4223 median: 4205 (5%) max: 4853 ms
min: 3779 avg: 4379 median: 4502 (5%) max: 4650 ms
min: 4105 avg: 4688 median: 4739.5 (6%) max: 5066 ms
Sunspider - Sunspider 1.0 Total Score *
9121 ms (100%)
Octane V2 - Octane V2 Total Score
min: 9041 avg: 9659 median: 9695 (9%) max: 10544 Points
min: 8893 avg: 9495 median: 9485.5 (9%) max: 10247 Points
min: 8163 avg: 8665 median: 8559 (8%) max: 9746 Points
WebXPRT 3 - WebXPRT 3 Score
min: 52 avg: 61.7 median: 62 (13%) max: 69 Points
min: 51 avg: 53.2 median: 52 (11%) max: 59 Points
min: 46 avg: 54.4 median: 54 (11%) max: 61 Points
AnTuTu v6 - AnTuTu v6 Total Score
min: 104012 avg: 108955 median: 110126 (38%) max: 112870 Points
min: 92015 avg: 98051 median: 95445 (33%) max: 125213 Points
AnTuTu v7 - AnTuTu v7 MEM
min: 9898 avg: 13356 median: 11364.5 (35%) max: 32585 Points
min: 6157 avg: 7167 median: 6810 (21%) max: 8905 Points
min: 34146 avg: 38196 median: 36606 (45%) max: 54562 Points
min: 31418 avg: 33672 median: 32826 (40%) max: 45201 Points
AnTuTu v7 - AnTuTu v7 GPU
min: 22245 avg: 25701 median: 27005.5 (8%) max: 28462 Points
min: 20870 avg: 21261 median: 21253 (7%) max: 21422 Points
AnTuTu v7 - AnTuTu v7 CPU
min: 54673 avg: 61958 median: 60404 (37%) max: 73966 Points
min: 54858 avg: 56762 median: 56113 (34%) max: 63874 Points
AnTuTu v7 - AnTuTu v7 Total Score
min: 124870 avg: 139210 median: 135942 (24%) max: 183420 Points
min: 115565 avg: 118863 median: 116748 (21%) max: 138661 Points
min: 55985 avg: 58317 median: 58317 (49%) max: 60649 Points
min: 26857 avg: 35819 median: 37388 (31%) max: 38718 Points
27466 Points (23%)
AnTuTu v8 - AnTuTu v8 MEM
min: 35479 avg: 36250 median: 36250 (29%) max: 37021 Points
min: 32579 avg: 37486 median: 34946 (28%) max: 46499 Points
30326 Points (24%)
AnTuTu v8 - AnTuTu v8 GPU
min: 28697 avg: 28859 median: 28858.5 (5%) max: 29020 Points
min: 25724 avg: 33052 median: 33402 (6%) max: 43315 Points
24483 Points (4%)
AnTuTu v8 - AnTuTu v8 CPU
min: 60900 avg: 66675 median: 66674.5 (24%) max: 72449 Points
min: 68508 avg: 70945 median: 71065 (26%) max: 72576 Points
62945 Points (23%)
AnTuTu v8 - AnTuTu v8 Total Score
min: 185725 avg: 190100 median: 190100 (18%) max: 194475 Points
min: 167471 avg: 177411 median: 177145 (17%) max: 185542 Points
145220 Points (14%)
Antutu v9 - AnTuTu v9 Total Score
min: 194505 avg: 200601 median: 198172 (12%) max: 211557 Points
Antutu v9 - AnTuTu v9 CPU
min: 64163 avg: 66339 median: 66230 (18%) max: 68731 Points
PassMark PerformanceTest Mobile V1 - PerformanceTest Mobile V1 CPU Tests
min: 181152 avg: 184162 median: 184162 (24%) max: 187172 Points
16222 Points (2%)
min: 157795 avg: 157981 median: 157981 (21%) max: 158167 Points
PCMark for Android - PCM f. Android Computer Vision
min: 3783 avg: 4945 median: 5171.5 (27%) max: 5286 Points
min: 3090 avg: 3167 median: 3201 (17%) max: 3211 Points
min: 3056 avg: 3090 median: 3071.5 (16%) max: 3160 Points
PCMark for Android - PCM f. Android Storage
min: 10592 avg: 11047 median: 11046.5 (24%) max: 11501 Points
min: 8075 avg: 8811 median: 8076 (17%) max: 10283 Points
min: 3406 avg: 5546 median: 5299.5 (11%) max: 8180 Points
PCMark for Android - PCM f. Android Work Score 2.0
min: 5803 avg: 6497 median: 6685 (44%) max: 7141 Points
min: 5866 avg: 6258 median: 6139 (40%) max: 7184 Points
min: 5611 avg: 5833 median: 5730 (37%) max: 6277 Points
PCMark for Android - PCM f. Android Work Score
min: 7004 avg: 8380 median: 8525 (43%) max: 9854 Points
min: 7247 avg: 7986 median: 8000.5 (40%) max: 8714 Points
min: 6040 avg: 6624 median: 6457 (32%) max: 7618 Points
PCMark for Android - PCM f. Android Storage 2.0 random write internal
min: 21.7 avg: 22.3 median: 22.3 (16%) max: 22.9 MB/s
PCMark for Android - PCM f. Android Storage 2.0 seq write internal
min: 111.1 avg: 112.5 median: 112.5 (3%) max: 113.8 MB/s
PCMark for Android - PCM f. Android Storage 2.0 random read internal
min: 15.3 avg: 15.5 median: 15.5 (19%) max: 15.6 MB/s
PCMark for Android - PCM f. Android Storage 2.0 seq read internal
min: 403 avg: 414.5 median: 414.5 (12%) max: 426 MB/s
PCMark for Android - PCM f. Android Storage 2.0 score
min: 10366 avg: 11330 median: 10740 (17%) max: 12884 Points
PCMark for Android - PCM f. Android Work Score 3.0
min: 3195 avg: 5608 median: 5689.5 (26%) max: 7554 Points
CrossMark - CrossMark Overall
328 Points (13%)
Power Consumption - Geekbench 5.5 Power Consumption 150cd *
min: 3.34 avg: 3.6 median: 3.6 (2%) max: 3.83 Watt
Power Consumption - Idle Power Consumption 150cd 1min *
min: 1.32 avg: 1.6 median: 1.6 (2%) max: 1.953 Watt
Average Benchmarks HiSilicon Kirin 710 → 100% n=18 Average Benchmarks Qualcomm Snapdragon 662 → 87% n=18 Average Benchmarks Qualcomm Snapdragon 636 → 82% n=18
- Range of benchmark values for this graphics card
- Average benchmark values for this graphics card
* Smaller numbers mean a higher performance
1 This benchmark is not used for the average calculation
v1.27
log 03. 13:52:45
#0 checking url part for id 10172 +0s ... 0s
#1 checking url part for id 12771 +0s ... 0s
#2 checking url part for id 9956 +0s ... 0s
#3 not redirecting to Ajax server +0s ... 0s
#4 did not recreate cache, as it is less than 5 days old! Created at Sat, 01 Jun 2024 05:37:57 +0200 +0.001s ... 0.001s
#5 composed specs +0.054s ... 0.055s
#6 did output specs +0s ... 0.055s
#7 getting avg benchmarks for device 10172 +0.015s ... 0.07s
#8 got single benchmarks 10172 +0.034s ... 0.103s
#9 getting avg benchmarks for device 12771 +0.013s ... 0.117s
#10 got single benchmarks 12771 +0.035s ... 0.152s
#11 getting avg benchmarks for device 9956 +0.003s ... 0.155s
#12 got single benchmarks 9956 +0.029s ... 0.184s
#13 got avg benchmarks for devices +0s ... 0.184s
#14 No cached benchmark found, getting uncached values +0.117s ... 0.301s
#15 min, max, avg, median took s +0.18s ... 0.482s
#16 return log +0s ... 0.482s
Please share our article, every link counts!
Redaktion, 2017-09- 8 (Update: 2023-07- 1)
 Deutsch
 English
 Español
 Français
 Italiano
 Nederlands
 Polski
 Português
 Русский
 Türkçe
 Svenska
 Chinese
 Magyar