Notebookcheck Logo

AMD A10-9600P vs Intel Core i3-7020U

AMD A10-9600P

► remove from comparison AMD A10-9600P

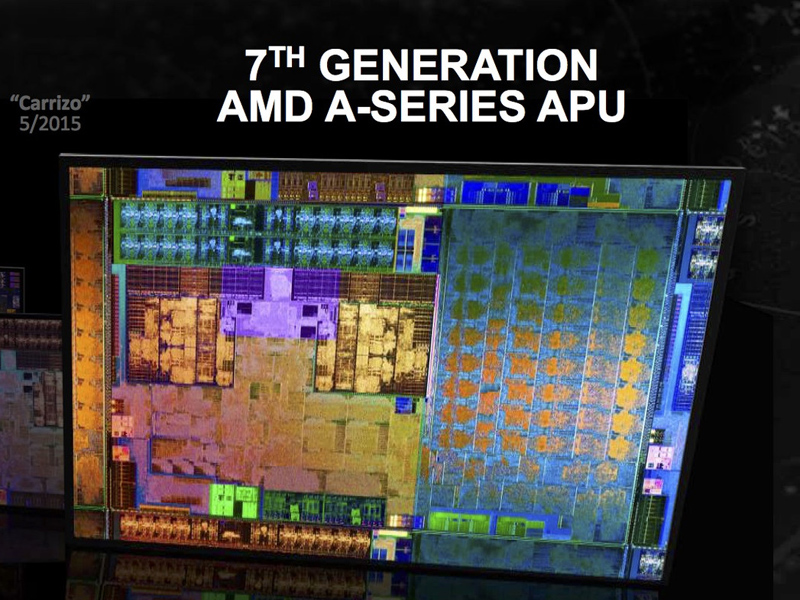
The AMD A10-9600P is a mid-range APU of the Bristol Ridge series (7th generation of APUs) with 4 CPU-cores (two Excavator modules) clocked at 2.4 - 3.3 GHz. It was announced in mid 2016 and is based on the same silicon as Carrizo but with more and refined features. It is a ULV-chip with a TDP of 15 Watt and integrates a Radeon R5 graphics card (384 shader cores / 6 compute cores) and a dual-channel DDR4-1866 memory controller. As Carrizo its a full featured SoC that offers all I/O ports on the chip.

The A10-9600P is slightly faster than the old 15-Watt top model of Carrizo, the FX-8800P. Therefore, the CPU performance is similar to a Broadwell 15 Watt Core i3 like The i3-5010U. See our Bristol Ridge article for more information on the architecture and improvements compared to Carrizo.

Intel Core i3-7020U

► remove from comparison Intel i3-7020U

The Intel Core i3-7020U is a dual-core processor of the Kaby Lake architecture. It offers two CPU cores clocked at 2.3 GHz (without Turbo Boost) and integrates HyperThreading to work with up to 4 threads at once. The architectural differences are rather small compared to the Skylake generation, therefore the performance per MHz should be very similar. The SoC includes a dual channel DDR4 memory controller and Intel HD Graphics 620 graphics card (clocked at 300 - 1000 MHz). It is manufactured in an improved 14nm FinFET process at Intel. Compare to the old i3-7100U, the newer i3-7020U is clocked 100 MHz lower (CPU cores) and therefore the current entry level model for the Core i3 line. The similar Pentium Gold 4415U offers less Cache (2 versus 3 MB) and a slower GPU.

Architecture

Intel basically uses the same micro architecture compared to Skylake, so the per-MHz performance does not differ. The manufacturer only reworked the Speed Shift technology for faster dynamic adjustments of voltages and clocks, and the improved 14nm process allows much higher frequencies combined with better efficiency than before.

ModelAMD A10-9600PIntel Core i3-7020U
SeriesAMD Bristol RidgeIntel Kaby Lake
CodenameBristol RidgeKaby Lake
Series: Kaby Lake Kaby Lake
AMD FX-9830P compare3 - 3.7 GHz4 / 4 cores
AMD PRO A12-9830B compare3 - 3.7 GHz4 / 4 cores
AMD FX-9800P compare2.7 - 3.6 GHz4 / 4 cores
AMD PRO A12-9800B compare2.7 - 3.6 GHz4 / 4 cores
AMD A12-9720P compare2.7 - 3.6 GHz4 / 4 cores
AMD A12-9700P compare2.5 - 3.4 GHz4 / 4 cores
AMD A10-9620P compare2.5 - 3.4 GHz4 / 4 cores
AMD A10-9600P « 2.4 - 3.3 GHz4 / 4 cores
AMD PRO A8-9600B compare2.4 - 3.3 GHz4 / 4 cores
Intel Core i7-7700K compare4.2 - 4.5 GHz4 / 8 cores8 MB L3
Intel Core i7-7700 compare3.6 - 4.2 GHz4 / 8 cores8 MB L3
Intel Xeon E3-1535M v6 compare3.1 - 4.2 GHz4 / 8 cores8 MB L3
Intel Core i7-7920HQ compare3.1 - 4.1 GHz4 / 8 cores8 MB L3
Intel Core i7-7700T compare2.9 - 3.8 GHz4 / 8 cores8 MB L3
Intel Core i5-7600K compare3.8 - 4.2 GHz4 / 4 cores8 MB L3
Intel Xeon E3-1505M v6 compare3 - 4 GHz4 / 8 cores8 MB L3
Intel Core i7-7820HQ compare2.9 - 3.9 GHz4 / 8 cores8 MB L3
Intel Core i7-7820HK compare2.9 - 3.9 GHz4 / 8 cores8 MB L3
Intel Core i7-7700HQ compare2.8 - 3.8 GHz4 / 8 cores6 MB L3
Intel Core i5-7500 compare3.4 - 3.8 GHz4 / 4 cores6 MB L3
Intel Core i5-7440HQ compare2.8 - 3.8 GHz4 / 4 cores6 MB L3
Intel Core i7-7567U compare3.5 - 4 GHz2 / 4 cores4 MB L3
Intel Core i7-7660U compare2.5 - 4 GHz2 / 4 cores4 MB L3
Intel Core i7-7600U compare2.8 - 3.9 GHz2 / 4 cores4 MB L3
Intel Core i5-7300HQ compare2.5 - 3.5 GHz4 / 4 cores6 MB L3
Intel Core i5-7500T compare2.7 - 3.3 GHz4 / 4 cores6 MB L3
Intel Core i5-7287U compare3.3 - 3.7 GHz2 / 4 cores4 MB L3
Intel Core i7-7560U compare2.4 - 3.8 GHz2 / 4 cores4 MB L3
Intel Core i5-7267U compare3.1 - 3.5 GHz2 / 4 cores4 MB L3
Intel Core i5-7360U compare2.3 - 3.6 GHz2 / 4 cores4 MB L3
Intel Core i7-7500U compare2.7 - 3.5 GHz2 / 4 cores4 MB L3
Intel Core i5-7300U compare2.6 - 3.5 GHz2 / 4 cores3 MB L3
Intel Core i5-7260U compare2.2 - 3.4 GHz2 / 4 cores4 MB L3
Intel Core i5-7200U compare2.5 - 3.1 GHz2 / 4 cores3 MB L3
Intel Core i3-7100H compare3 GHz2 / 4 cores3 MB L3
Intel Core i3-7167U compare2.8 GHz2 / 4 cores3 MB L3
Intel Core i7-7Y75 compare1.3 - 3.6 GHz2 / 4 cores4 MB L3
Intel Core i5-7Y57 compare1.2 - 3.3 GHz2 / 4 cores4 MB L3
Intel Core i5-7Y54 compare1.2 - 3.2 GHz2 / 4 cores4 MB L3
Intel Core i3-7100U compare2.4 GHz2 / 4 cores3 MB L3
Intel Core m3-7Y32 compare1 - 3 GHz2 / 4 cores4 MB L3
Intel Pentium Gold 4415U compare2.3 GHz2 / 4 cores2 MB L3
Intel Core m3-7Y30 compare1 - 2.6 GHz2 / 4 cores4 MB L3
Intel Celeron 3965U compare2.2 GHz2 / 2 cores2 MB L3
Intel Core i3-7020U « 2.3 GHz2 / 4 cores3 MB L3
Intel Celeron 3867U compare1.8 GHz2 / 2 cores2 MB L3
Intel Celeron 3865U compare1.8 GHz2 / 2 cores2 MB L3
Intel Pentium Gold 4425Y compare1.7 GHz2 / 4 cores2 MB L3
Intel Pentium Gold 4415Y compare1.6 GHz2 / 4 cores2 MB L3
Intel Pentium Gold 4410Y compare1.5 GHz2 / 4 cores2 MB L3
Intel Celeron 3965Y compare1.5 GHz2 / 2 cores2 MB L3
Clock2400 - 3300 MHz2300 MHz
L2 Cache2 MB512 KB
Cores / Threads4 / 42 / 4
TDP15 Watt15 Watt
Transistors3100 Million
Technology28 nm14 nm
Die Size250 mm2
max. Temp.90 °C100 °C
FeaturesDual-Channel DDR3/DDR4-1866 Memory Controller, PCIe 3.0 x8Dual-Channel DDR4 Memory Controller, HyperThreading, AVX, AVX2, Quick Sync, Virtualization, AES-NI
iGPUAMD Radeon R5 (Bristol Ridge) ( - 720 MHz)Intel HD Graphics 620 (300 - 1000 MHz)
Architecturex86x86
Announced
Manufacturerproducts.amd.comark.intel.com
L1 Cache128 KB
L3 Cache3 MB
SocketBGA1356
$281 U.S.

Benchmarks

Cinebench R15 - Cinebench R15 CPU Multi 64 Bit
min: 195     avg: 211     median: 216 (1%)     max: 217 Points
227 Points (1%)
Cinebench R15 - Cinebench R15 CPU Single 64 Bit
min: 70     avg: 74.8     median: 76 (23%)     max: 77 Points
93 Points (28%)
Cinebench R11.5 - Cinebench R11.5 CPU Multi 64 Bit
min: 2.59     avg: 2.6     median: 2.6 (3%)     max: 2.6 Points
Cinebench R11.5 - Cinebench R11.5 CPU Single 64 Bit
min: 0.87     avg: 0.9     median: 0.9 (22%)     max: 0.9 Points
Cinebench R10 - Cinebench R10 Rend. Single (32bit)
min: 2340     avg: 2439     median: 2447 (15%)     max: 2520 Points
3588 Points (22%)
Cinebench R10 - Cinebench R10 Rend. Multi (32bit)
min: 5913     avg: 6467     median: 6508 (5%)     max: 6939 Points
8083 Points (6%)
wPrime 2.10 - wPrime 2.0 1024m *
534 s (6%)
wPrime 2.10 - wPrime 2.0 32m *
15.3 s (3%)
WinRAR - WinRAR 4.0
1526 Points (2%)
1920 Points (3%)
X264 HD Benchmark 4.0 - x264 Pass 2
16.3 fps (6%)
15.6 fps (5%)
X264 HD Benchmark 4.0 - x264 Pass 1
85.4 fps (20%)
80 fps (18%)
TrueCrypt - TrueCrypt Serpent
0.2 GB/s (0%)
0.1 GB/s (0%)
TrueCrypt - TrueCrypt Twofish
0.3 GB/s (6%)
0.2 GB/s (4%)
TrueCrypt - TrueCrypt AES
1.5 GB/s (4%)
1.4 GB/s (4%)
3DMark 06 - CPU - 3DMark 06 - CPU
min: 2969     avg: 3224     median: 3287 (7%)     max: 3352 Points
Super Pi mod 1.5 XS 1M - Super Pi mod 1.5 XS 1M *
18.7 s (4%)
12 s (3%)
Super Pi mod 1.5 XS 2M - Super Pi mod 1.5 XS 2M *
41.3 s (2%)
28 s (1%)
Super Pi Mod 1.5 XS 32M - Super Pi mod 1.5 XS 32M *
942 s (4%)
706 s (3%)
3DMark Vantage - 3DM Vant. Perf. CPU no Physx
min: 7115     avg: 7516     median: 7515.5 (7%)     max: 7916 Points
3DMark 11 - 3DM11 Performance Physics
min: 2246     avg: 2418     median: 2387 (6%)     max: 2634 Points
3DMark - 3DMark Ice Storm Physics
min: 21570     avg: 23140     median: 23093 (19%)     max: 24803 Points
3DMark - 3DMark Ice Storm Extreme Physics
min: 18940     avg: 21504     median: 21065.5 (17%)     max: 24944 Points
3DMark - 3DMark Ice Storm Unlimited Physics
min: 22601     avg: 25235     median: 26061 (22%)     max: 26217 Points
3DMark - 3DMark Cloud Gate Physics
min: 1722     avg: 2000     median: 2031.5 (5%)     max: 2214 Points
3DMark - 3DMark Fire Strike Standard Physics
min: 2455     avg: 2912     median: 2981 (5%)     max: 3229 Points
3DMark - 3DMark Time Spy CPU
1045 Points (4%)
Geekbench 4.0 - Geekbench 4.0 64 Bit Single-Core
2047 Points (28%)
Geekbench 4.0 - Geekbench 4.0 64 Bit Multi-Core
4711 Points (11%)
Geekbench 3 - Geekbench 3 32 Bit Multi-Core
min: 5252     avg: 5386     median: 5423 (10%)     max: 5445 Points
4821 Points (9%)
Geekbench 3 - Geekbench 3 32 Bit Single-Core
min: 2000     avg: 2064     median: 2074 (41%)     max: 2109 Points
2221 Points (43%)
Geekbench 3 - Geekbench 3 64 Bit Multi-Core
5702 Points (9%)
4977 Points (8%)
Geekbench 3 - Geekbench 3 64 Bit Single-Core
2237 Points (33%)
2335 Points (35%)
Mozilla Kraken 1.1 - Kraken 1.1 Total Score *
min: 2098     avg: 2251     median: 2328 (3%)     max: 2328 ms
Sunspider - Sunspider 1.0 Total Score *
min: 133.3     avg: 138.2     median: 133.3 (1%)     max: 148.1 ms
Octane V2 - Octane V2 Total Score
min: 18921     avg: 19501     median: 19791 (18%)     max: 19791 Points

Average Benchmarks AMD A10-9600P → 100% n=17

Average Benchmarks Intel Core i3-7020U → 102% n=17

- Range of benchmark values for this graphics card
- Average benchmark values for this graphics card
* Smaller numbers mean a higher performance
1 This benchmark is not used for the average calculation

Add one or more devices and compare

In the following list you can select (and also search for) devices that should be added to the comparison. You can select more than one device.

restrict list:

show all (including archived), 2024, 2023
v1.26
log 18. 22:18:04

#0 checking url part for id 8094 +0s ... 0s

#1 checking url part for id 10921 +0s ... 0s

#2 not redirecting to Ajax server +0s ... 0s

#3 did not recreate cache, as it is less than 5 days old! Created at Fri, 17 May 2024 11:21:47 +0200 +0.001s ... 0.001s

#4 composed specs +0.037s ... 0.038s

#5 did output specs +0s ... 0.038s

#6 getting avg benchmarks for device 8094 +0.003s ... 0.041s

#7 got single benchmarks 8094 +0.026s ... 0.067s

#8 getting avg benchmarks for device 10921 +0.003s ... 0.07s

#9 got single benchmarks 10921 +0.036s ... 0.106s

#10 got avg benchmarks for devices +0s ... 0.106s

#11 min, max, avg, median took s +0.171s ... 0.277s

#12 return log +0.022s ... 0.299s

Please share our article, every link counts!
> Expert Reviews and News on Laptops, Smartphones and Tech Innovations > Benchmarks / Tech > Processor Comparison - Head 2 Head
Redaktion, 2017-09- 8 (Update: 2023-07- 1)