Notebookcheck Logo

Intel Core i7-4770K vs Intel Core i5-10600K

Intel Core i7-4770K

► remove from comparison Intel 4770K

The Intel Core i7-4770K is a high-end quad-core processor for desktops and successor of the i7-3770K. It is based on the Haswell architecture and has been launched in Q2/2013. Due to Hyperthreading, the four cores can handle up to eight threads in parallel leading to better utilization of the CPU. Each core offers a base speed of 3.5 GHz but can dynamically increase clock rates with Turbo Boost up to 3.7 GHz (for 4 active cores), 3.8 GHz (for 2 active cores) and 3.9 GHz (for 1 active core). Furthermore, the Extreme CPUs offer an unlocked multiplicator for easy overclocking.

Haswell is the successor to the Ivy Bridge architecture with improvements on both GPU and CPU performance. The CPUs are produced in 22nm and offer an optimized branch prediction as well as additional execution ports, improving especially the Hyper-Threading performance. Furthermore, new features like AVX2 and FMA should increase the performance in future applications.

Due to these changes, the performance per clock has been improved by about 8 percent compared to the Ivy Bridge Core i7-3770K.

The integrated Intel HD Graphics 4600 offers 20 Execution Units (EUs) clocked at 400 MHz up to 1250 MHz with Turbo Boost, making it about 30 % faster than the HD 4000.

The i7-4770K is rated at a TDP of 84 W including graphics card, memory controller and VRMs. This is significantly higher than the 3770K which is rated at 77 Watt.

Intel Core i5-10600K

► remove from comparison Intel i5-10600K

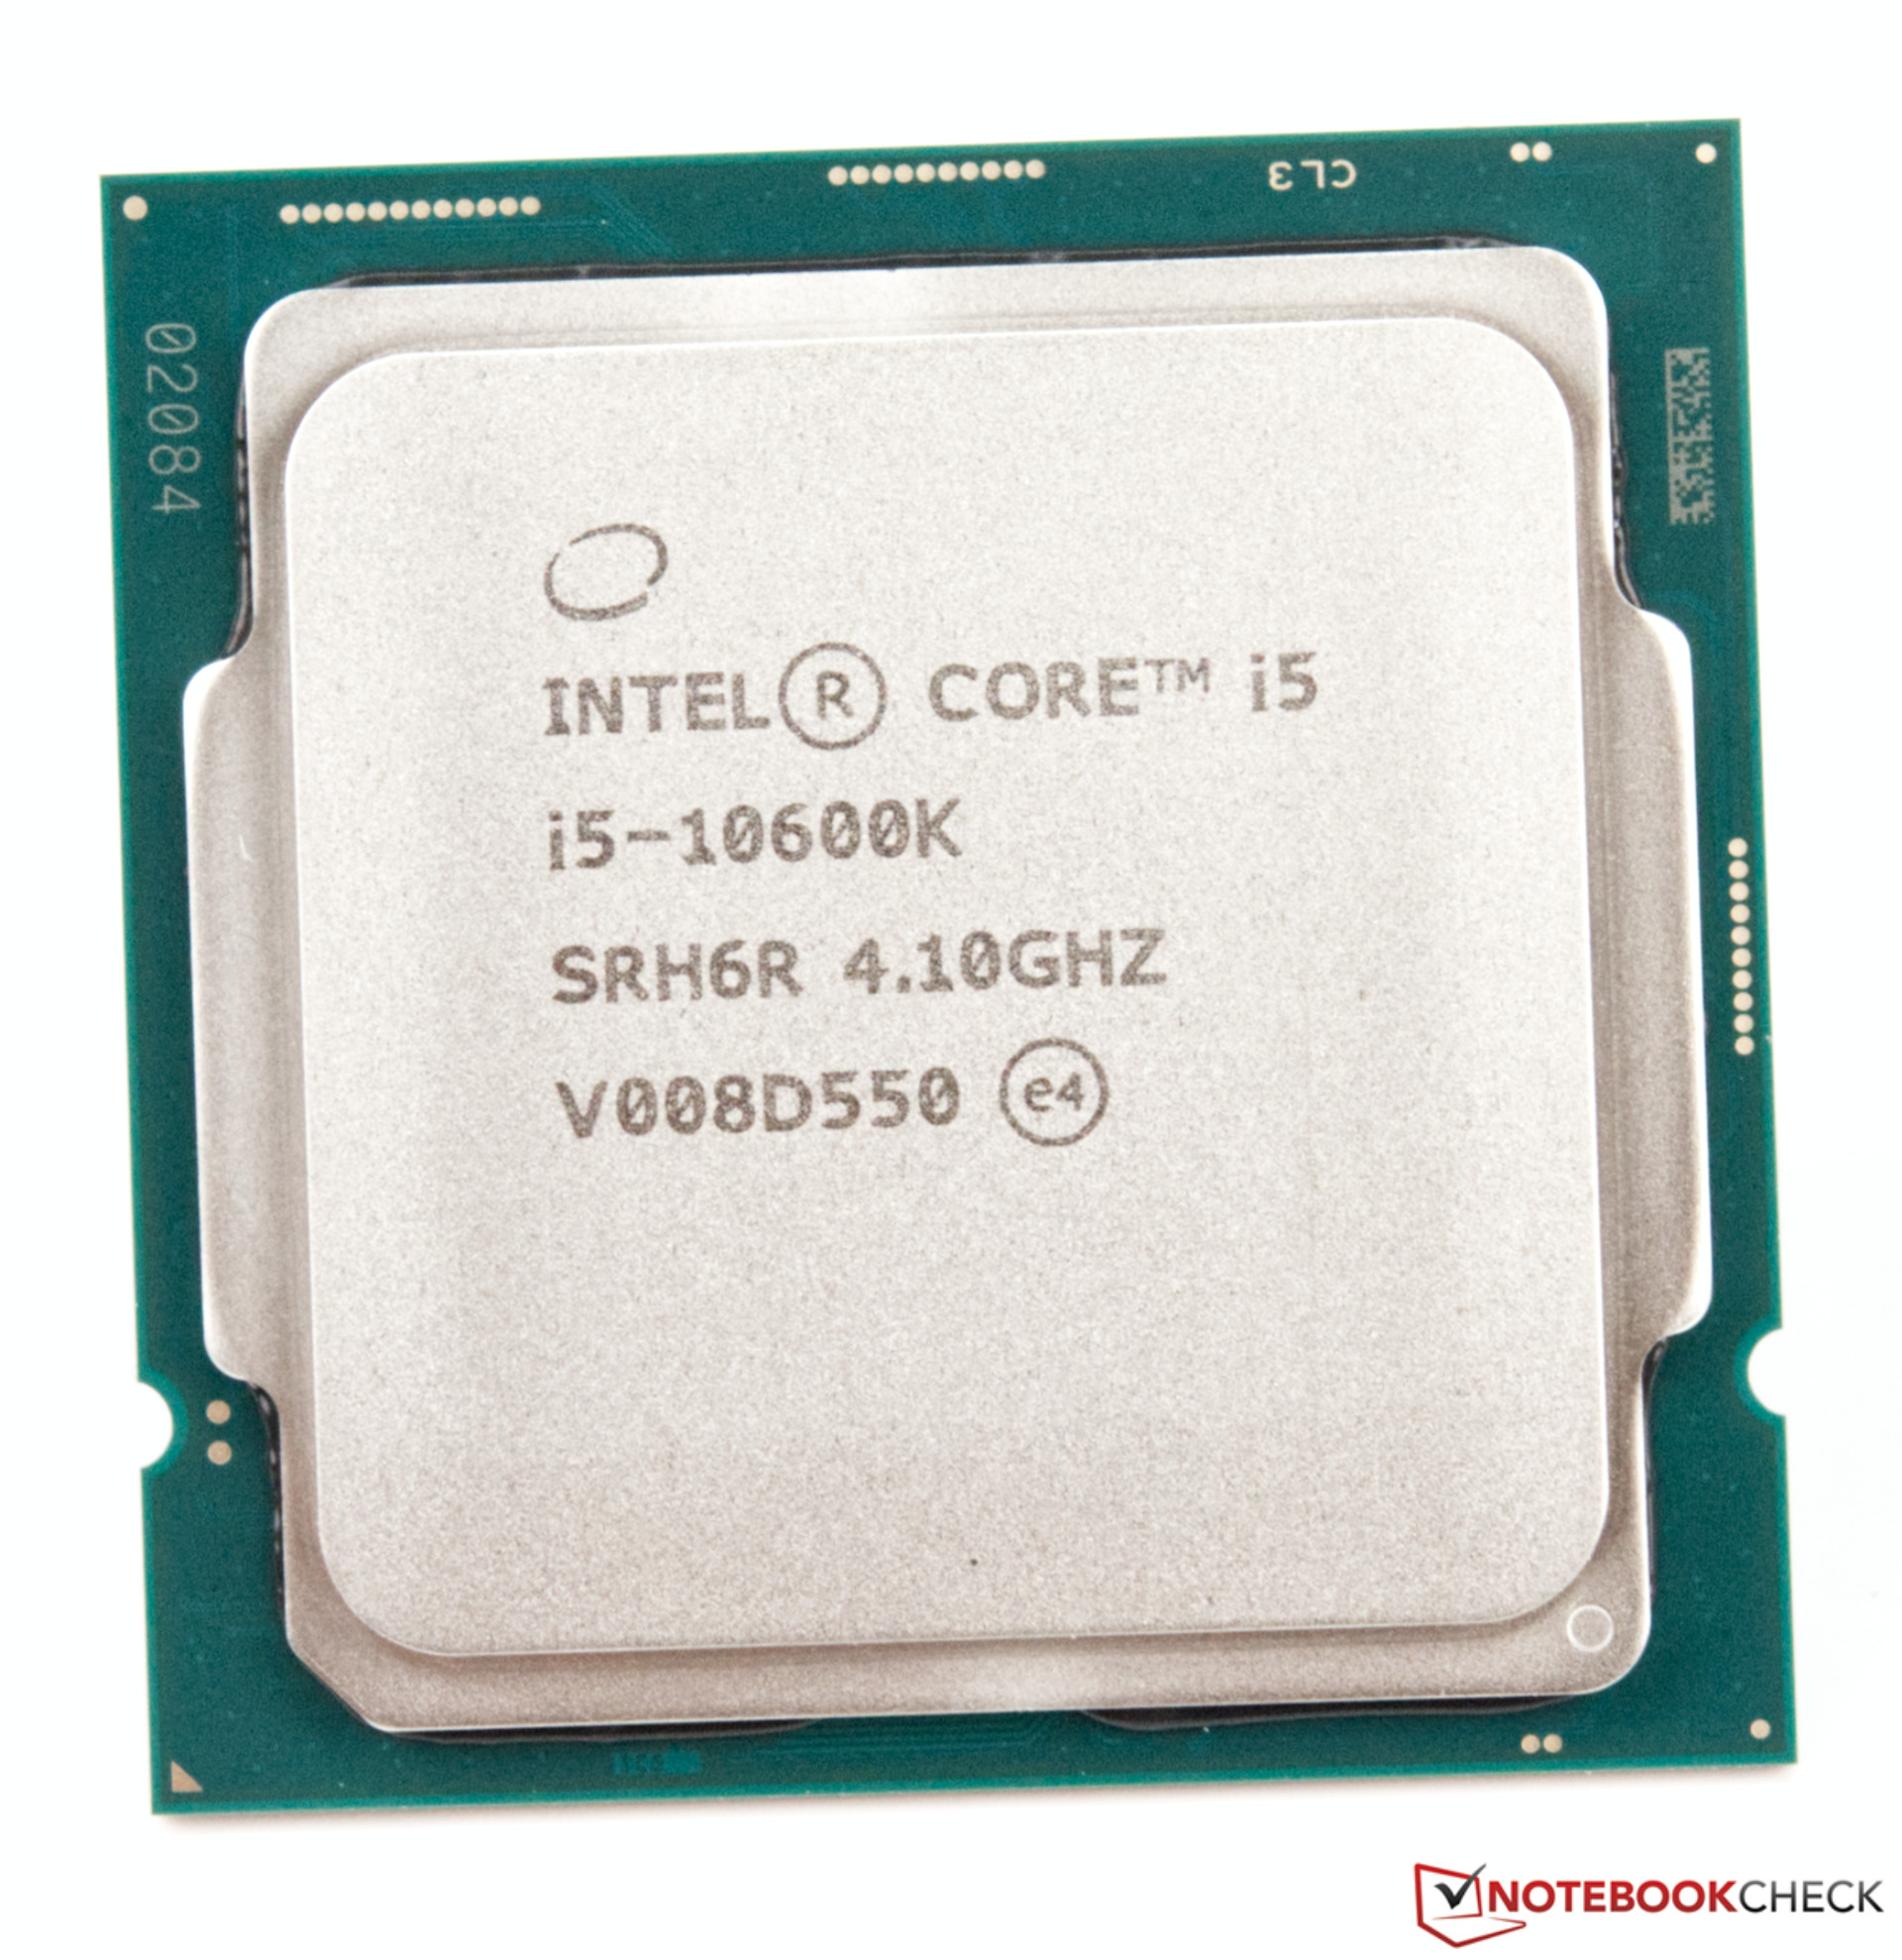
The Intel Core i5-10600K is a mid-range processor for desktops with six cores based on the Comet Lake architecture (CML-S, 4th generation of Skylake). The processor clocks at between 4.1 and 4.8 GHz and can execute up to twelfe threads simultaneously thanks to Hyper-Threading. 

The processor is still manufactured in the old 14nm (14nm++) process. Thanks to the free multiplicator, the CPU can also be easily overclocked (but may not have much headroom).

The Comet Lake architecture is similar to Coffee Lake and offers the same features and is produced in the same 14nm process. Other than the improved clock rates, the memory controller now also supports faster DDR4-2933 RAM. More information on Comet Lake and all the models and articles on it can be found here.

Performance

Thanks to the high clock speeds (and possible TDP settings with most mainboards), the Core i5-10600K offers a similar speed than the old Core i7-9700K quad core. Compared to current AMD offerings, the multi-core performance is on par with a Ryzen 5 3600, single core and gaming performance with a faster Ryzen 9 3900.

Graphics

The integrated Intel UHD Graphics 630 iGPU is supposed to offer a similar performance as the UHD630 in the Core i7-9900K. As a  low-end solution it will only run current games smoothly at reduced details - if at all.

Power Consumption

Intel specifies the TDP with 125 Watts (PL1) but under full load up to 250 Watt are consumed (PL2). In default mode these 250 Watt and therefore high clock speeds can be maintained for up to 56 seconds, however, all boards offer the option to alter these settings.

ModelIntel Core i7-4770KIntel Core i5-10600K
SeriesIntel Core i7 (Desktop)Intel Comet Lake
CodenameHaswellComet Lake
Series: Comet Lake Comet Lake
Intel Core i7-4790K compare4 - 4.4 GHz4 / 8 cores8 MB L3
Intel Core i7-4790 compare3.6 - 4 GHz4 / 8 cores8 MB L3
Intel Core i7-4770K « 3.5 - 3.9 GHz4 / 8 cores8 MB L3
Intel Core i7-4790S compare3.2 - 4 GHz4 / 8 cores8 MB L3
Intel Core i7-4790T compare2.7 - 3.9 GHz4 / 8 cores8 MB L3
Intel Core i9-10900K compare3.7 - 5.3 GHz10 / 20 cores20 MB L3
Intel Core i7-10700K compare3.8 - 5.1 GHz8 / 16 cores16 MB L3
Intel Core i7-10700 compare2.9 - 4.8 GHz8 / 16 cores16 MB L3
Intel Core i5-10600K « 4.1 - 4.8 GHz6 / 12 cores12 MB L3
Intel Core i5-10400F compare2.9 - 4.3 GHz6 / 12 cores12 MB L3
Intel Core i3-10100F compare3.6 - 4.3 GHz4 / 8 cores6 MB L3
Clock3500 - 3900 MHz4100 - 4800 MHz
L1 Cache256 KB384 KB
L2 Cache1 MB1.5 MB
L3 Cache8 MB12 MB
Cores / Threads4 / 86 / 12
TDP84 Watt125 Watt
Transistors1400 Million
Technology22 nm14 nm
Die Size177 mm2
FeaturesHD Graphics 4600 (Turbo 1250 MHz), DDR3-1600 Memory Controller, HyperThreading, AVX, AVX2, Quick Sync, Virtualization, vProDDR4-2666 RAM, PCIe 3, 8 GT/s bus, vPro, MMX, SSE, SSE2, SSE3, SSSE3, SSE4.1, SSE4.2, AVX, AVX2, BMI2, ABM, FMA, ADX, VMX, SMX, SMEP, SMAP, MPX, EIST, TM1, TM2, HT, Turbo, SST, AES-NI, RDRAND, RDSEED, SGX
iGPUIntel HD Graphics 4600 (400 - 1200 MHz)Intel UHD Graphics 630 (350 - 1200 MHz)
Architecturex86x86
Announced
Manufacturerark.intel.comark.intel.com
max. Temp.100 °C
SocketLGA1200
$262 U.S.

Benchmarks

Performance Rating - CB R15 + R20 + 7-Zip + X265 + Blender + 3DM11 CPU - i5-10600K
35.1 pt (49%)
Cinebench R23 - Cinebench R23 Multi Core
10475 Points (10%)
Cinebench R23 - Cinebench R23 Single Core
1385 Points (59%)
Cinebench R20 - Cinebench R20 CPU (Single Core)
310 Points (34%)
464 Points (52%)
Cinebench R20 - Cinebench R20 CPU (Multi Core)
1280 Points (3%)
3443 Points (8%)
Cinebench R15 - Cinebench R15 CPU Multi 64 Bit
770 Points (5%)
1452 Points (9%)
Cinebench R15 - Cinebench R15 CPU Single 64 Bit
205 Points (62%)
Cinebench R11.5 - Cinebench R11.5 CPU Multi 64 Bit
8.2 Points (11%)
15.8 Points (21%)
Cinebench R11.5 - Cinebench R11.5 CPU Single 64 Bit
1.8 Points (44%)
2.2 Points (54%)
Cinebench R10 - Cinebench R10 Rend. Single (32bit)
5845 Points (35%)
7343 Points (44%)
Cinebench R10 - Cinebench R10 Rend. Multi (32bit)
22325 Points (16%)
40074 Points (29%)
Cinebench R10 - Cinebench R10 Rend. Multi (64bit)
28765 Points (20%)
51816 Points (36%)
Cinebench R10 - Cinebench R10 Rend. Single (64bit)
7716 Points (9%)
9594 Points (12%)
wPrime 2.10 - wPrime 2.0 1024m *
min: 221.3     avg: 222.5     median: 222.5 (3%)     max: 223.6 s
113.2 s (1%)
wPrime 2.10 - wPrime 2.0 32m *
min: 7.06     avg: 7.1     median: 7.1 (1%)     max: 7.1 s
4.6 s (1%)
WinRAR - WinRAR 4.0
5119 Points (8%)
6536 Points (10%)
7-Zip 18.03 - 7-Zip 18.03 Multli Thread 4 runs
40379 MIPS (23%)
7-Zip 18.03 - 7-Zip 18.03 Single Thread 4 runs
5289 MIPS (63%)
X264 HD Benchmark 4.0 - x264 Pass 2
45.8 fps (16%)
88.2 fps (31%)
X264 HD Benchmark 4.0 - x264 Pass 1
174.8 fps (40%)
251.5 fps (58%)
HWBOT x265 Benchmark v2.2 - HWBOT x265 4k Preset
12.2 fps (21%)
TrueCrypt - TrueCrypt Serpent
0.4 GB/s (0%)
0.8 GB/s (0%)
TrueCrypt - TrueCrypt Twofish
0.7 GB/s (12%)
1.4 GB/s (24%)
TrueCrypt - TrueCrypt AES
4.4 GB/s (11%)
8 GB/s (21%)
Blender - Blender 2.79 BMW27 CPU *
302.4 Seconds (2%)
R Benchmark 2.5 - R Benchmark 2.5 *
0.6 sec (13%)
3DMark 06 - CPU - 3DMark 06 - CPU
100%
1 4770K +
min: 7988     avg: 8030     median: 8030 (17%)     max: 8072 Points
Super Pi mod 1.5 XS 1M - Super Pi mod 1.5 XS 1M *
9.4 s (2%)
7.8 s (2%)
Super Pi mod 1.5 XS 2M - Super Pi mod 1.5 XS 2M *
20.9 s (1%)
17.5 s (1%)
Super Pi Mod 1.5 XS 32M - Super Pi mod 1.5 XS 32M *
500 s (2%)
438.7 s (2%)
SiSoft Sandra Dhrystone (MIPS) - SiSoft Sandra Dhrystone (MIPS)
100%
1 4770K +
124850 MIPS (59%)
SiSoft Sandra Whetstone (MFLOPS) - SiSoft Sandra Whetstone (MFLOPS)
100%
1 4770K +
95840 MFLOPS (74%)
3DMark Vantage - 3DM Vant. Perf. CPU no Physx
100%
1 4770K +
27595 Points (24%)
3DMark 11 - 3DM11 Performance Physics
min: 8226     avg: 8804     median: 8804 (24%)     max: 9382 Points
15961 Points (43%)
3DMark - 3DMark Ice Storm Physics
46962 Points (38%)
68275 Points (55%)
3DMark - 3DMark Ice Storm Extreme Physics
47647 Points (39%)
68908 Points (56%)
3DMark - 3DMark Ice Storm Unlimited Physics
70668 Points (60%)
3DMark - 3DMark Cloud Gate Physics
7317 Points (19%)
13014 Points (33%)
3DMark - 3DMark Fire Strike Standard Physics
min: 10088     avg: 10575     median: 10574.5 (19%)     max: 11061 Points
20040 Points (36%)
3DMark - 3DMark Time Spy CPU
8290 Points (35%)
Geekbench 5.5 - Geekbench 5.1 - 5.4 64 Bit Single-Core
1286 Points (54%)
Geekbench 5.5 - Geekbench 5.1 - 5.4 64 Bit Multi-Core
7248 Points (13%)
Geekbench 5.0 - Geekbench 5.0 64 Bit Single-Core
1281 Points (6%)
Geekbench 5.0 - Geekbench 5.0 64 Bit Multi-Core
7237 Points (23%)
Geekbench 4.4 - Geekbench 4.1 - 4.4 64 Bit Single-Core
5821 Points (58%)
Geekbench 4.4 - Geekbench 4.1 - 4.4 64 Bit Multi-Core
28391 Points (31%)
Geekbench 2 - 32 Bit - Geekbench Stream
100%
1 4770K +
7940 Points (64%)
Geekbench 2 - 32 Bit - Geekbench Memory
100%
1 4770K +
7720 Points (70%)
Geekbench 2 - 32 Bit - Geekbench Floating Point
100%
1 4770K +
14765 Points (29%)
Geekbench 2 - 32 Bit - Geekbench Integer
100%
1 4770K +
13200 Points (27%)
Geekbench 2 - 32 Bit - Geekbench Total Score
100%
1 4770K +
12125 Points (32%)
Mozilla Kraken 1.1 - Kraken 1.1 Total Score *
760 ms (1%)
WebXPRT 3 - WebXPRT 3 Score
239 Points (50%)
Power Consumption - Prime95 Power Consumption - external Monitor *
204.4 Watt (35%)
Power Consumption - Cinebench R15 Multi Power Consumption - external Monitor *
172.5 Watt (31%)
Power Consumption - Cinebench R15 Multi Power Efficiency - external Monitor
8.4 Points per Watt (6%)

Average Benchmarks Intel Core i7-4770K → 100% n=25

Average Benchmarks Intel Core i5-10600K → 158% n=25

- Range of benchmark values for this graphics card
- Average benchmark values for this graphics card
* Smaller numbers mean a higher performance
1 This benchmark is not used for the average calculation

Add one or more devices and compare

In the following list you can select (and also search for) devices that should be added to the comparison. You can select more than one device.

restrict list:

show all (including archived), 2024, 2023
v1.26
log 02. 07:44:57

#0 checking url part for id 4207 +0s ... 0s

#1 checking url part for id 12212 +0s ... 0s

#2 not redirecting to Ajax server +0s ... 0s

#3 did not recreate cache, as it is less than 5 days old! Created at Sat, 01 Jun 2024 05:37:57 +0200 +0.001s ... 0.001s

#4 composed specs +0.027s ... 0.028s

#5 did output specs +0s ... 0.028s

#6 getting avg benchmarks for device 4207 +0.003s ... 0.031s

#7 got single benchmarks 4207 +0.015s ... 0.046s

#8 getting avg benchmarks for device 12212 +0.022s ... 0.068s

#9 got single benchmarks 12212 +0.012s ... 0.079s

#10 got avg benchmarks for devices +0s ... 0.079s

#11 min, max, avg, median took s +0.323s ... 0.402s

#12 return log +0.034s ... 0.436s

Please share our article, every link counts!
> Expert Reviews and News on Laptops, Smartphones and Tech Innovations > Benchmarks / Tech > Processor Comparison - Head 2 Head
Redaktion, 2017-09- 8 (Update: 2023-07- 1)