

Zotac GeForce GTX 1070 Mini Graphics Card SLI Configuration Review

For the original German review, click here.
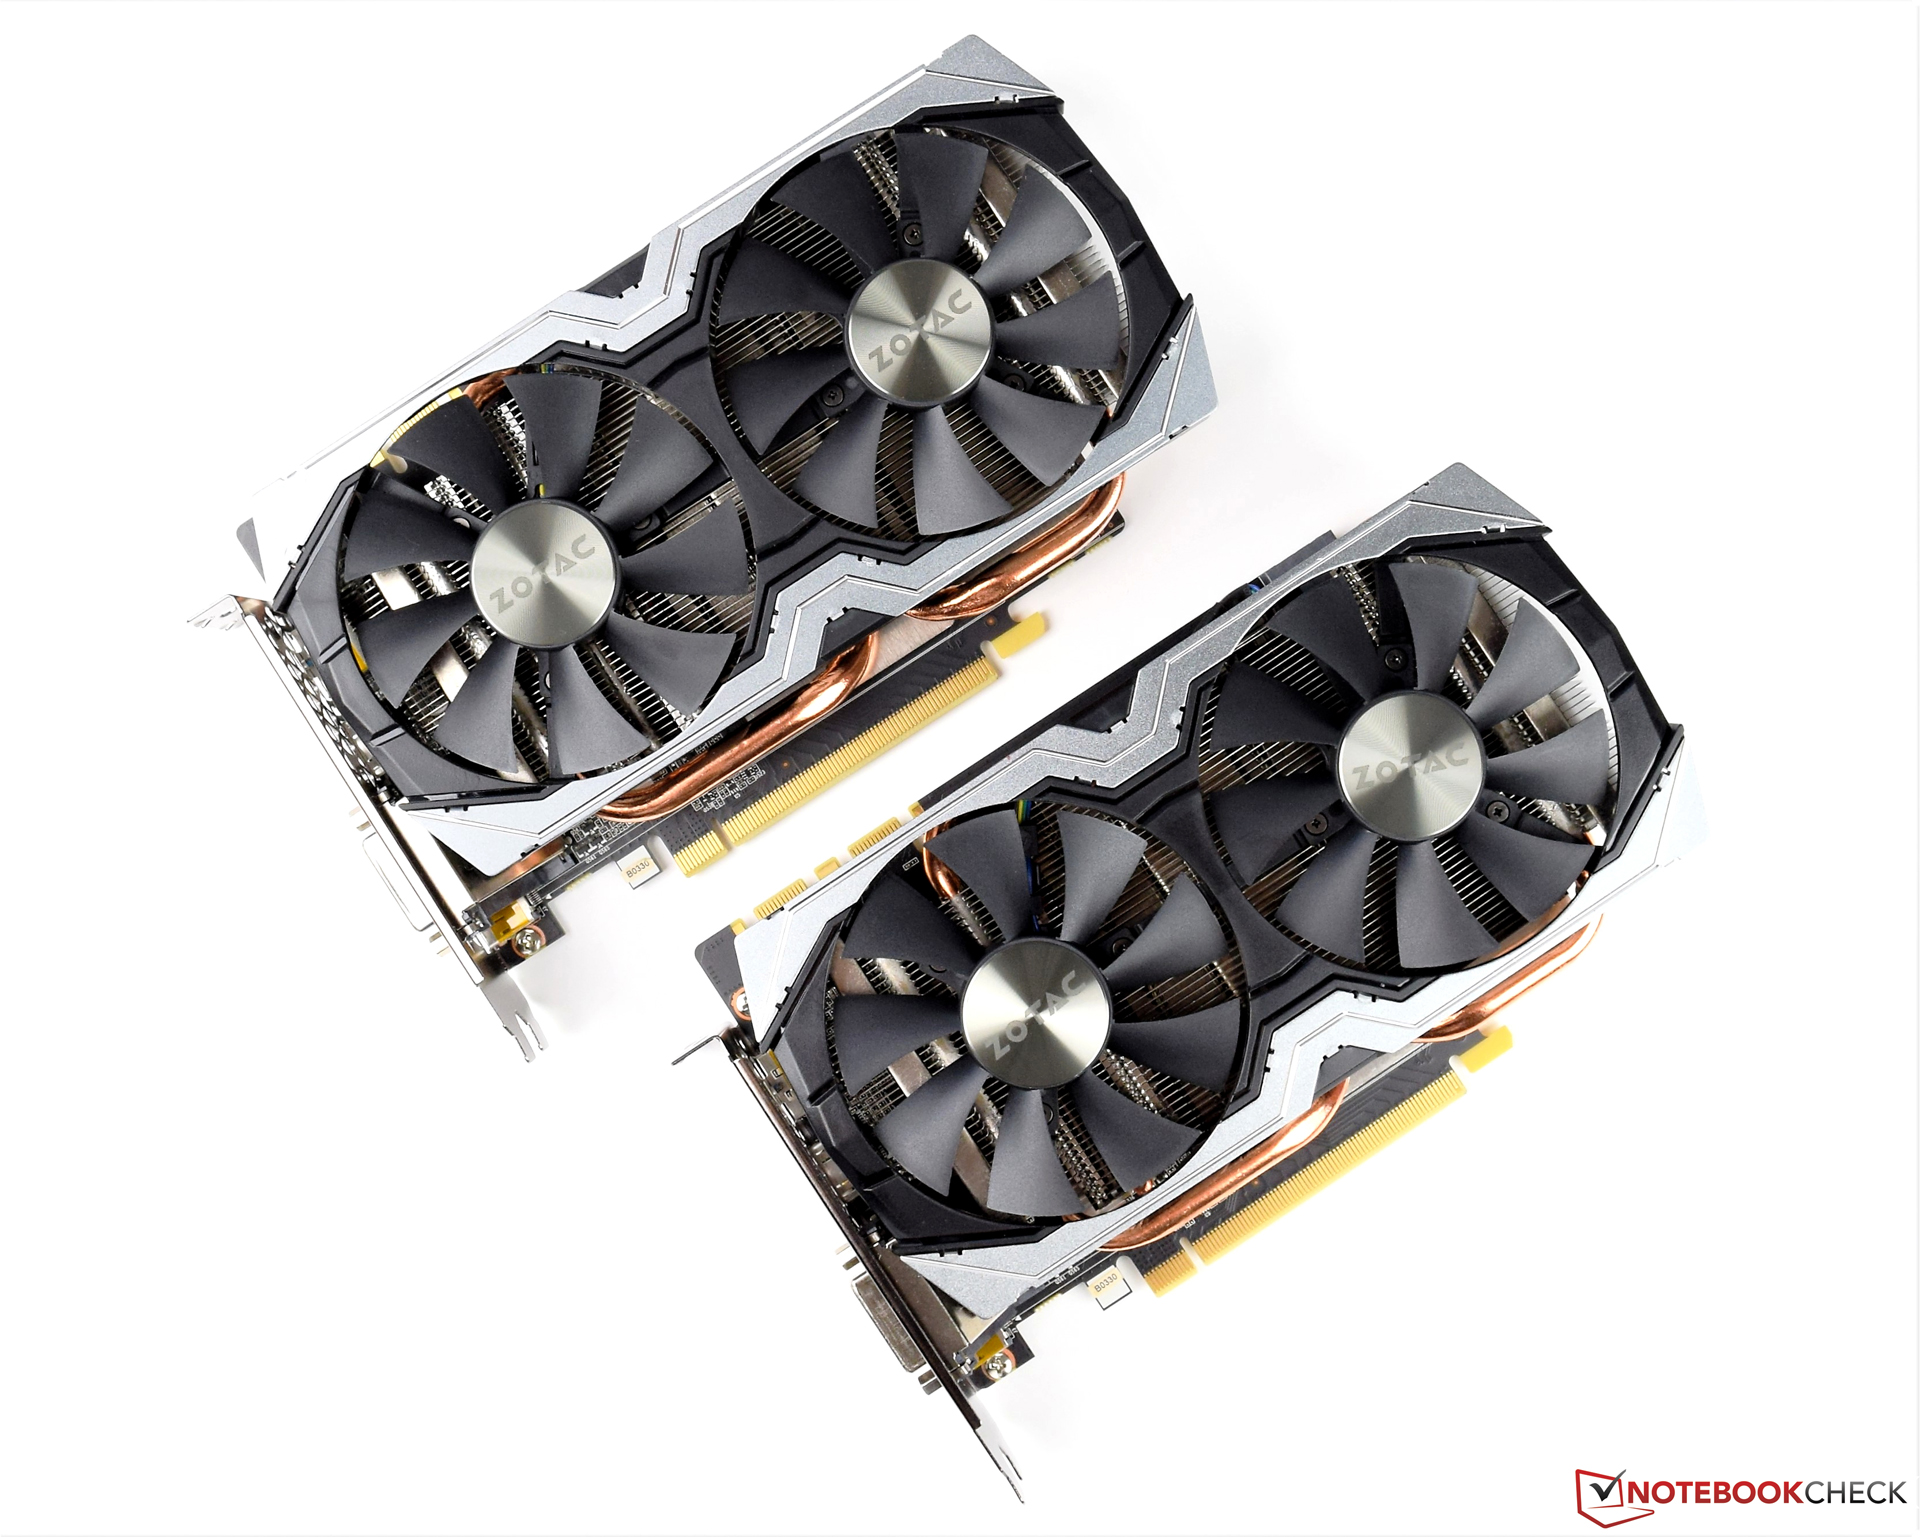
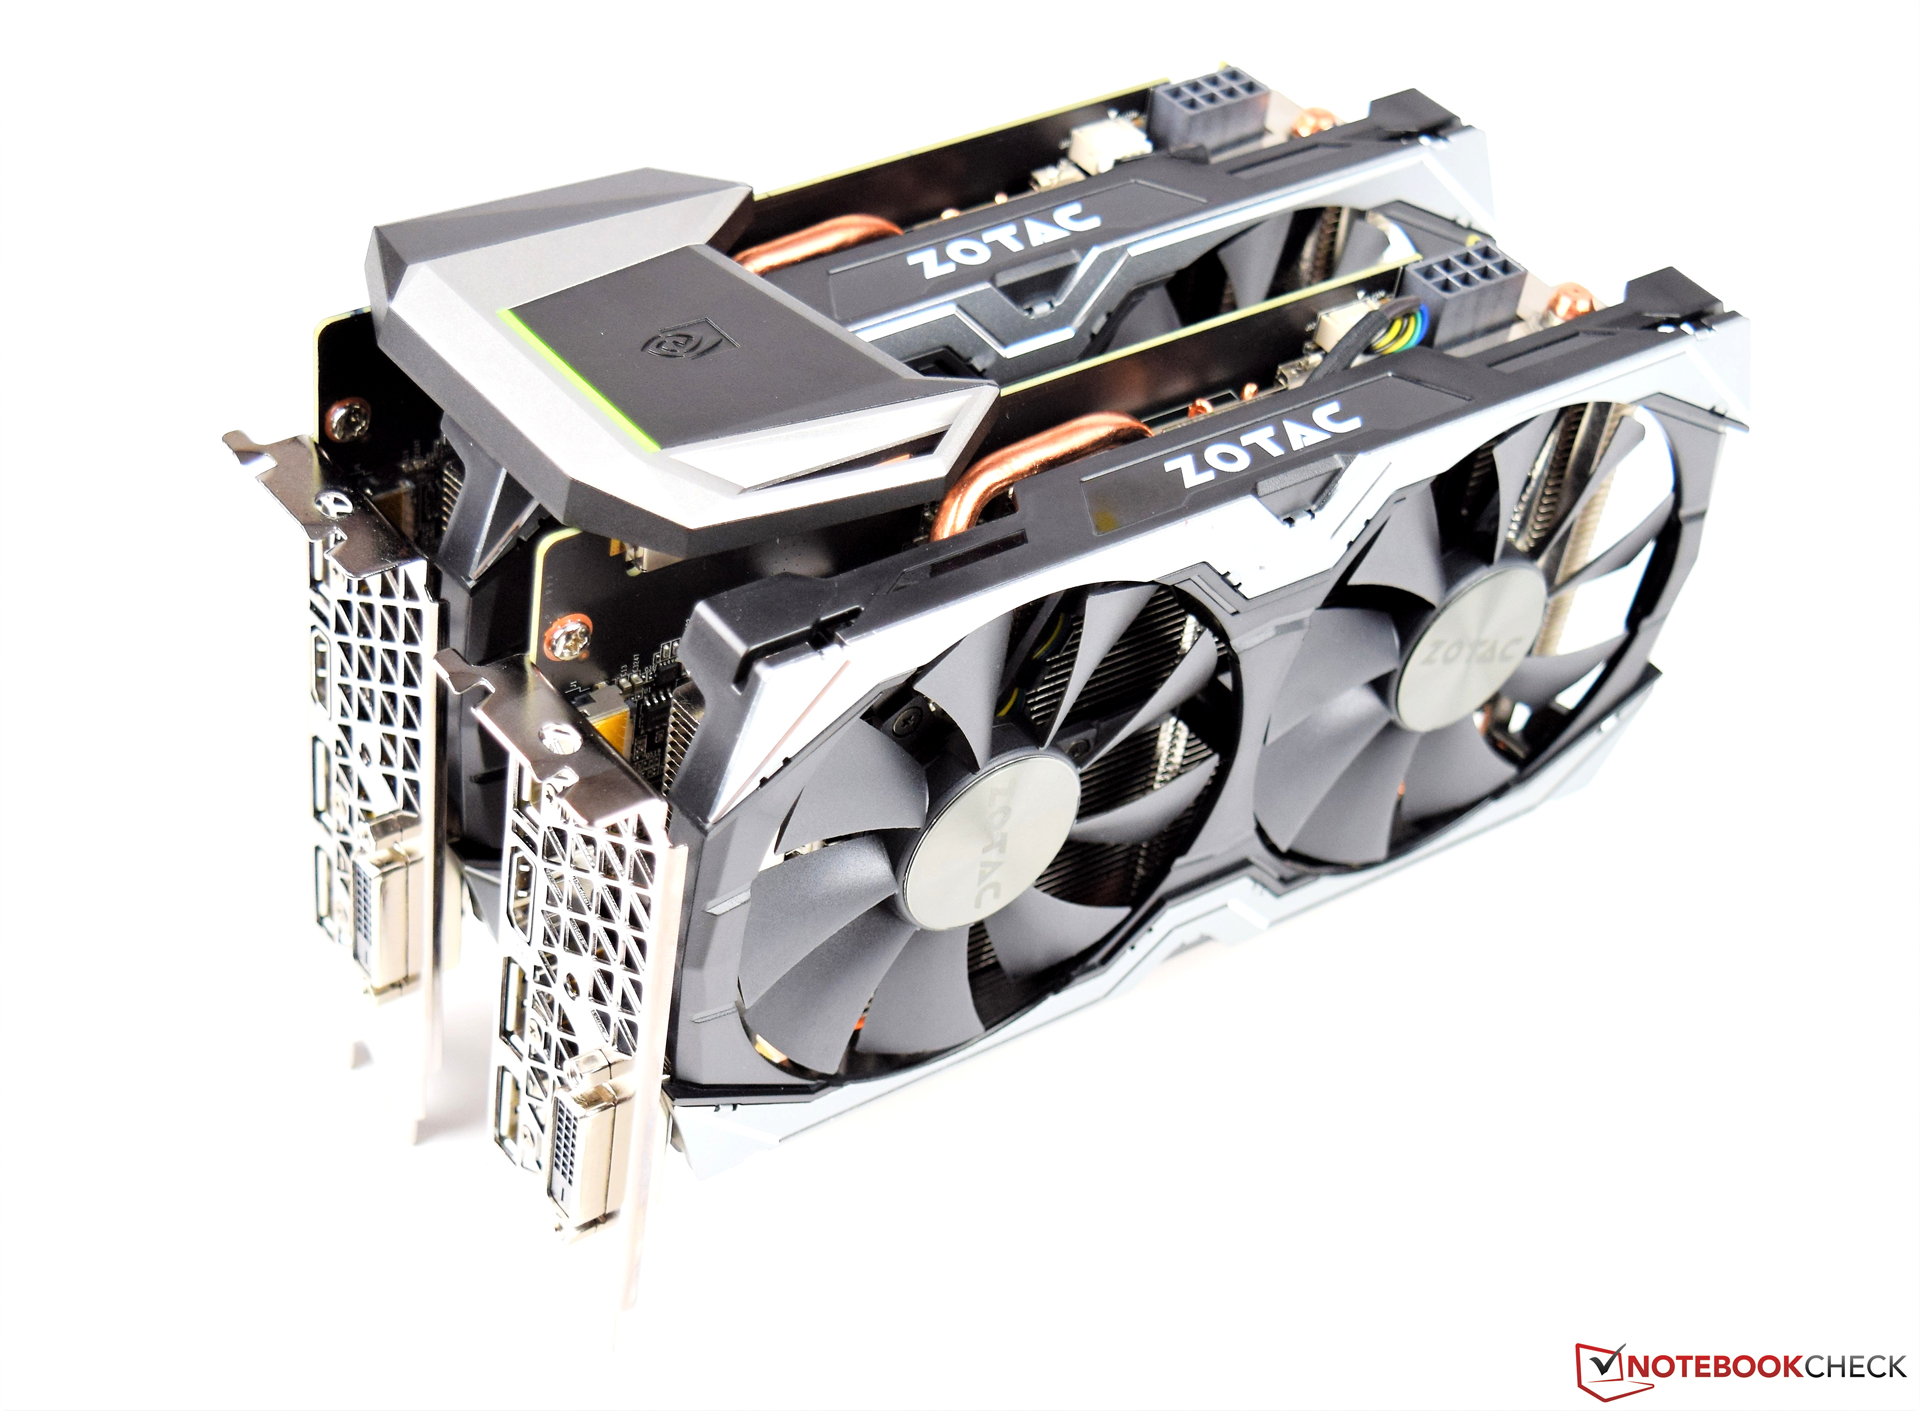
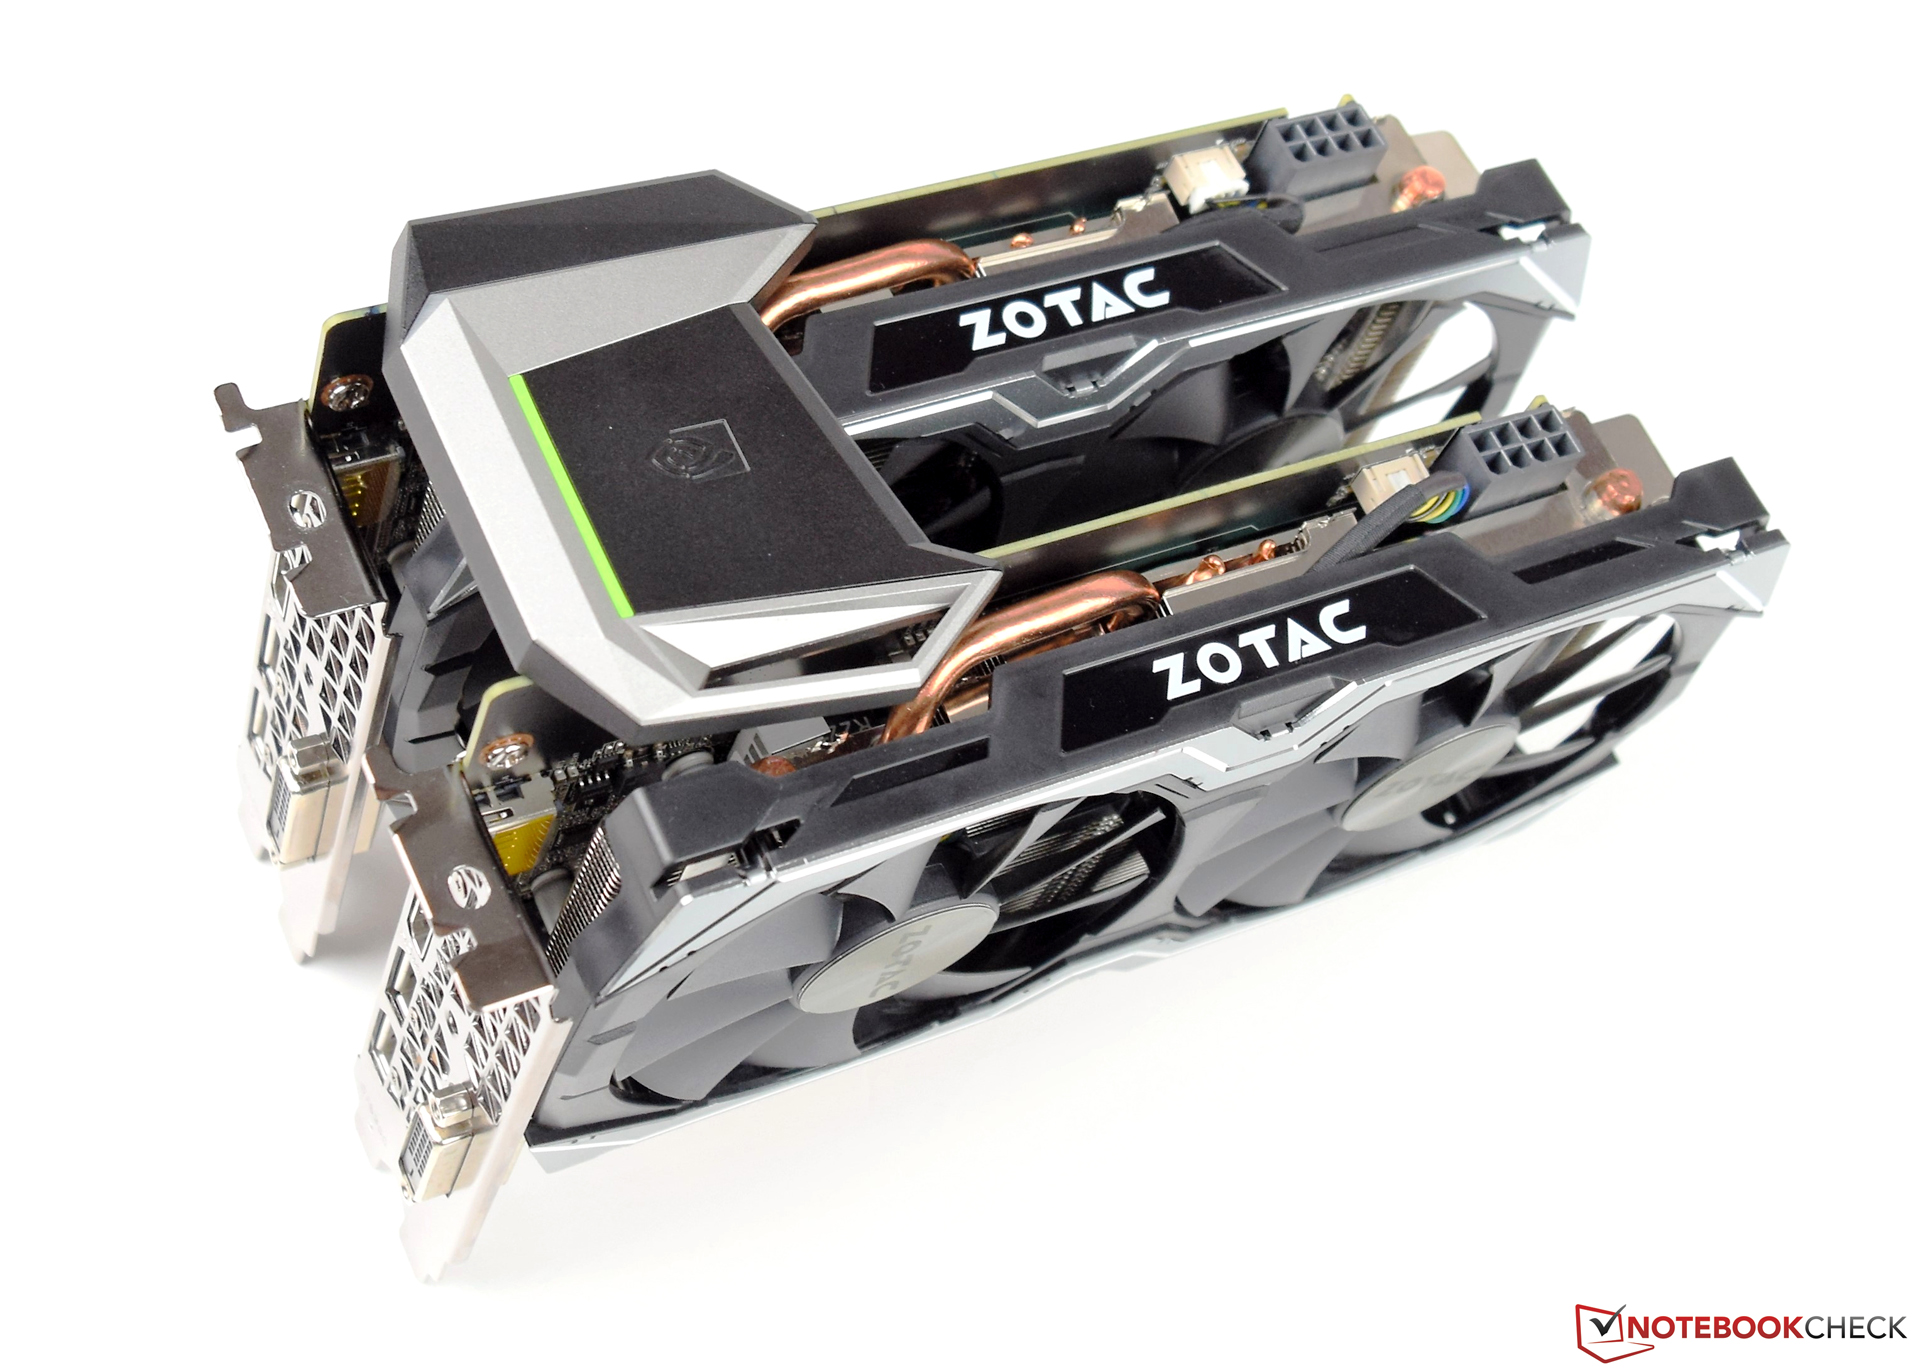
For our test, we use two Zotac GeForce GTX 1070 Mini Graphics Cards. It's important to check first which GPUs actually support the technology: the GeForce GTX 1070 happens to be the lowest model in the Pascal lineup; the more powerful GTX 1080, GTX 1080 Ti and both Titan version (X und XP) support SLI as well. Users who own an Nvidia GeForce GTX 1060 are stuck and can't improve the performance by adding a second card.
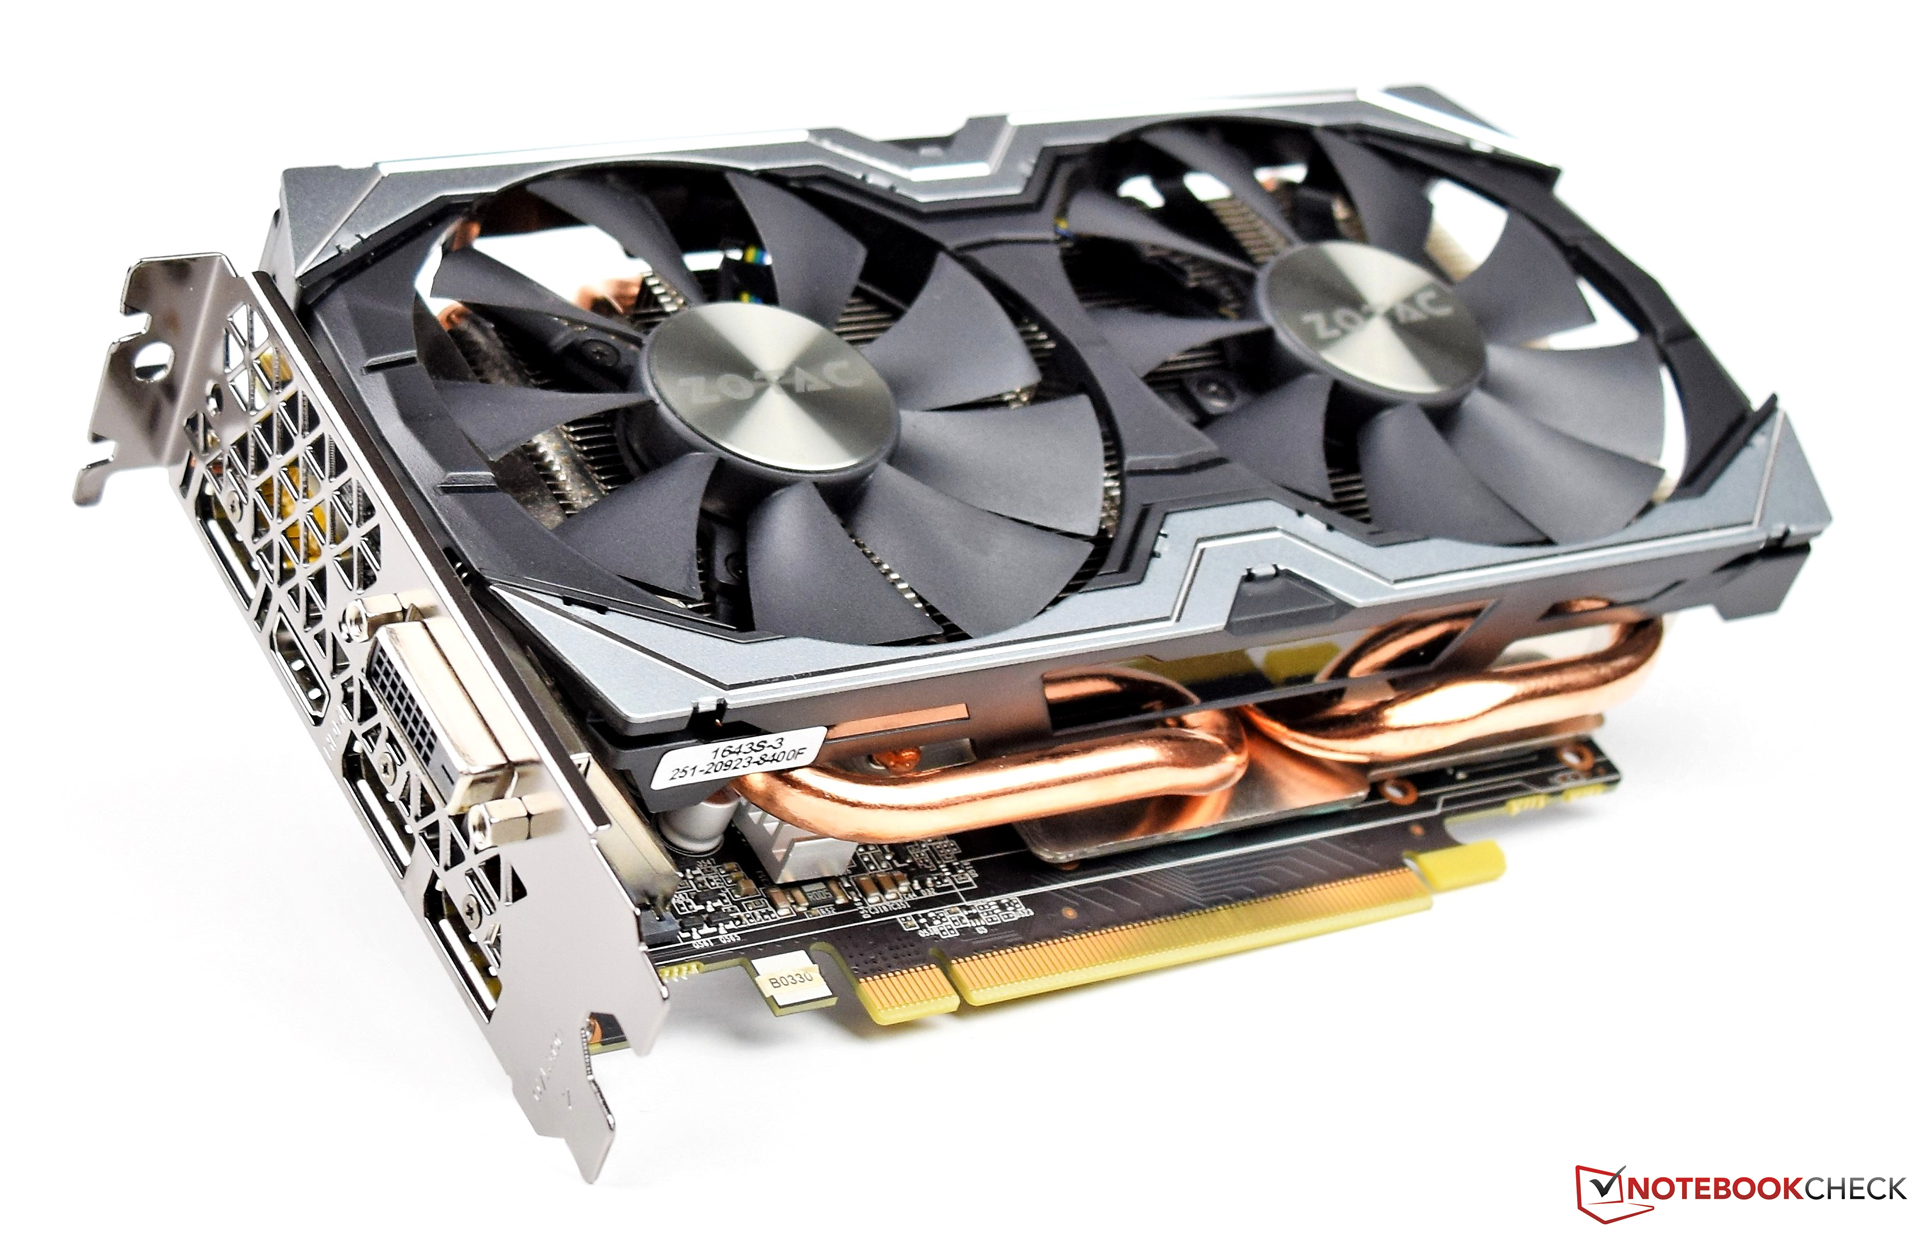
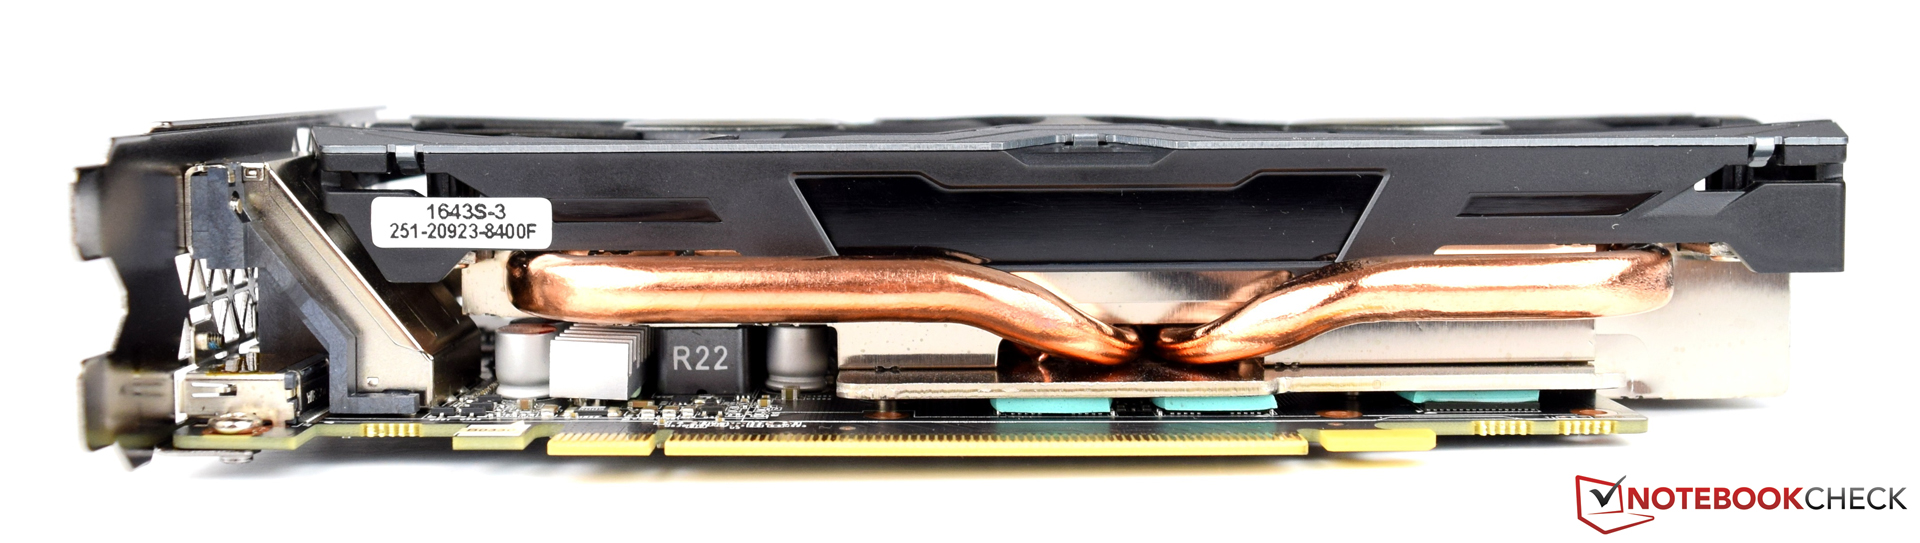
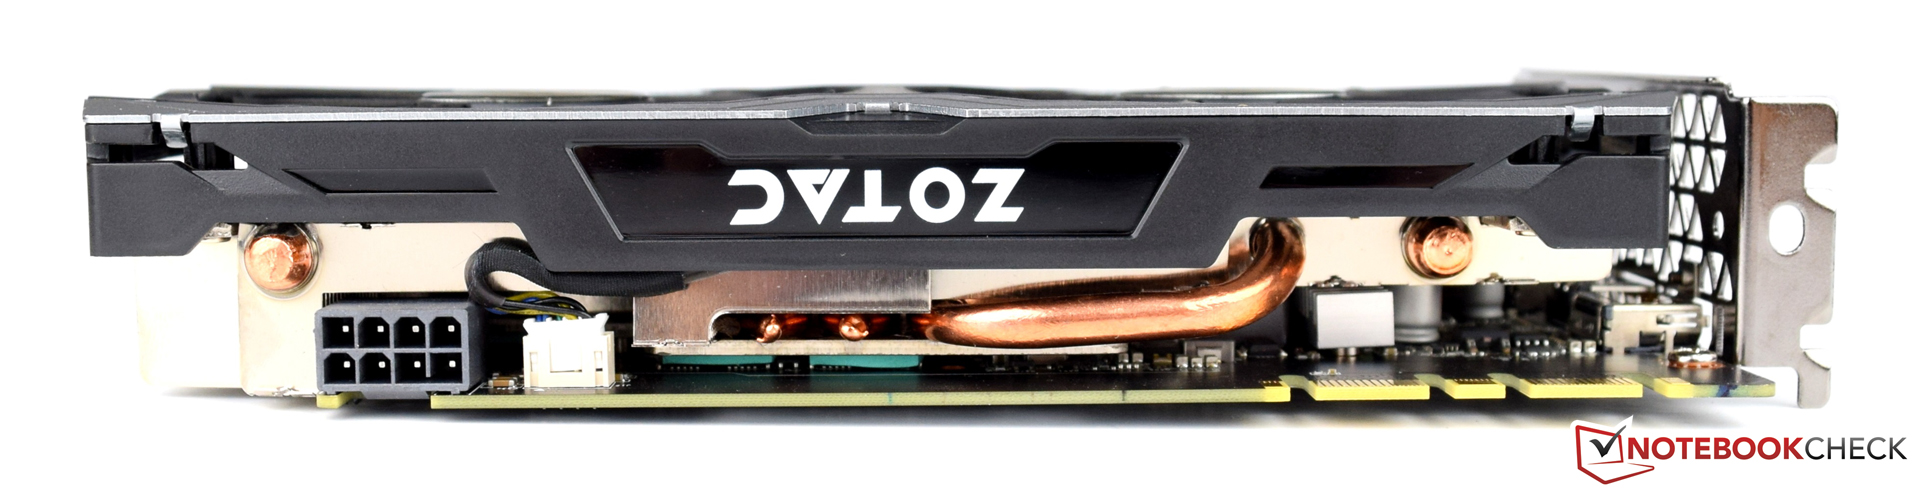
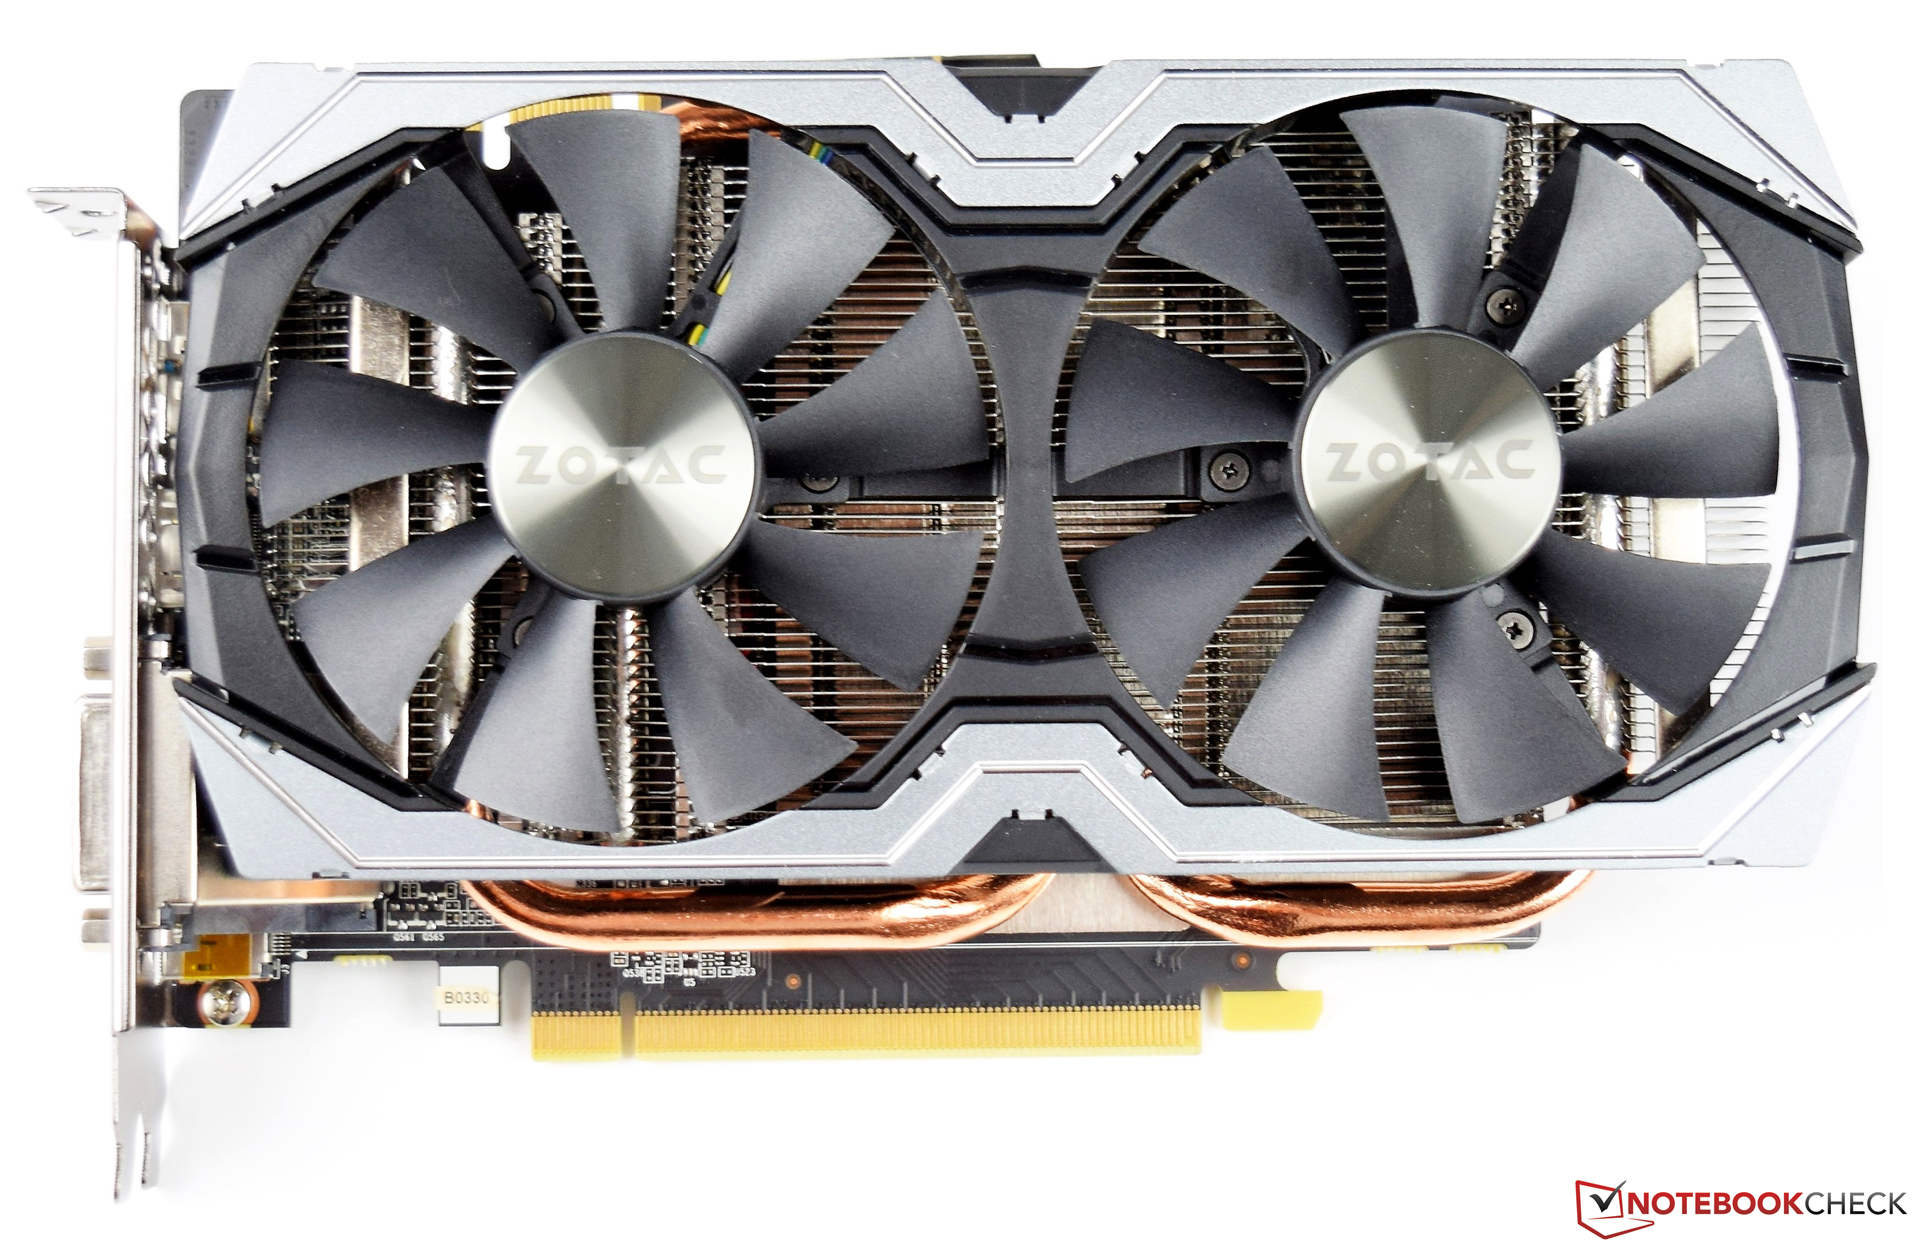
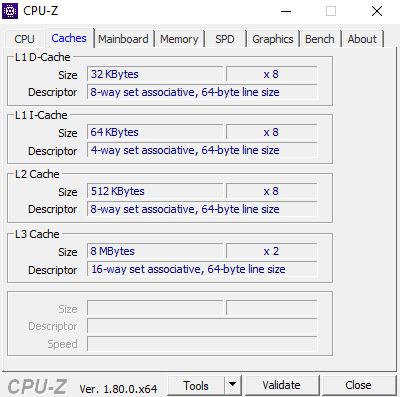
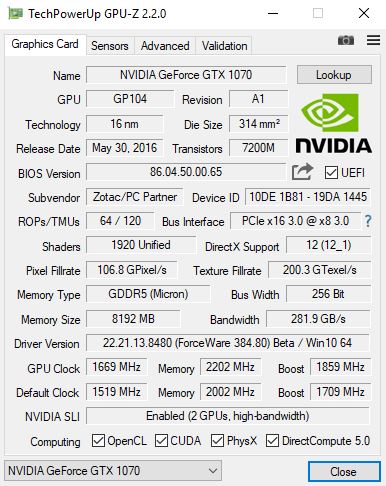
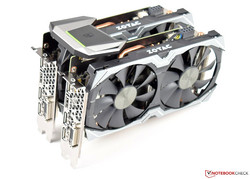
The Zotac GeForce GTX 1070 Mini Graphics Card has a specially-designed PCB which is very compact and should find room even in smaller cases. The fan system is different from Nvidia's reference design GeForce GTX 1070 Founders Edition, so the noise level is more pleasant as well. The GPU is based on the GP104 chip and produced using 16nm technology. The GDDR5 VRAM is connected using a 256-bit interface, which in turn allows a maximum bandwidth of 256 GB/s.
| Specifications | GTX 1050 Mini | GTX 1050 Ti | KFA2 GTX 1060 6 GB | GTX 1070 FE | Zotac GTX 1070 Mini | GTX 1080 FE |
| Chip | GP107 | GP107 | GP106 | GP104 | GP104 | GP104 |
| Manufactured | 14 nm | 14 nm | 16 nm | 16 nm | 16 nm | 16 nm |
| Shader | 640 | 768 | 1.280 | 1.920 | 1.920 | 2.560 |
| Texture Units | 40 | 48 | 80 | 120 | 120 | 160 |
| GPU Base Clock | 1354 MHz | 1290 MHz | 1518 MHz | 1506 MHz | 1518 MHz | 1607 MHz |
| GPU Boost Clock | 1455 MHz | 1392 MHz | 1733 MHz | 1683 MHz | 1708 MHz | 1733 MHz |
| Memory Bus | 128 Bit | 128 Bit | 192 Bit | 256 Bit | 256 Bit | 256 Bit |
| Memory Bandwidth | 112 GB/s | 112 GB/s | 192 GB/s | 256 GB/s | 256 GB/s | 320 GB/s |
| Memory Size | 2 GB | 4 GB | 6 GB | 8 GB | 8 GB | 8 GB |
| Power (Watt) | 75 W | 75 W | 120 W | 150 W | 150 W | 180 W |
The Test System
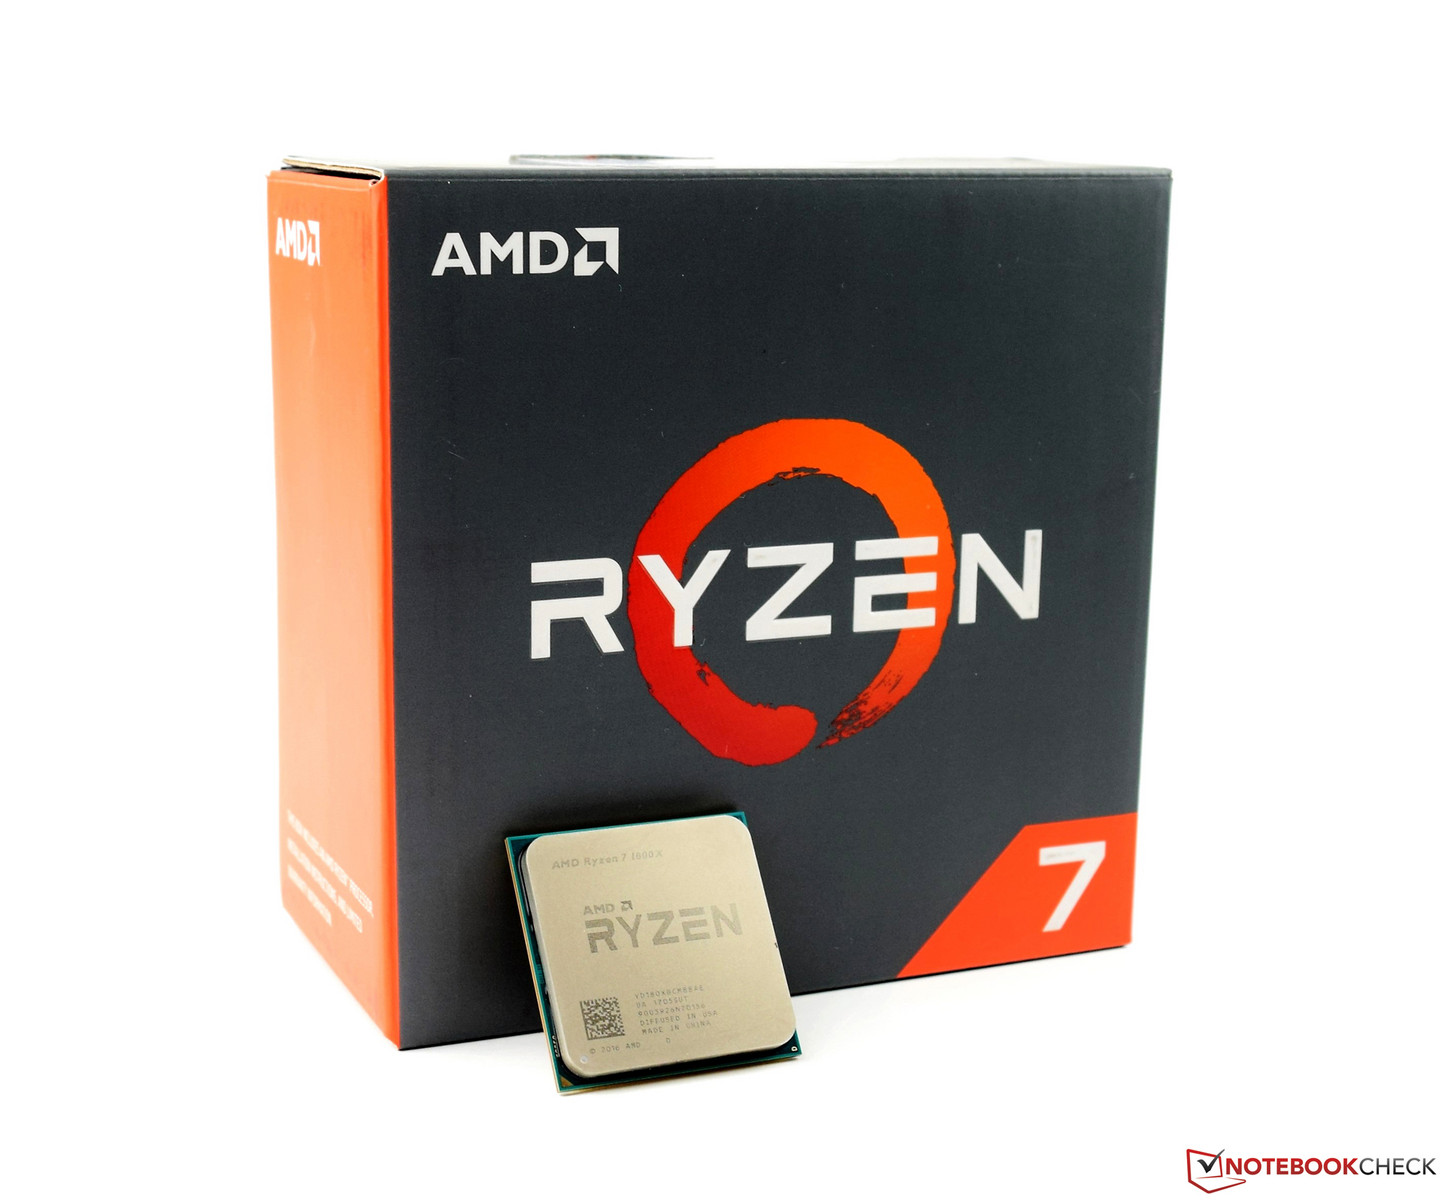
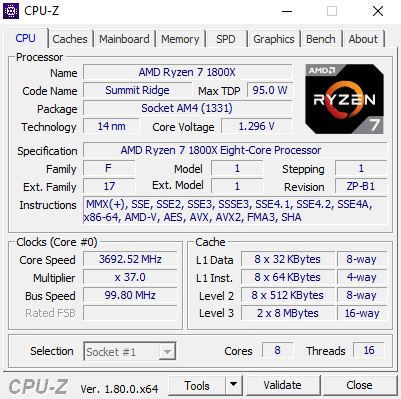
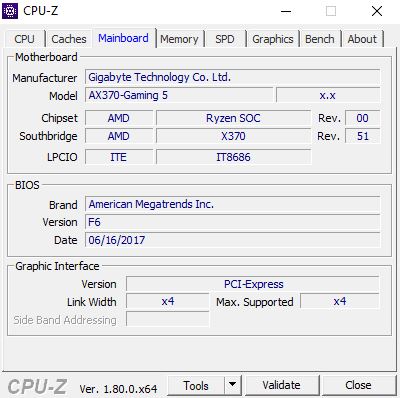
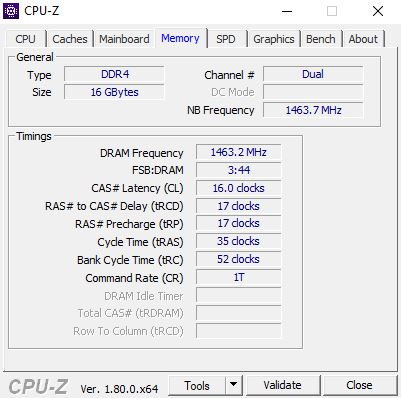
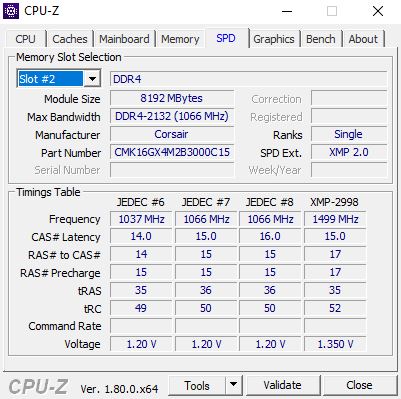
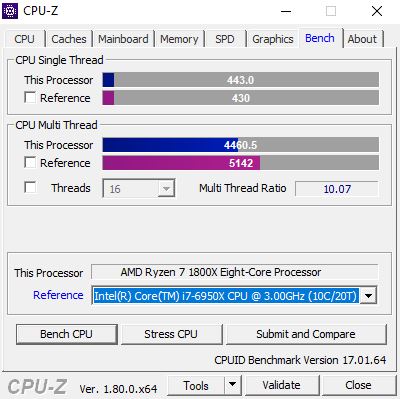
Our test unit is AMD based and consists of a Gigabyte Aorus GA-AX370 Gaming 5 with an AMD RYZEN 7 1800X CPU, which provides ample performance. The 16 GB of system RAM are from Corsair. The monitor Acer Predator XB321HK supports UHD and can handle all possible screen resolutions. Many thanks to AMD, who supplied the test system for our review.
| Case | Corsair Carbide Air 540 ATX Cube |
| Processor | AMD RYZEN 7 1800X |
| RAM | Corsair Vengeance 16 GB DDR4 3000 MHz |
| Mainboard | Gigabyte Aorus GA-AX370 Gaming 5 |
| Monitor | Acer Predator XB321HK 4K |
| SSD | ADATA SP900 M.2 SSD |
| HDD | 2 TB Western Digital |
| OS | Microsoft Windows 10 Professional 64-Bit |
| Driver | ForceWare 384.80 |
Clock Speeds
The clock speeds of the Zotac GeForce GTX 1070 Mini are marginally higher than what Nvidia specifies. The GPU runs at a base frequency of 1518 MHz and an average Boost speed of 1708 MHz. The VRAM speed of 8 GHz on the other hand is identical to that of the "Founders Edition".
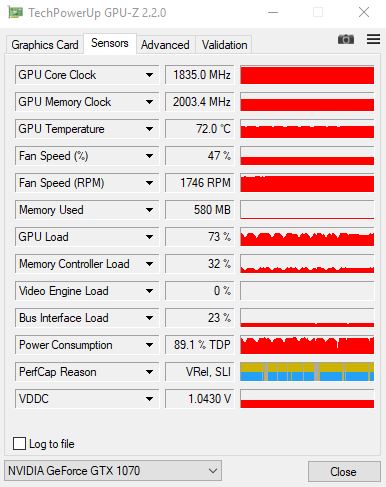
Our test shows that even at the default setting, the Boost speed actually reaches 1835 MHz. The GPU maintains this speed over longer periods at a temperature of 83 °C, which means that throttling isn't necessary even at higher load levels.
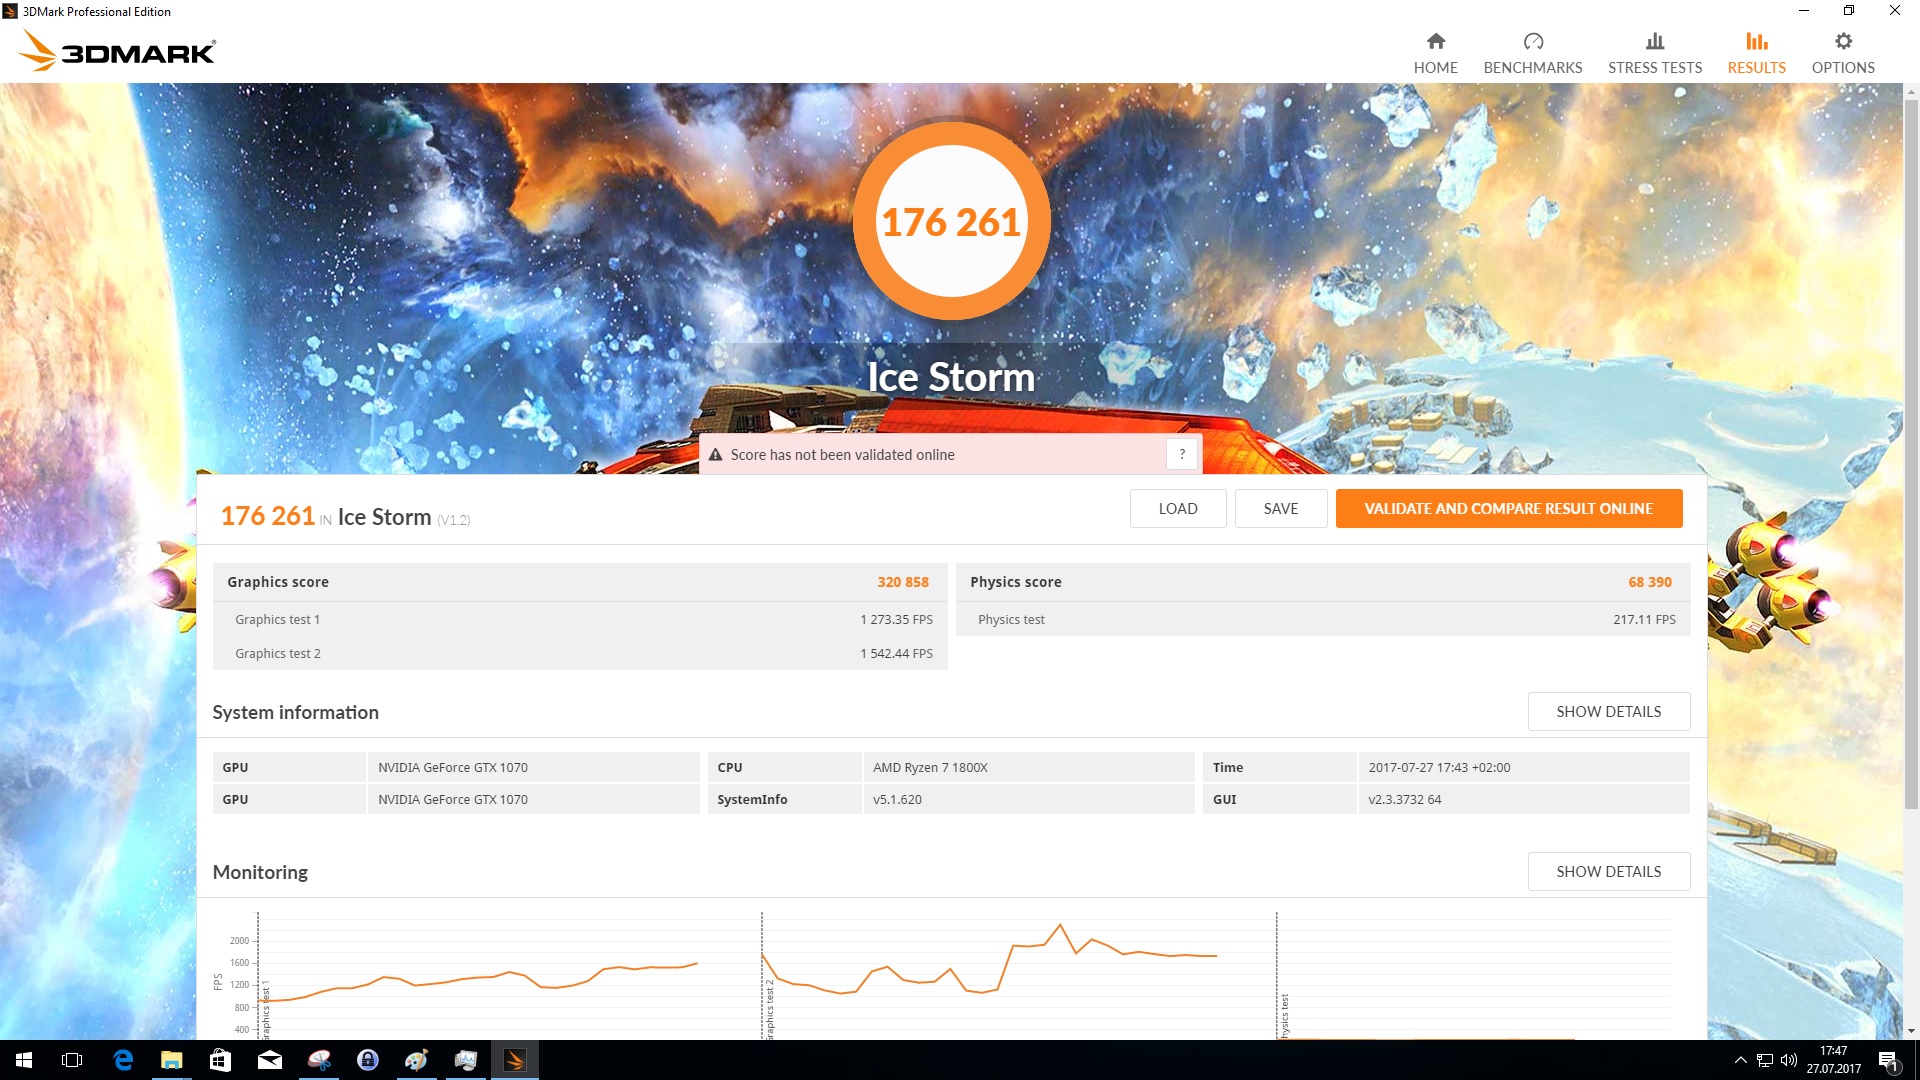
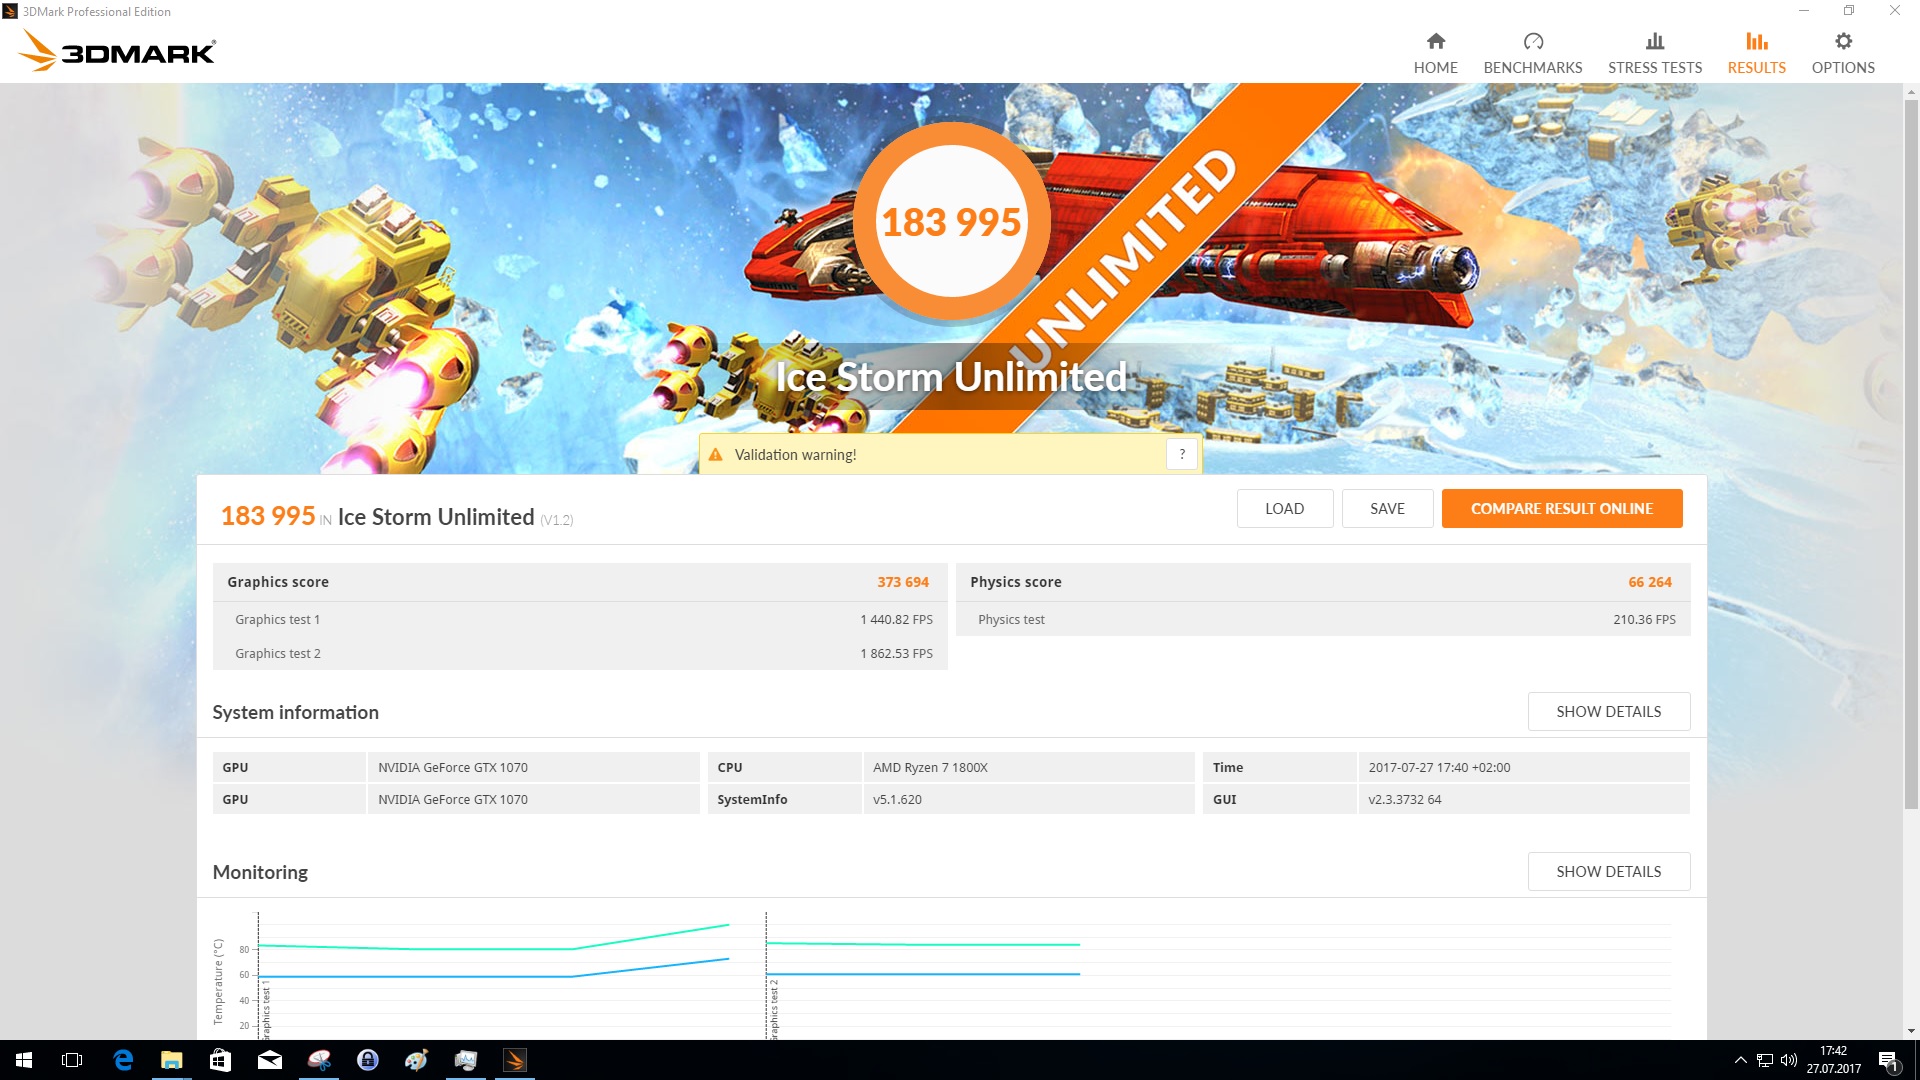
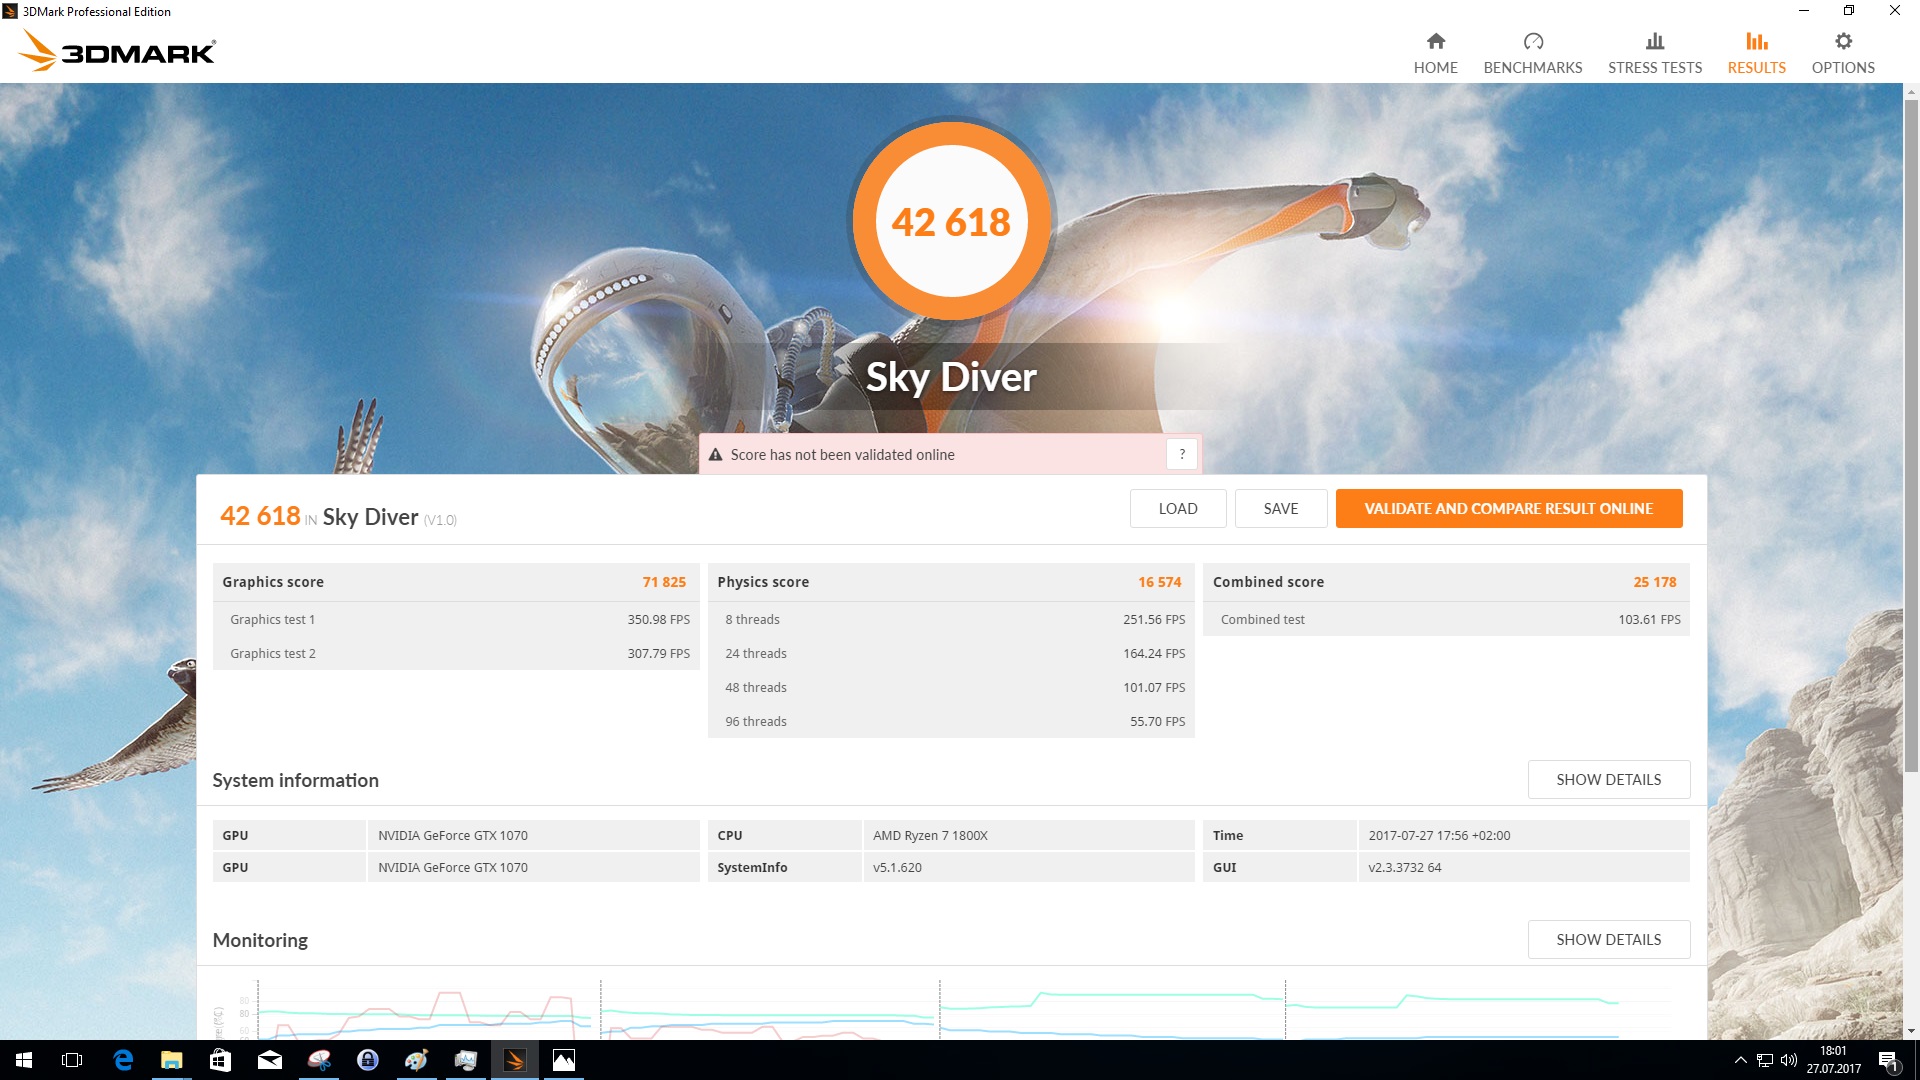
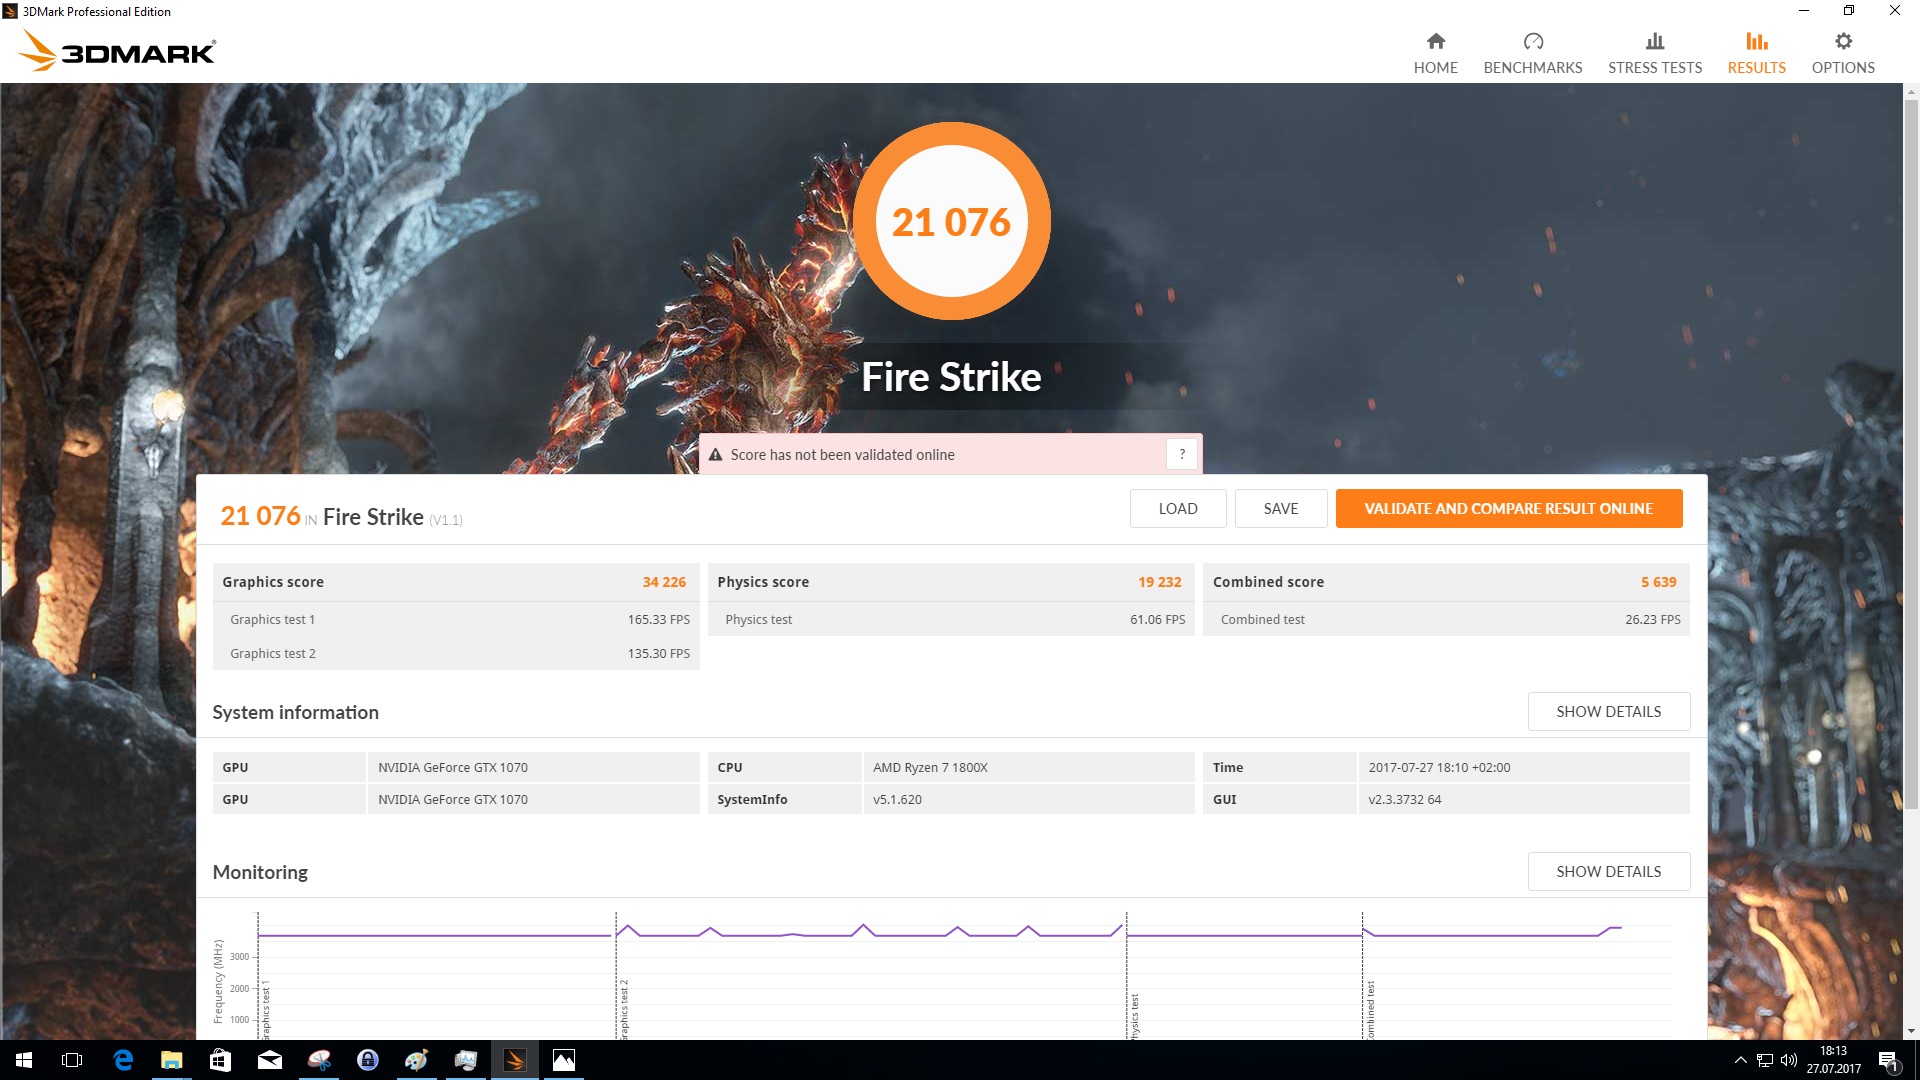
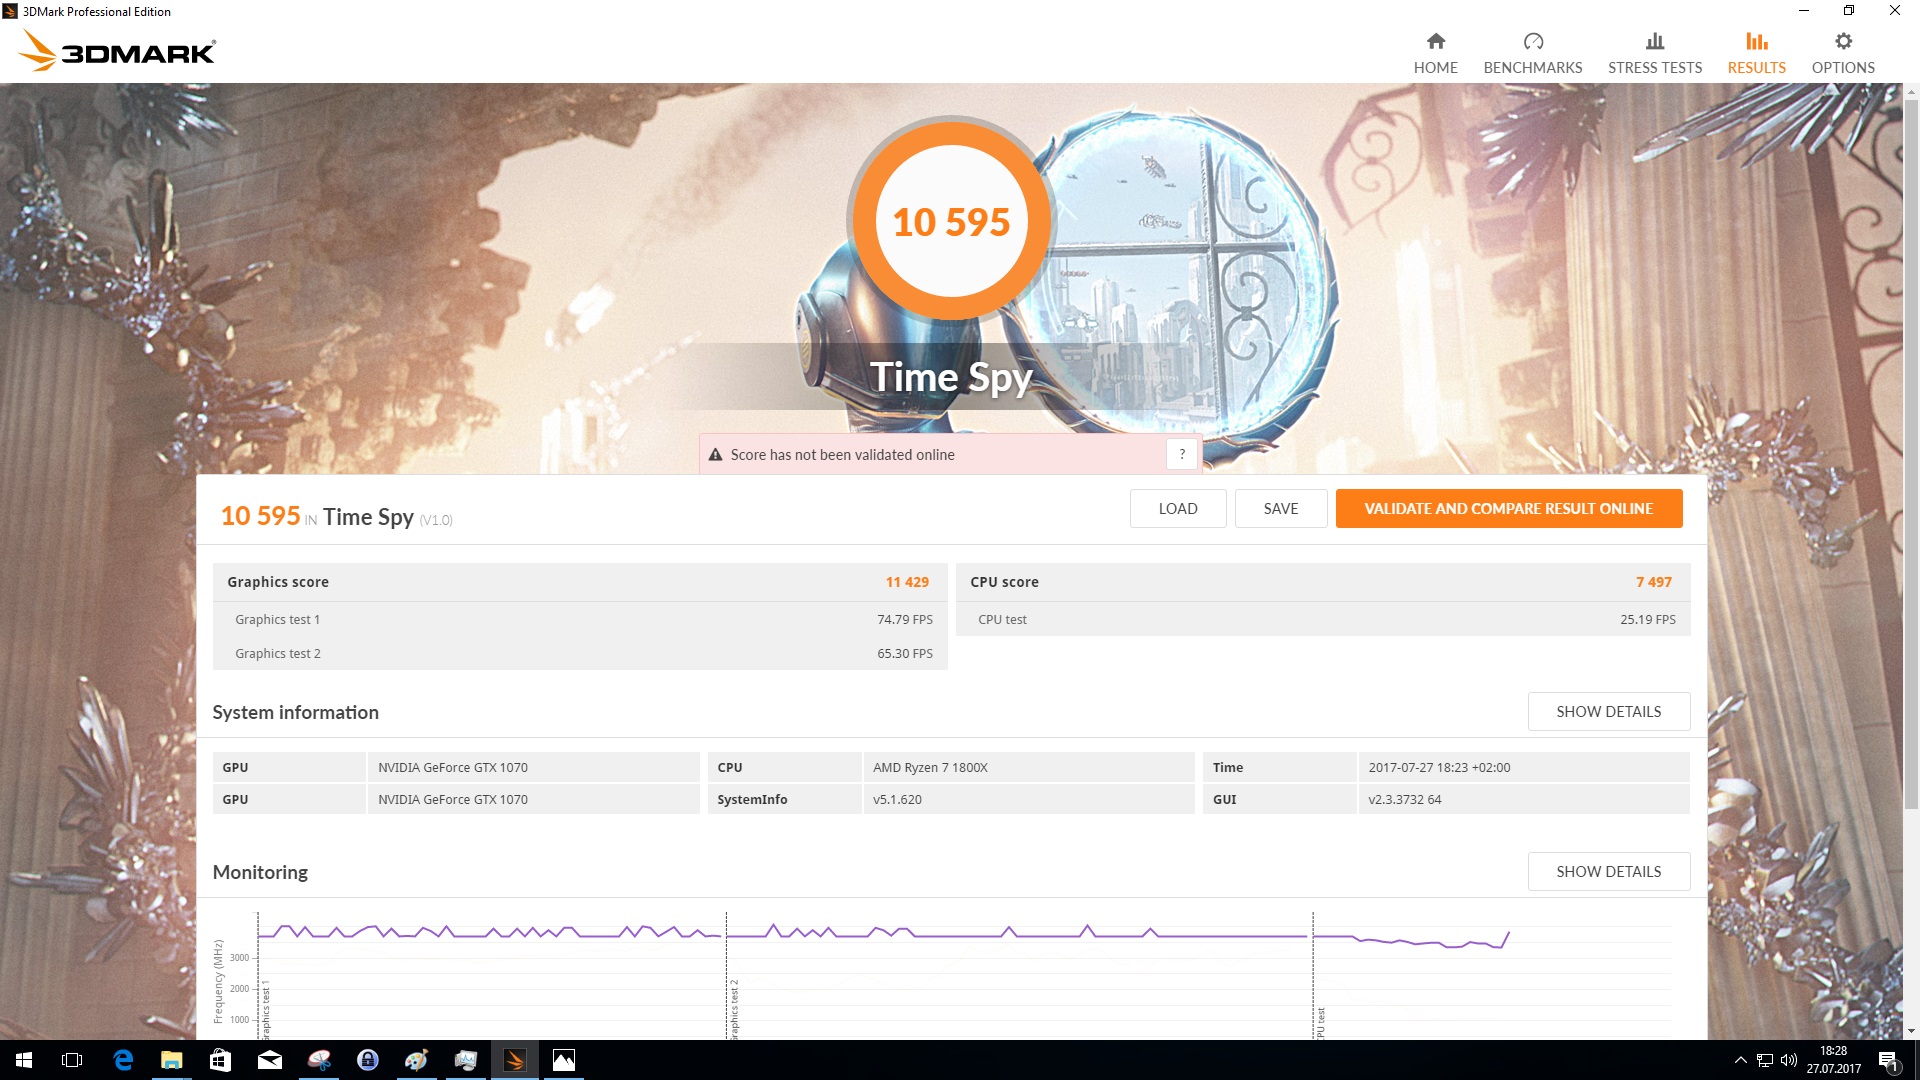
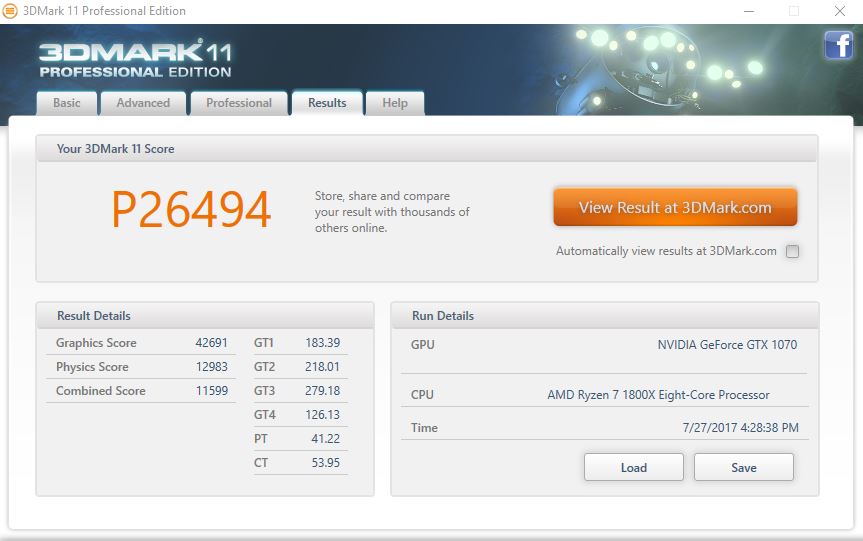
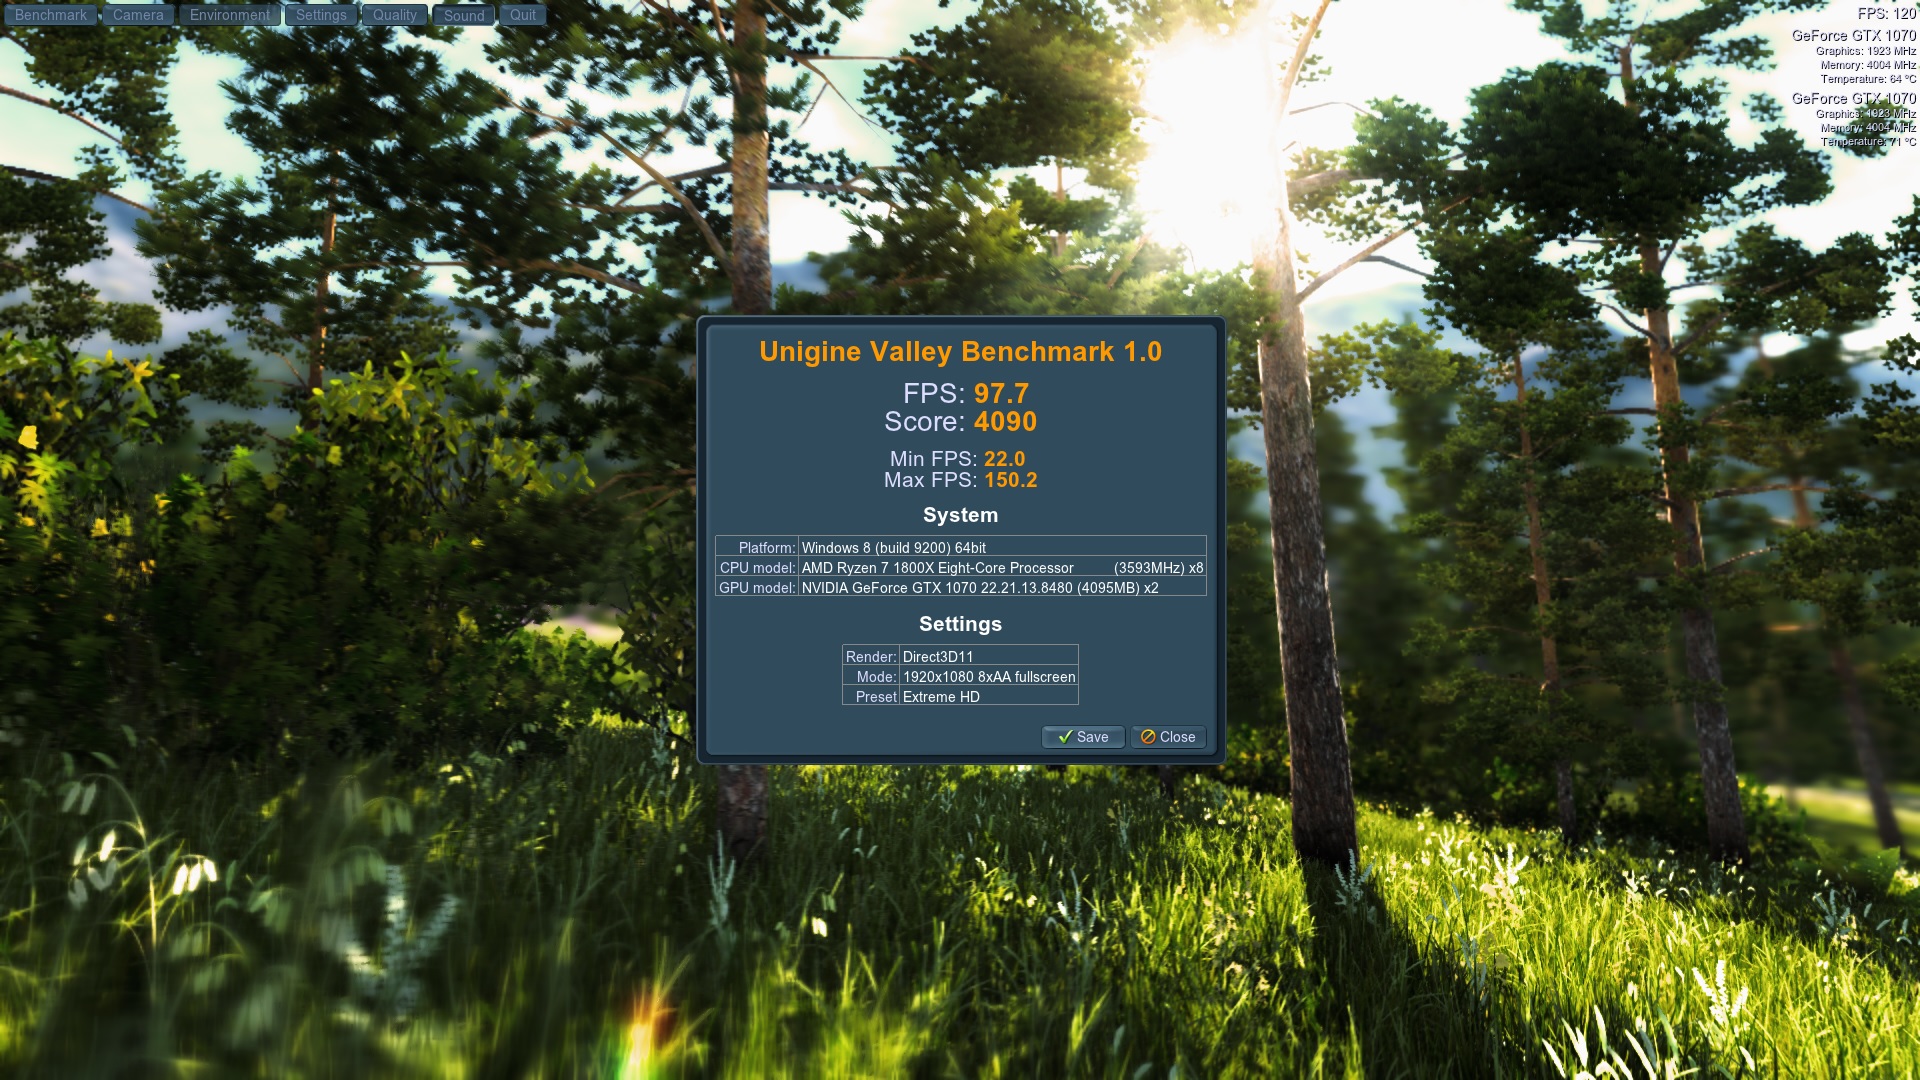
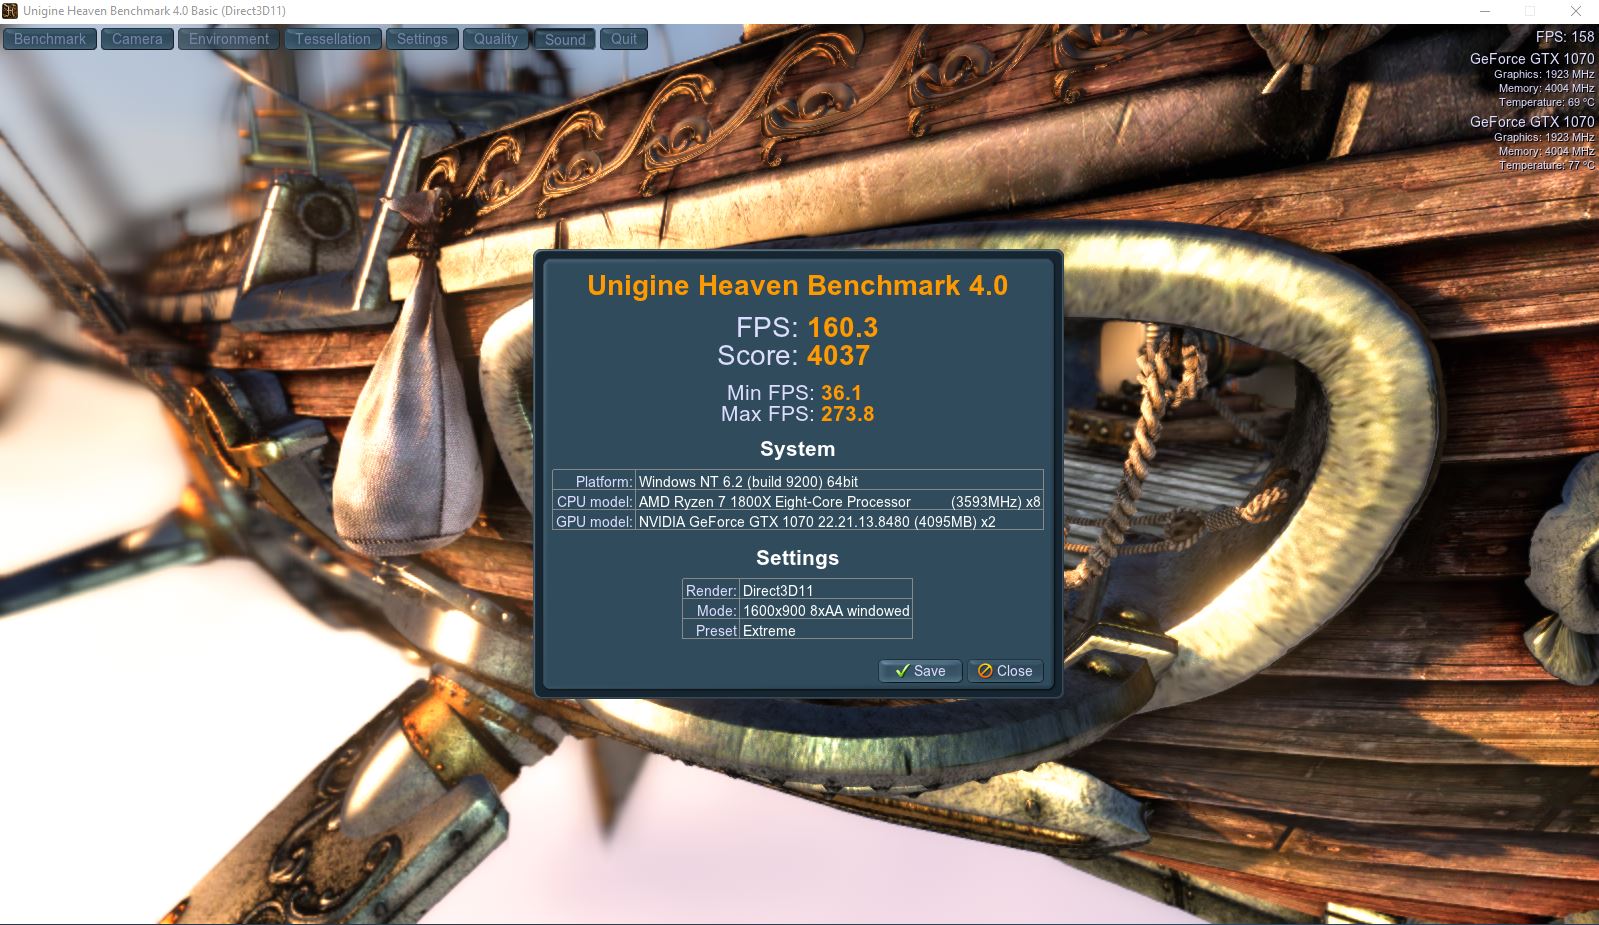
Synthetic Benchmarks
As far as the synthetic benchmarks are concerned, the SLI combo of two Zotac GeForce GTX 1070 Mini GPUs outperforms its competition. The Nvidia GeForce GTX 1080 Ti isn't too far behind, however. A comparison with the Nvidia GeForce GTX 1070 Founders Edition shows that our SLI test system is faster by somewhere between 30 and 90 %. The conclusion: multiple-GPU support depends heavily on the chosen application as well as the drivers.
| 3DMark | |
| 1920x1080 Fire Strike Graphics | |
| Desktop PC Ryzen 7 1800X + Zotac GeForce GTX 1070 SLI | |
| Nvidia GeForce GTX 1080 Ti Founders Edition | |
| Nvidia GeForce GTX 1070 Founders Edition | |
| Nvidia GeForce GTX 1060 Founders Edition 6 GB | |
| Desktop PC Intel Xeon E5 2680v4 KFA2 GTX 1060 6GB | |
| AMD Radeon RX 480 8 GB Reference | |
| MSI RX 470 Gaming X 4GB | |
| MSI GeForce GTX 1050 Ti | |
| Zotac GeForce GTX 1050 2GB | |
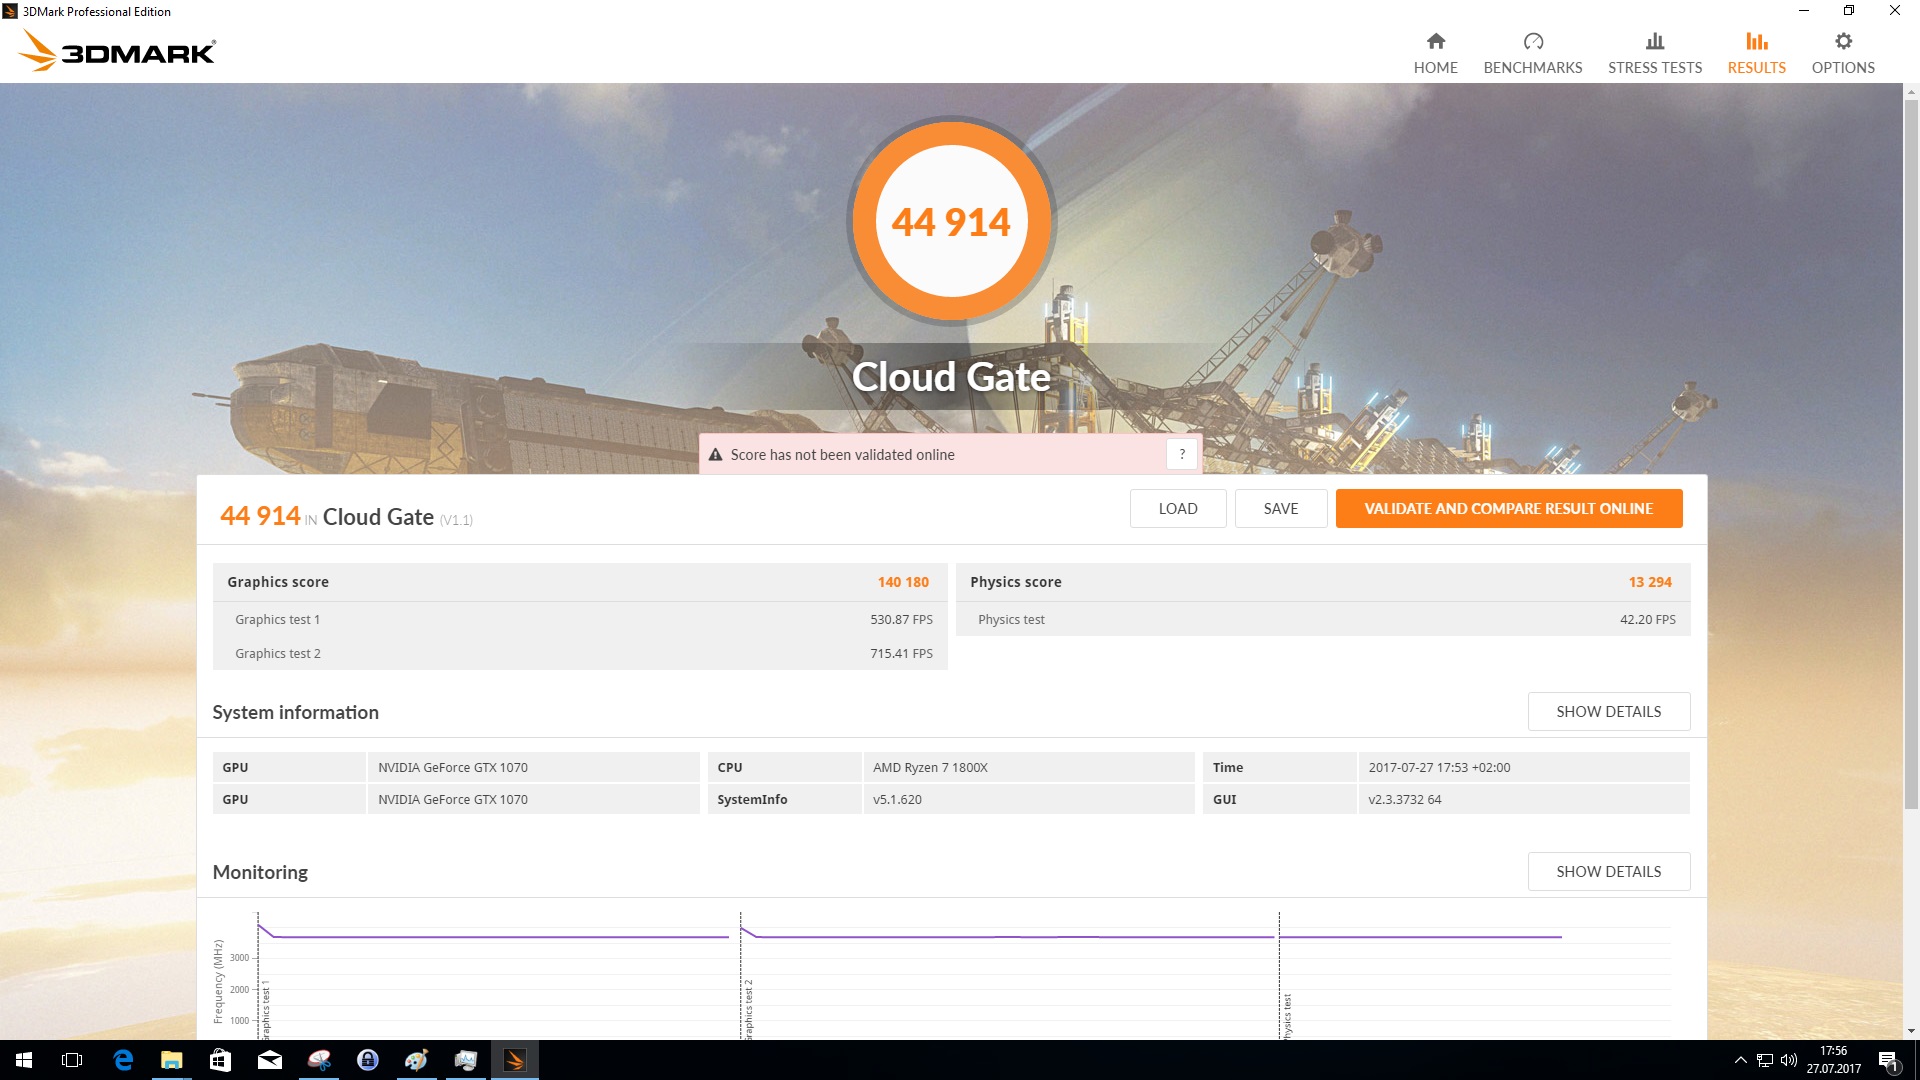
| 1280x720 Cloud Gate Standard Graphics | |
| Desktop PC Ryzen 7 1800X + Zotac GeForce GTX 1070 SLI | |
| Nvidia GeForce GTX 1070 Founders Edition | |
| Nvidia GeForce GTX 1060 Founders Edition 6 GB | |
| AMD Radeon RX 480 8 GB Reference | |
| Desktop PC Intel Xeon E5 2680v4 KFA2 GTX 1060 6GB | |
| MSI RX 470 Gaming X 4GB | |
| MSI GeForce GTX 1050 Ti | |
| Zotac GeForce GTX 1050 2GB | |
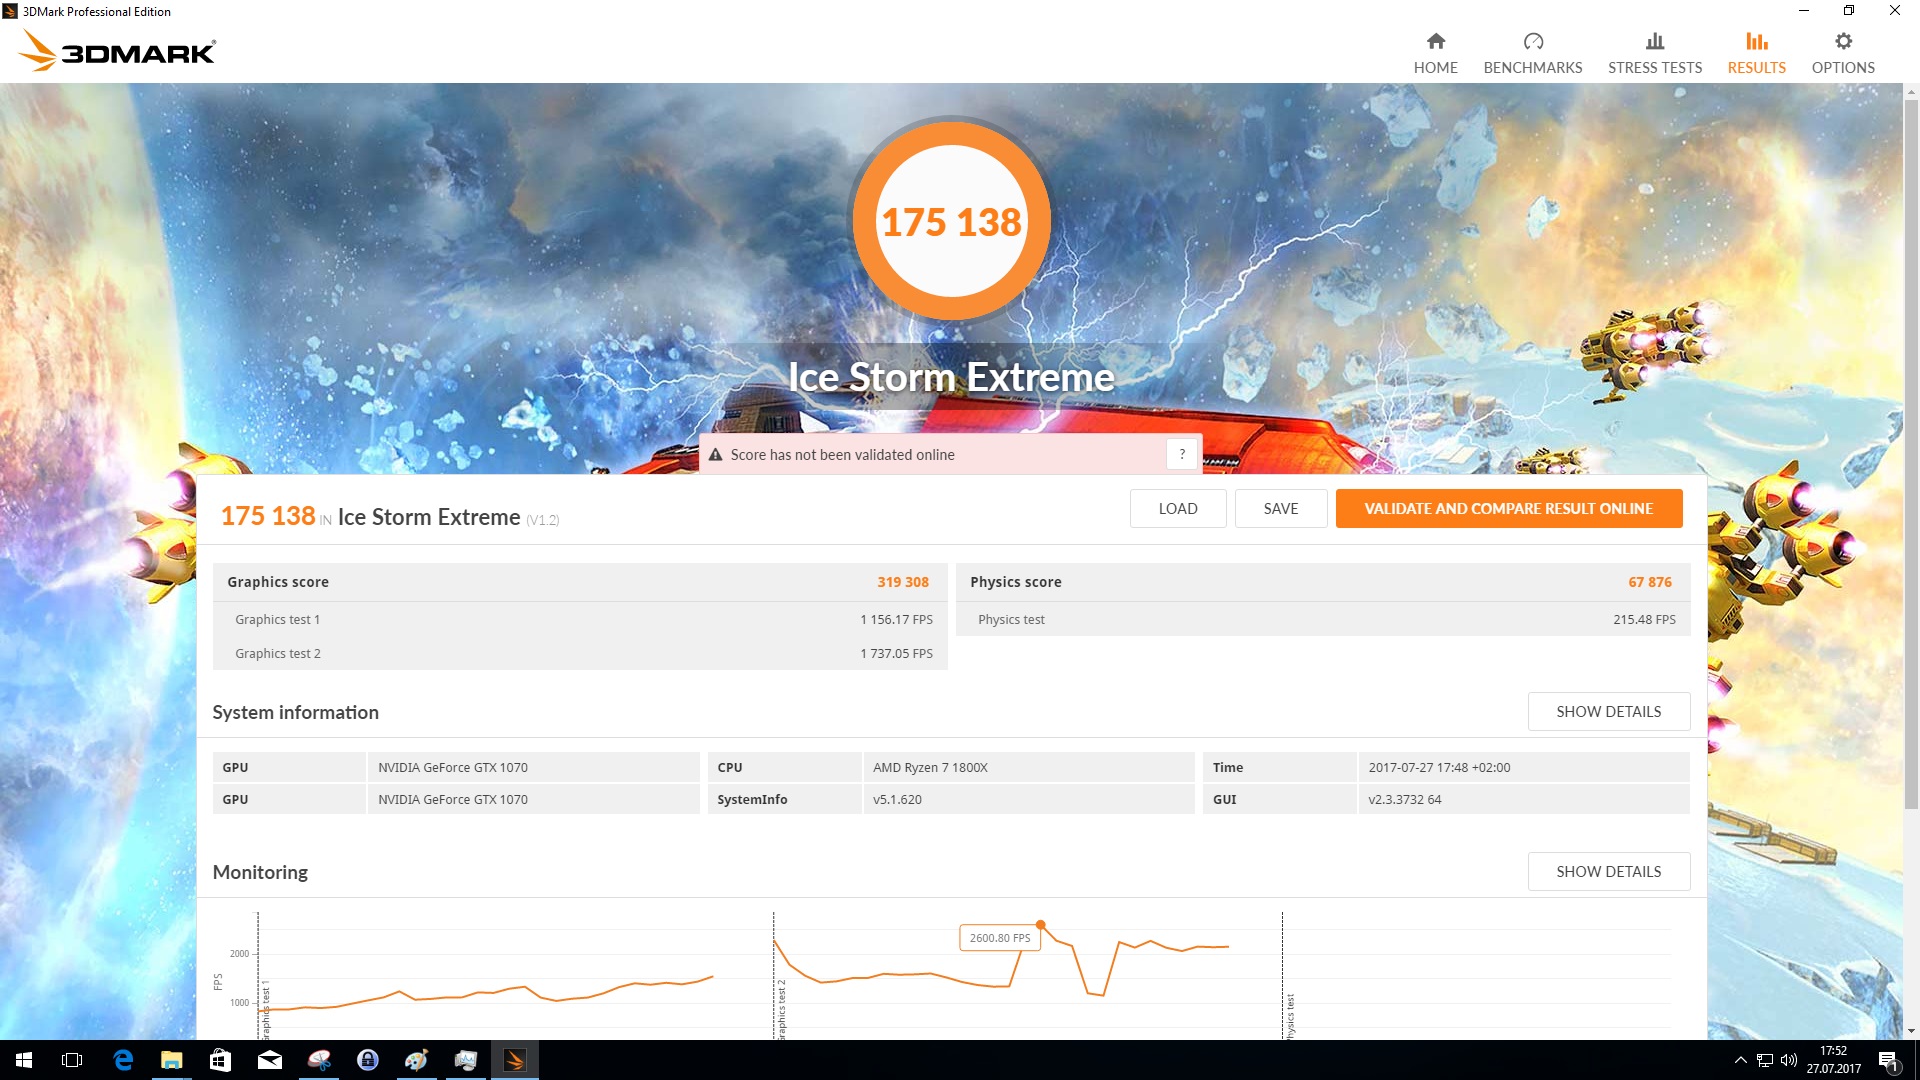
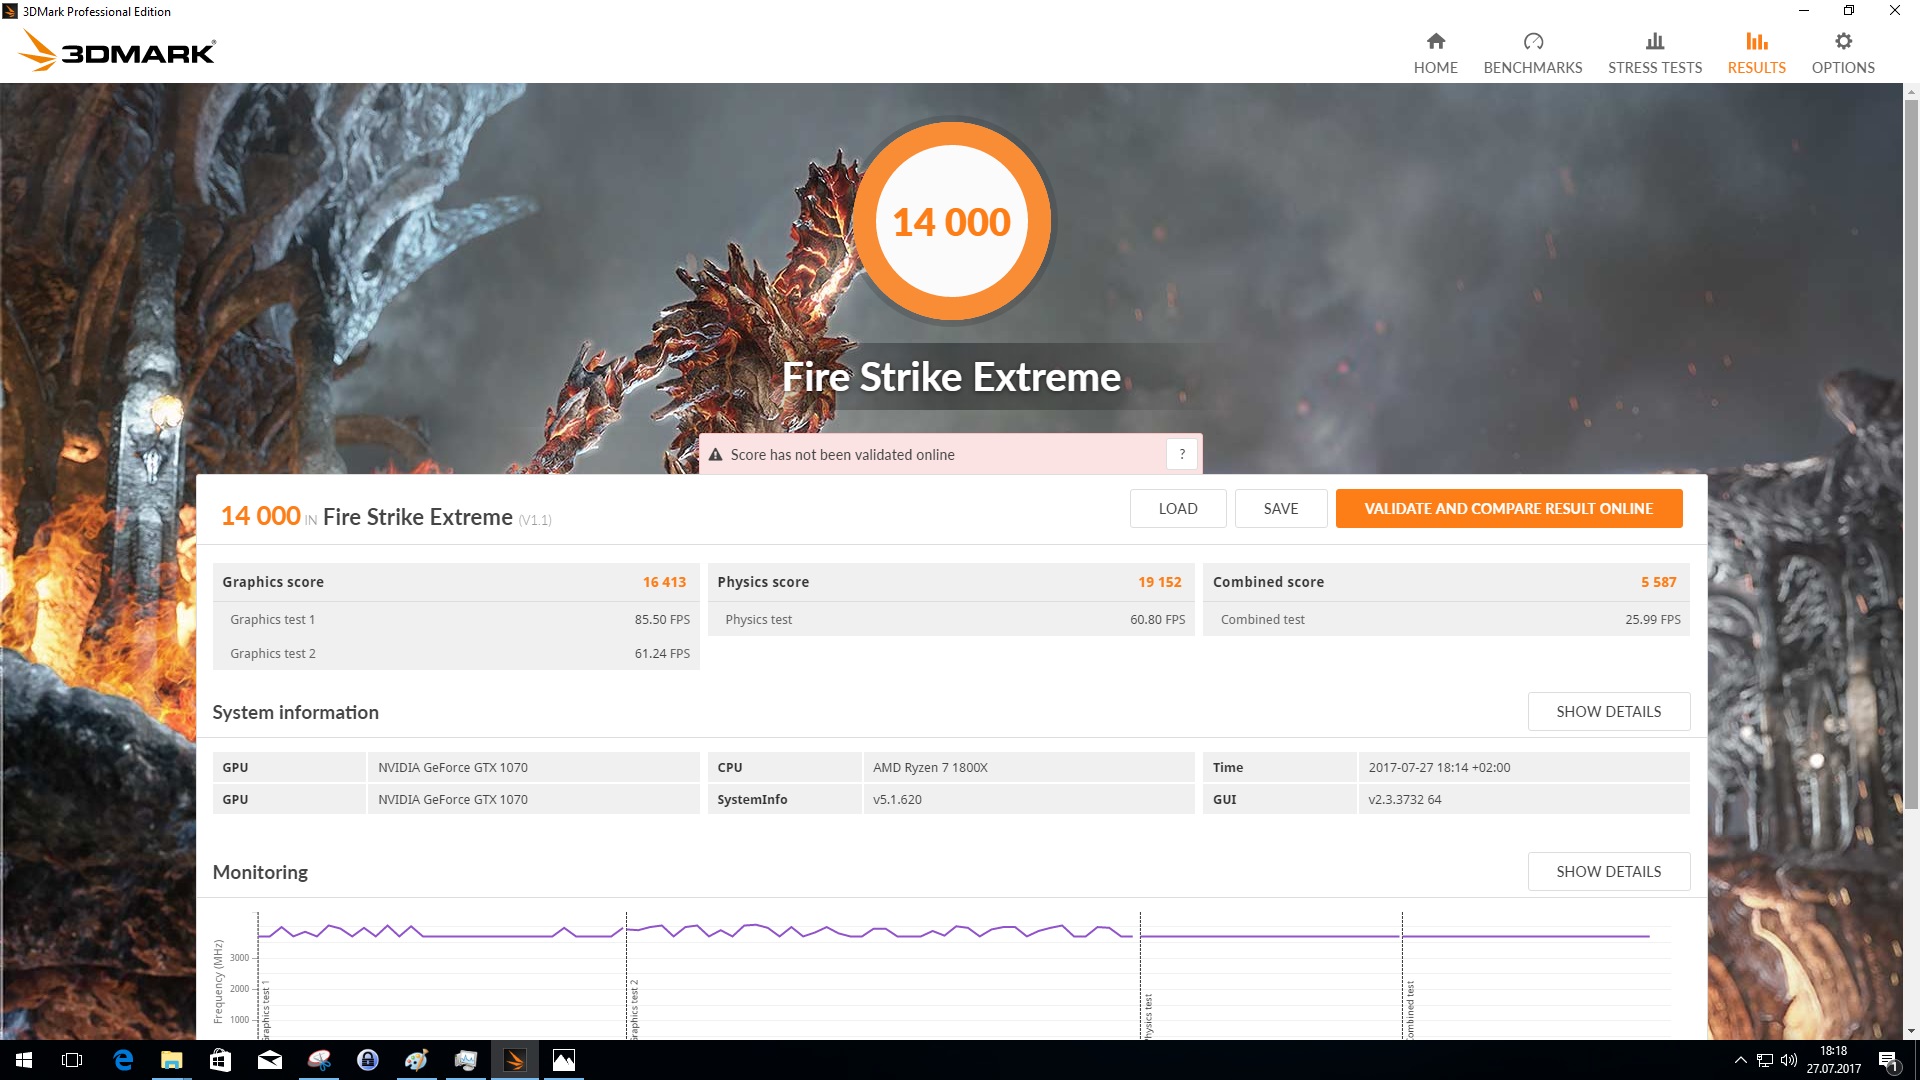
| Fire Strike Extreme Graphics | |
| Desktop PC Ryzen 7 1800X + Zotac GeForce GTX 1070 SLI | |
| Desktop PC Intel Xeon E5 2680v4 KFA2 GTX 1060 6GB | |
| AMD Radeon RX 480 8 GB Reference | |
| Zotac GeForce GTX 1050 2GB | |
Gaming Benchmarks
When it comes to actual gaming, the picture changes markedly with the SLI system trailing the single GPU by at times significant margins. A good example here is "Far Cry Primal". On the other hand, SLI works very well for some games and the performance difference is substantial. Case in point: when running "Rise oft the Tomb Raider" and "The Division", frame rates increase by about 50 %. The Nvidia GeForce GTX 1080 Ti is still the measure of all things and outperforms our SLI combo except when playing "GTA V". Here, the high-performance single GPU is marginally slower.
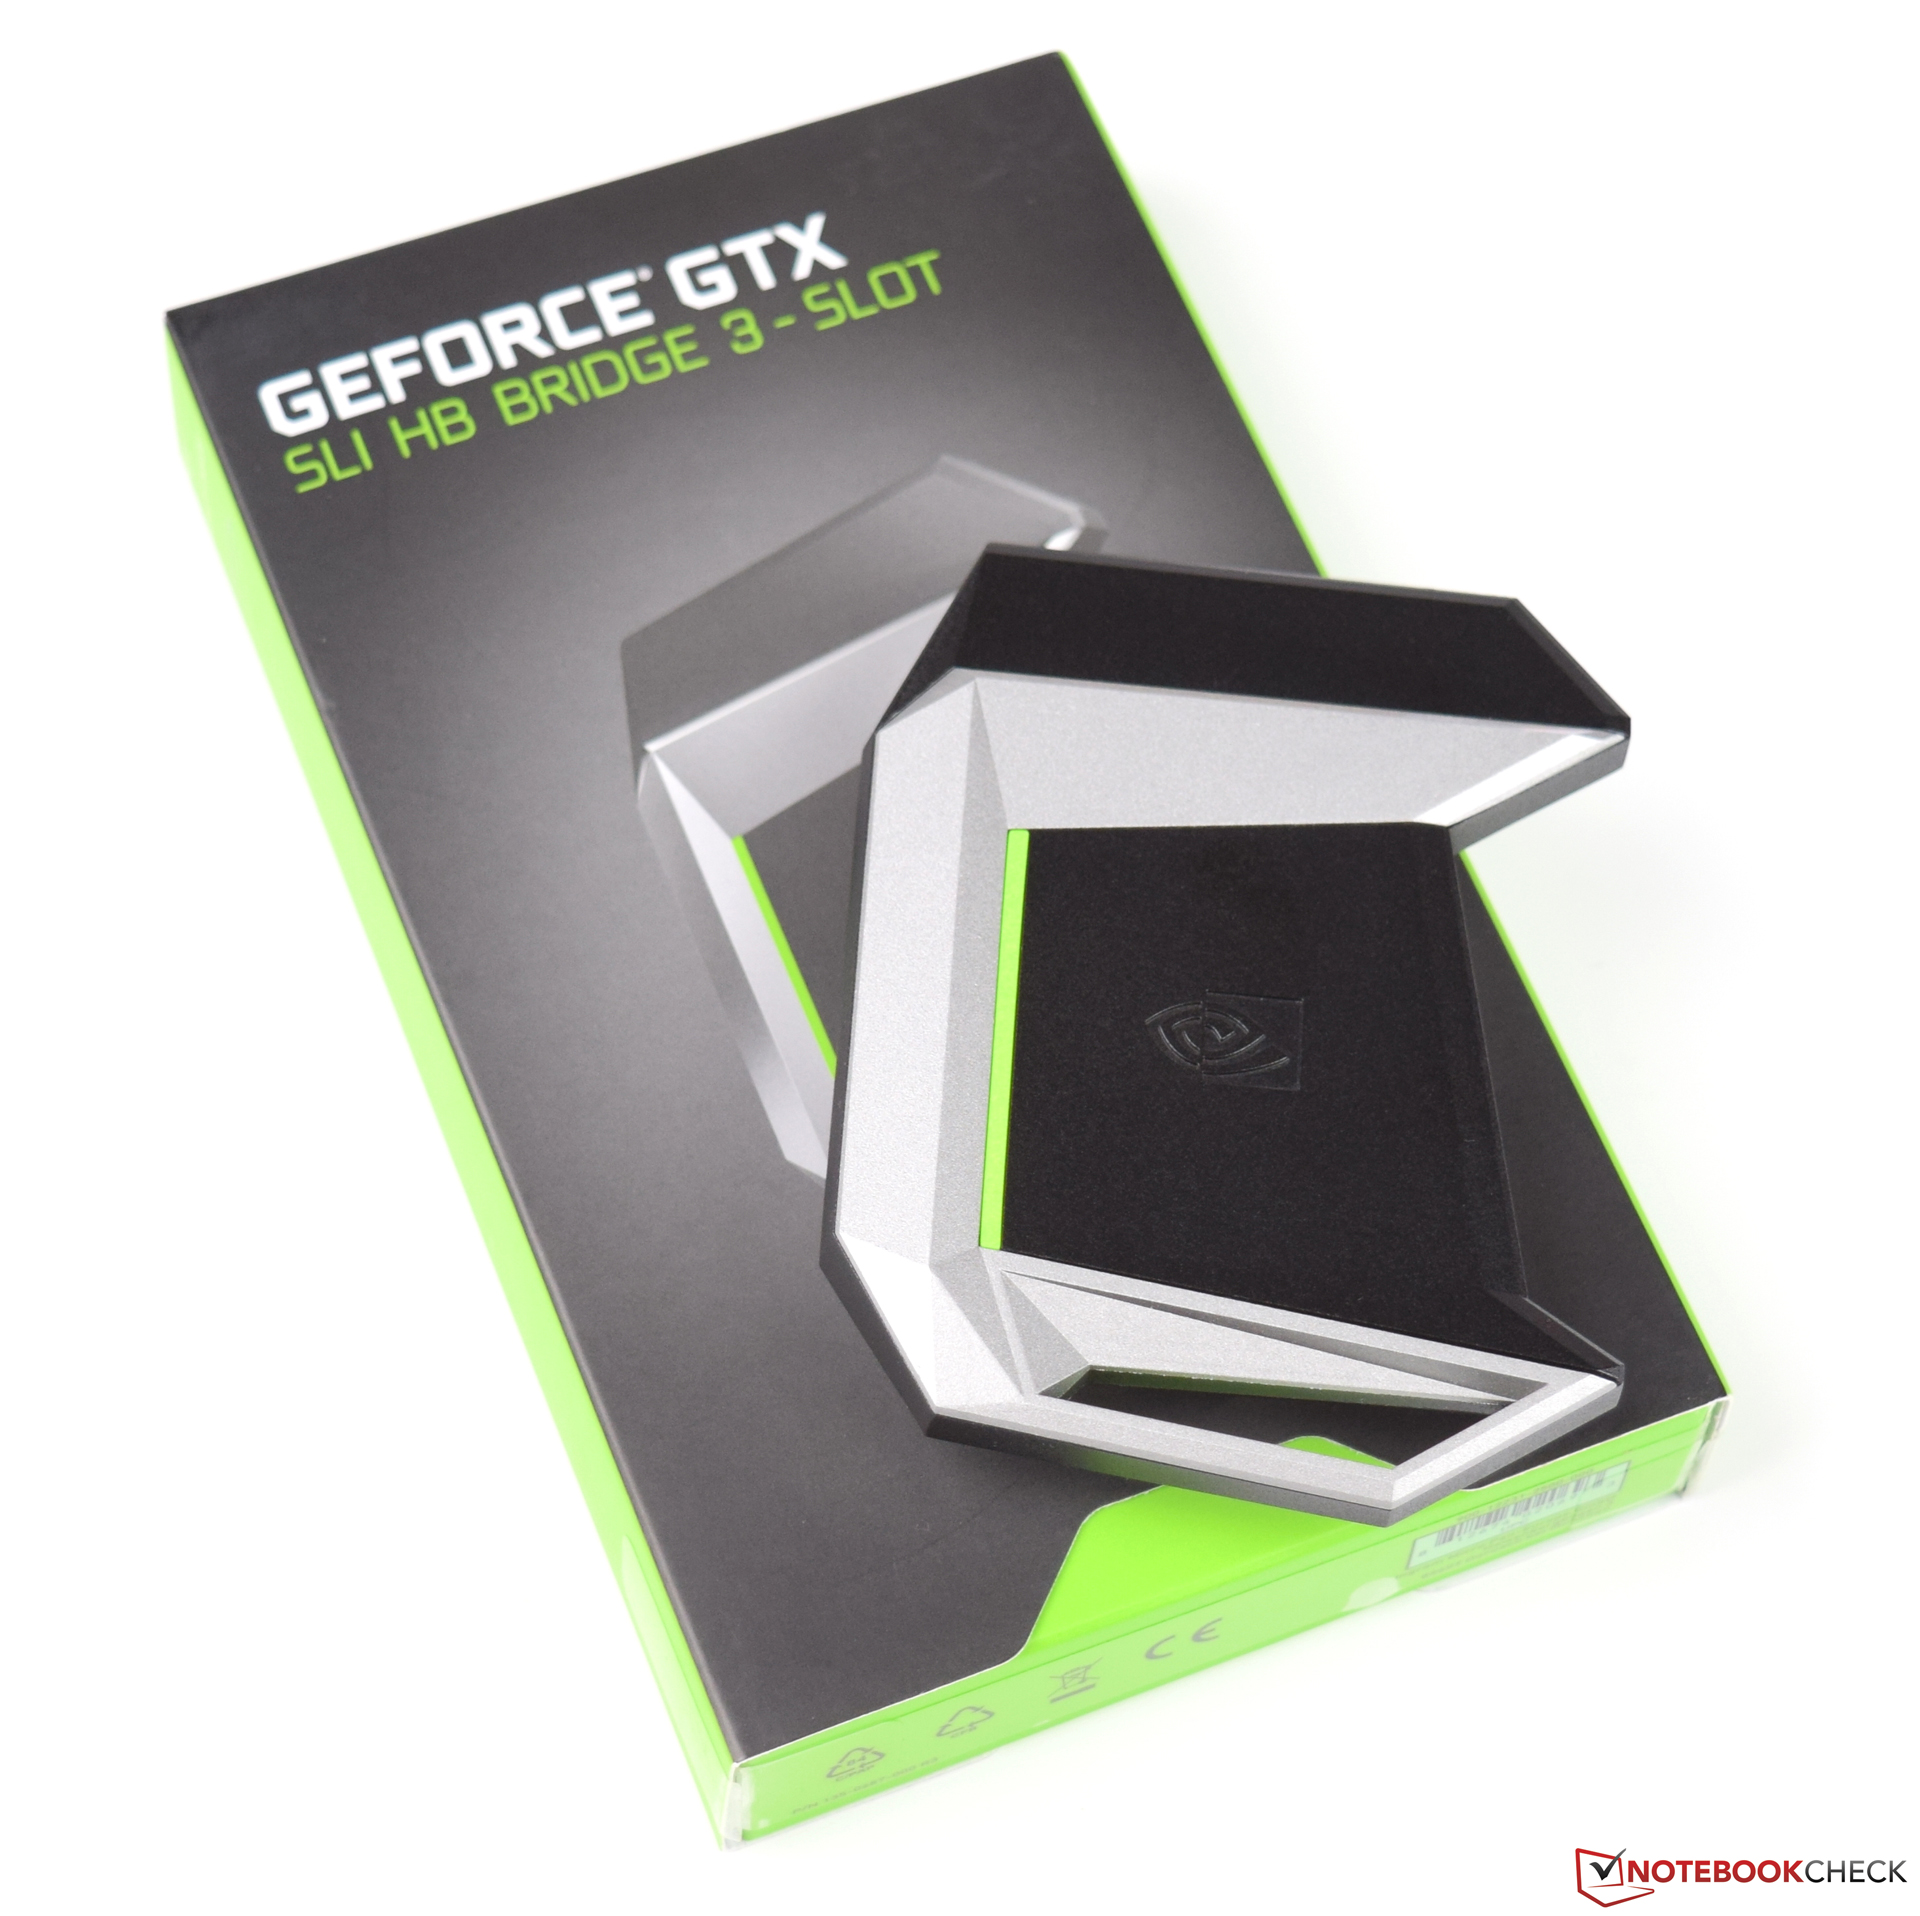
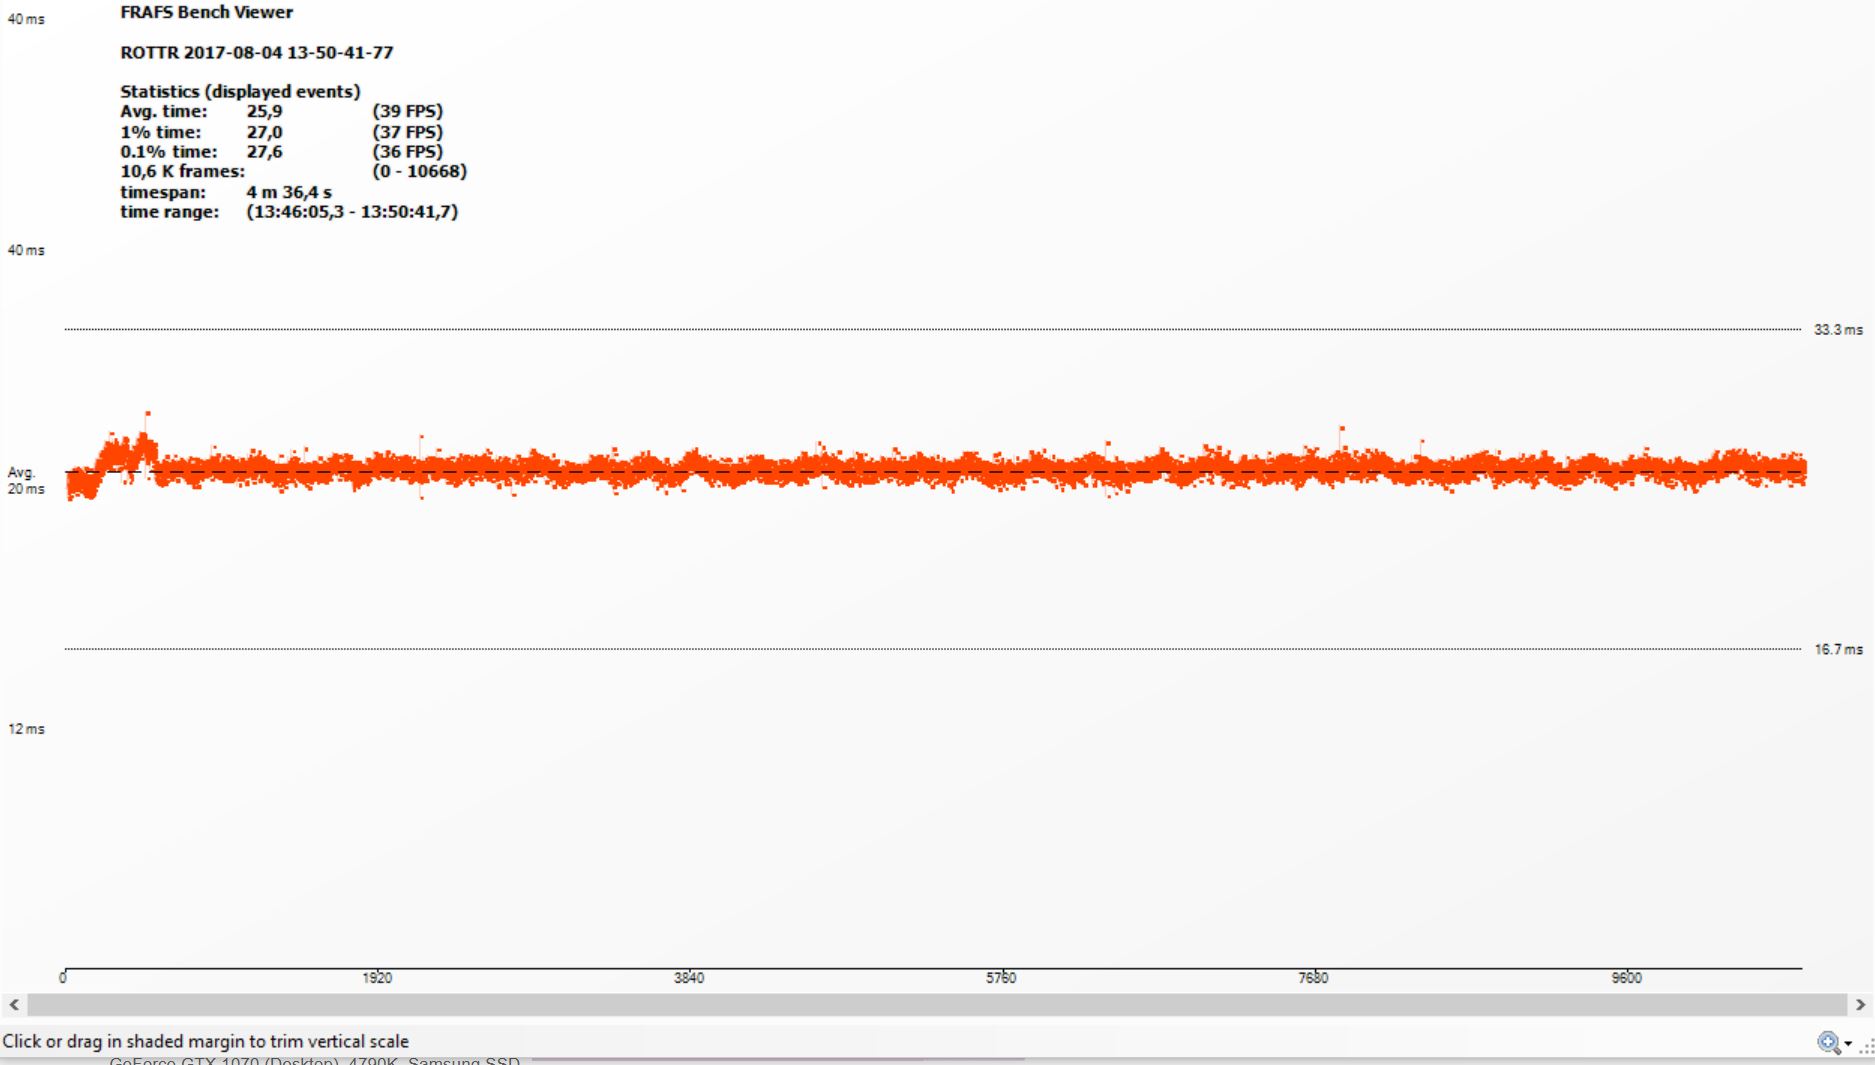
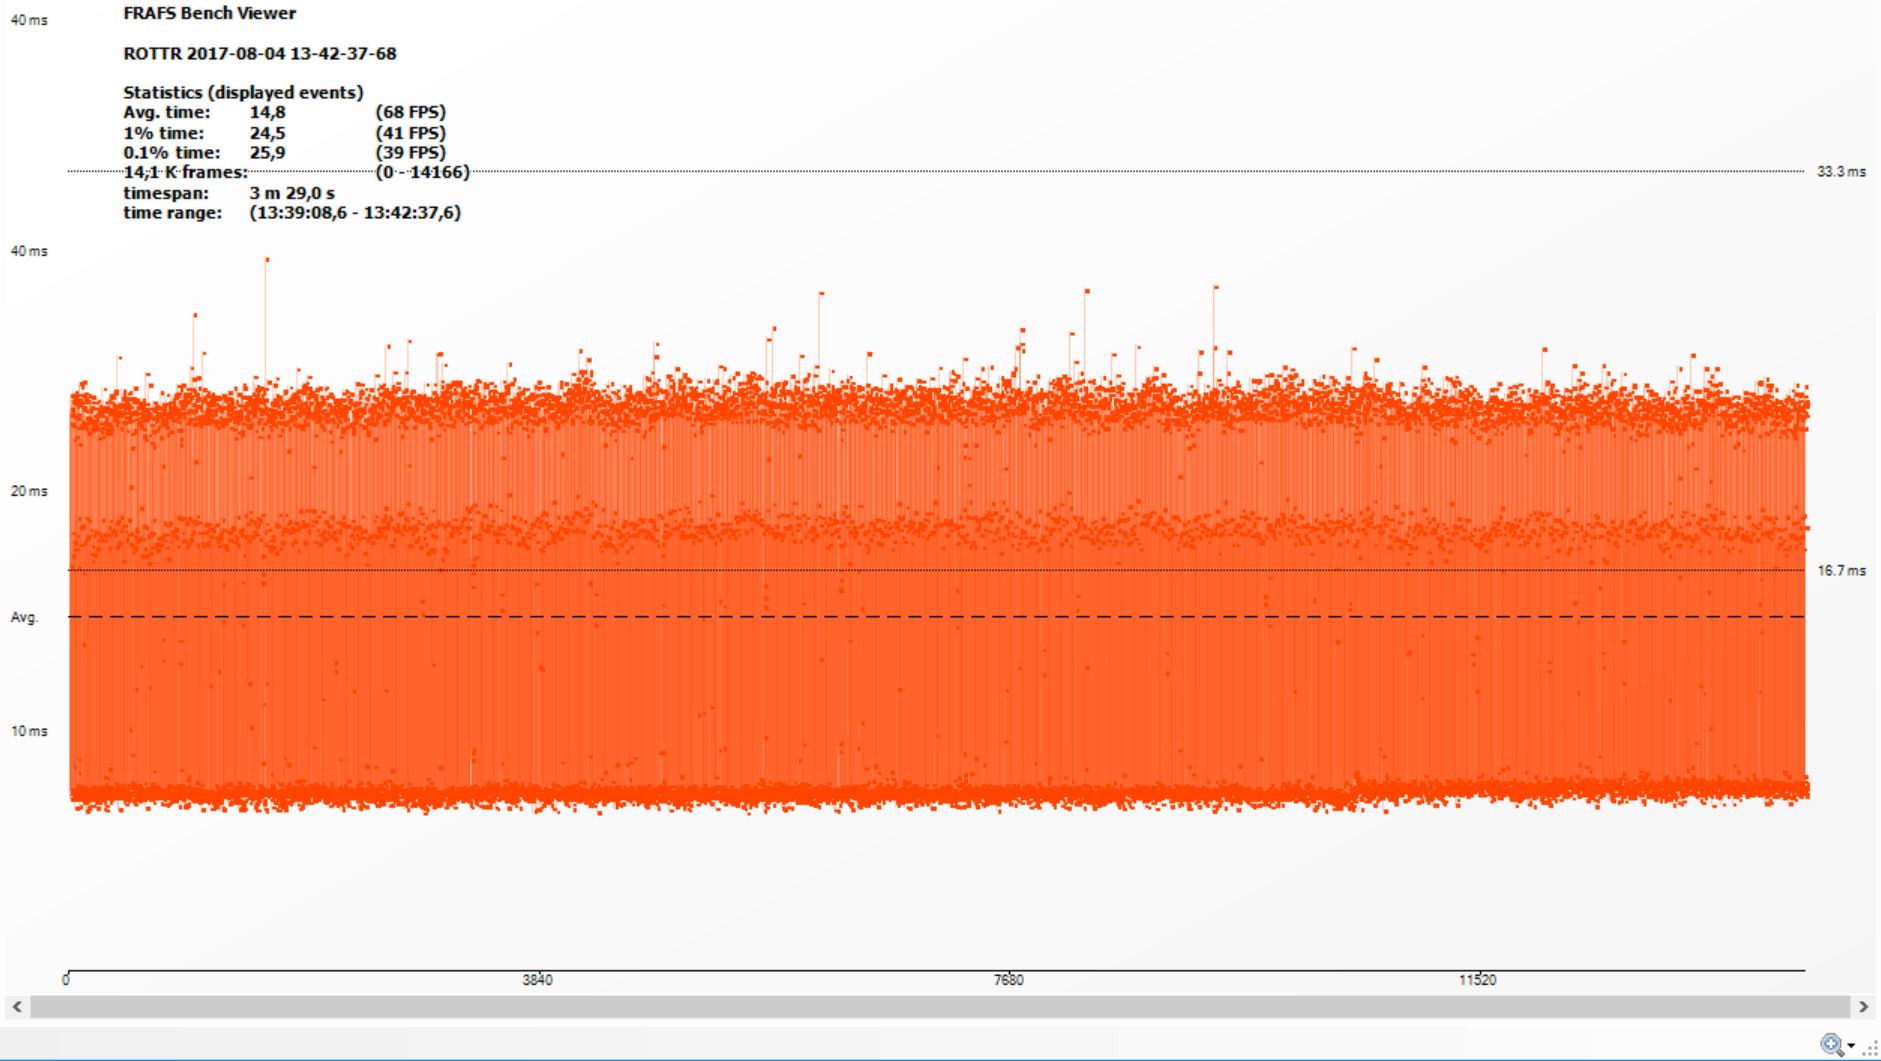
A check of the recorded frames per second - see the table below - reveals a sea of green. Even at 4K resolutions, games remain perfectly playable even with the preset "high" selected. The one caveat: under 60 FPS, playback can stutter slightly, although the perceived severity is highly individual and varies from person to person. Thanks to the HB Bridge, micro stuttering should technically have been all but eliminated, but subjectively, it still occurs. The two diagrams below clearly show that the SLI system suffers from much higher frame times than the single GPU solution, which in turn leads to a "choppy" gameplay even when the FPS rate seems to be sufficiently high.
| Far Cry Primal - 1920x1080 Ultra Preset AA:SM | |
| NVIDIA GeForce GTX 1080 Ti (Desktop) | |
| NVIDIA GeForce GTX 1070 (Desktop) | |
| NVIDIA GeForce GTX 1060 (Desktop) | |
| AMD Radeon RX 480 (Desktop) | |
| NVIDIA GeForce GTX 1070 SLI (Desktop) | |
| AMD Radeon RX 470 (Desktop) | |
| NVIDIA GeForce GTX 1050 Ti (Desktop) | |
| NVIDIA GeForce GTX 1050 (Desktop) | |
| BioShock Infinite - 1920x1080 Ultra Preset, DX11 (DDOF) | |
| NVIDIA GeForce GTX 1080 Ti (Desktop) | |
| NVIDIA GeForce GTX 1070 SLI (Desktop) | |
| NVIDIA GeForce GTX 1070 (Desktop) | |
| AMD Radeon RX 480 (Desktop) | |
| NVIDIA GeForce GTX 1050 Ti (Desktop) | |
| NVIDIA GeForce GTX 1050 (Desktop) | |
| Rise of the Tomb Raider - 1920x1080 Very High Preset AA:FX AF:16x | |
| NVIDIA GeForce GTX 1080 Ti (Desktop) | |
| NVIDIA GeForce GTX 1070 SLI (Desktop) | |
| NVIDIA GeForce GTX 1070 (Desktop) | |
| NVIDIA GeForce GTX 1060 (Desktop) | |
| NVIDIA GeForce GTX 1060 (Desktop) | |
| AMD Radeon RX 480 (Desktop) | |
| AMD Radeon RX 470 (Desktop) | |
| NVIDIA GeForce GTX 1050 Ti (Desktop) | |
| NVIDIA GeForce GTX 1050 (Desktop) | |
| The Witcher 3 - 1920x1080 Ultra Graphics & Postprocessing (HBAO+) | |
| NVIDIA GeForce GTX 1080 Ti (Desktop) | |
| NVIDIA GeForce GTX 1070 SLI (Desktop) | |
| NVIDIA GeForce GTX 1070 (Desktop) | |
| NVIDIA GeForce GTX 1060 (Desktop) | |
| AMD Radeon RX 480 (Desktop) | |
| AMD Radeon RX 470 (Desktop) | |
| NVIDIA GeForce GTX 1050 Ti (Desktop) | |
| NVIDIA GeForce GTX 1050 (Desktop) | |
| Deus Ex Mankind Divided - 1920x1080 Ultra Preset AA:2xMS AF:8x | |
| NVIDIA GeForce GTX 1080 Ti (Desktop) | |
| NVIDIA GeForce GTX 1070 SLI (Desktop) | |
| AMD Radeon RX 480 (Desktop) | |
| AMD Radeon RX 470 (Desktop) | |
| NVIDIA GeForce GTX 1050 Ti (Desktop) | |
| NVIDIA GeForce GTX 1050 (Desktop) | |
| NVIDIA GeForce GTX 1050 (Desktop) | |
| Watch Dogs 2 - 1920x1080 Ultra Preset | |
| NVIDIA GeForce GTX 1080 Ti (Desktop) | |
| NVIDIA GeForce GTX 1070 SLI (Desktop) | |
| AMD Radeon RX 480 (Desktop) | |
| AMD Radeon RX 470 (Desktop) | |
| NVIDIA GeForce GTX 1050 Ti (Desktop) | |
| NVIDIA GeForce GTX 1050 (Desktop) | |
| Battlefield 1 - 1920x1080 Ultra Preset AA:T | |
| NVIDIA GeForce GTX 1080 Ti (Desktop) | |
| NVIDIA GeForce GTX 1070 SLI (Desktop) | |
| AMD Radeon RX 480 (Desktop) | |
| AMD Radeon RX 480 (Desktop) | |
| AMD Radeon RX 470 (Desktop) | |
| NVIDIA GeForce GTX 1050 Ti (Desktop) | |
| NVIDIA GeForce GTX 1050 (Desktop) | |
| Resident Evil 7 - 1920x1080 Very High / On AA:FXAA+T | |
| NVIDIA GeForce GTX 1080 Ti (Desktop) | |
| NVIDIA GeForce GTX 1070 SLI (Desktop) | |
| AMD Radeon RX 480 (Desktop) | |
| NVIDIA GeForce GTX 1050 Ti (Desktop) | |
| NVIDIA GeForce GTX 1050 (Desktop) | |
| AMD Radeon RX 470 (Desktop) | |
| GTA V - 1920x1080 Highest AA:4xMSAA + FX AF:16x | |
| NVIDIA GeForce GTX 1070 SLI (Desktop) | |
| NVIDIA GeForce GTX 1080 Ti (Desktop) | |
| NVIDIA GeForce GTX 1070 (Desktop) | |
| AMD Radeon RX 480 (Desktop) | |
| NVIDIA GeForce GTX 1050 Ti (Desktop) | |
| NVIDIA GeForce GTX 1050 (Desktop) | |
| Rainbow Six Siege - 1920x1080 Ultra Preset AA:T AF:16x | |
| NVIDIA GeForce GTX 1080 Ti (Desktop) | |
| NVIDIA GeForce GTX 1070 (Desktop) | |
| NVIDIA GeForce GTX 1070 SLI (Desktop) | |
| NVIDIA GeForce GTX 1060 (Desktop) | |
| AMD Radeon RX 480 (Desktop) | |
| AMD Radeon RX 470 (Desktop) | |
| NVIDIA GeForce GTX 1050 Ti (Desktop) | |
| NVIDIA GeForce GTX 1050 (Desktop) | |
| The Division - 1920x1080 Ultra Preset AF:16x | |
| NVIDIA GeForce GTX 1080 Ti (Desktop) | |
| NVIDIA GeForce GTX 1070 SLI (Desktop) | |
| NVIDIA GeForce GTX 1070 (Desktop) | |
| NVIDIA GeForce GTX 1060 (Desktop) | |
| AMD Radeon RX 480 (Desktop) | |
| AMD Radeon RX 470 (Desktop) | |
| NVIDIA GeForce GTX 1050 (Desktop) | |
| Dishonored 2 - 1920x1080 Ultra Preset AA:TX | |
| NVIDIA GeForce GTX 1080 Ti (Desktop) | |
| NVIDIA GeForce GTX 1070 SLI (Desktop) | |
| AMD Radeon RX 480 (Desktop) | |
| AMD Radeon RX 470 (Desktop) | |
| NVIDIA GeForce GTX 1050 Ti (Desktop) | |
| NVIDIA GeForce GTX 1050 (Desktop) | |
| For Honor - 1920x1080 Extreme Preset AA:T AF:16x | |
| NVIDIA GeForce GTX 1080 Ti (Desktop) | |
| NVIDIA GeForce GTX 1070 SLI (Desktop) | |
| NVIDIA GeForce GTX 1070 (Desktop) | |
| AMD Radeon RX 480 (Desktop) | |
| AMD Radeon RX 470 (Desktop) | |
| NVIDIA GeForce GTX 1050 Ti (Desktop) | |
| NVIDIA GeForce GTX 1050 (Desktop) | |
| low | med. | high | ultra | 4K | |
|---|---|---|---|---|---|
| BioShock Infinite (2013) | 276.9 | 242.9 | 233.4 | 199.5 | |
| GTA V (2015) | 125.9 | 114.6 | 88.7 | 86.1 | 81.3 |
| The Witcher 3 (2015) | 170.4 | 132.4 | 111.2 | 73.1 | 54.4 |
| Rainbow Six Siege (2015) | 243.4 | 196 | 159.6 | 141.1 | 53 |
| Rise of the Tomb Raider (2016) | 205.7 | 161 | 142.1 | 139.2 | 74 |
| Far Cry Primal (2016) | 72 | 66 | 61 | 58 | 64 |
| The Division (2016) | 200.7 | 170 | 131.8 | 117.7 | 66.4 |
| Deus Ex Mankind Divided (2016) | 79.2 | 77.3 | 69.3 | 66.5 | 47.9 |
| Battlefield 1 (2016) | 185.3 | 165.3 | 149.9 | 138.9 | 67.7 |
| Dishonored 2 (2016) | 108.9 | 104.9 | 101 | 80.9 | 62 |
| Watch Dogs 2 (2016) | 120.7 | 112 | 103.2 | 89.1 | 60.4 |
| Resident Evil 7 (2017) | 282.2 | 233.4 | 174.8 | 155.7 | 52.7 |
| For Honor (2017) | 223.2 | 178.4 | 173.3 | 151.8 | 87.3 |
| Ghost Recon Wildlands (2017) | 160.2 | 121.9 | 109.1 | 69.4 | 57.4 |
| F1 2017 (2017) | 221 | 190 | 168 | 109 | 68 |
| Ark Survival Evolved (2017) | 121.4 | 85.2 | 81.6 | 62.1 | 26.7 |
| FIFA 18 (2017) | 344.6 | 331.3 | 310.6 | 305.4 | 187.6 |
| Middle-earth: Shadow of War (2017) | 111 | 95 | 81 | 67 | 45 |
| The Evil Within 2 (2017) | 93.7 | 65.7 | 59.1 | 57.7 | 24.4 |
| ELEX (2017) | 120.5 | 120.2 | 101.4 | 79.8 | 26.1 |
| Destiny 2 (2017) | 121 | 119 | 124 | 120.9 | 58.1 |
| Wolfenstein II: The New Colossus (2017) | 187.5 | 125.1 | 109.2 | 101.7 | 40.7 |
| Assassin´s Creed Origins (2017) | 75 | 72 | 70 | 61 | 31 |
| Need for Speed Payback (2017) | 140.7 | 118.2 | 109.4 | 108.1 | 40.9 |
| Star Wars Battlefront 2 (2017) | 160.8 | 145.7 | 129.5 | 119.9 | 58.1 |
| Fortnite (2018) | 425.5 | 279.5 | 175.5 | 123 | 37.5 |
| Final Fantasy XV Benchmark (2018) | 132.6 | 82.8 | 57.6 | 24.7 | |
| Kingdom Come: Deliverance (2018) | 135 | 90.4 | 64.2 | 48.4 | 19.5 |
Compute Performance
Given that there are 1920 shader units per GPU, the compute performance of the SLI system is much higher. The Zotac GeForce GTX 1070 Mini does actually quite well when running LuxMark v2.0 and ComputeMark v2.1. The SLI combo outperforms the competition by a fair margin mainly because of the LuxMark 2.0 results, as this benchmark takes full advantage of the SLI technology. We still can't whole-heartedly recommend an SLI system for professional use - an Nvidia Quadro GPU or AMDs counterpart FirePro are the much better choices.
| NVIDIA GeForce GTX 1070 SLI (Desktop) Desktop PC Ryzen 7 1800X + Zotac GeForce GTX 1070 SLI, R7 1800X | NVIDIA GeForce GTX 1070 (Desktop) Nvidia GeForce GTX 1070 Founders Edition, 4790K | NVIDIA GeForce GTX 1080 Ti (Desktop) Nvidia GeForce GTX 1080 Ti Founders Edition, 4790K | NVIDIA GeForce GTX 1060 (Desktop) Nvidia GeForce GTX 1060 Founders Edition 6 GB, 6700K | NVIDIA GeForce GTX 1050 Ti (Desktop) MSI GeForce GTX 1050 Ti, 4790K | NVIDIA GeForce GTX 1050 (Desktop) Zotac GeForce GTX 1050 2GB, 4790K | AMD Radeon RX 480 (Desktop) AMD Radeon RX 480 8 GB Reference, 4790K | AMD Radeon RX 470 (Desktop) MSI RX 470 Gaming X 4GB, 4790K | |
|---|---|---|---|---|---|---|---|---|
| LuxMark v2.0 64Bit | -49% | -34% | -69% | -77% | -80% | -65% | -70% | |
| Room GPUs-only (Samples/s) | 4923 | 2474 -50% | 3050 -38% | 1773 -64% | 1175 -76% | 1037 -79% | 1661 -66% | 1440 -71% |
| Sala GPUs-only (Samples/s) | 9410 | 5012 -47% | 6600 -30% | 2584 -73% | 2156 -77% | 1864 -80% | 3468 -63% | 3020 -68% |
| ComputeMark v2.1 | 2% | 67% | -28% | -57% | -62% | -22% | -27% | |
| 1024x600 Normal, QJuliaRayTrace (Points) | 4813 | 4761 -1% | 7938 65% | 3322 -31% | 1931 -60% | 1572 -67% | 2746 -43% | 2475 -49% |
| 1024x600 Normal, Mandel Scalar (Points) | 2755 | 2861 4% | 4949 80% | 2002 -27% | 1092 -60% | 968 -65% | 2539 -8% | 2447 -11% |
| 1024x600 Normal, Mandel Vector (Points) | 2599 | 2706 4% | 4391 69% | 1994 -23% | 1277 -51% | 1100 -58% | 2162 -17% | 2172 -16% |
| 1024x600 Normal, Fluid 2DTexArr (Points) | 1365 | 1390 2% | 2092 53% | 963 -29% | 596 -56% | 555 -59% | 991 -27% | 911 -33% |
| 1024x600 Normal, Fluid 3DTex (Points) | 1378 | 1402 2% | 2275 65% | 985 -29% | 597 -57% | 554 -60% | 1220 -11% | 1039 -25% |
| 1024x600 Normal, Score (Points) | 12910 | 13121 2% | 21646 68% | 9266 -28% | 5493 -57% | 4749 -63% | 9659 -25% | 9044 -30% |
| Total Average (Program / Settings) | -24% /
-11% | 17% /
42% | -49% /
-38% | -67% /
-62% | -71% /
-66% | -44% /
-33% | -49% /
-38% |
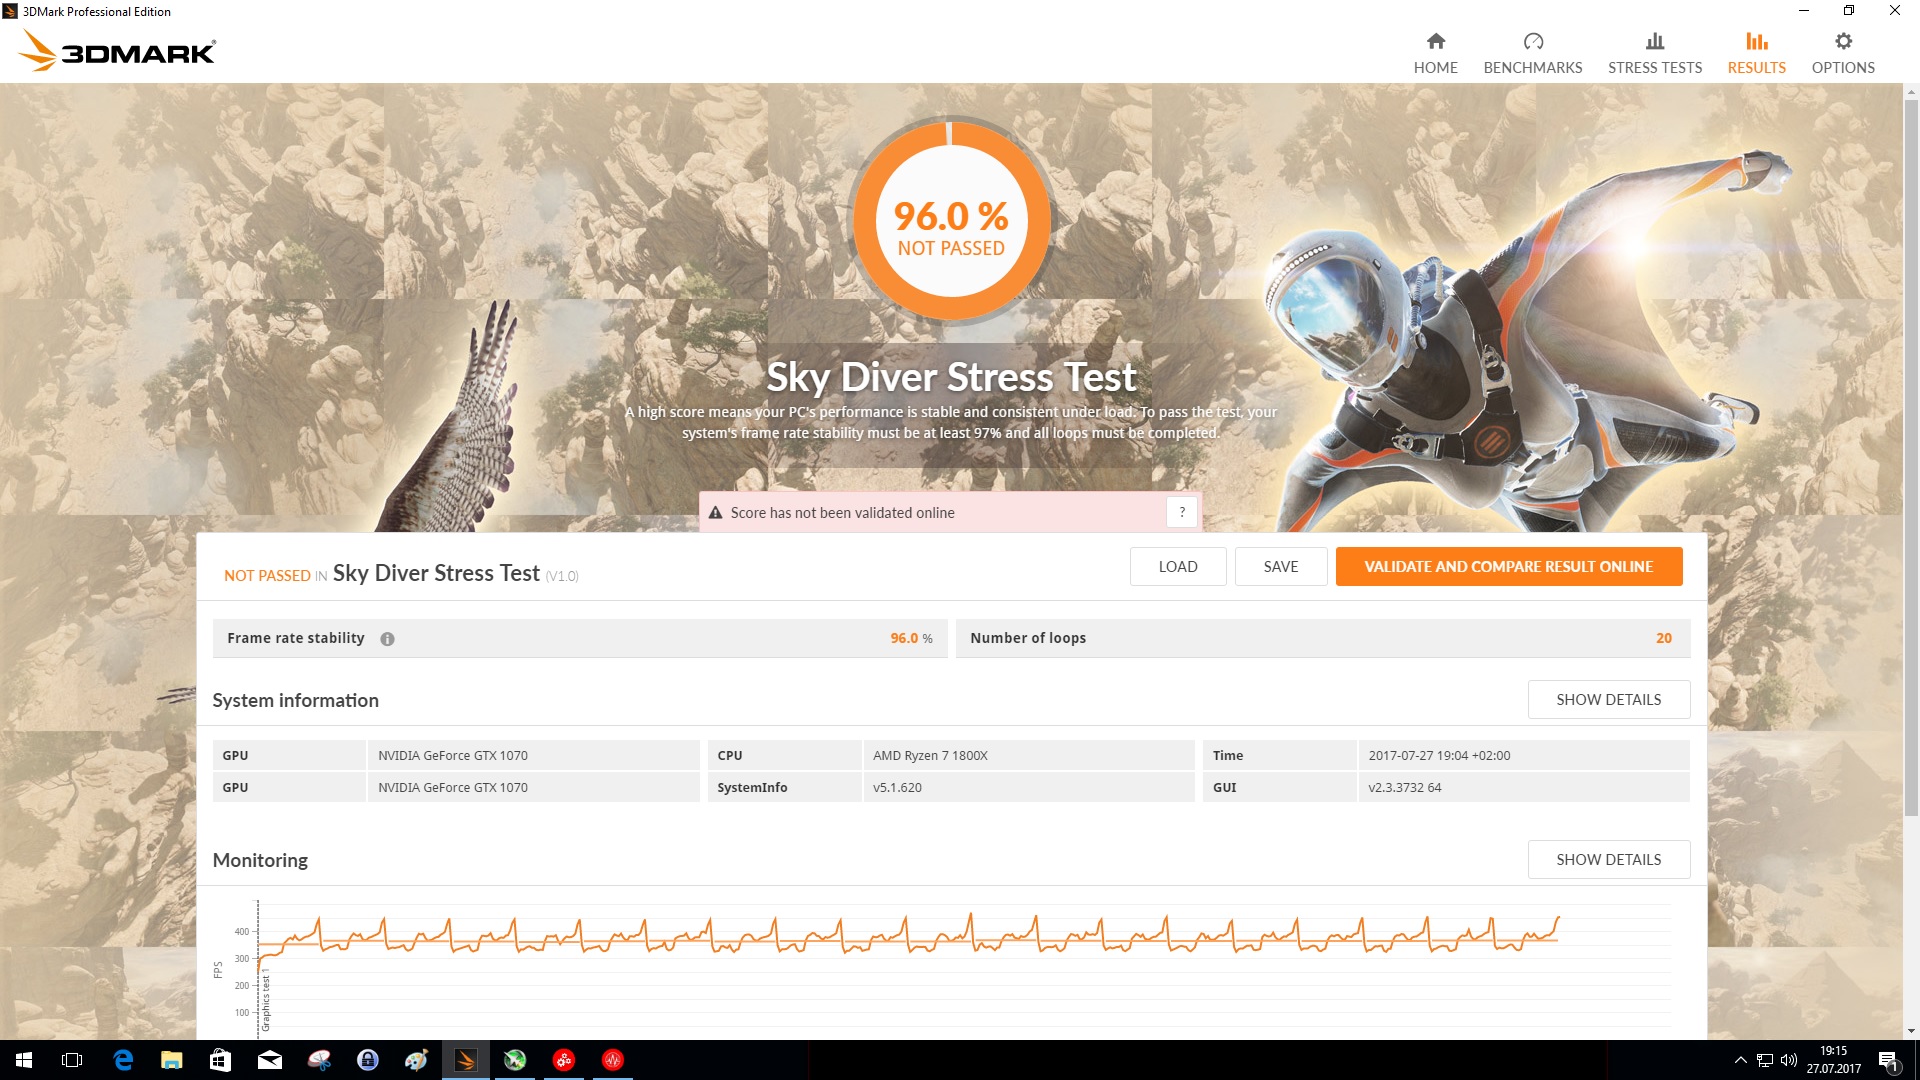
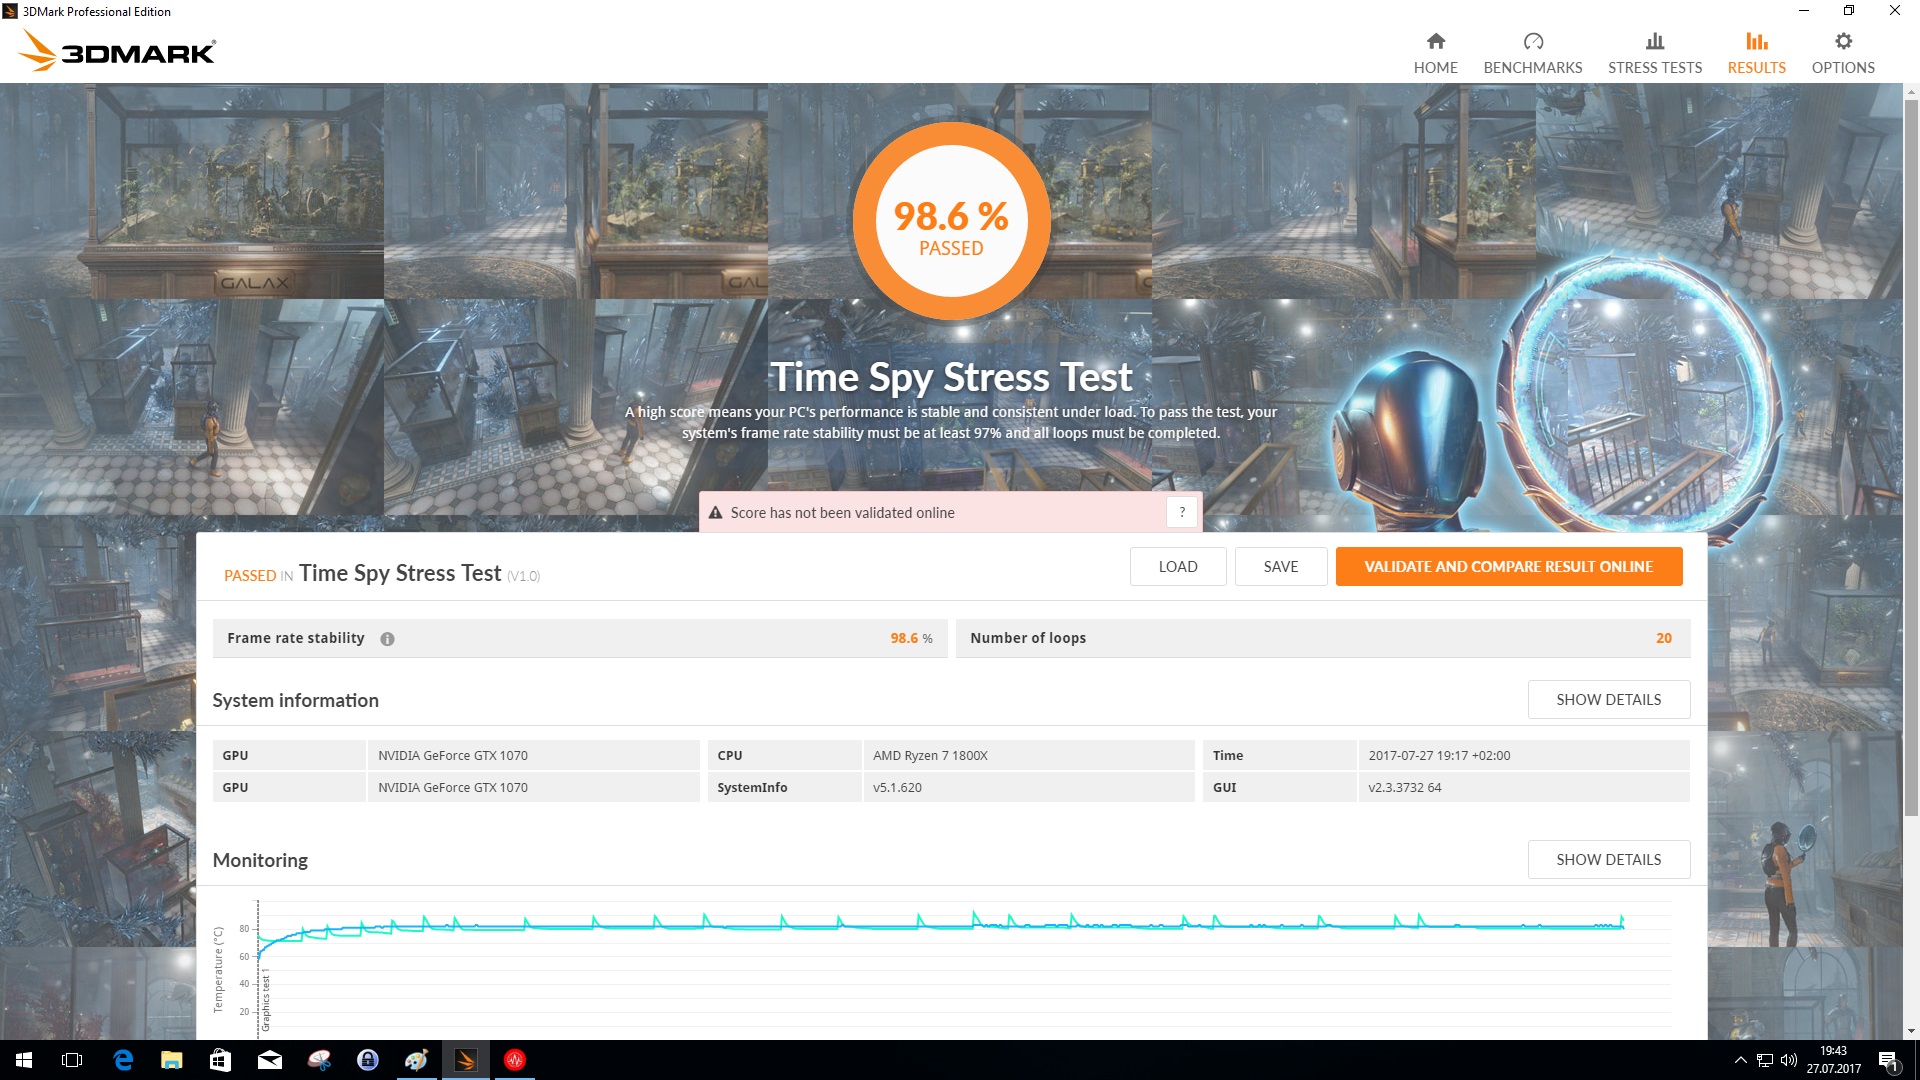
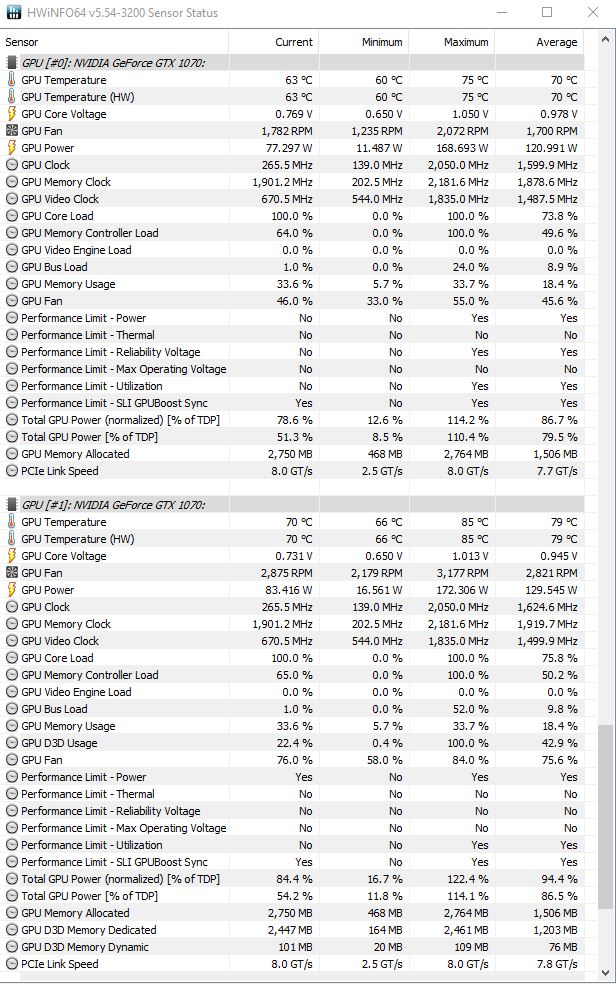
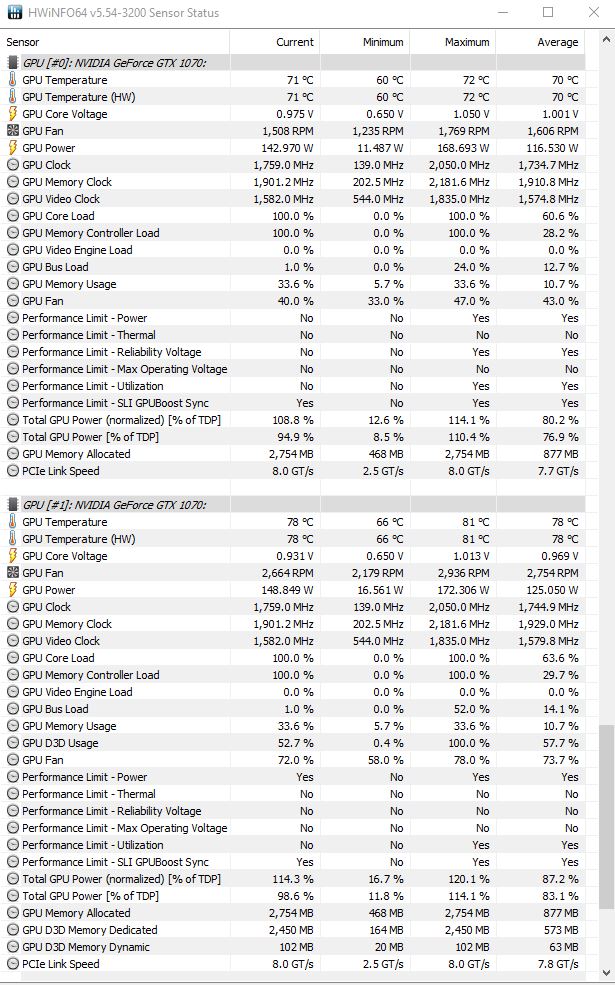
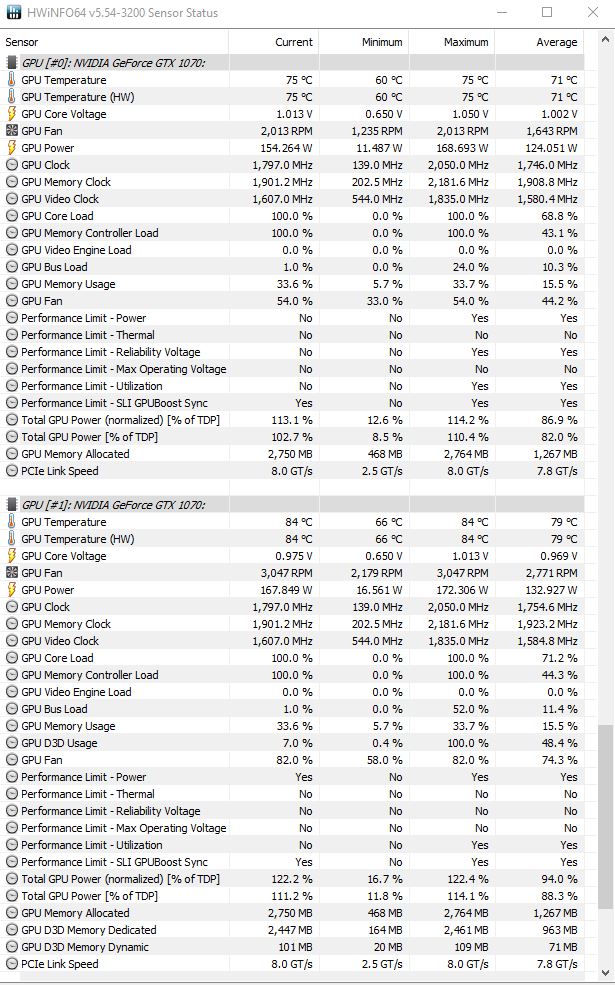
Stress Test and Emissions
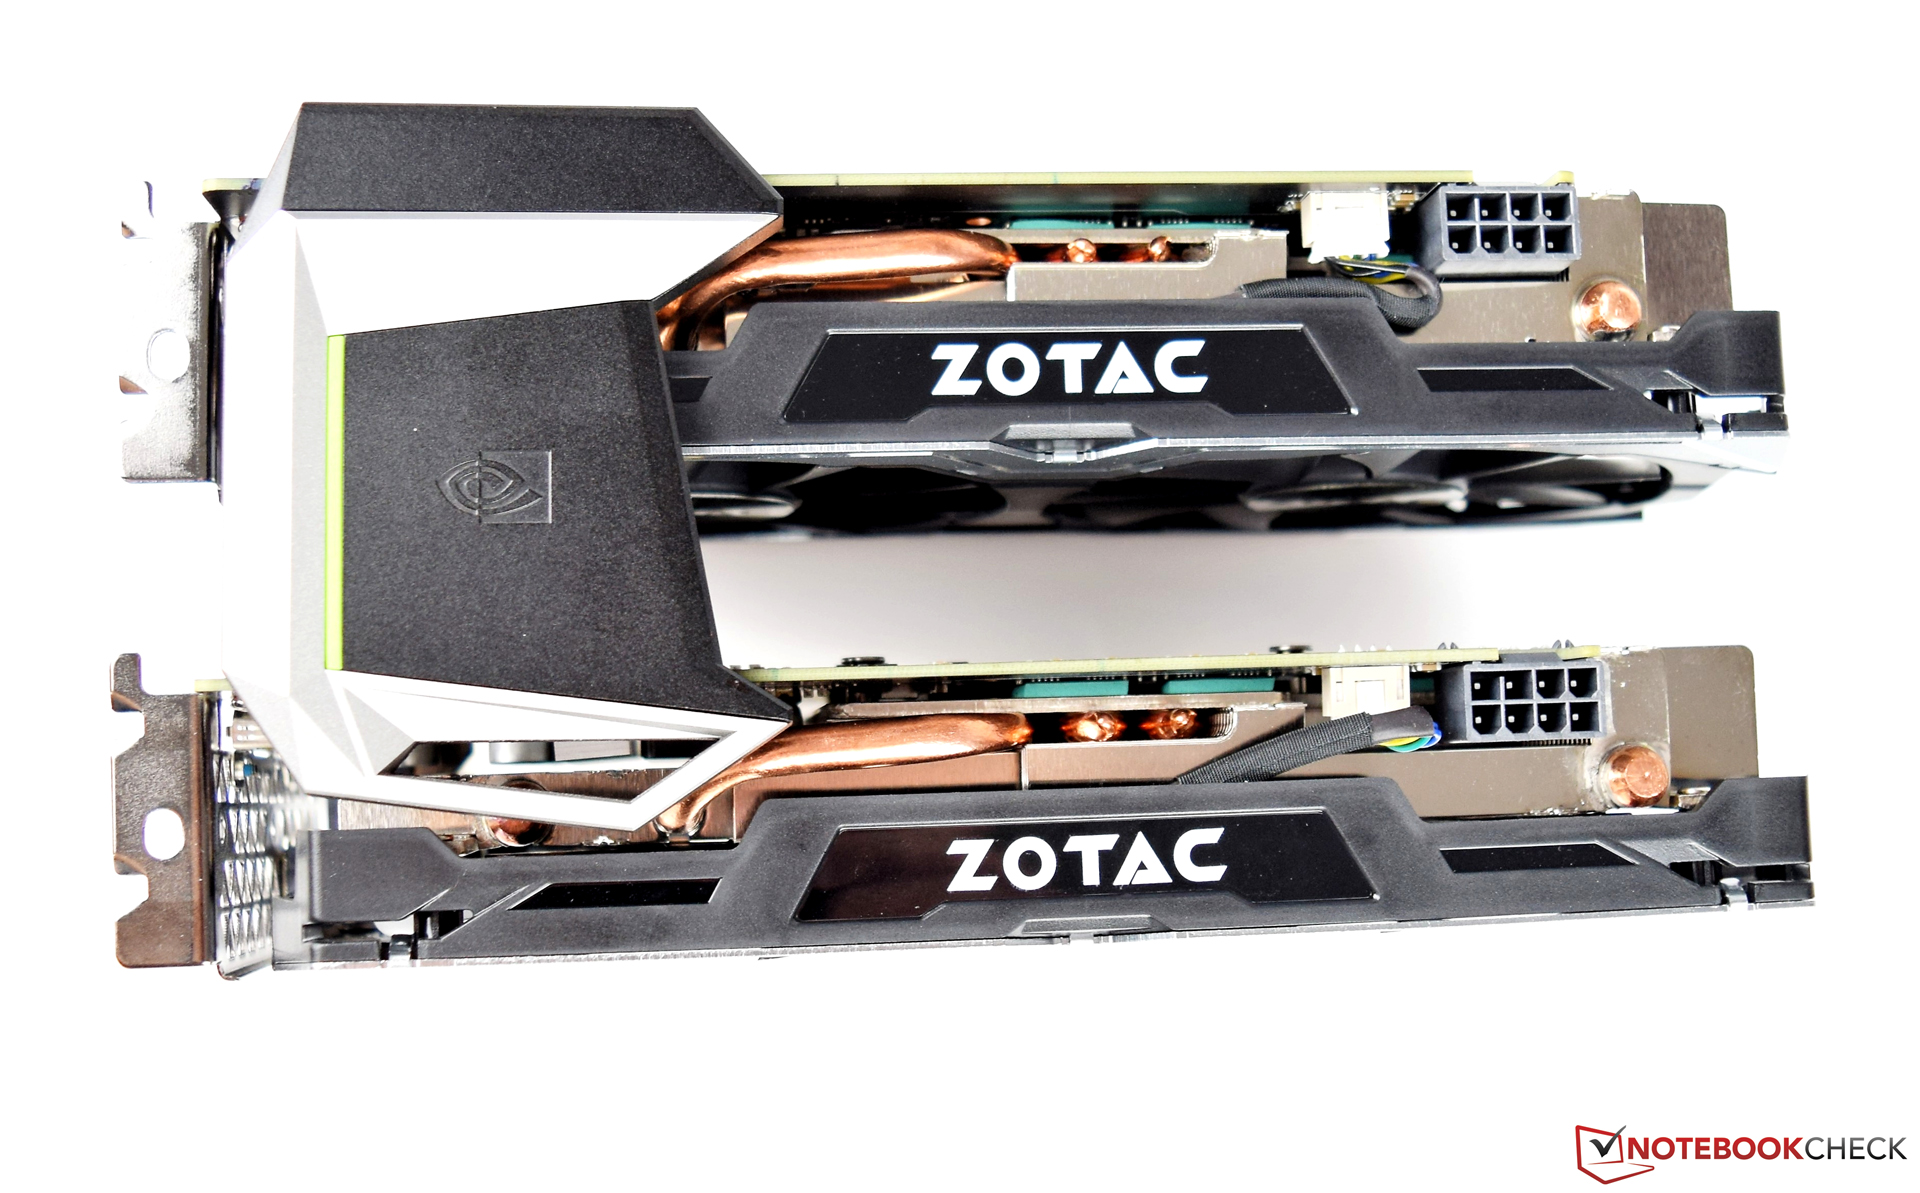
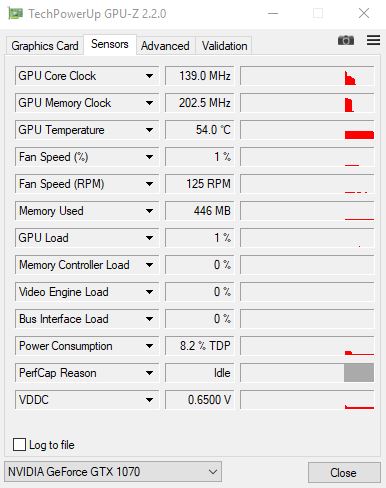
To check for adequate cooling, we run our stress test and subject the graphic cards to the benchmark tool Furmark. Both GPUs start to heat up shortly after the start of the test. The upper GPU gets warmer, since it absorbs some of the heat generated by the lower GPU. For this reason, the temperature increases to 81 °C after only five minutes, which doesn't allow for a lot of headroom given the maximum temperature "target" of 83 °C. The upper GPU does hit this ceiling eventually, which in turn leads to a reduction of the clock speeds. Under load, the fans emit a distinct whooshing sound, although we wouldn't describe that sound as annoying. The radial fan Nvida uses for the Titan X is substantially louder. Thanks to "Fan Stop", the two GPUs are silent when performing 2D tasks.
About our review system:
Although our case is equipped with two 140 mm fans in the front which suck in cooling air, the upper GPU of the SLI team surpasses the optimum temperature window under continuous load. Users interested in an SLI system might want to consider liquid cooling, which would improve the GPU temperatures significantly.
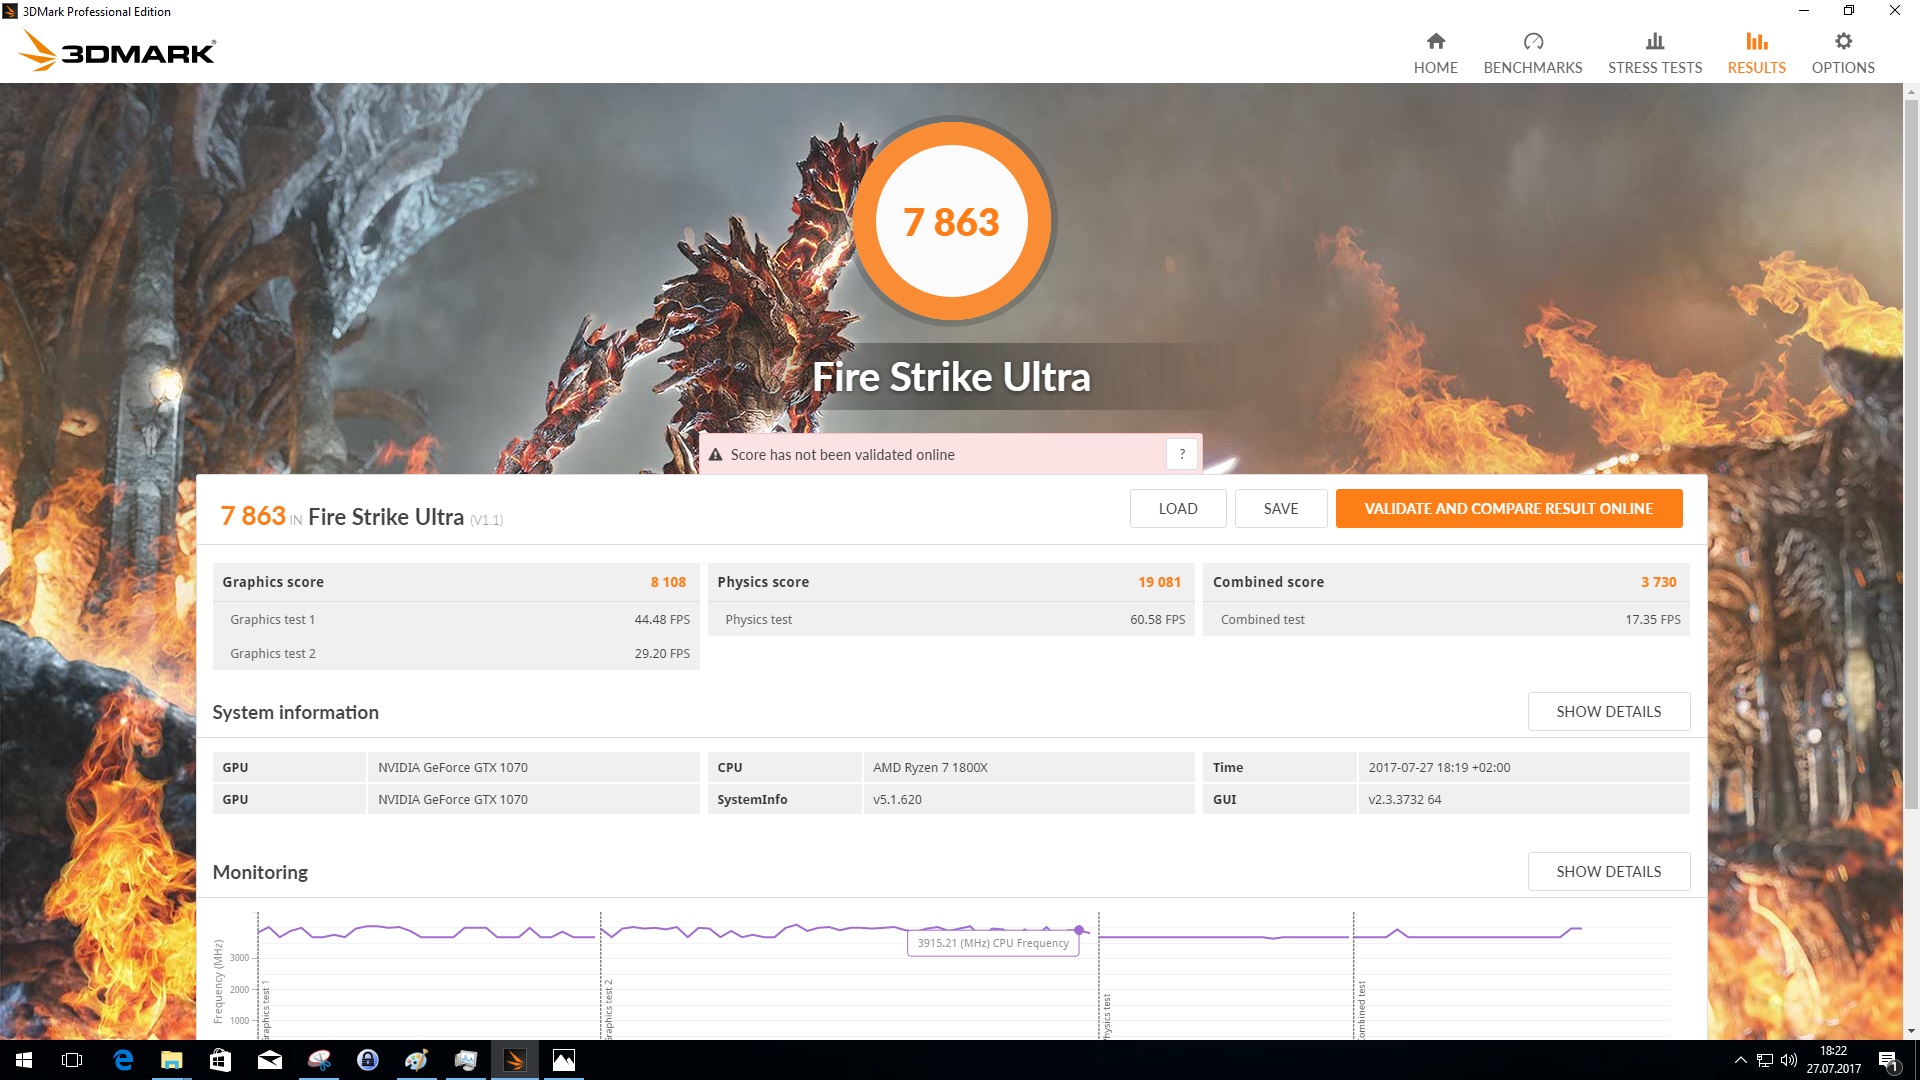
Power Consumption and Overclocking

Despite the high temperatures under load, we decided to take a chance by overclocking the cards. We used the tool "MSI Afterburner" to increase the power limit to its maximum (112 %), which in turn increased the maximum power draw for each card from 150 W to 168 W. At the same time, we increased the temperature target to a maximum of 92 °C. The performance was stable in SLI mode with recorded pluses of 150 MHz for the core frequency and 400 MHz for the VRAM. The 3DMark Fire Strike Ultra score improved from 7863 to 8531 points.
Verdict
The Zotac GeForce GTX 1070 Mini is a space-saving gaming GPU. We like the changes Zotac implemented compared to Nvidia's reference design. The noise level of the cooling fans isn't annoying even at maximum load levels. While SLI systems were much more common years ago, the are slowly disappearing from the scene. The reason is straightforward: even a single GeForce GTX 1070 can handle pretty much any current game. But of course there are gamers out there who think that even 150 FPS aren't "good enough". Users who want to build a SLI rig should really spend some time looking at the pros and cons however before making a final decision.
Users with sufficient funds for an SLI system are better off with a higher-end single graphics card. SLI systems simply suffer from too many nagging little problems.
We recommend single GPUs over multi-GPU systems, as the later don't have many advantages and games can be arduous to configure as well. In addition, not all games support SLI, which is aggravating as well. The main disadvantage of an SLI combo are the high temperatures and the much higher power draw.

