

Lenovo ThinkPad P14s Gen 2 laptop in review: Compact workstation with new graphics card

In our review of the AMD model of the ThinkPad P14s Gen 1, the installed Ryzen 7 Pro 4750U was able to achieve a very good performance. Among other things, there were points of criticism due to the short battery life and the lack of Thunderbolt support. At least the latter is no longer a problem according to the spec sheet of the Tiger Lake version that we have before us.
With an Intel Core i7-1185G7, an Nvidia Quadro T500, 16 GB of RAM, and a 1 TB SSD, the ThinkPad P14s Gen 2 has to face the comparison with the rival devices listed below. You can also add more laptops from our database under each section.
Possible contenders in comparison
Rating | Date | Model | Weight | Height | Size | Resolution | Price |
|---|---|---|---|---|---|---|---|
| 85.1 % v7 (old) | 06 / 2021 | Lenovo ThinkPad P14s Gen2-20VX000GGE i7-1185G7, T500 Laptop GPU | 1.5 kg | 18 mm | 14.00" | 1920x1080 | |
| 85.2 % v7 (old) | 04 / 2021 | HP ZBook Firefly 14 G8 2C9Q2EA i7-1165G7, T500 Laptop GPU | 1.4 kg | 17.9 mm | 14.00" | 1920x1080 | |
| 83.8 % v7 (old) | 03 / 2021 | Lenovo ThinkPad P14s Gen1-20Y10002GE R7 PRO 4750U, Vega 7 | 1.6 kg | 17.9 mm | 14.00" | 1920x1080 | |
| 82.7 % v7 (old) | 01 / 2021 | Lenovo ThinkPad P14s Gen1 20S40009GE i7-10510U, Quadro P520 | 1.5 kg | 17.9 mm | 14.00" | 1920x1080 | |
| 82.5 % v7 (old) | 12 / 2020 | MSI Prestige 14 Evo A11M-005 i7-1185G7, Iris Xe G7 96EUs | 1.2 kg | 16 mm | 14.00" | 1920x1080 |
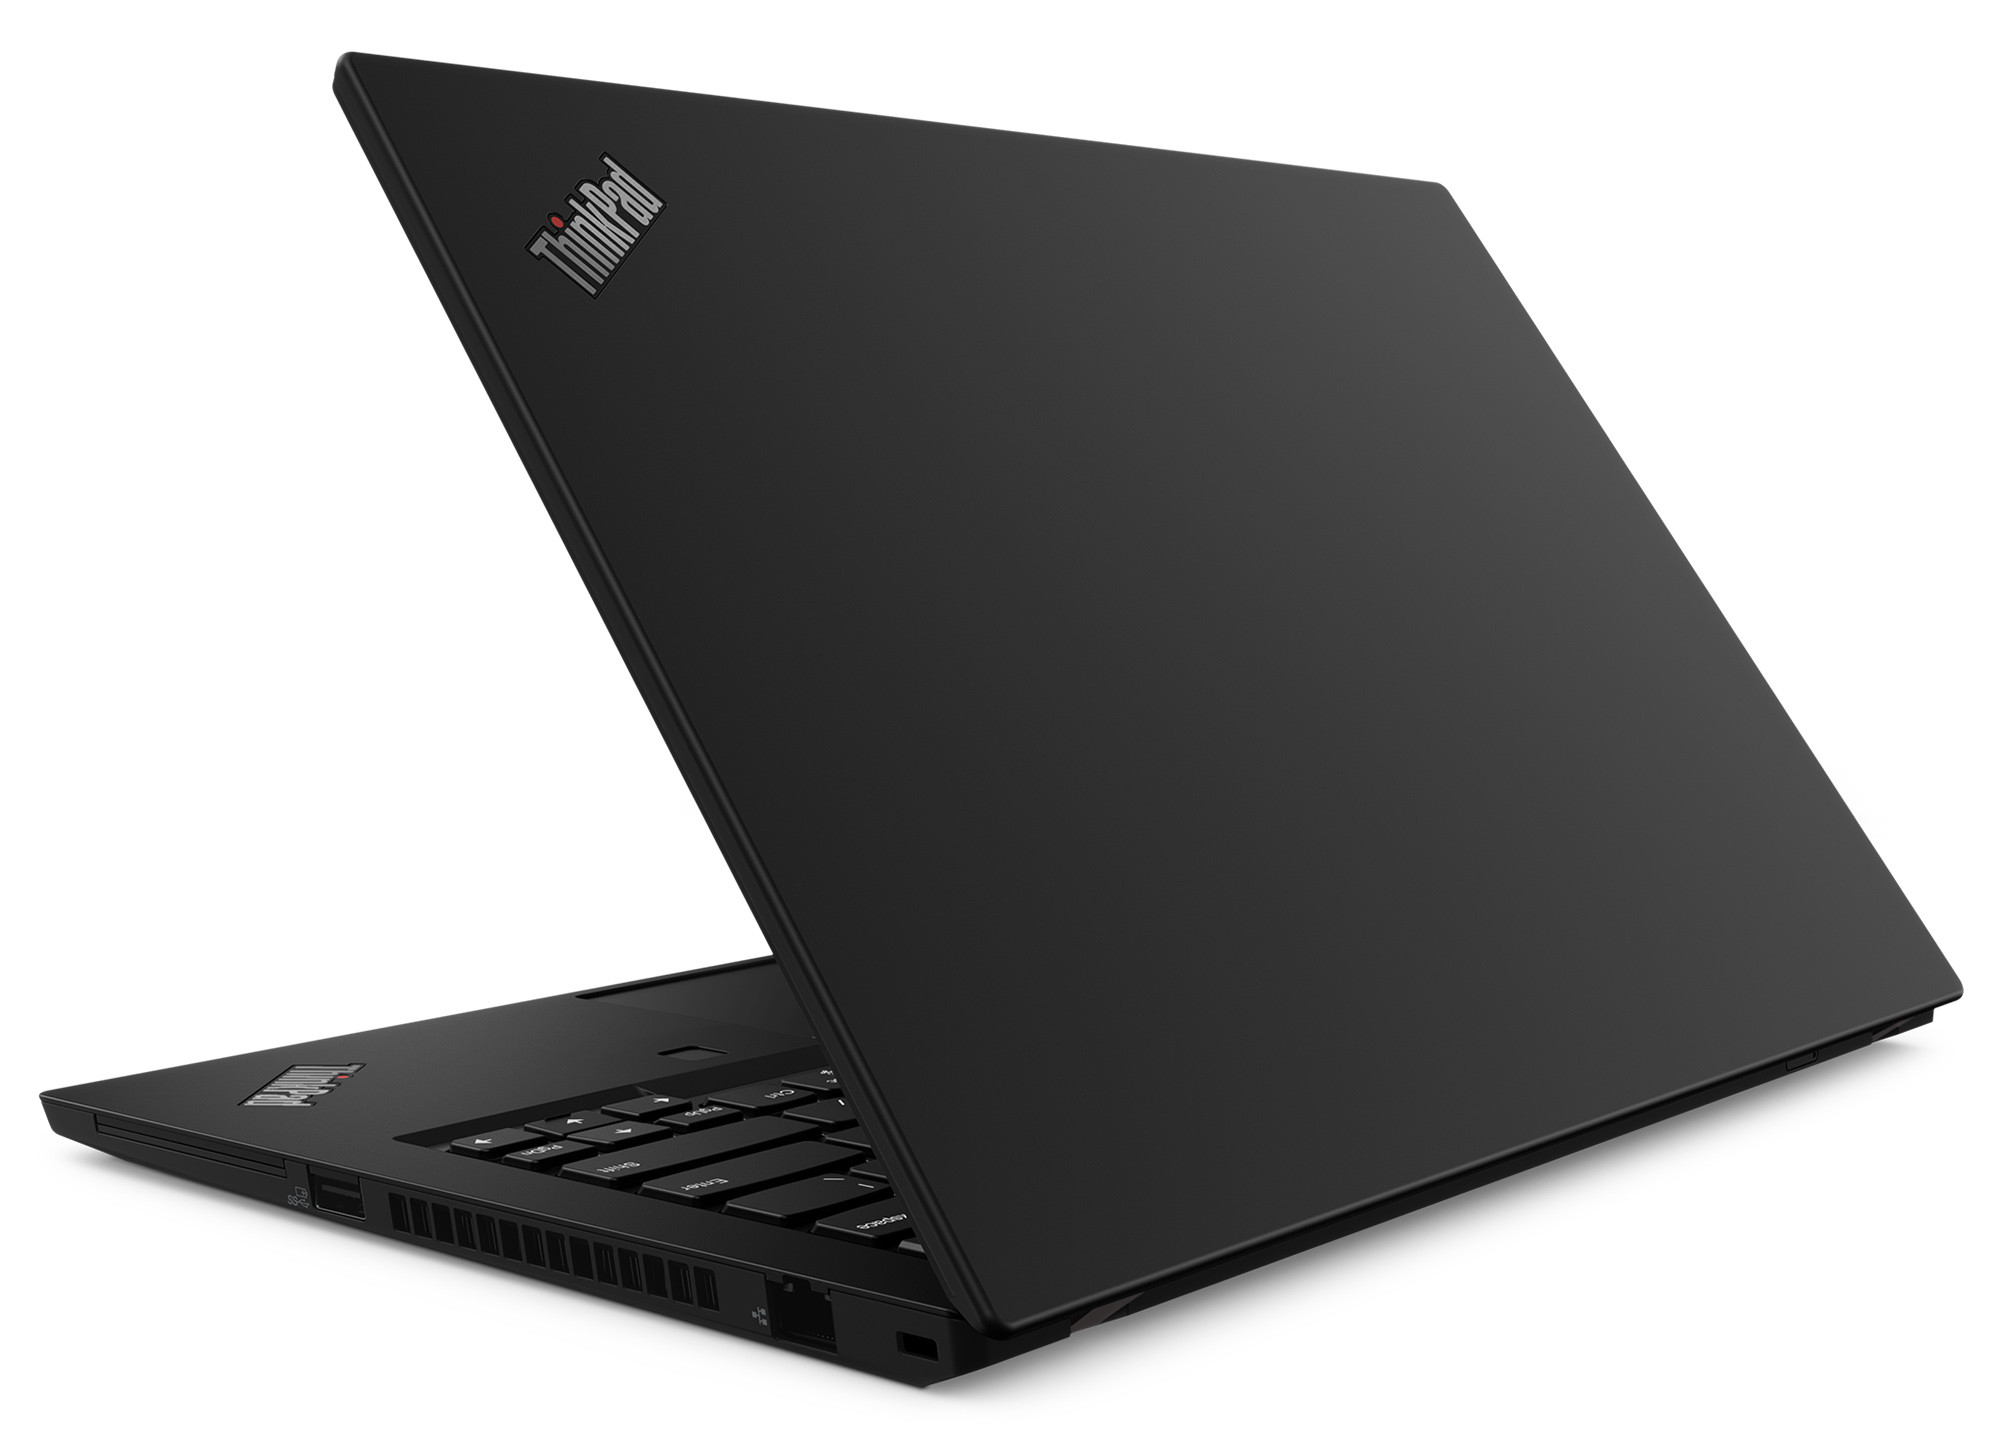
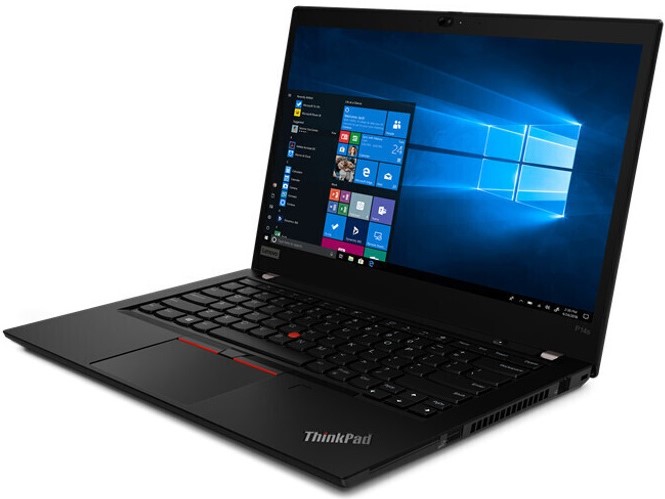
Case and connectivity - Workstation with Wi-Fi 6E support
Lenovo has made the case of the ThinkPad P14s from a robust plastic. The display can be folded back by up to 180 degrees, and it's relatively resistant to torsion. With a weight of approximately 1.5 kg, the workstation is also a rather light device, but its dimensions are a bit bigger than the our chosen competition.
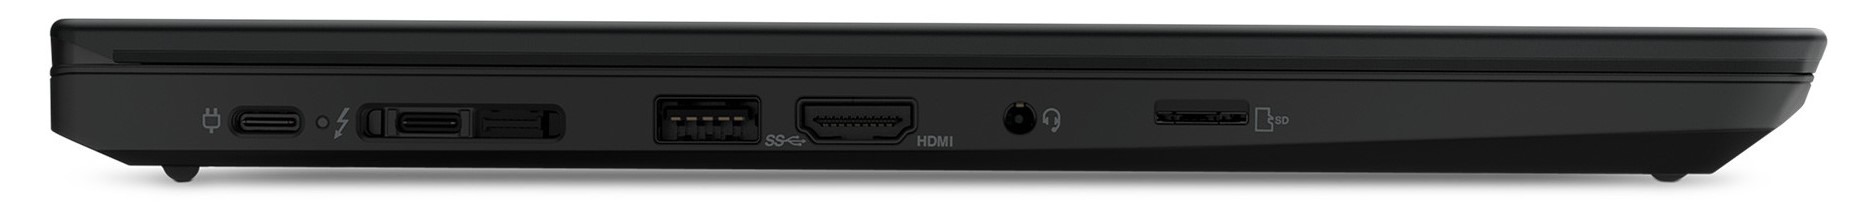
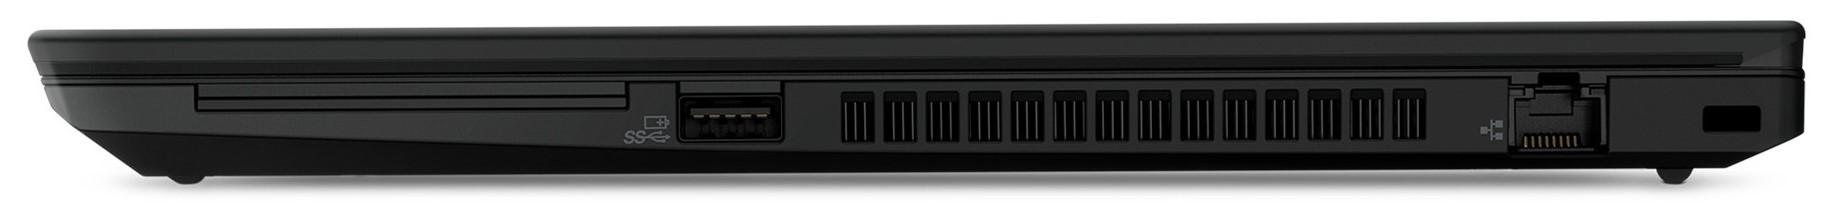
The ports are the same as on the P14s Gen 1, but the USB-C ports now support Thunderbolt 4 including DisplayPort 1.4 and Power Delivery 3.0. However, one of the two ports still gets blocked when the power adapter is connected.
The microSD card reader only supports UHS-I speeds, and it also achieves the corresponding rates with our AV Pro V60 reference memory card. At 77.1 MB/s for copying data and 85.2 MB/s for reading data, the speeds are on par with comparable devices.
The same applies to the WLAN adapter with Wi-Fi 6E capability, since it reaches speeds of 1,205 Mb/s for receiving data and 1,254 Mb/s for sending data with our reference router, the Netgear Nighthawk AX12.
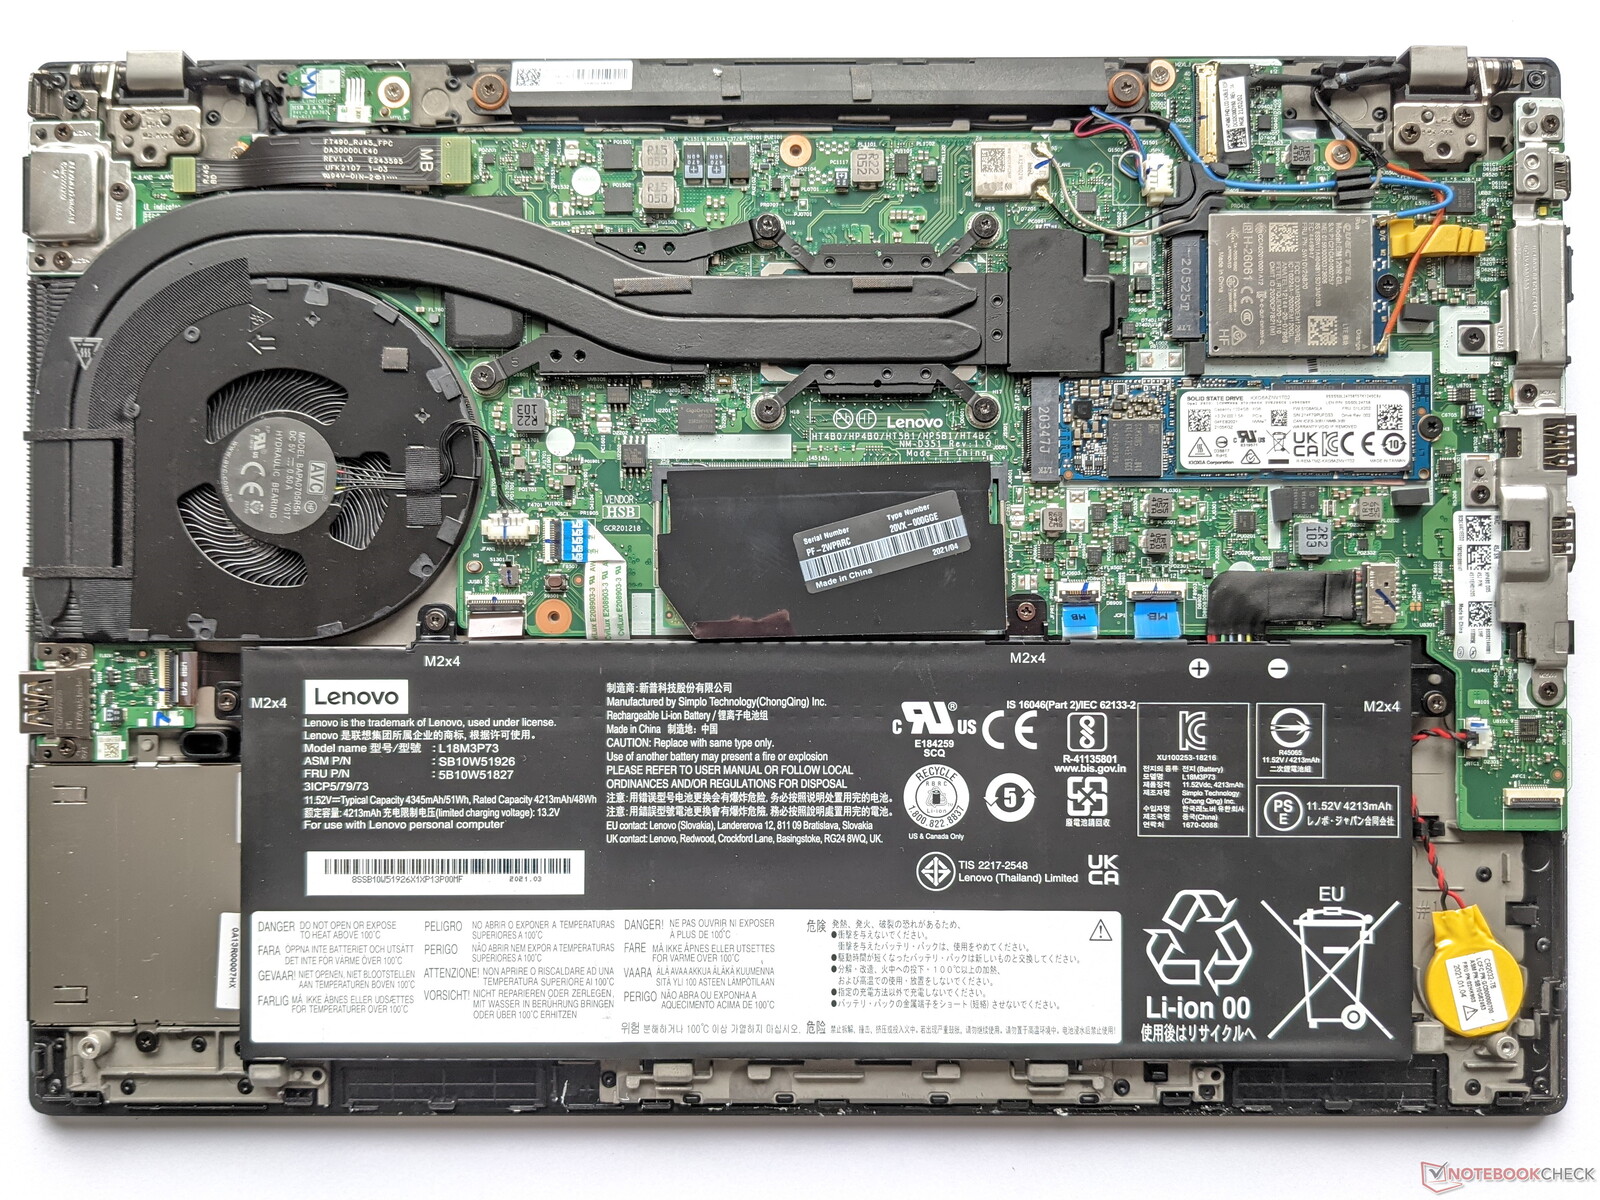
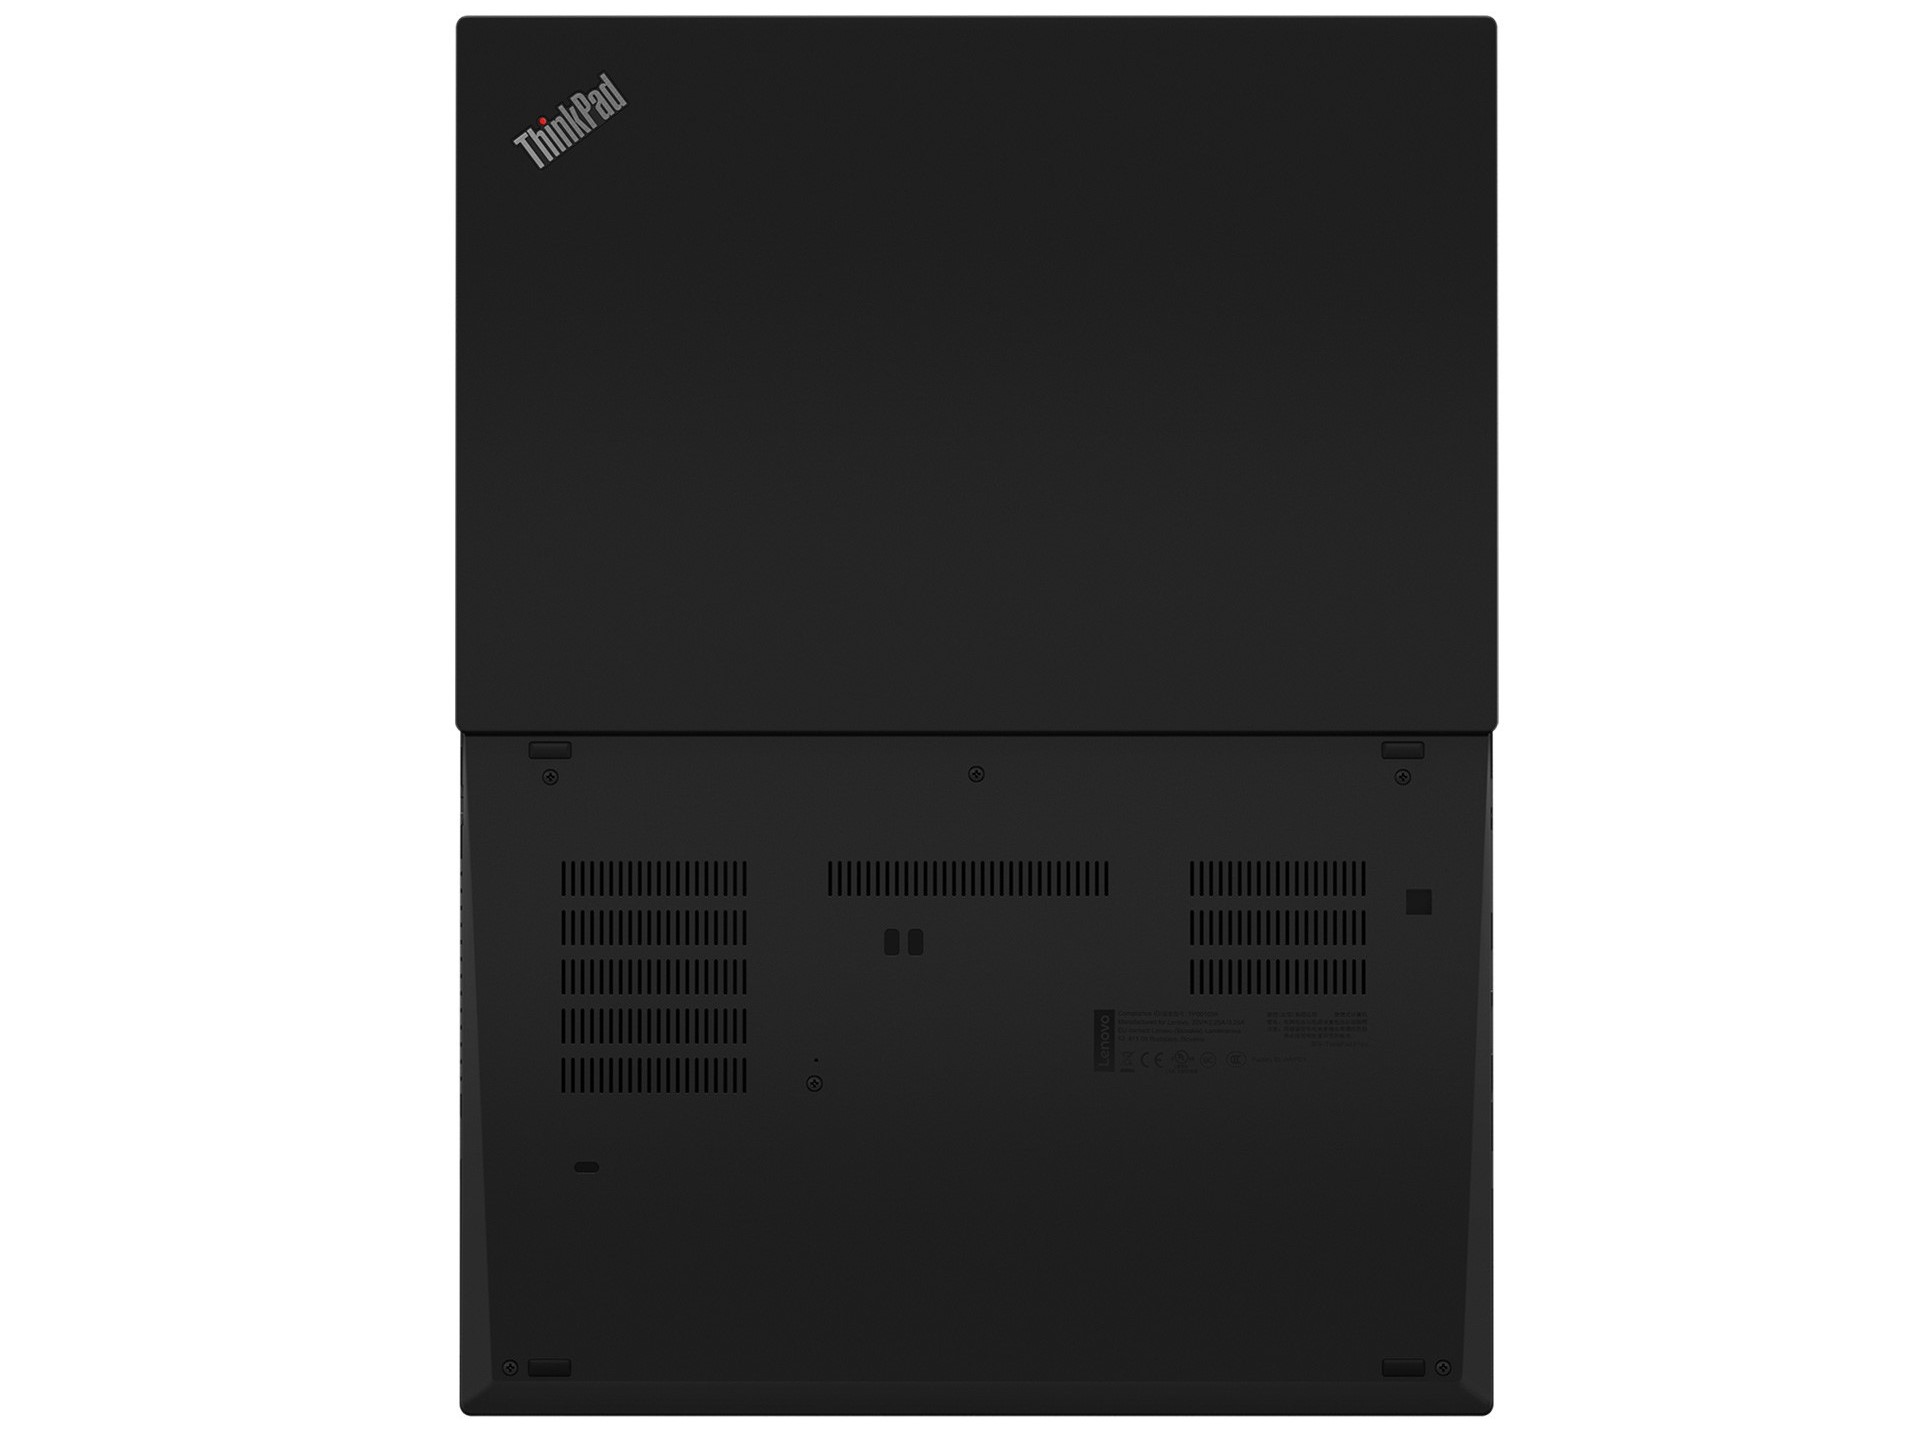
The webcam's low quality hasn't been changed; At 0.9 MP, it only delivers blurry images with pale colors even in good lighting conditions. The SSD and a RAM module can be replaced inside the ThinkPad P14s. There's also a spot for the optional WWAN module.
Port configuration
| SD Card Reader | |
| average JPG Copy Test (av. of 3 runs) | |
| Average of class Workstation (49.6 - 189.3, n=10, last 2 years) | |
| Lenovo ThinkPad P14s Gen1-20Y10002GE (Toshiba Exceria Pro M501 64 GB UHS-II) | |
| Lenovo ThinkPad P14s Gen1 20S40009GE (Toshiba Exceria Pro SDXC 64 GB UHS-II) | |
| Lenovo ThinkPad P14s Gen2-20VX000GGE (AV Pro V60) | |
| maximum AS SSD Seq Read Test (1GB) | |
| Average of class Workstation (87.6 - 227, n=10, last 2 years) | |
| Lenovo ThinkPad P14s Gen1-20Y10002GE (Toshiba Exceria Pro M501 64 GB UHS-II) | |
| Lenovo ThinkPad P14s Gen2-20VX000GGE (AV Pro V60) | |
| Lenovo ThinkPad P14s Gen1 20S40009GE (Toshiba Exceria Pro SDXC 64 GB UHS-II) | |


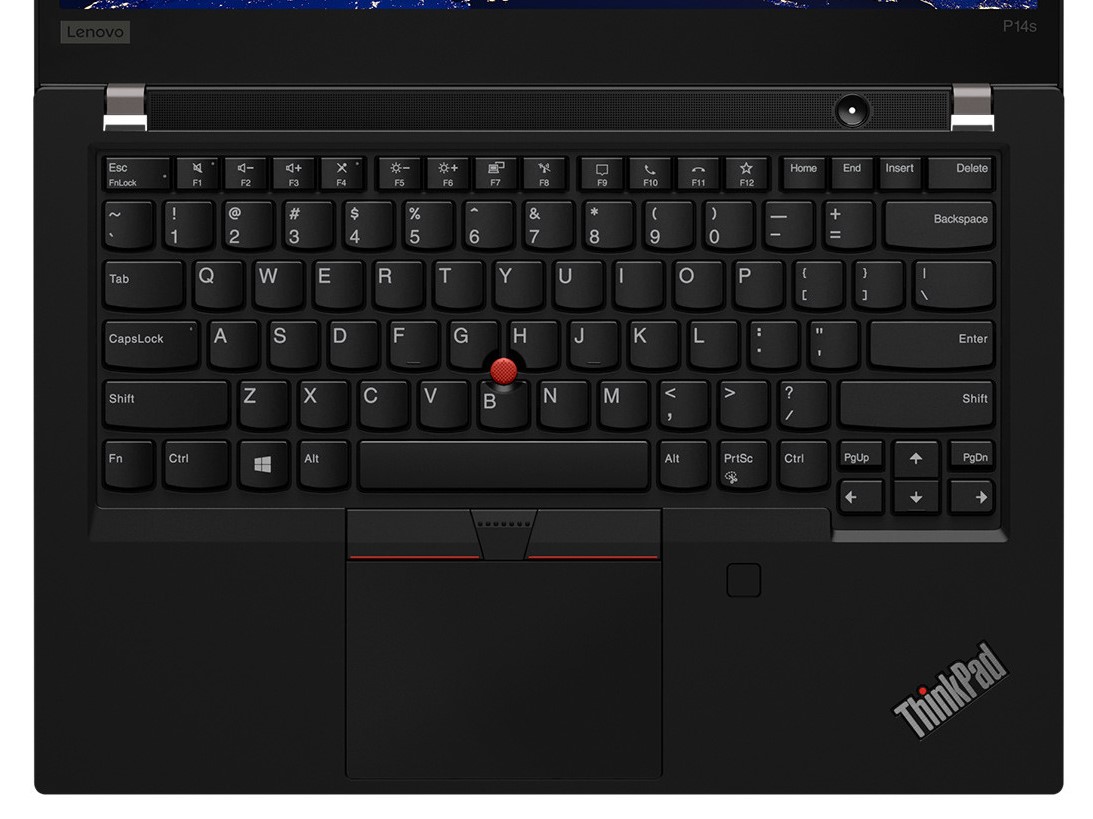
Input devices - Still comes with the good Lenovo keyboard
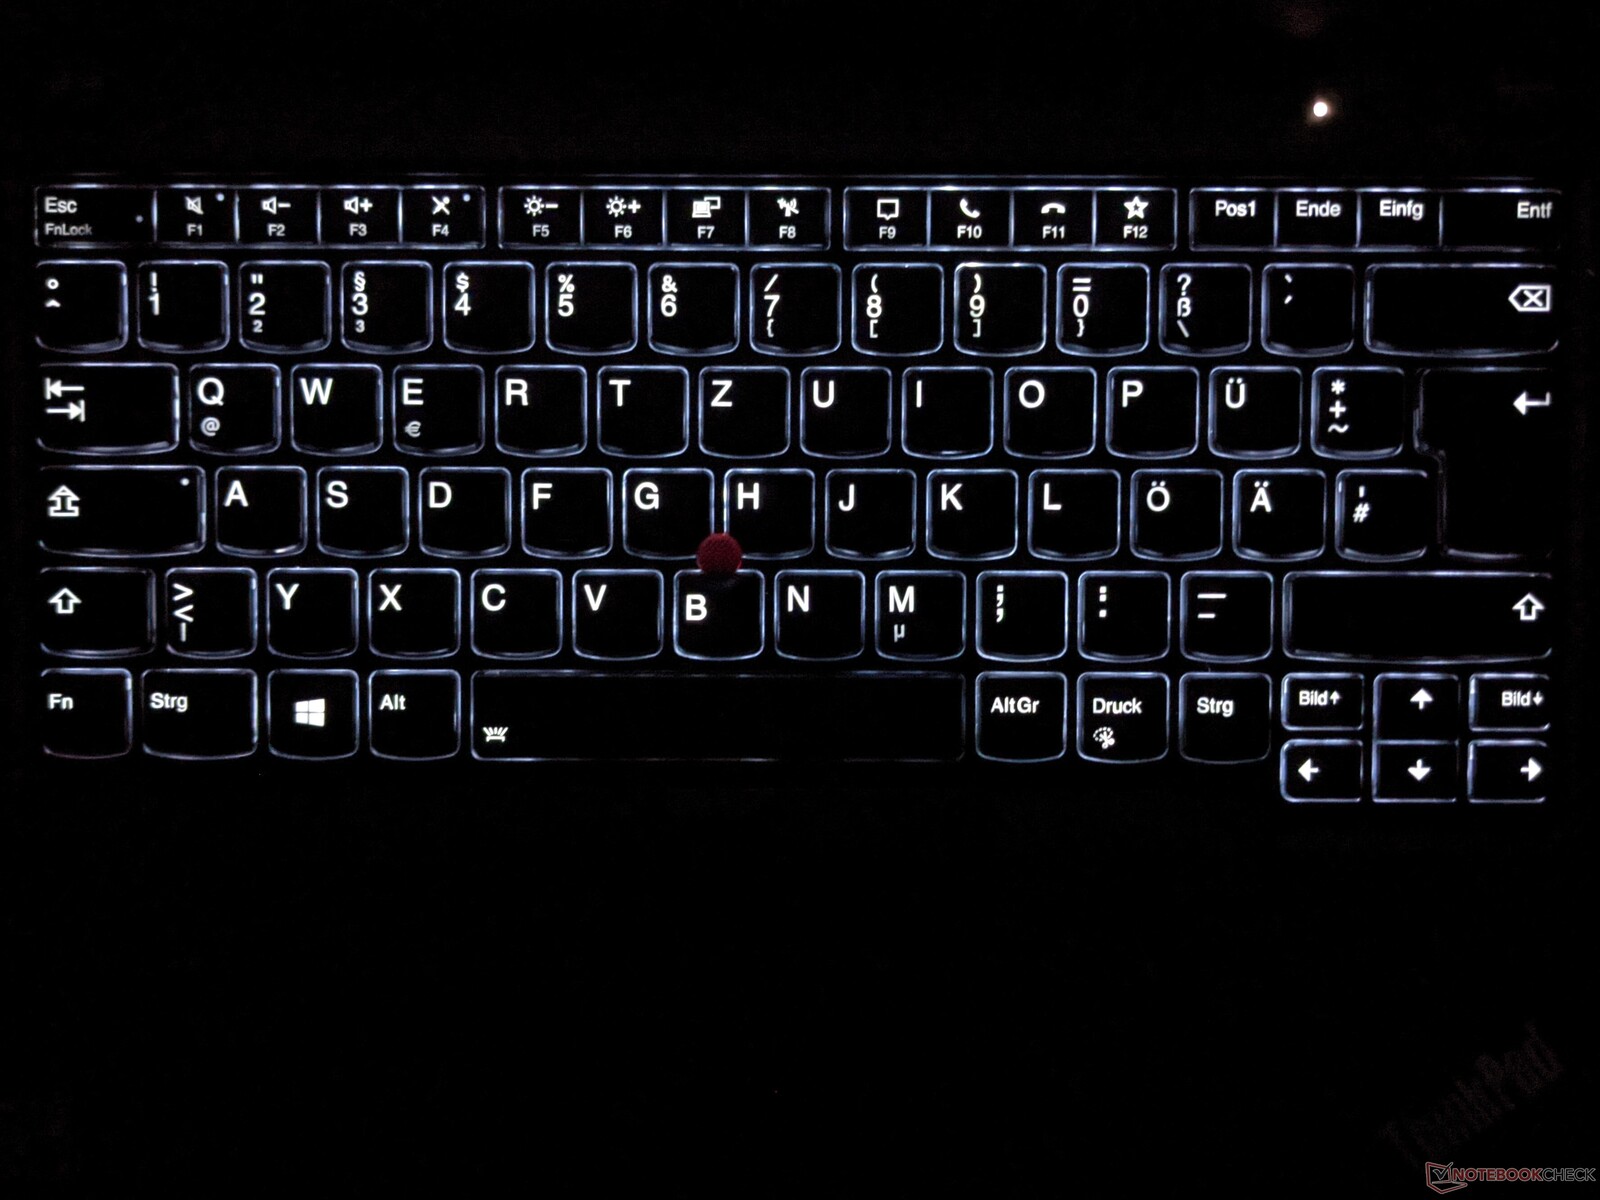
The P14s G2's keyboard still has the older and consequently deeper travel that quickly provides the familiar and very good typing feel of a ThinkPad keyboard. The two-stage white backlight, which illuminates all keys evenly, is also very good.
In addition to the ClickPad mouse replacement, there's also a TrackPoint with separate mouse buttons. Both input options are well suited for navigating the mouse pointer, and they respond reliably to inputs.
Display - Colorful and high in contrast

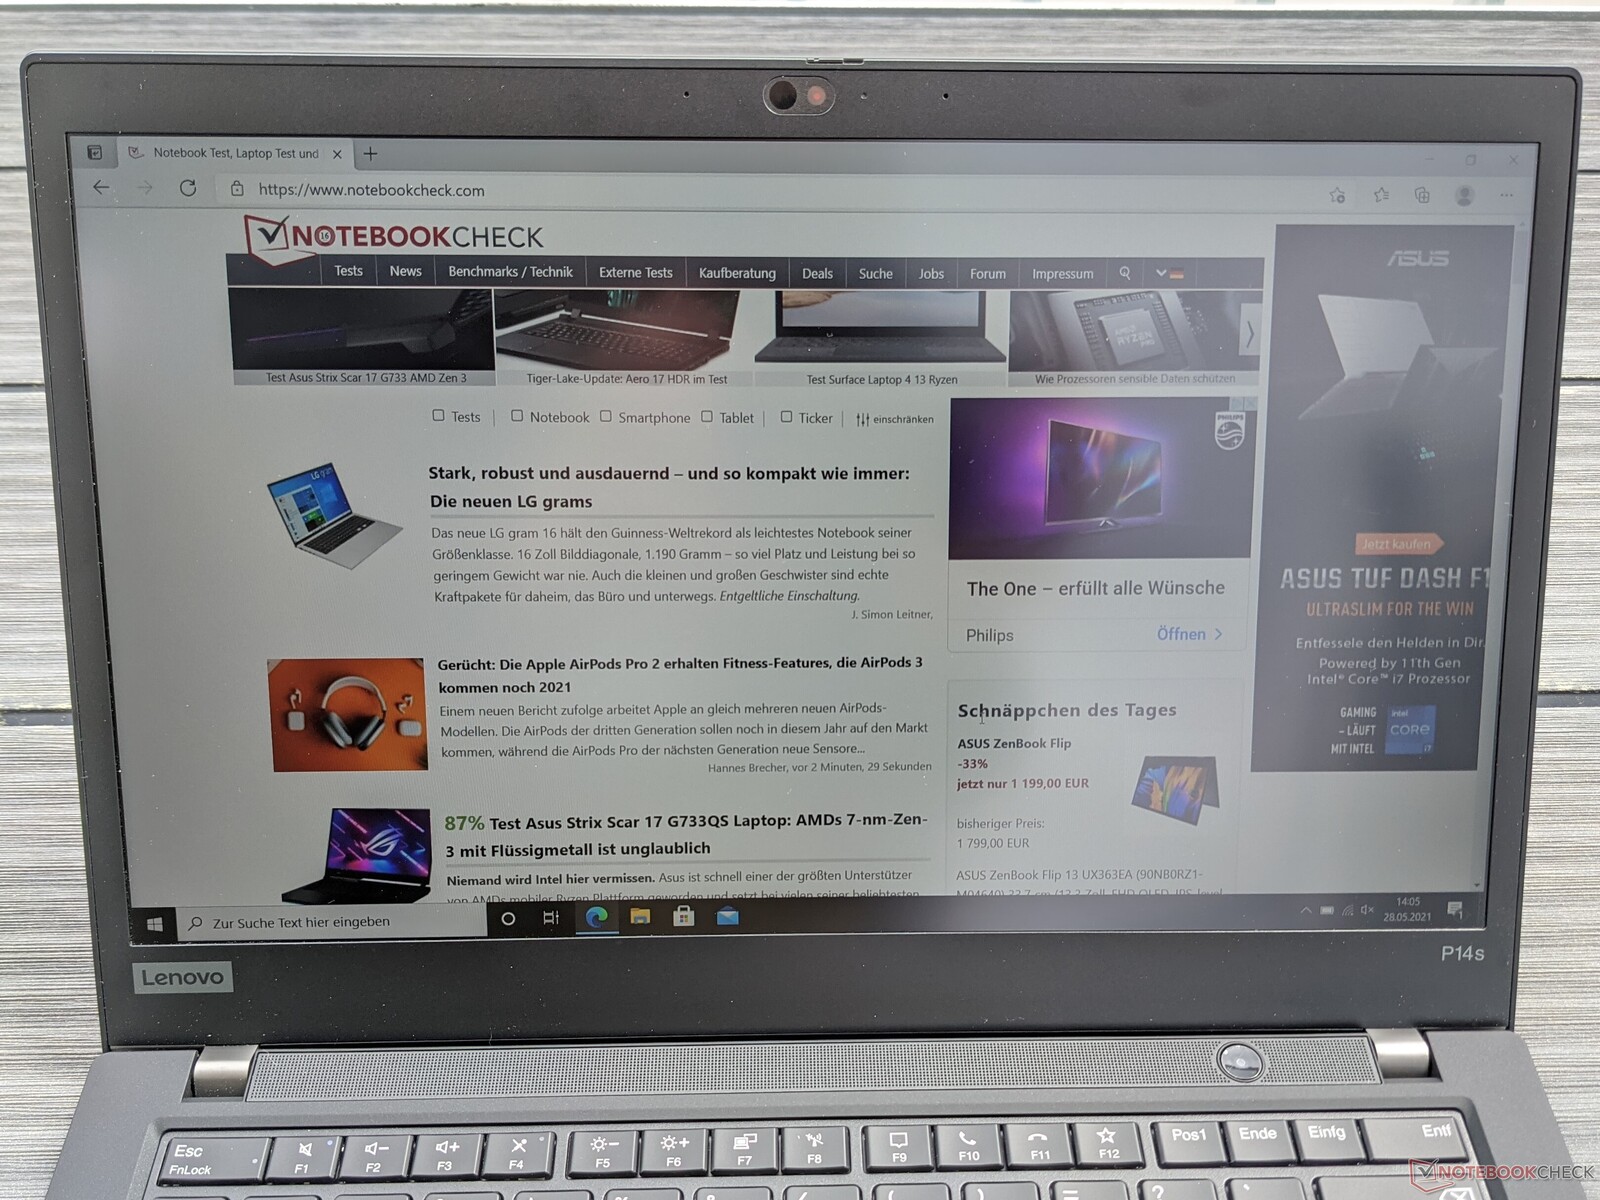
The screen of the ThinkPad P14s Gen 2 consists of a 14-inch IPS panel and offers a resolution of 1920x1080 pixels. A brightness value of 300 cd/m² is specified for the display variant installed here, and an average of 348 cd/m² is achieved in our measurement. The brightness distribution of 94% is very good, and no PWM is used for brightness control.
Besides the panel used here, the following display options are also available:
- 4K UHD (3840x2160) with 500 cd/m², Dolby Vision HDR, and factory color calibration
- Full HD (1920x1080) with ePrivacy Guard, 500 cd/m², and 72% color-space coverage (NTSC)
- Full HD (1920x1080), power-saving with 400 cd/m², and 72% color-space coverage (NTSC)
- Full HD (1920x1080) with touch function, 300 cd/m², and 45% color-space coverage (NTSC)
| |||||||||||||||||||||||||
Brightness Distribution: 94 %
Center on Battery: 347 cd/m²
Contrast: 2500:1 (Black: 0.14 cd/m²)
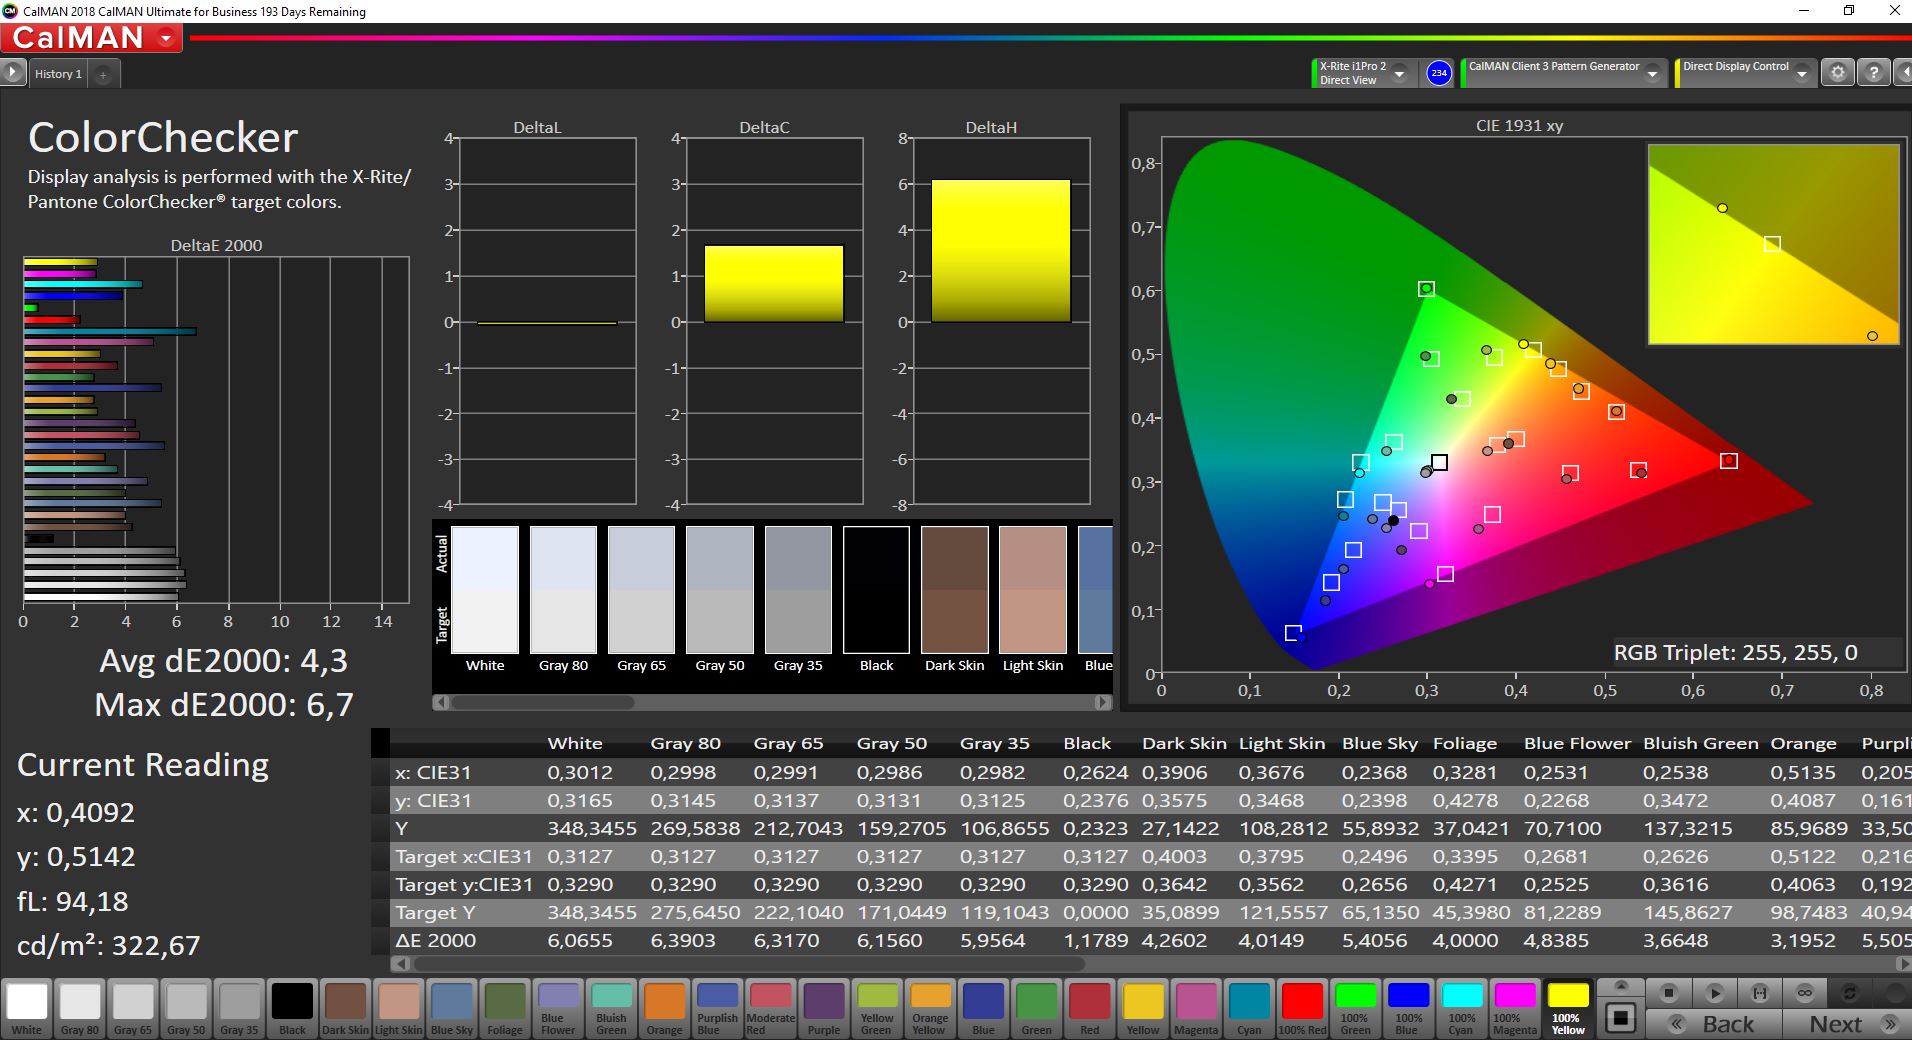
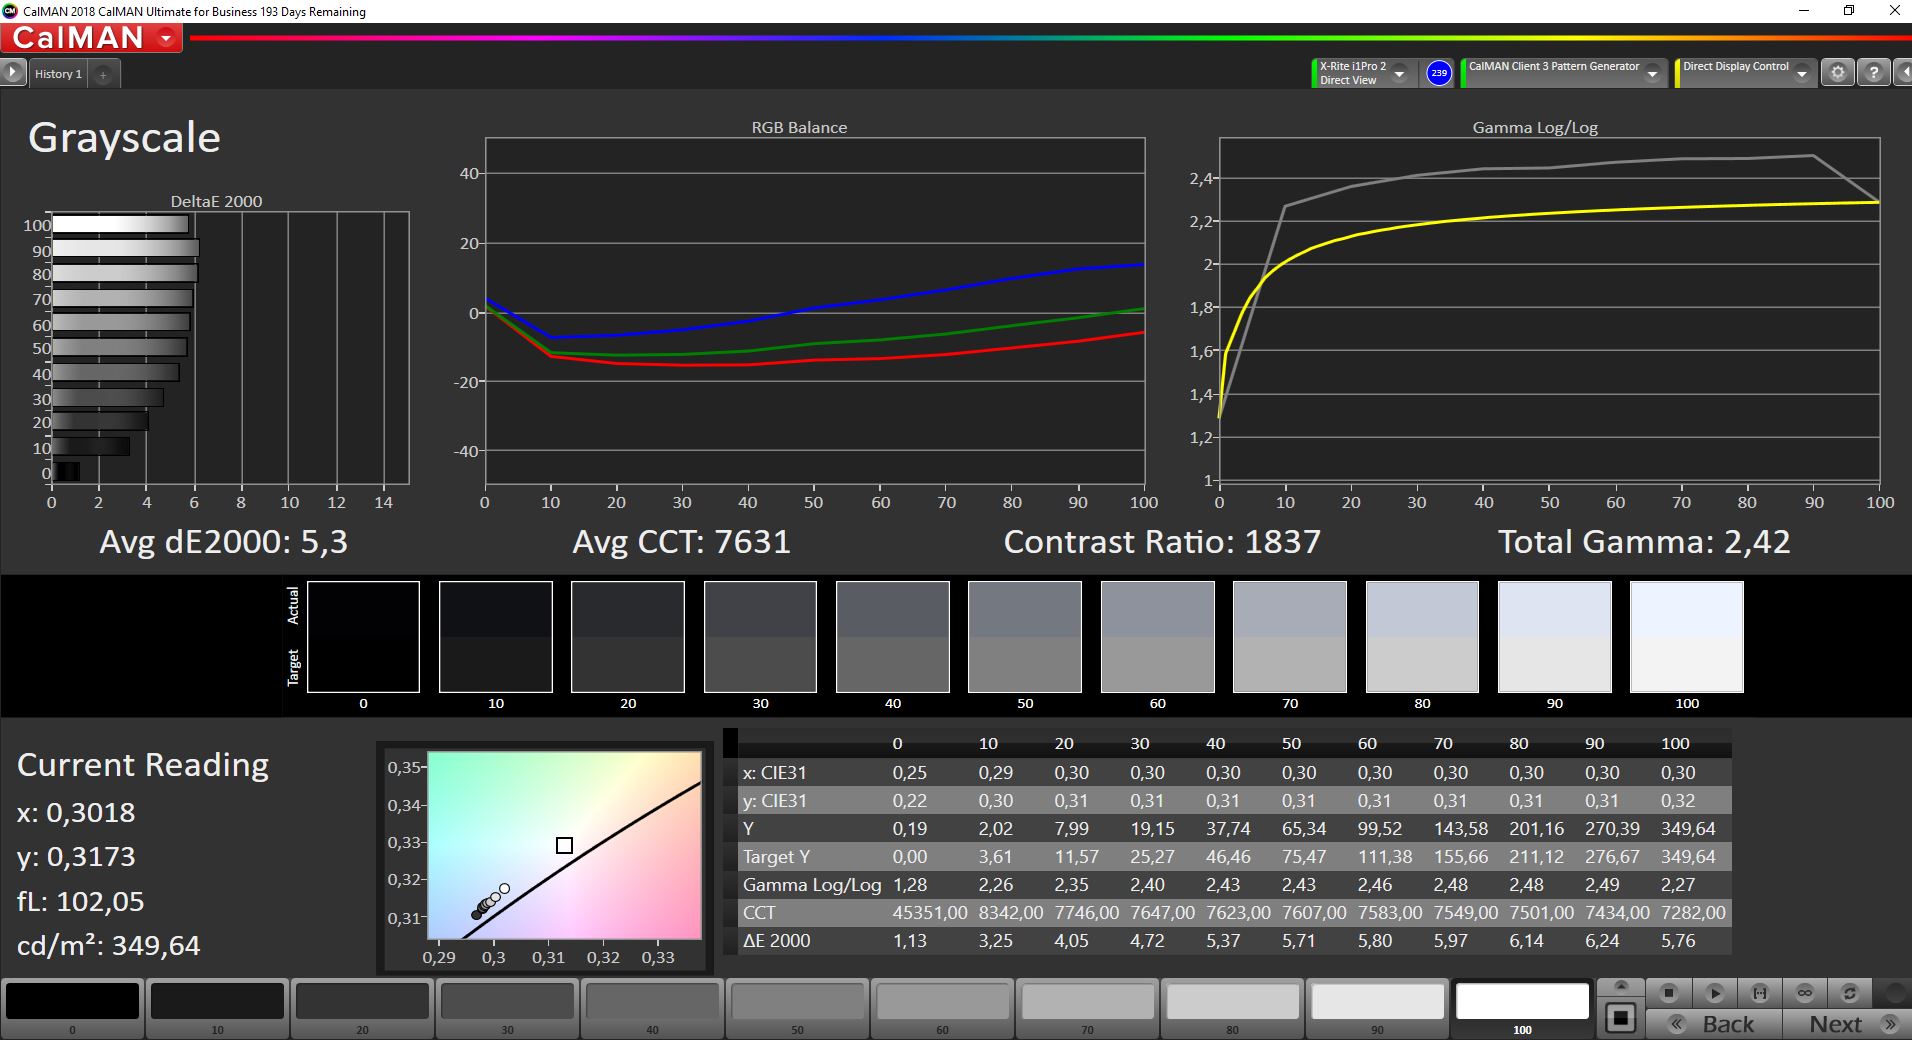
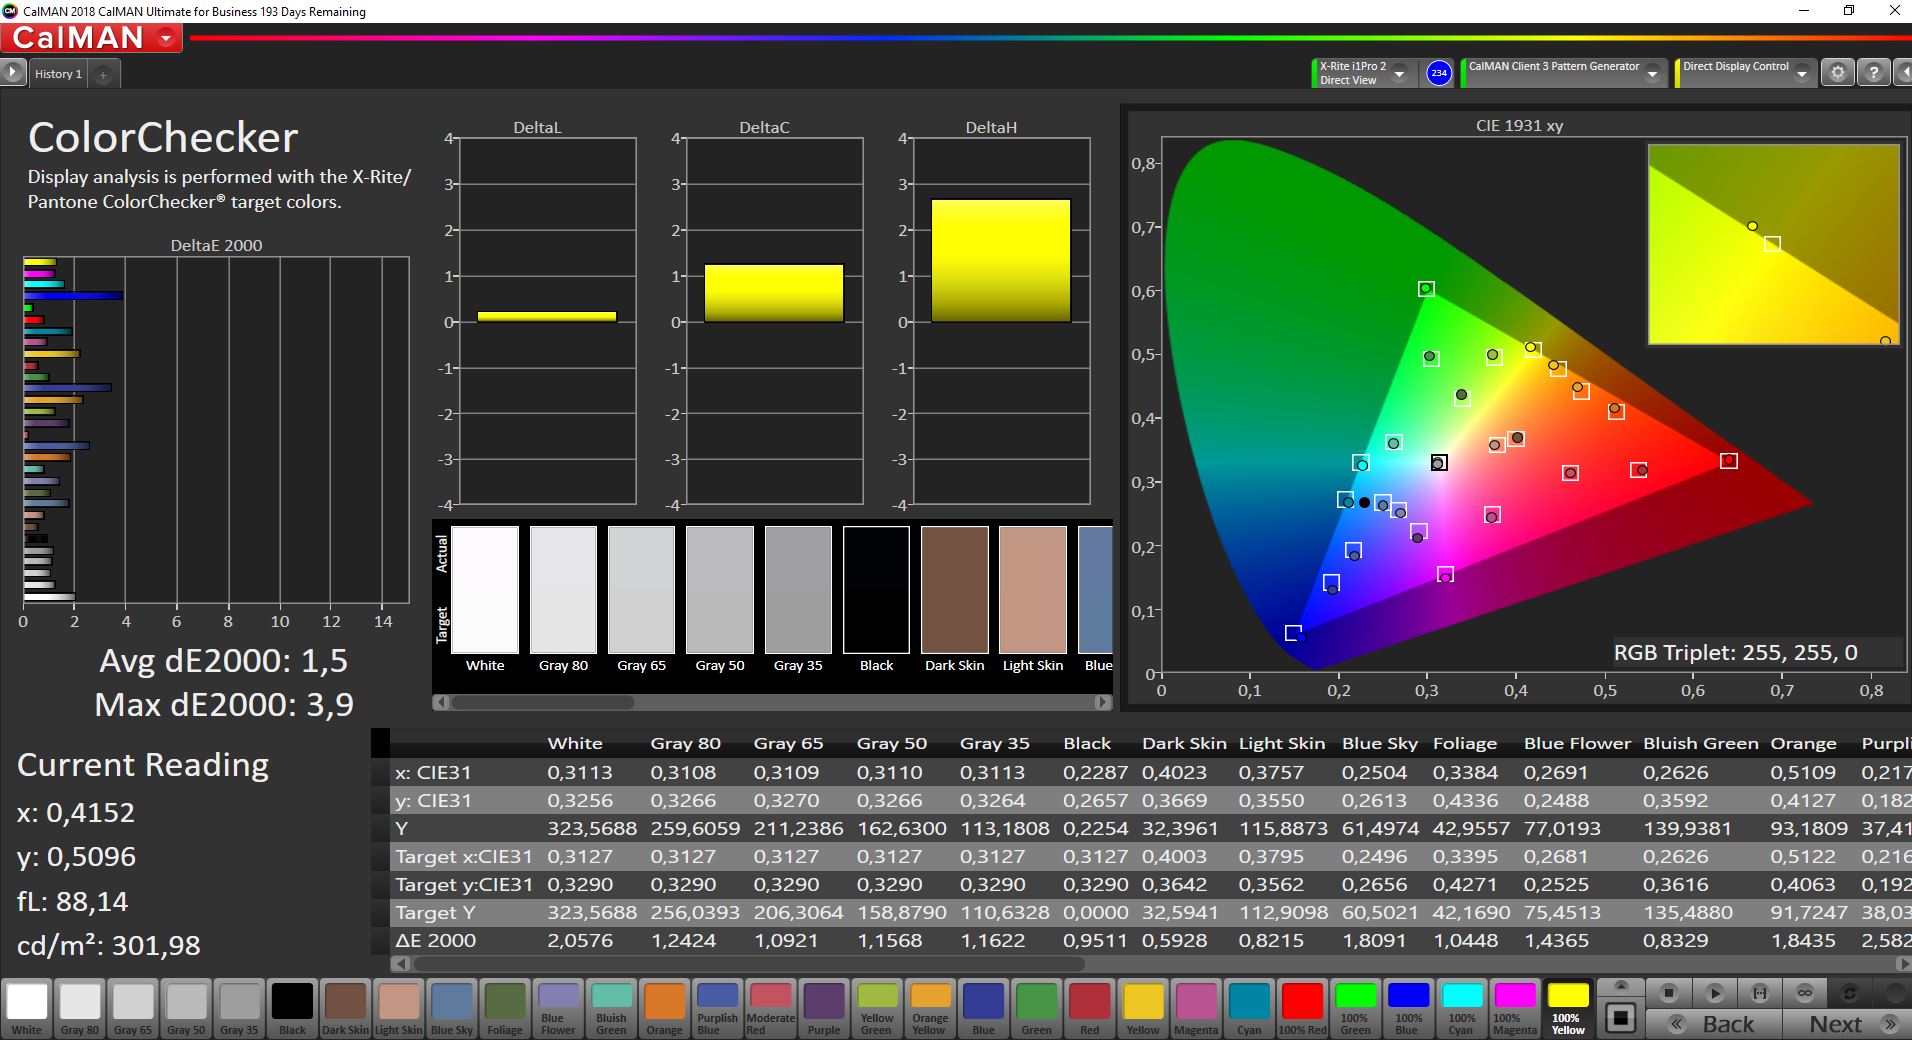
ΔE ColorChecker Calman: 4.3 | ∀{0.5-29.43 Ø4.77}
calibrated: 1.5
ΔE Greyscale Calman: 5.3 | ∀{0.09-98 Ø5}
96.4% sRGB (Argyll 1.6.3 3D)
61.1% AdobeRGB 1998 (Argyll 1.6.3 3D)
66.5% AdobeRGB 1998 (Argyll 3D)
96.6% sRGB (Argyll 3D)
65.4% Display P3 (Argyll 3D)
Gamma: 2.42
CCT: 7631 K
| Lenovo ThinkPad P14s Gen2-20VX000GGE B140HAN05.7, IPS, 1920x1080, 14" | HP ZBook Firefly 14 G8 2C9Q2EA AU Optronics AUO068B, IPS, 1920x1080, 14" | Lenovo ThinkPad P14s Gen1-20Y10002GE N140HCR-GL2, a-Si IPS LED, 1920x1080, 14" | Lenovo ThinkPad P14s Gen1 20S40009GE B140HAN05.7, LTPS IPS LED, 1920x1080, 14" | MSI Prestige 14 Evo A11M-005 AUO B140HAN06.2 (AUO623D), IPS-Level, 1920x1080, 14" | |
|---|---|---|---|---|---|
| Display | 6% | 3% | 0% | 5% | |
| Display P3 Coverage (%) | 65.4 | 70 7% | 67.3 3% | 65.5 0% | 68.8 5% |
| sRGB Coverage (%) | 96.6 | 99.5 3% | 98.5 2% | 96.6 0% | 99.4 3% |
| AdobeRGB 1998 Coverage (%) | 66.5 | 71.4 7% | 69.4 4% | 66.7 0% | 70.9 7% |
| Response Times | 1% | 31% | 1% | -1% | |
| Response Time Grey 50% / Grey 80% * (ms) | 58.8 ? | 64.4 ? -10% | 38.4 ? 35% | 64 ? -9% | 59.6 ? -1% |
| Response Time Black / White * (ms) | 32.8 ? | 29.2 ? 11% | 24 ? 27% | 29.6 ? 10% | 32.8 ? -0% |
| PWM Frequency (Hz) | |||||
| Screen | 6% | 8% | -2% | 1% | |
| Brightness middle (cd/m²) | 350 | 461 32% | 430 23% | 386 10% | 293 -16% |
| Brightness (cd/m²) | 348 | 439 26% | 432 24% | 379 9% | 277 -20% |
| Brightness Distribution (%) | 94 | 89 -5% | 88 -6% | 88 -6% | 89 -5% |
| Black Level * (cd/m²) | 0.14 | 0.24 -71% | 0.27 -93% | 0.19 -36% | 0.18 -29% |
| Contrast (:1) | 2500 | 1921 -23% | 1593 -36% | 2032 -19% | 1628 -35% |
| Colorchecker dE 2000 * | 4.3 | 2.6 40% | 2.2 49% | 4.4 -2% | 2.95 31% |
| Colorchecker dE 2000 max. * | 6.7 | 5.8 13% | 4.4 34% | 7.2 -7% | 6.03 10% |
| Colorchecker dE 2000 calibrated * | 1.5 | 1.1 27% | 0.7 53% | 1.2 20% | 0.9 40% |
| Greyscale dE 2000 * | 5.3 | 4.4 17% | 3.3 38% | 5.1 4% | 4.2 21% |
| Gamma | 2.42 91% | 2.29 96% | 2.21 100% | 2.5 88% | 2.099 105% |
| CCT | 7631 85% | 6478 100% | 6056 107% | 7464 87% | 6622 98% |
| Color Space (Percent of AdobeRGB 1998) (%) | 61.1 | 65.2 7% | 63 3% | 61.2 0% | 71 16% |
| Color Space (Percent of sRGB) (%) | 96.4 | 99.4 3% | 98.5 2% | 96.4 0% | 93 -4% |
| Total Average (Program / Settings) | 4% /
5% | 14% /
10% | -0% /
-2% | 2% /
1% |
* ... smaller is better
Display Response Times
| ↔ Response Time Black to White | ||
|---|---|---|
| 32.8 ms ... rise ↗ and fall ↘ combined | ↗ 16.8 ms rise | 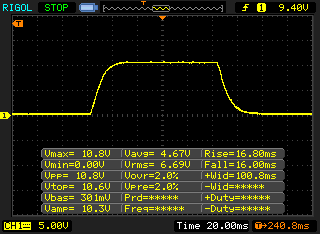 |
| ↘ 16 ms fall | ||
| The screen shows slow response rates in our tests and will be unsatisfactory for gamers. In comparison, all tested devices range from 0.1 (minimum) to 240 (maximum) ms. » 88 % of all devices are better. This means that the measured response time is worse than the average of all tested devices (20.2 ms). | ||
| ↔ Response Time 50% Grey to 80% Grey | ||
| 58.8 ms ... rise ↗ and fall ↘ combined | ↗ 28.4 ms rise | 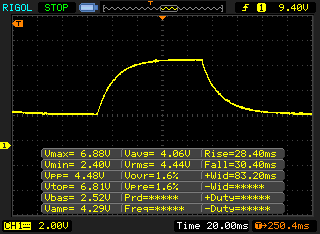 |
| ↘ 30.4 ms fall | ||
| The screen shows slow response rates in our tests and will be unsatisfactory for gamers. In comparison, all tested devices range from 0.165 (minimum) to 636 (maximum) ms. » 95 % of all devices are better. This means that the measured response time is worse than the average of all tested devices (31.6 ms). | ||
Screen Flickering / PWM (Pulse-Width Modulation)
| Screen flickering / PWM not detected | 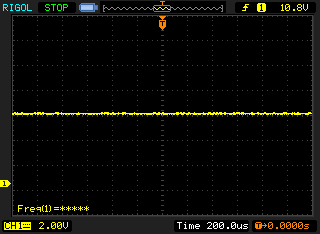 | ||
In comparison: 53 % of all tested devices do not use PWM to dim the display. If PWM was detected, an average of 8084 (minimum: 5 - maximum: 343500) Hz was measured. | |||
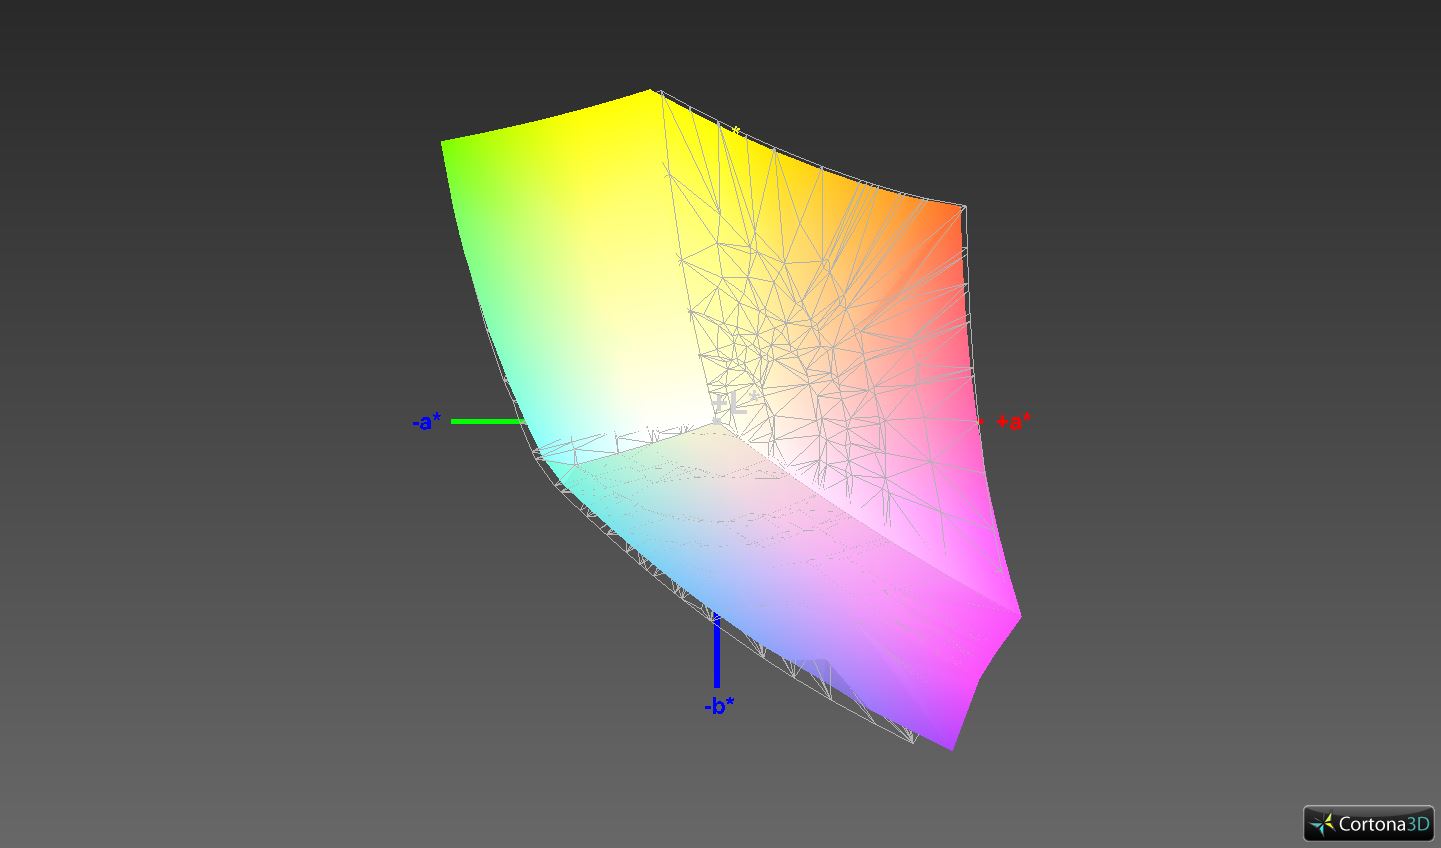
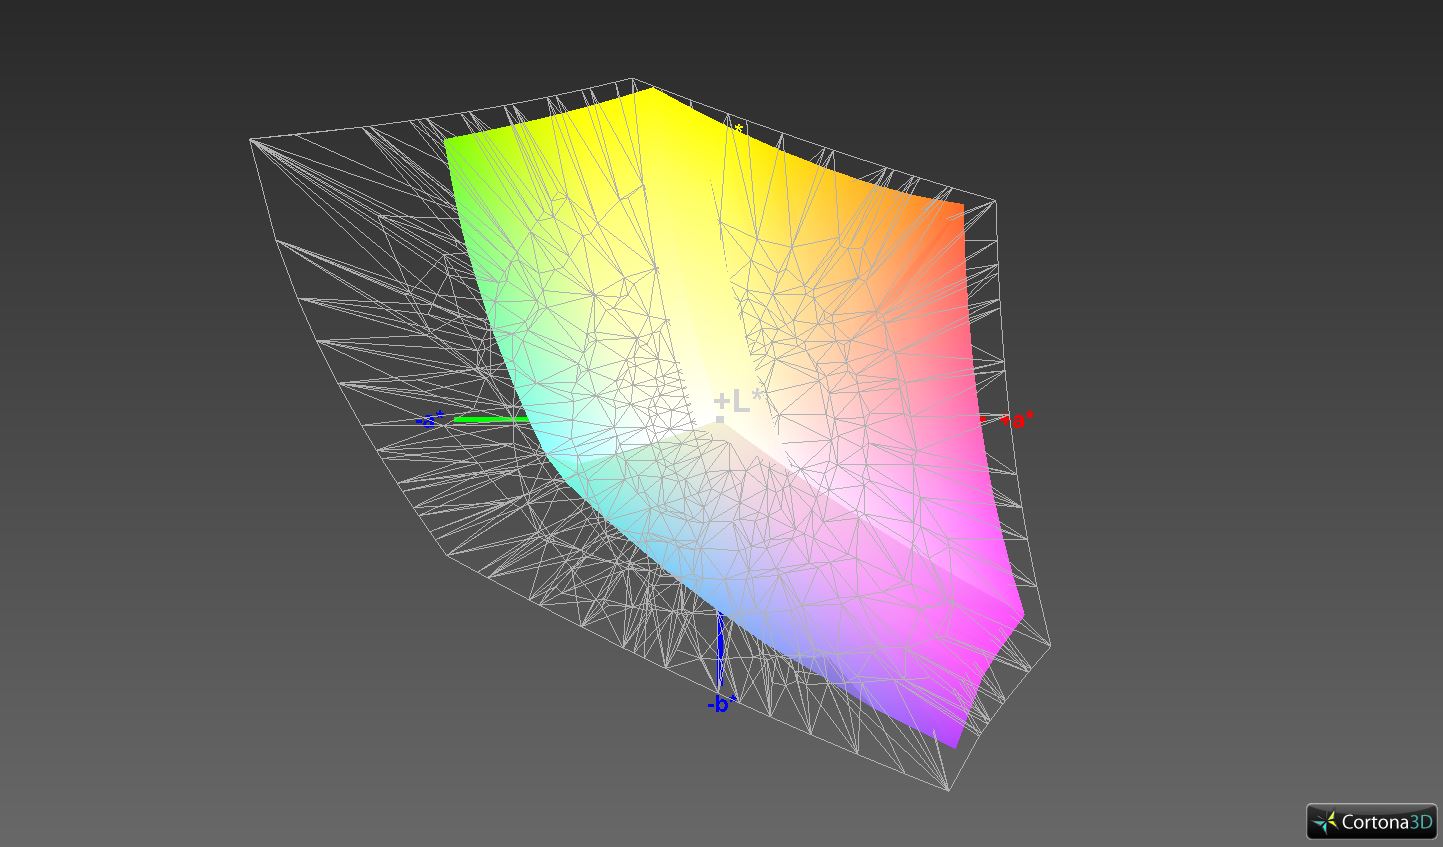
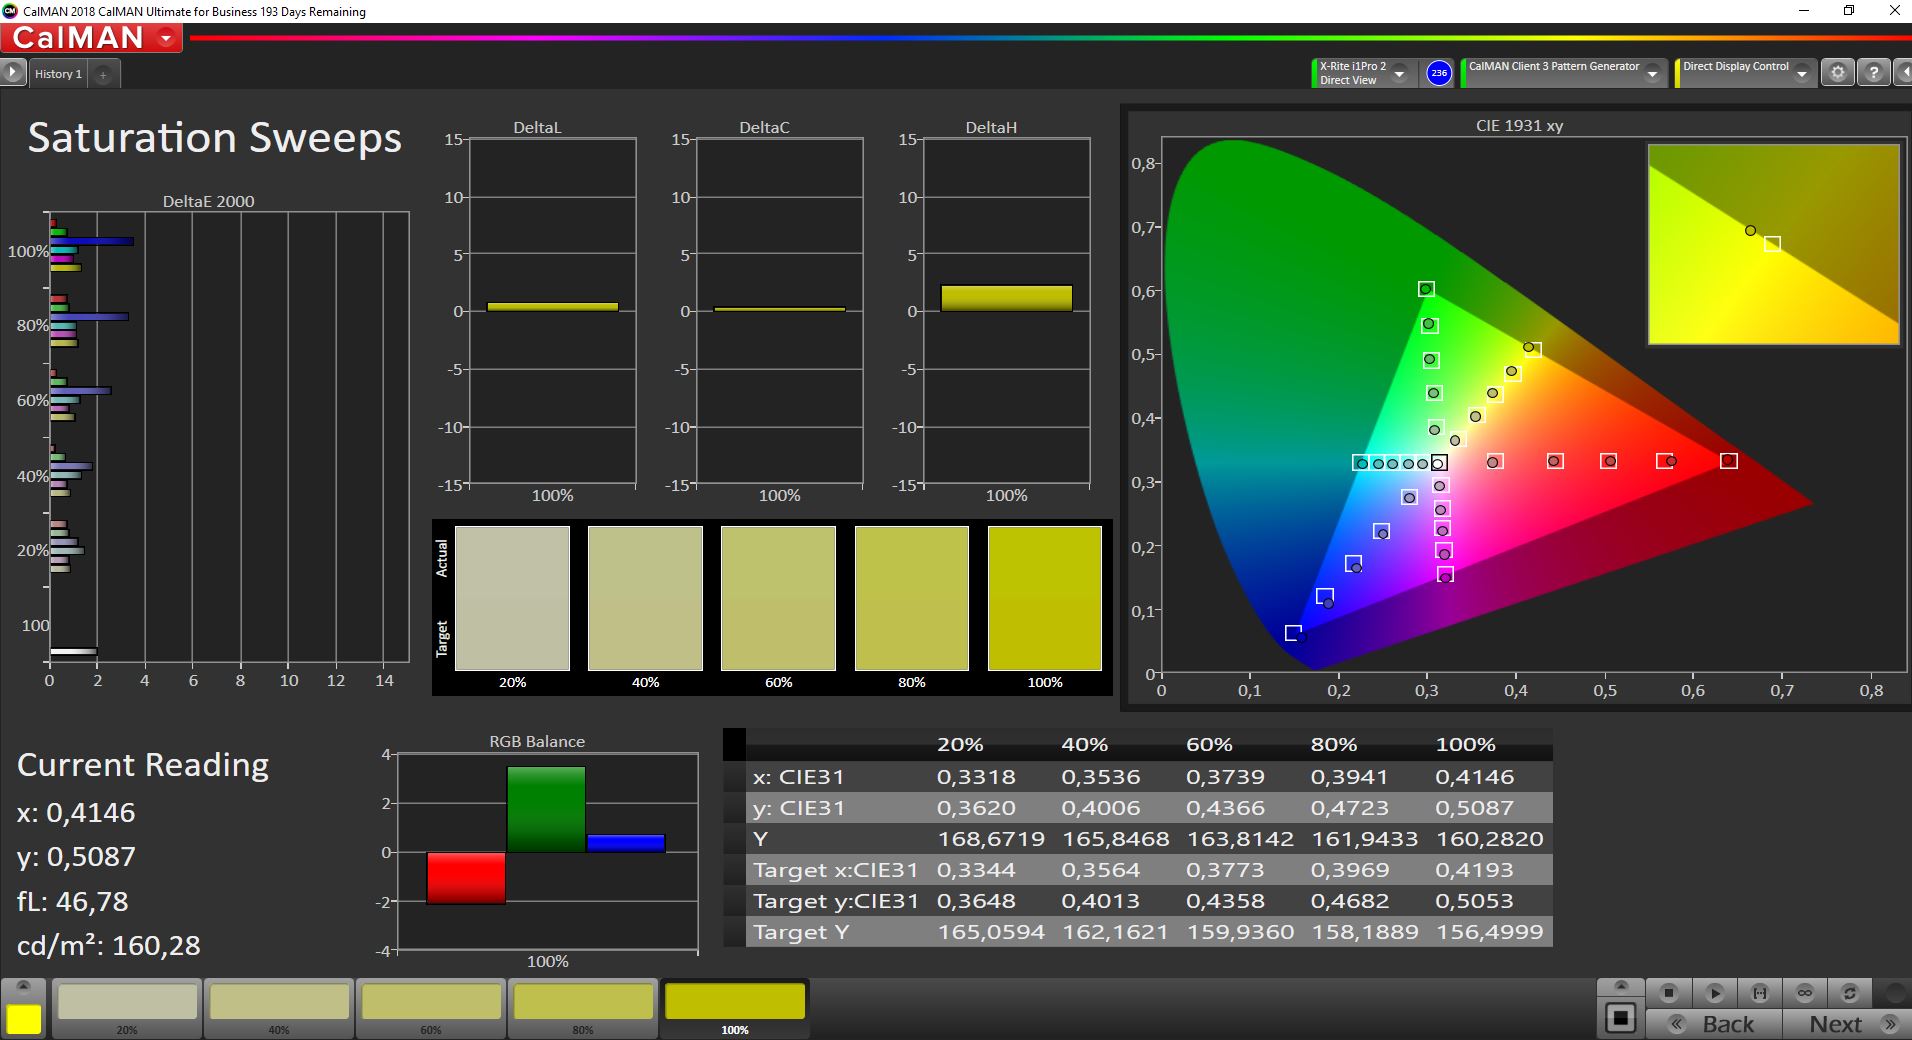
Our measurements show that the IPS panel installed here has a very good contrast ratio of 2,500:1 and an equally very good black level of 0.14 cd/m². The color-space coverage of 96% (sRGB) and 61% (AdobeRGB) is on par with the competition.
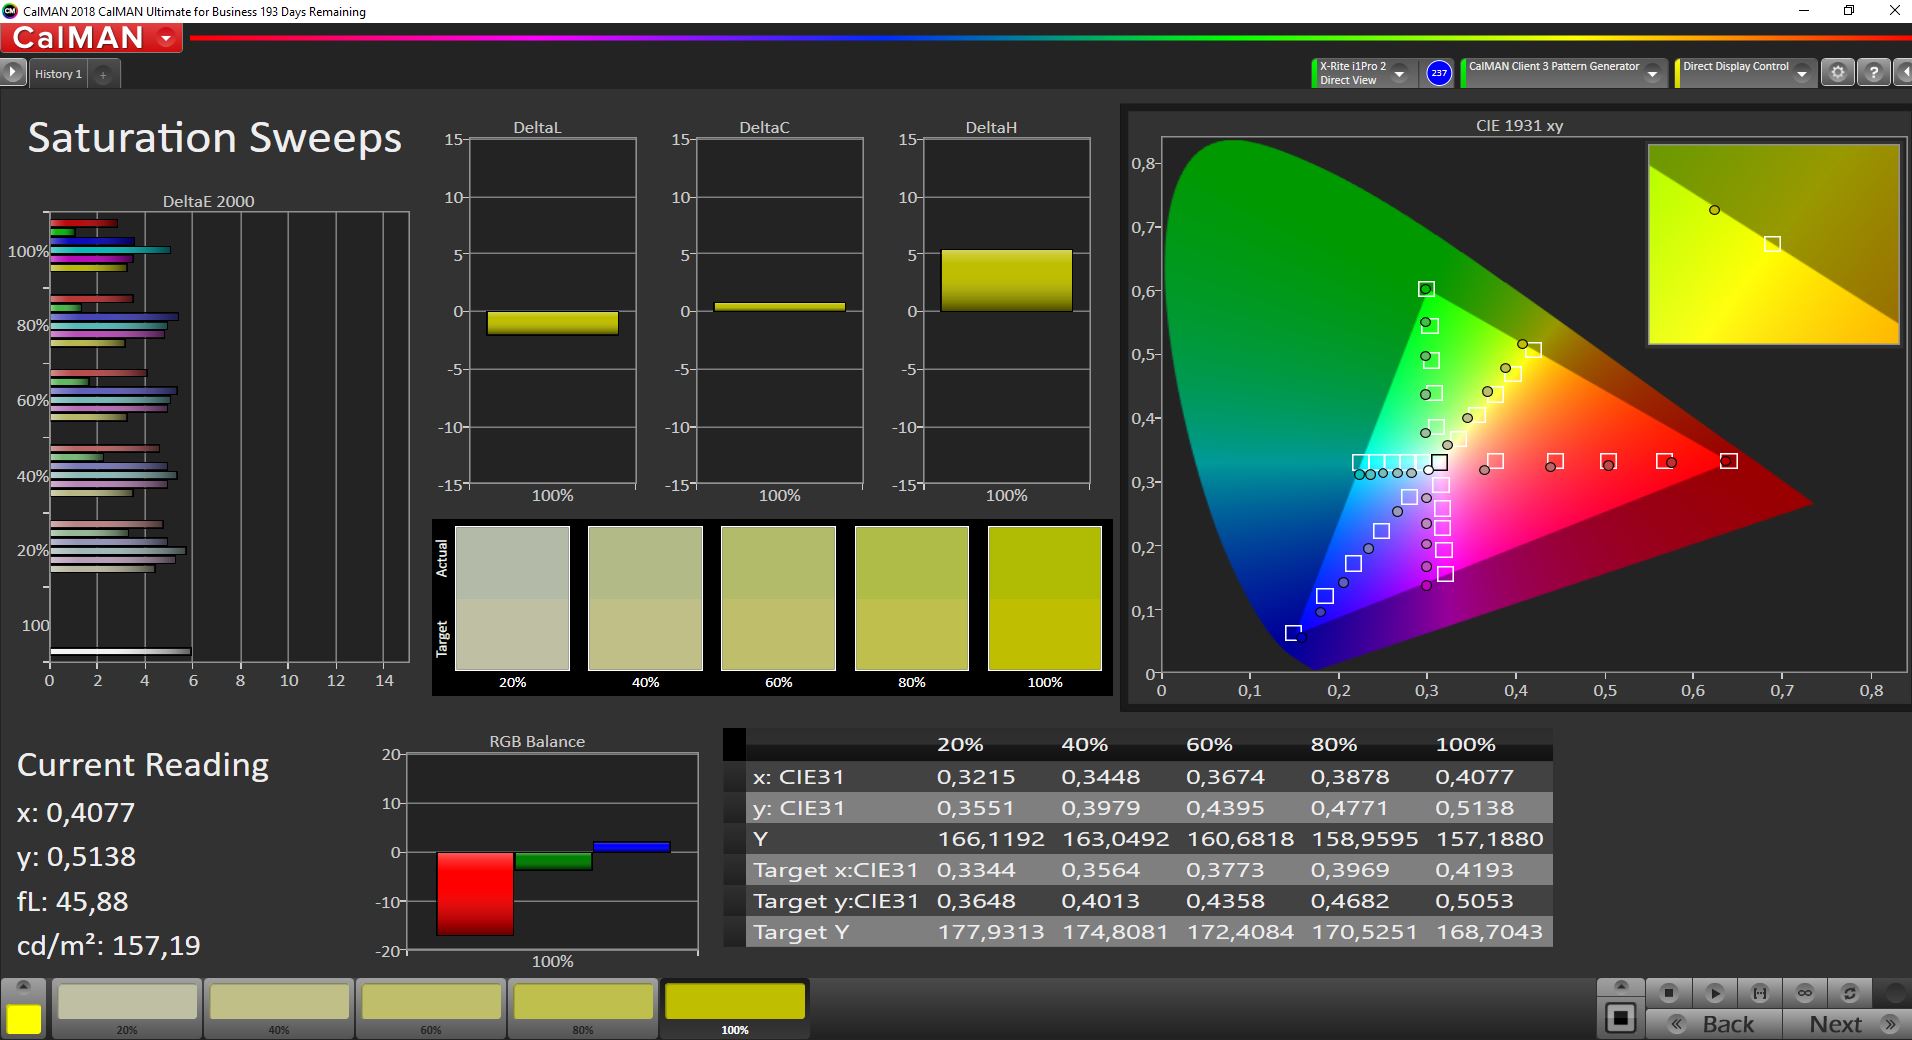
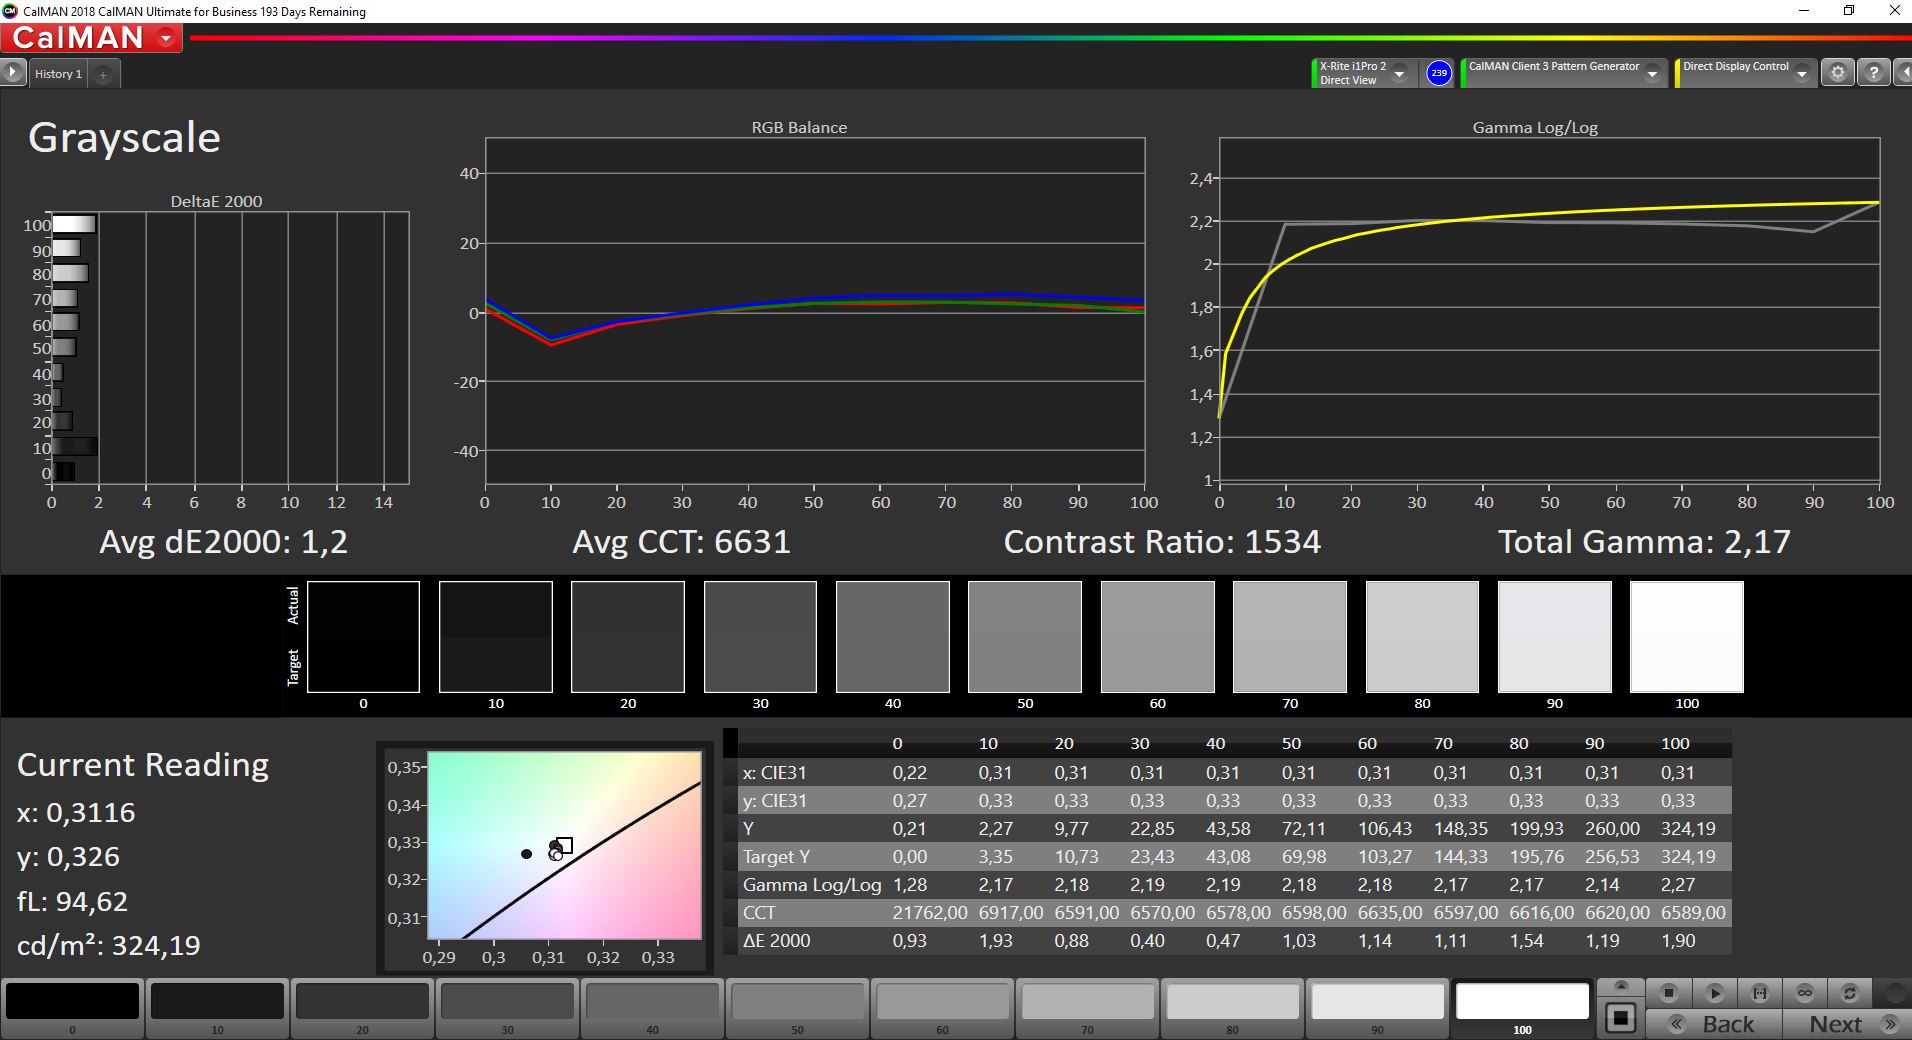
The CalMAN analysis also shows that the display reproduces colors out of the box with a blue proportion that is too high and a Delta E 2000 deviation of 5.3. This can be compensated for with a calibration, and the Delta E 2000 value can be reduced to 1.2. The corresponding ICC file can be downloaded in the window located at the top, to the right of the display's brightness distribution graph.
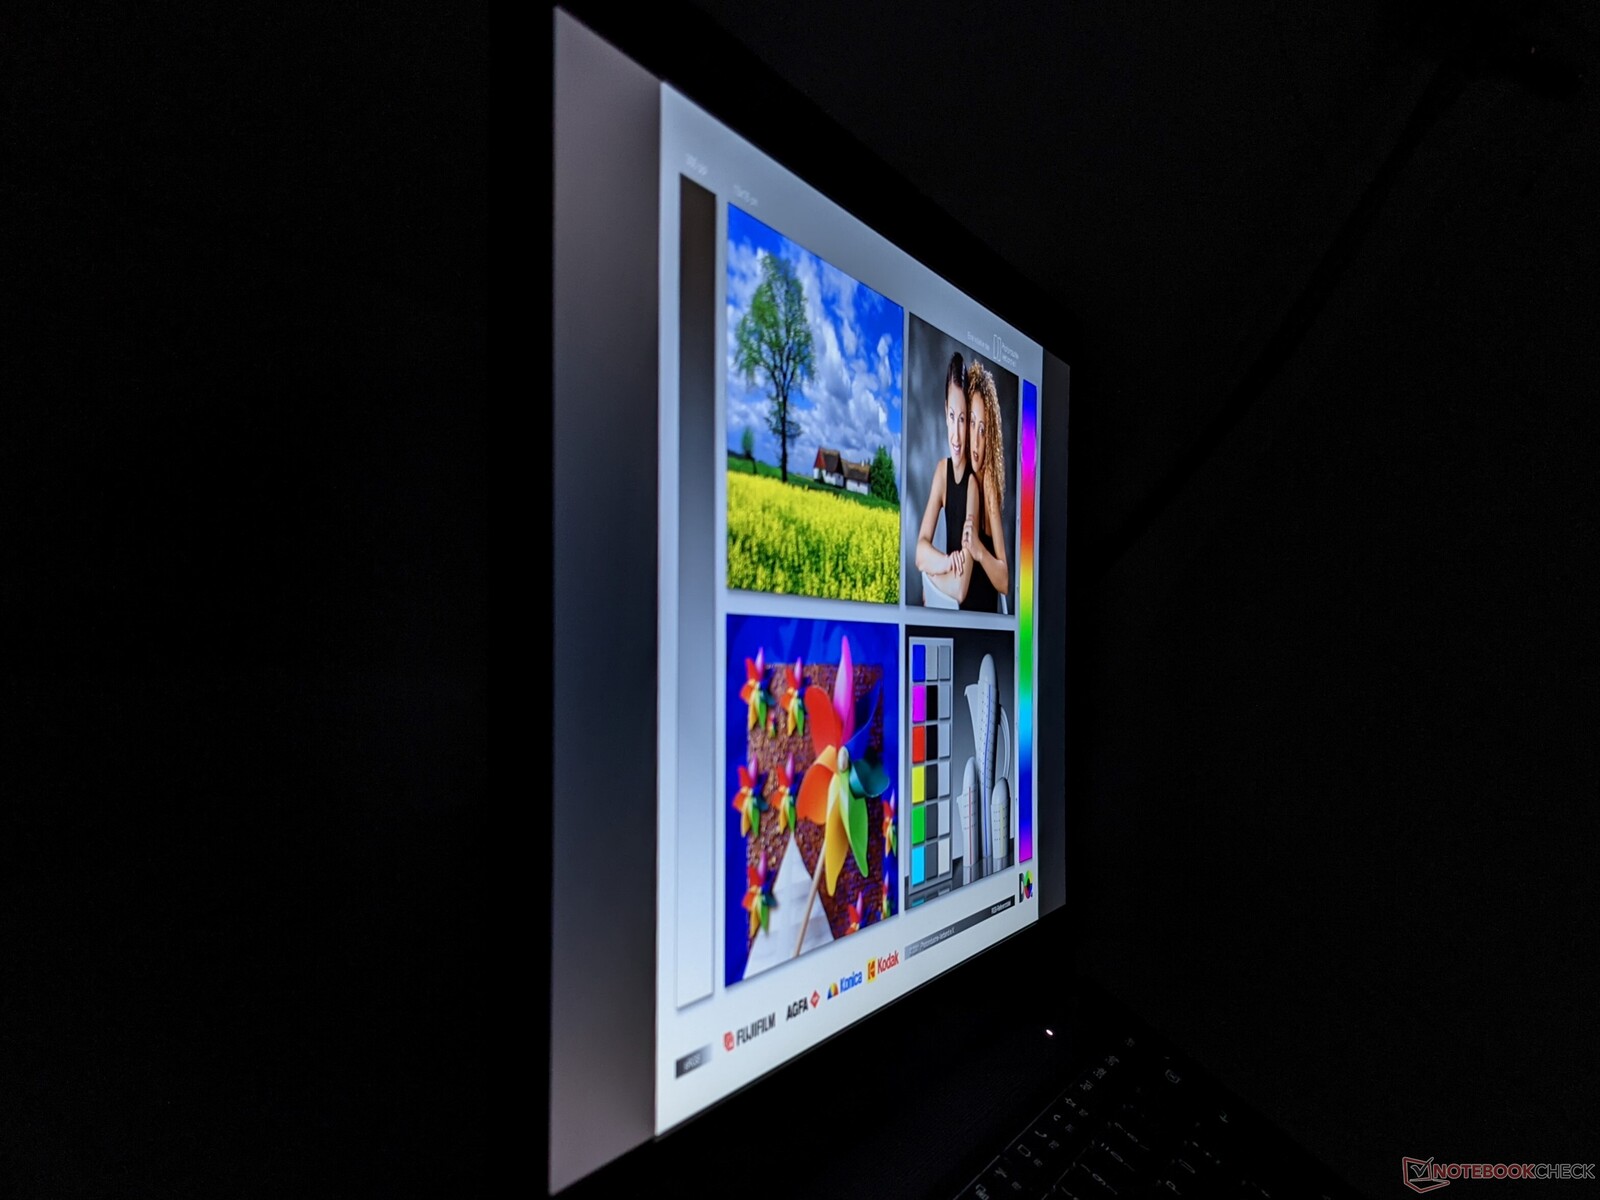
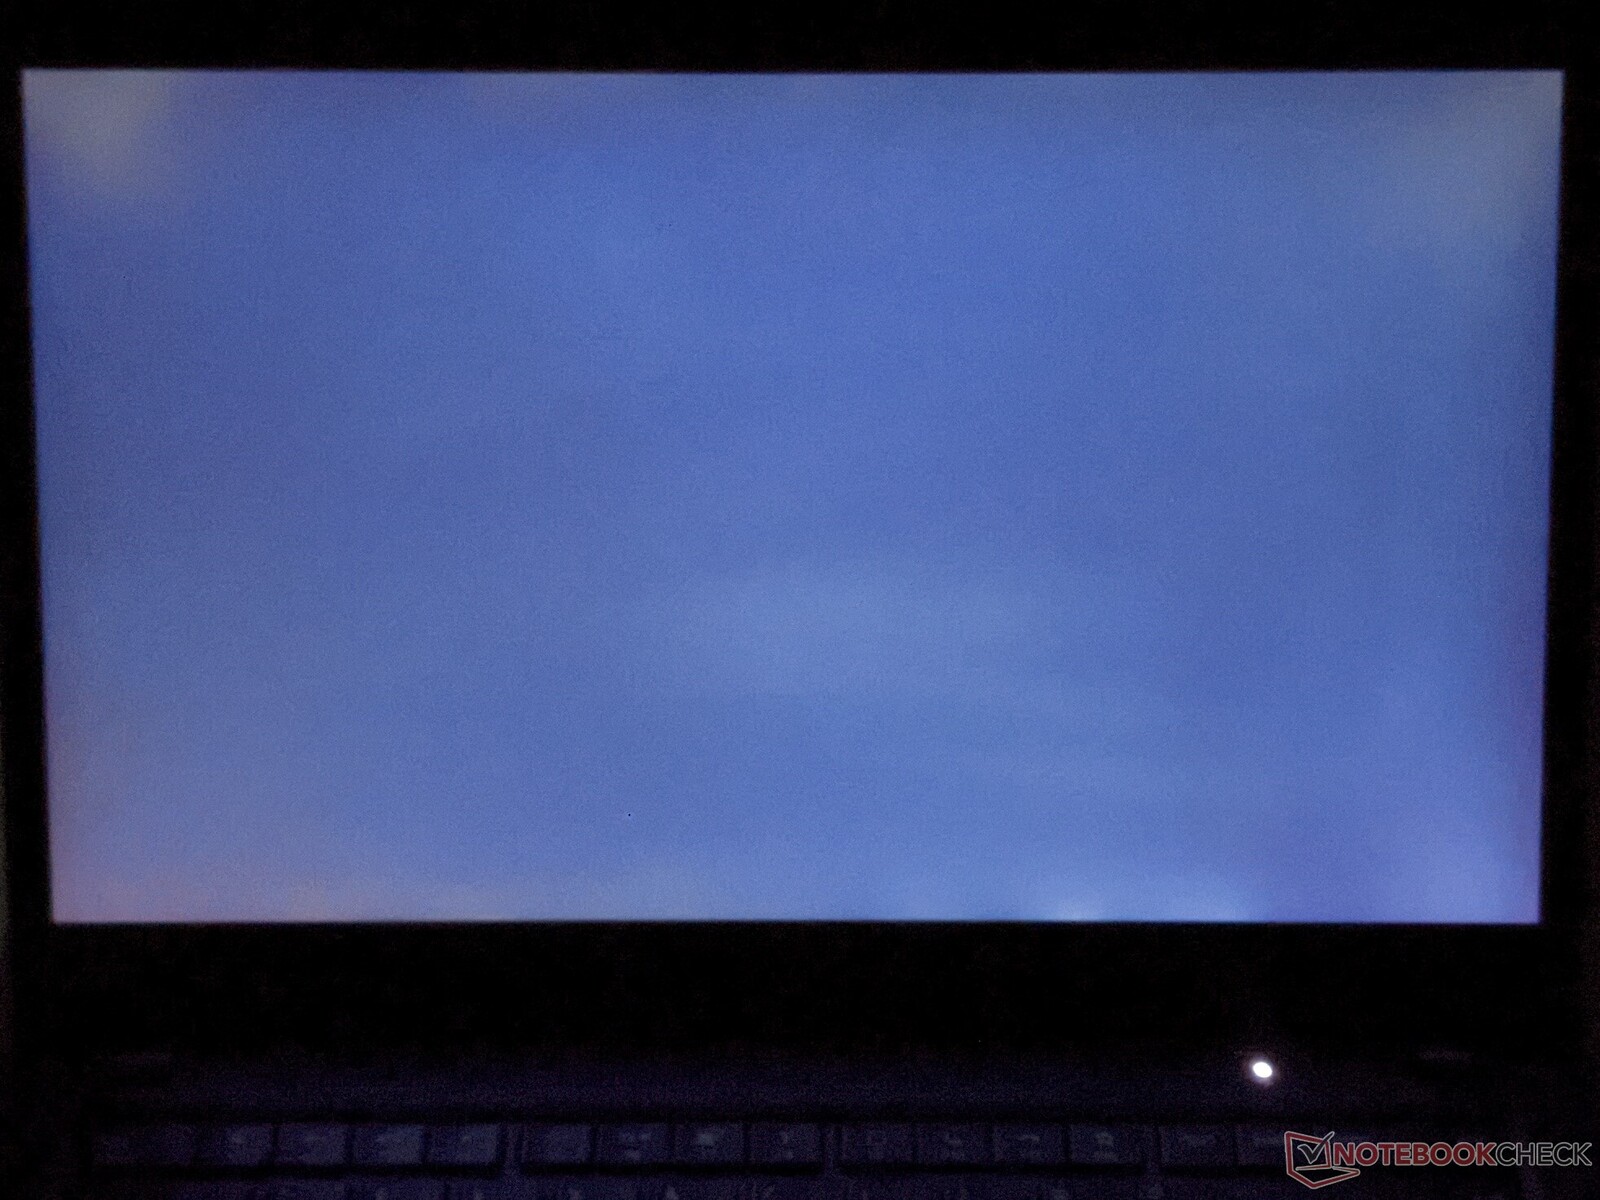
Furthermore, the IPS panel is very viewing-angle stable, but outdoors, brightness is only sufficient for working in places in the shade.
Performance - ThinkPad with improved GPU performance
The Lenovo ThinkPad P14s Gen 2 is an entry-level workstation that still features a dedicated graphics card in the form of an Nvidia Quadro T500. You can also choose between different storage and memory configurations as well as between a selection of Intel Tiger Lake CPUs. Besides the Intel Core i7-1185G7 used here, the P14s Gen 2 can be configured with the Core i5-1135G7, Core i5-1145G7, and Core i7-1165G7.
Processor
The Intel Core i7-1185G7 is a quad-core processor that can process up to eight tasks simultaneously. The clock rates are between 3 and 4.8 GHz, and the actual performance also depends on the configured TDP. The latter is generously specified at 35 watts (PL1) and 64 watts (PL2), but the cooling system needs to be able to handle it as well.
Our Cinebench R15 continuous load test shows that this can only be done through a wavelike progression, and only the performance of the i7-1185G7 in the MSI Prestige 14 EVO is reached occasionally. In the individual disciplines, the result is overall enough for a place in the midfield, although strong fluctuations can be seen here. In addition, the AMD Ryzen 7 PRO 4750U found in the P14s Gen 1 is significantly ahead in terms of multi-core performance.
Cinebench R20: CPU (Single Core) | CPU (Multi Core)
Cinebench R15: CPU Single 64Bit | CPU Multi 64Bit
Blender: v2.79 BMW27 CPU
7-Zip 18.03: 7z b 4 -mmt1 | 7z b 4
Geekbench 5.5: Single-Core | Multi-Core
HWBOT x265 Benchmark v2.2: 4k Preset
LibreOffice : 20 Documents To PDF
R Benchmark 2.5: Overall mean
| Cinebench R23 / Single Core | |
| Average of class Workstation (1712 - 2206, n=25, last 2 years) | |
| Lenovo ThinkPad P14s Gen2-20VX000GGE | |
| Average Intel Core i7-1185G7 (1251 - 1532, n=24) | |
| Lenovo ThinkPad P14s Gen1 20S40009GE | |
| Lenovo ThinkPad P14s Gen1-20Y10002GE | |
| Cinebench R23 / Multi Core | |
| Average of class Workstation (14055 - 38520, n=25, last 2 years) | |
| Lenovo ThinkPad P14s Gen1-20Y10002GE | |
| Lenovo ThinkPad P14s Gen2-20VX000GGE | |
| Average Intel Core i7-1185G7 (3610 - 6383, n=24) | |
| Lenovo ThinkPad P14s Gen1 20S40009GE | |
| Cinebench R20 / CPU (Single Core) | |
| Average of class Workstation (671 - 849, n=25, last 2 years) | |
| HP ZBook Firefly 14 G8 2C9Q2EA | |
| MSI Prestige 14 Evo A11M-005 | |
| Average Intel Core i7-1185G7 (489 - 593, n=28) | |
| Lenovo ThinkPad P14s Gen2-20VX000GGE | |
| Lenovo ThinkPad P14s Gen1-20Y10002GE | |
| Lenovo ThinkPad P14s Gen1 20S40009GE | |
| Cinebench R20 / CPU (Multi Core) | |
| Average of class Workstation (5471 - 15043, n=25, last 2 years) | |
| Lenovo ThinkPad P14s Gen1-20Y10002GE | |
| MSI Prestige 14 Evo A11M-005 | |
| Lenovo ThinkPad P14s Gen2-20VX000GGE | |
| Average Intel Core i7-1185G7 (1425 - 2493, n=28) | |
| HP ZBook Firefly 14 G8 2C9Q2EA | |
| Lenovo ThinkPad P14s Gen1 20S40009GE | |
| Cinebench R15 / CPU Single 64Bit | |
| Average of class Workstation (191.4 - 328, n=25, last 2 years) | |
| HP ZBook Firefly 14 G8 2C9Q2EA | |
| MSI Prestige 14 Evo A11M-005 | |
| Average Intel Core i7-1185G7 (168 - 230, n=27) | |
| Lenovo ThinkPad P14s Gen2-20VX000GGE | |
| Lenovo ThinkPad P14s Gen1 20S40009GE | |
| Lenovo ThinkPad P14s Gen1-20Y10002GE | |
| Cinebench R15 / CPU Multi 64Bit | |
| Average of class Workstation (2404 - 5810, n=25, last 2 years) | |
| Lenovo ThinkPad P14s Gen1-20Y10002GE | |
| MSI Prestige 14 Evo A11M-005 | |
| Lenovo ThinkPad P14s Gen2-20VX000GGE | |
| Average Intel Core i7-1185G7 (617 - 1066, n=32) | |
| HP ZBook Firefly 14 G8 2C9Q2EA | |
| Lenovo ThinkPad P14s Gen1 20S40009GE | |
| Blender / v2.79 BMW27 CPU | |
| Lenovo ThinkPad P14s Gen1 20S40009GE | |
| Lenovo ThinkPad P14s Gen2-20VX000GGE | |
| Average Intel Core i7-1185G7 (478 - 745, n=28) | |
| HP ZBook Firefly 14 G8 2C9Q2EA | |
| MSI Prestige 14 Evo A11M-005 | |
| Lenovo ThinkPad P14s Gen1-20Y10002GE | |
| Average of class Workstation (91 - 261, n=25, last 2 years) | |
| 7-Zip 18.03 / 7z b 4 -mmt1 | |
| Average of class Workstation (4981 - 6960, n=25, last 2 years) | |
| Lenovo ThinkPad P14s Gen2-20VX000GGE | |
| HP ZBook Firefly 14 G8 2C9Q2EA | |
| Average Intel Core i7-1185G7 (3678 - 5507, n=27) | |
| MSI Prestige 14 Evo A11M-005 | |
| Lenovo ThinkPad P14s Gen1 20S40009GE | |
| Lenovo ThinkPad P14s Gen1-20Y10002GE | |
| 7-Zip 18.03 / 7z b 4 | |
| Average of class Workstation (53407 - 116969, n=25, last 2 years) | |
| Lenovo ThinkPad P14s Gen1-20Y10002GE | |
| MSI Prestige 14 Evo A11M-005 | |
| Average Intel Core i7-1185G7 (18812 - 27693, n=27) | |
| HP ZBook Firefly 14 G8 2C9Q2EA | |
| Lenovo ThinkPad P14s Gen2-20VX000GGE | |
| Lenovo ThinkPad P14s Gen1 20S40009GE | |
| Geekbench 5.5 / Single-Core | |
| Average of class Workstation (1759 - 2183, n=25, last 2 years) | |
| Lenovo ThinkPad P14s Gen2-20VX000GGE | |
| HP ZBook Firefly 14 G8 2C9Q2EA | |
| Average Intel Core i7-1185G7 (1398 - 1626, n=21) | |
| MSI Prestige 14 Evo A11M-005 | |
| Lenovo ThinkPad P14s Gen1 20S40009GE | |
| Lenovo ThinkPad P14s Gen1-20Y10002GE | |
| Geekbench 5.5 / Multi-Core | |
| Average of class Workstation (11542 - 25554, n=25, last 2 years) | |
| Lenovo ThinkPad P14s Gen1-20Y10002GE | |
| Lenovo ThinkPad P14s Gen2-20VX000GGE | |
| MSI Prestige 14 Evo A11M-005 | |
| Average Intel Core i7-1185G7 (4620 - 5944, n=21) | |
| HP ZBook Firefly 14 G8 2C9Q2EA | |
| Lenovo ThinkPad P14s Gen1 20S40009GE | |
| HWBOT x265 Benchmark v2.2 / 4k Preset | |
| Average of class Workstation (14.4 - 40.5, n=25, last 2 years) | |
| Lenovo ThinkPad P14s Gen1-20Y10002GE | |
| Lenovo ThinkPad P14s Gen2-20VX000GGE | |
| MSI Prestige 14 Evo A11M-005 | |
| HP ZBook Firefly 14 G8 2C9Q2EA | |
| Average Intel Core i7-1185G7 (5.02 - 8.13, n=27) | |
| Lenovo ThinkPad P14s Gen1 20S40009GE | |
| LibreOffice / 20 Documents To PDF | |
| Lenovo ThinkPad P14s Gen1-20Y10002GE | |
| Lenovo ThinkPad P14s Gen1 20S40009GE | |
| MSI Prestige 14 Evo A11M-005 | |
| HP ZBook Firefly 14 G8 2C9Q2EA | |
| Average Intel Core i7-1185G7 (41.3 - 61.7, n=26) | |
| Average of class Workstation (37.1 - 74.7, n=25, last 2 years) | |
| Lenovo ThinkPad P14s Gen2-20VX000GGE | |
| R Benchmark 2.5 / Overall mean | |
| Lenovo ThinkPad P14s Gen1 20S40009GE | |
| Lenovo ThinkPad P14s Gen1-20Y10002GE | |
| MSI Prestige 14 Evo A11M-005 | |
| Average Intel Core i7-1185G7 (0.55 - 0.615, n=27) | |
| HP ZBook Firefly 14 G8 2C9Q2EA | |
| Lenovo ThinkPad P14s Gen2-20VX000GGE | |
| Average of class Workstation (0.3825 - 0.603, n=25, last 2 years) | |
* ... smaller is better
System performance
In the PCMark 10 test for evaluating system performance, the P14s Gen 2 scores at the top of our test field. Only in the "Essentials" single discipline does the MSI Prestige 14 EVO score slightly better. The system runs very smoothly in everyday use, and there is no micro stuttering or the like.
The performance that can be expected from other laptops is available in our CPU Benchmarks article.
| PCMark 10 Score | 5634 points | |
Help | ||
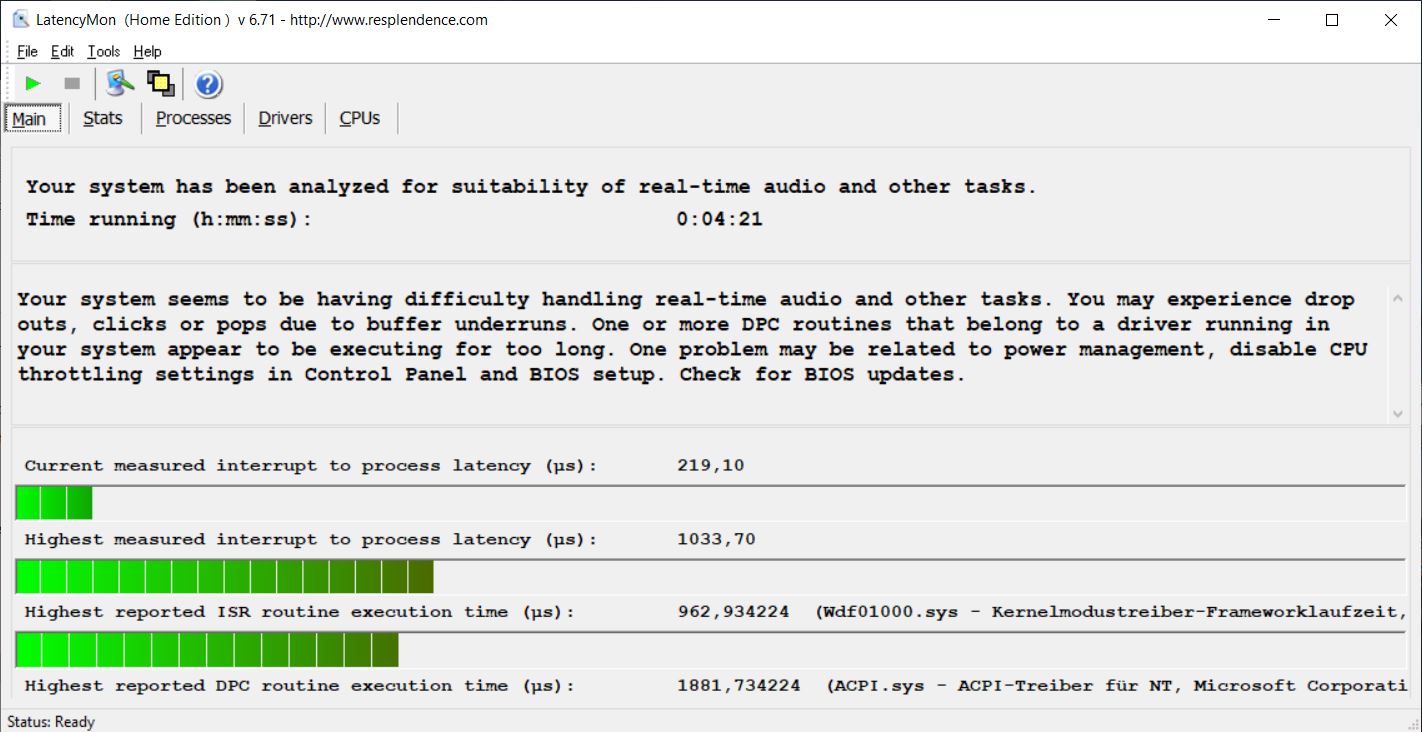
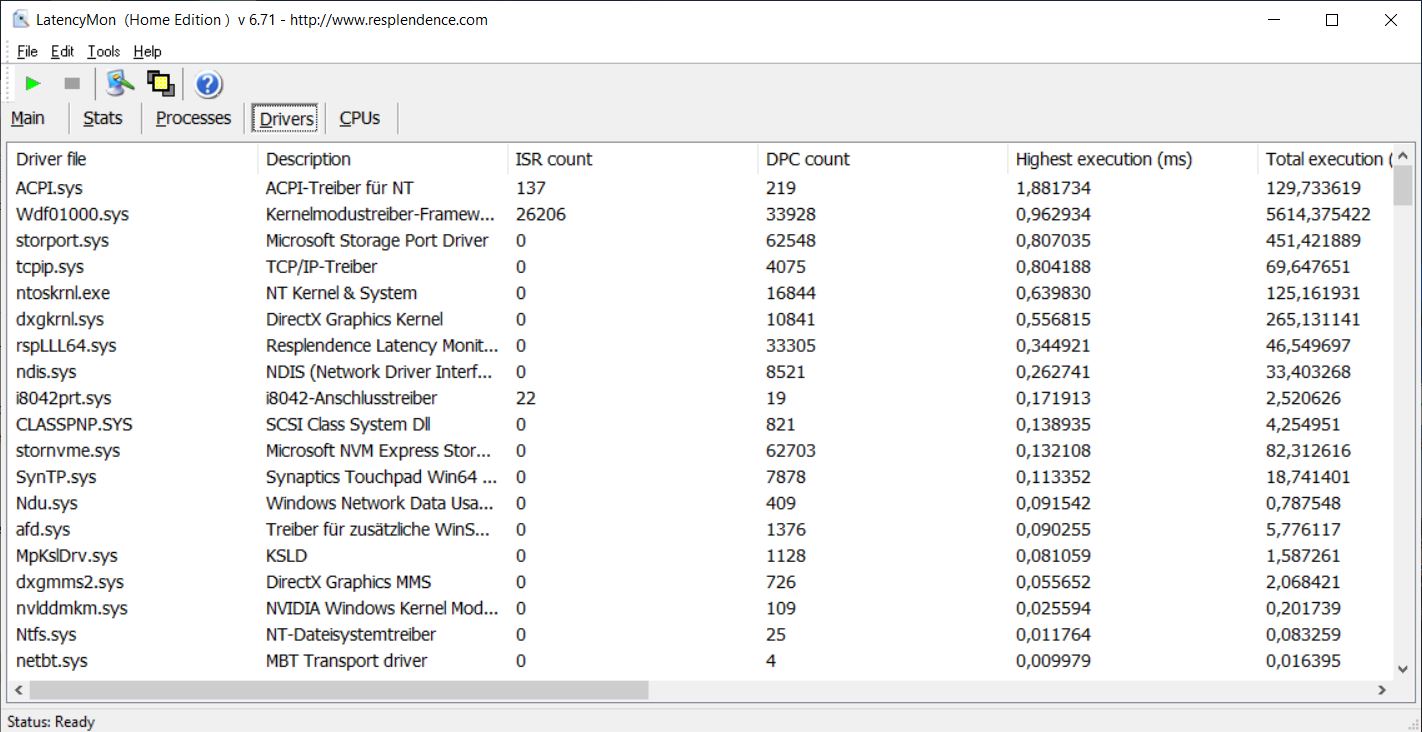
DPC latencies
In the test with LatencyMon, the ThinkPad P14s Gen 2 only shows slightly increased interruption times and is consequently suitable for real-time applications to a limited extent.
| DPC Latencies / LatencyMon - interrupt to process latency (max), Web, Youtube, Prime95 | |
| Lenovo ThinkPad P14s Gen1 20S40009GE | |
| HP ZBook Firefly 14 G8 2C9Q2EA | |
| Lenovo ThinkPad P14s Gen2-20VX000GGE | |
| Lenovo ThinkPad P14s Gen1-20Y10002GE | |
| MSI Prestige 14 Evo A11M-005 | |
* ... smaller is better
Storage
The built-in SSD from Toshiba achieves very good read and write speeds in the storage benchmarks. As a result, it shares the top of our test field with the MSI Prestige 14 EVO once again.
How other mass storage devices were able to perform in comparison can be found in our HDD/SSD Benchmarks article.
| Lenovo ThinkPad P14s Gen2-20VX000GGE Toshiba XG6 KXG6AZNV1T02 | HP ZBook Firefly 14 G8 2C9Q2EA Toshiba XG6 KXG60ZNV1T02 | Lenovo ThinkPad P14s Gen1-20Y10002GE Samsung PM981a MZVLB1T0HBLR | MSI Prestige 14 Evo A11M-005 Phison 512GB SM280512GKBB4S-E162 | Average Toshiba XG6 KXG6AZNV1T02 | Average of class Workstation | |
|---|---|---|---|---|---|---|
| CrystalDiskMark 5.2 / 6 | -15% | -19% | 8% | -13% | 52% | |
| Write 4K (MB/s) | 215.5 | 132.4 -39% | 86.3 -60% | 248.4 15% | 162.2 ? -25% | 159.1 ? -26% |
| Read 4K (MB/s) | 60.8 | 52.6 -13% | 47.66 -22% | 56.4 -7% | 54.8 ? -10% | 67.7 ? 11% |
| Write Seq (MB/s) | 1988 | 1827 -8% | 2030 2% | 2513 26% | 1745 ? -12% | 4055 ? 104% |
| Read Seq (MB/s) | 1903 | 2255 18% | 2345 23% | 2250 18% | 1941 ? 2% | 4317 ? 127% |
| Write 4K Q32T1 (MB/s) | 666 | 429 -36% | 379.7 -43% | 589 -12% | 493 ? -26% | 474 ? -29% |
| Read 4K Q32T1 (MB/s) | 745 | 446.7 -40% | 289 -61% | 696 -7% | 542 ? -27% | 576 ? -23% |
| Write Seq Q32T1 (MB/s) | 3057 | 3074 1% | 2982 -2% | 2515 -18% | 2961 ? -3% | 6161 ? 102% |
| Read Seq Q32T1 (MB/s) | 3281 | 3283 0% | 3567 9% | 4915 50% | 3190 ? -3% | 8263 ? 152% |
| AS SSD | -25% | -16% | -4% | -17% | 18% | |
| Seq Read (MB/s) | 2632 | 2674 2% | 2579 -2% | 3760 43% | 2545 ? -3% | 5792 ? 120% |
| Seq Write (MB/s) | 2394 | 1289 -46% | 1456 -39% | 2335 -2% | 1730 ? -28% | 3921 ? 64% |
| 4K Read (MB/s) | 57 | 49.52 -13% | 50.9 -11% | 66.8 17% | 51.3 ? -10% | 63.1 ? 11% |
| 4K Write (MB/s) | 198.4 | 128 -35% | 115.7 -42% | 184.3 -7% | 149.7 ? -25% | 183.5 ? -8% |
| 4K-64 Read (MB/s) | 1476 | 1113 -25% | 858 -42% | 1801 22% | 1283 ? -13% | 1165 ? -21% |
| 4K-64 Write (MB/s) | 1460 | 1470 1% | 2152 47% | 1754 20% | 1411 ? -3% | 2749 ? 88% |
| Access Time Read * (ms) | 0.044 | 0.072 -64% | 0.053 -20% | 0.135 -207% | 0.06 ? -36% | 0.05664 ? -29% |
| Access Time Write * (ms) | 0.021 | 0.032 -52% | 0.032 -52% | 0.018 14% | 0.02875 ? -37% | 0.04876 ? -132% |
| Score Read (Points) | 1796 | 1430 -20% | 1166 -35% | 2244 25% | 1589 ? -12% | 1804 ? 0% |
| Score Write (Points) | 1897 | 1727 -9% | 2414 27% | 2172 14% | 1734 ? -9% | 3324 ? 75% |
| Score Total (Points) | 4608 | 3827 -17% | 4132 -10% | 5500 19% | 4103 ? -11% | 5972 ? 30% |
| Total Average (Program / Settings) | -20% /
-21% | -18% /
-18% | 2% /
1% | -15% /
-15% | 35% /
32% |
* ... smaller is better

Continuous load read: DiskSpd Read Loop, Queue Depth 8
Graphics card
In the benchmarks, the Nvidia Quadro T500 used here is able to outperform the Nvidia Quadro P520 in the P14s with an Intel CPU and the AMD Radeon RX Vega 8 in the P14s with an AMD CPU. However, it scores a bit worse compared to the Quadro T500 in the HP ZBook Firefly 14 G8, and it's even occasionally beaten by the internal Xe Graphics G7 in the MSI Prestige 14. In comparison with the normal GeForce chips, the Quadro T500 is comparable with the MX450.
Our GPU Benchmarks article shows the performance that can be expected from other graphics cards.
| 3DMark 11 Performance | 8212 points | |
| 3DMark Cloud Gate Standard Score | 16513 points | |
| 3DMark Fire Strike Score | 3600 points | |
| 3DMark Time Spy Score | 1821 points | |
Help | ||
Gaming performance
The Nvidia Quadro T500 can run older games smoothly as well as games with moderate graphics performance requirements. However, depending on the title, the level of detail might have to be reduced in Full HD resolution. Once again, the graphics unit's performance is below the results that the HP ZBook Firefly 14 G8 with the Quadro T500 could achieve.
Our GPU Games article shows the expected gaming performance in other titles.
| The Witcher 3 - 1920x1080 High Graphics & Postprocessing (Nvidia HairWorks Off) | |
| Average of class Workstation (53.4 - 259, n=6, last 2 years) | |
| MSI Prestige 14 Evo A11M-005 | |
| HP ZBook Firefly 14 G8 2C9Q2EA | |
| Average NVIDIA T500 Laptop GPU (27.6 - 31.4, n=3) | |
| Lenovo ThinkPad P14s Gen2-20VX000GGE | |
| GTA V - 1920x1080 High/On (Advanced Graphics Off) AA:2xMSAA + FX AF:8x | |
| Average of class Workstation (44.4 - 179.4, n=21, last 2 years) | |
| Average NVIDIA T500 Laptop GPU (41.1 - 42.1, n=2) | |
| Lenovo ThinkPad P14s Gen2-20VX000GGE | |
| MSI Prestige 14 Evo A11M-005 | |
| Final Fantasy XV Benchmark - 1920x1080 High Quality | |
| Average of class Workstation (26.4 - 197.6, n=25, last 2 years) | |
| HP ZBook Firefly 14 G8 2C9Q2EA | |
| Lenovo ThinkPad P14s Gen2-20VX000GGE | |
| Average NVIDIA T500 Laptop GPU (16.5 - 16.7, n=3) | |
| Strange Brigade - 1920x1080 high AA:high AF:8 | |
| Average of class Workstation (61.9 - 440, n=19, last 2 years) | |
| Average NVIDIA T500 Laptop GPU (28.8 - 29.2, n=2) | |
| Lenovo ThinkPad P14s Gen2-20VX000GGE | |
| low | med. | high | ultra | |
|---|---|---|---|---|
| GTA V (2015) | 148 | 118 | 41.1 | 19 |
| The Witcher 3 (2015) | 79.2 | 50 | 27.6 | 17 |
| Dota 2 Reborn (2015) | 146 | 117 | 79.2 | 71.4 |
| Final Fantasy XV Benchmark (2018) | 50.5 | 23.9 | 16.7 | |
| X-Plane 11.11 (2018) | 47.4 | 71.2 | 38.6 | |
| Strange Brigade (2018) | 108 | 33.6 | 28.8 | 24.5 |
Emissions and energy - Better battery life with Tiger Lake than with AMD
Noise emissions
In our test, the fan in the ThinkPad P14s Gen 2 reached volumes of up to 38.9 dB(A) under load. However, Lenovo's workstation can also be operated almost silently in office mode. Furthermore, the fan noise is very uniform, and we weren't able to detect any bothersome background noise.
Noise level
| Idle |
| 24.6 / 24.6 / 24.6 dB(A) |
| Load |
| 38.9 / 38.9 dB(A) |
 | ||
30 dB silent 40 dB(A) audible 50 dB(A) loud |
||
min: | ||
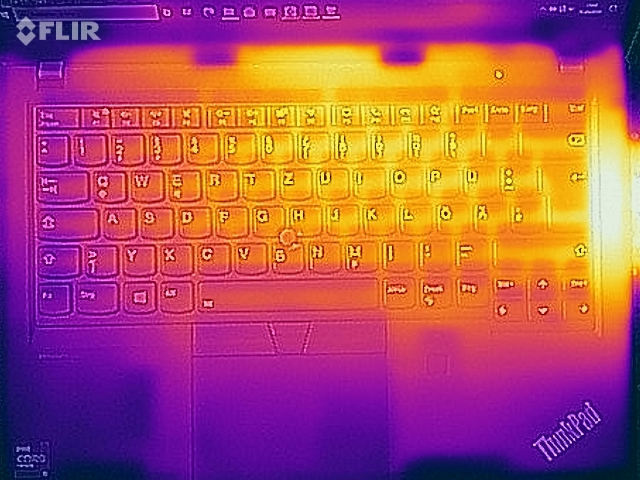
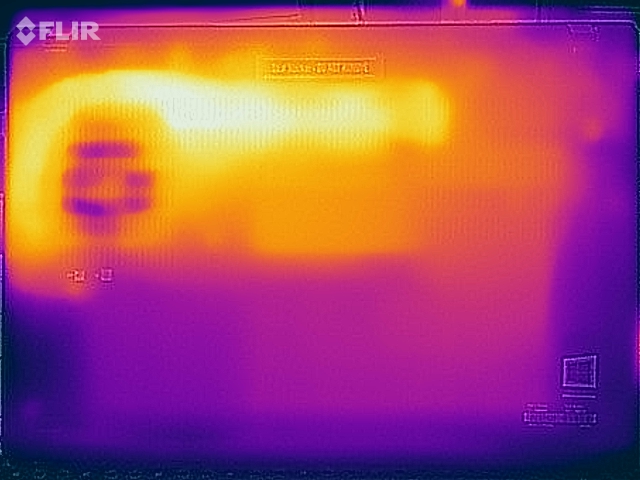
Temperature
According to our measurements, the ThinkPad P14s Gen 2 heats up to 63.7 °C (~147 °F) under load. The warmest point is at the underside's right rear corner, and the palm rests only heat up moderately.
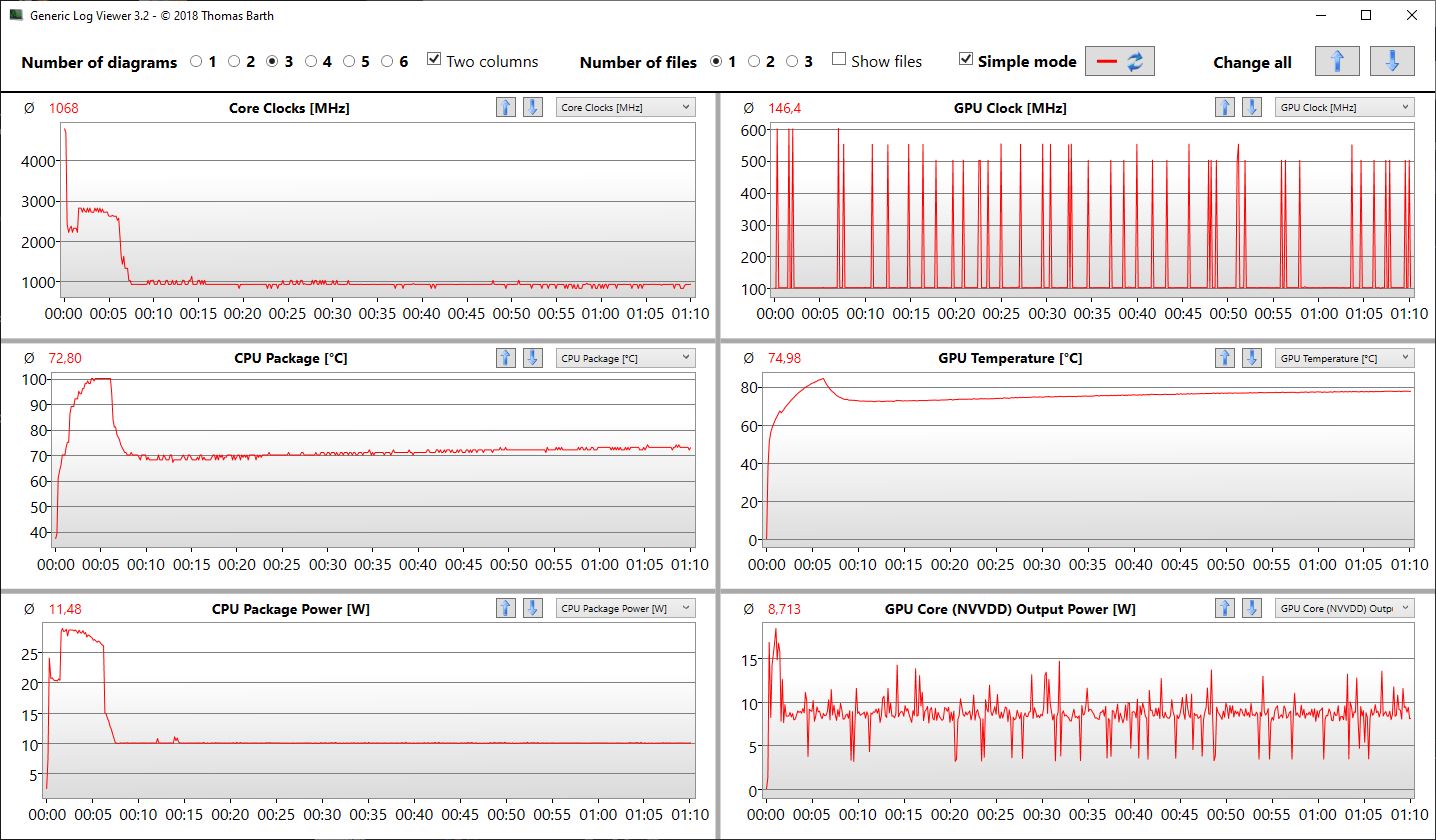
During our approximately one-hour stress test, the internal temperatures briefly rose to up to 98 °C (~208 °F) and could then be maintained by the system at around 70 °C (~158 °F). In the process, the clock rates dropped to about 1 GHz, which is significantly below the base clock speed. Therefore, restrictions due to excessively high temperatures have to be taken into account when the system is under prolonged heavy load.
(-) The maximum temperature on the upper side is 52.4 °C / 126 F, compared to the average of 38.2 °C / 101 F, ranging from 22.2 to 69.8 °C for the class Workstation.
(-) The bottom heats up to a maximum of 63.7 °C / 147 F, compared to the average of 41.1 °C / 106 F
(+) In idle usage, the average temperature for the upper side is 24.1 °C / 75 F, compared to the device average of 32 °C / 90 F.
(-) Playing The Witcher 3, the average temperature for the upper side is 38.8 °C / 102 F, compared to the device average of 32 °C / 90 F.
(+) The palmrests and touchpad are reaching skin temperature as a maximum (35.7 °C / 96.3 F) and are therefore not hot.
(-) The average temperature of the palmrest area of similar devices was 27.8 °C / 82 F (-7.9 °C / -14.3 F).
Speakers
The speakers of the ThinkPad P14s Gen 2 offer medium volume and a fairly broad sound spectrum. This allows for a very good reproduction of media content in quiet environments, but headphones or external speakers are still recommended in the long run.
Lenovo ThinkPad P14s Gen2-20VX000GGE audio analysis
(±) | speaker loudness is average but good (75 dB)
Bass 100 - 315 Hz
(-) | nearly no bass - on average 18.6% lower than median
(±) | linearity of bass is average (10.1% delta to prev. frequency)
Mids 400 - 2000 Hz
(±) | higher mids - on average 6% higher than median
(+) | mids are linear (4.7% delta to prev. frequency)
Highs 2 - 16 kHz
(+) | balanced highs - only 2.3% away from median
(+) | highs are linear (3.7% delta to prev. frequency)
Overall 100 - 16.000 Hz
(±) | linearity of overall sound is average (20.4% difference to median)
Compared to same class
» 72% of all tested devices in this class were better, 5% similar, 23% worse
» The best had a delta of 7%, average was 17%, worst was 35%
Compared to all devices tested
» 53% of all tested devices were better, 8% similar, 39% worse
» The best had a delta of 4%, average was 24%, worst was 134%
HP ZBook Firefly 14 G8 2C9Q2EA audio analysis
(±) | speaker loudness is average but good (80.2 dB)
Bass 100 - 315 Hz
(±) | reduced bass - on average 13.5% lower than median
(±) | linearity of bass is average (10.6% delta to prev. frequency)
Mids 400 - 2000 Hz
(+) | balanced mids - only 4% away from median
(+) | mids are linear (3.2% delta to prev. frequency)
Highs 2 - 16 kHz
(+) | balanced highs - only 3.1% away from median
(+) | highs are linear (3.1% delta to prev. frequency)
Overall 100 - 16.000 Hz
(±) | linearity of overall sound is average (15.2% difference to median)
Compared to same class
» 33% of all tested devices in this class were better, 9% similar, 58% worse
» The best had a delta of 7%, average was 17%, worst was 35%
Compared to all devices tested
» 21% of all tested devices were better, 4% similar, 75% worse
» The best had a delta of 4%, average was 24%, worst was 134%
Energy consumption
Under load, the Lenovo laptop briefly shows a maximum power consumption of 64.7 watts and then settles at around 40 watts. Therefore, the included 65-watt power adapter has a sufficiently high capacity. In idle usage, the average power consumption is slightly higher at 7.1 watts.
| Off / Standby | |
| Idle | |
| Load |
|
Key:
min: | |
Battery life
In our real-world wireless test, the ThinkPad P14s Gen 2 achieves a runtime of just over 9 hours. With that, it considerably outperforms the P14s Gen 1 with AMD CPU. On the other hand, both the Intel version of the P14s Gen 1 and the current HP zBook Firefly 14 G8 managed longer runtimes.
Pros
Cons
Verdict - The Lenovo P14s is still a very mobile companion
The ThinkPad P14s Gen 2 is still a very mobile workstation, and thanks to the new components, it also offers better performance now. Many tasks can be accomplished smoothly thanks to the combination of Intel's latest Tiger Lake CPU, Nvidia's Quadro T500, and fast RAM as well as storage.
It's not so much the Tiger Lake CPU but mostly the Nvidia Quadro T500 what leads to a performance increase in the Lenovo ThinkPad P14s Gen 2. The mobile workstation can particularly convince with its high system performance and excellent input devices.
The maintenance options and the input devices are also very good. However, we have to criticize that the Quadro T500 in the HP ZBook Firefly 14 G8, for example, achieves a higher performance, and that the system heats up so much under heavy load that throttling is necessary. Nevertheless, the second generation of the Lenovo ThinkPad P14s is still a good mobile workstation if you're looking for a professional GPU in the most compact package possible.
Price and availability
At the time of writing, you can find the ThinkPad P14s Gen 2 in Lenovo's online store either with the Intel Core i5-1135G7 or the i7-1165G7. There are different configurations for the display, storage, and RAM, with prices starting at around $1,275 for the Core i5 model with 8 GB of RAM, 256 GB of storage, and a Full HD display.
If you're interested in the more powerful version equipped with the Intel Core i7-1185G7, you can find it on newegg with 16 GB of RAM, a 512 GB SSD, and a Full HD display for about $2,029.
Lenovo ThinkPad P14s Gen2-20VX000GGE
- 05/29/2021 v7 (old)
Mike Wobker
Price comparison

