 Deutsch
 English
 Español
 Français
 Italiano
 Nederlands
 Polski
 Português
 Русский
 Türkçe
 Svenska
 Chinese
 Magyar
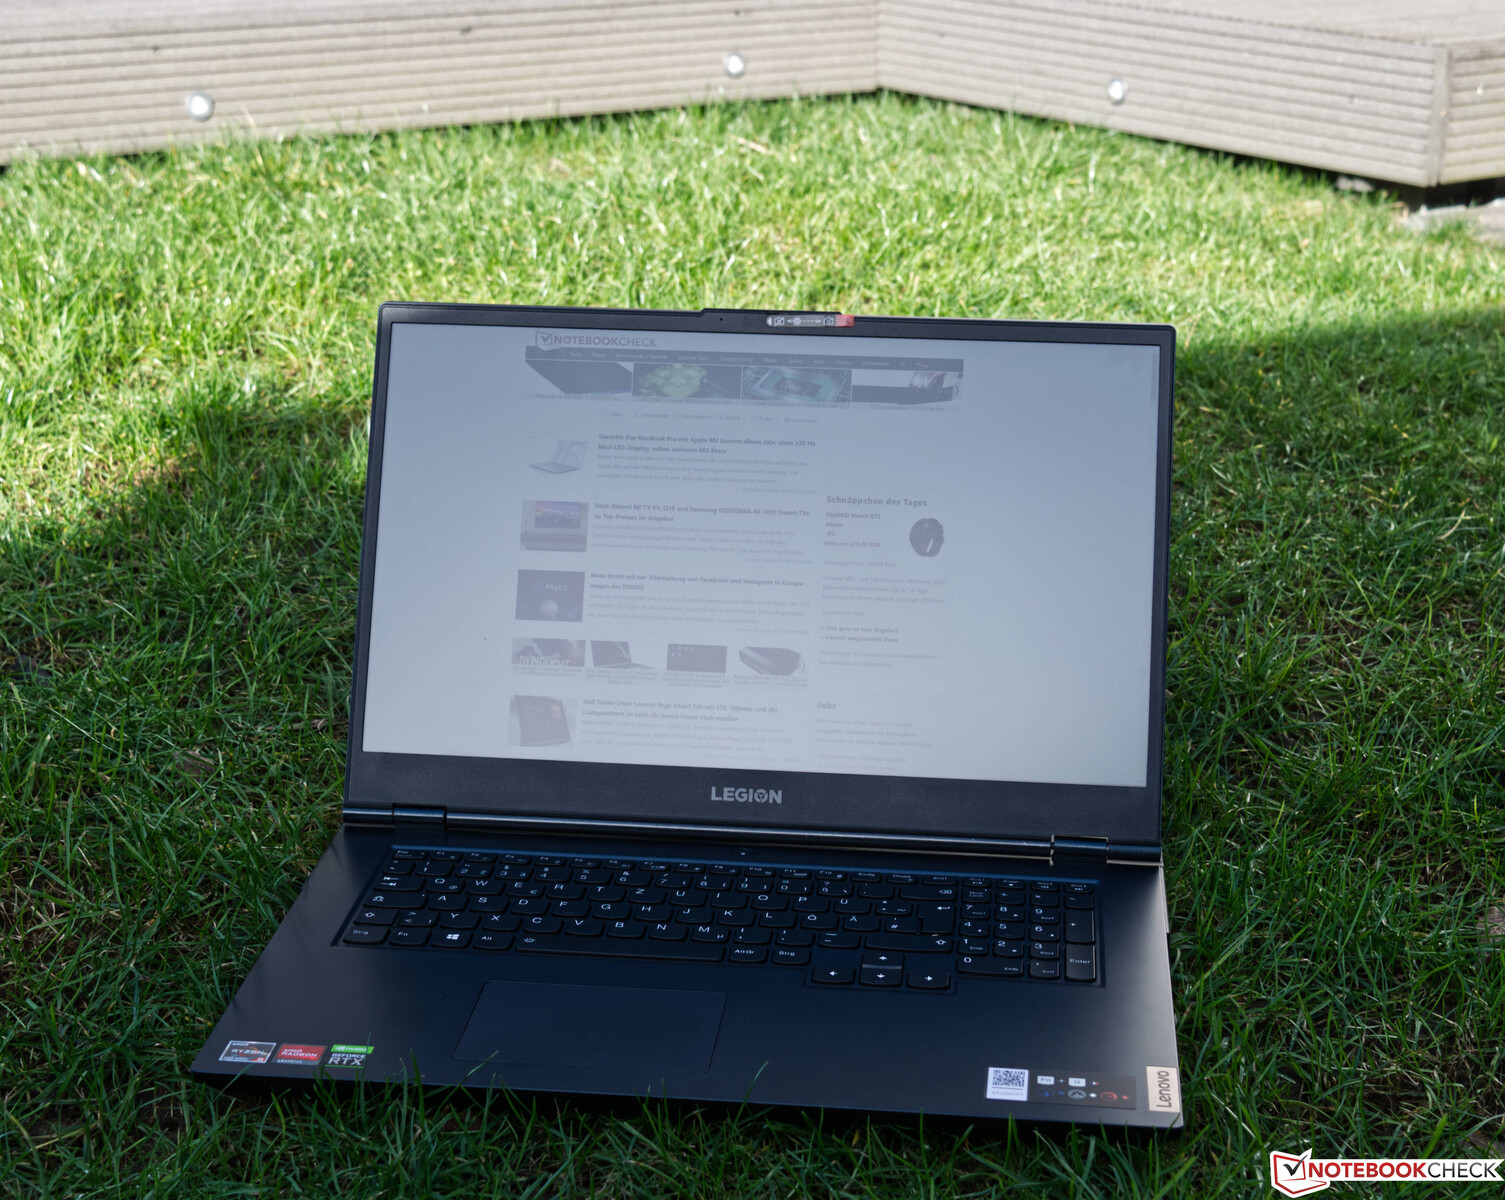
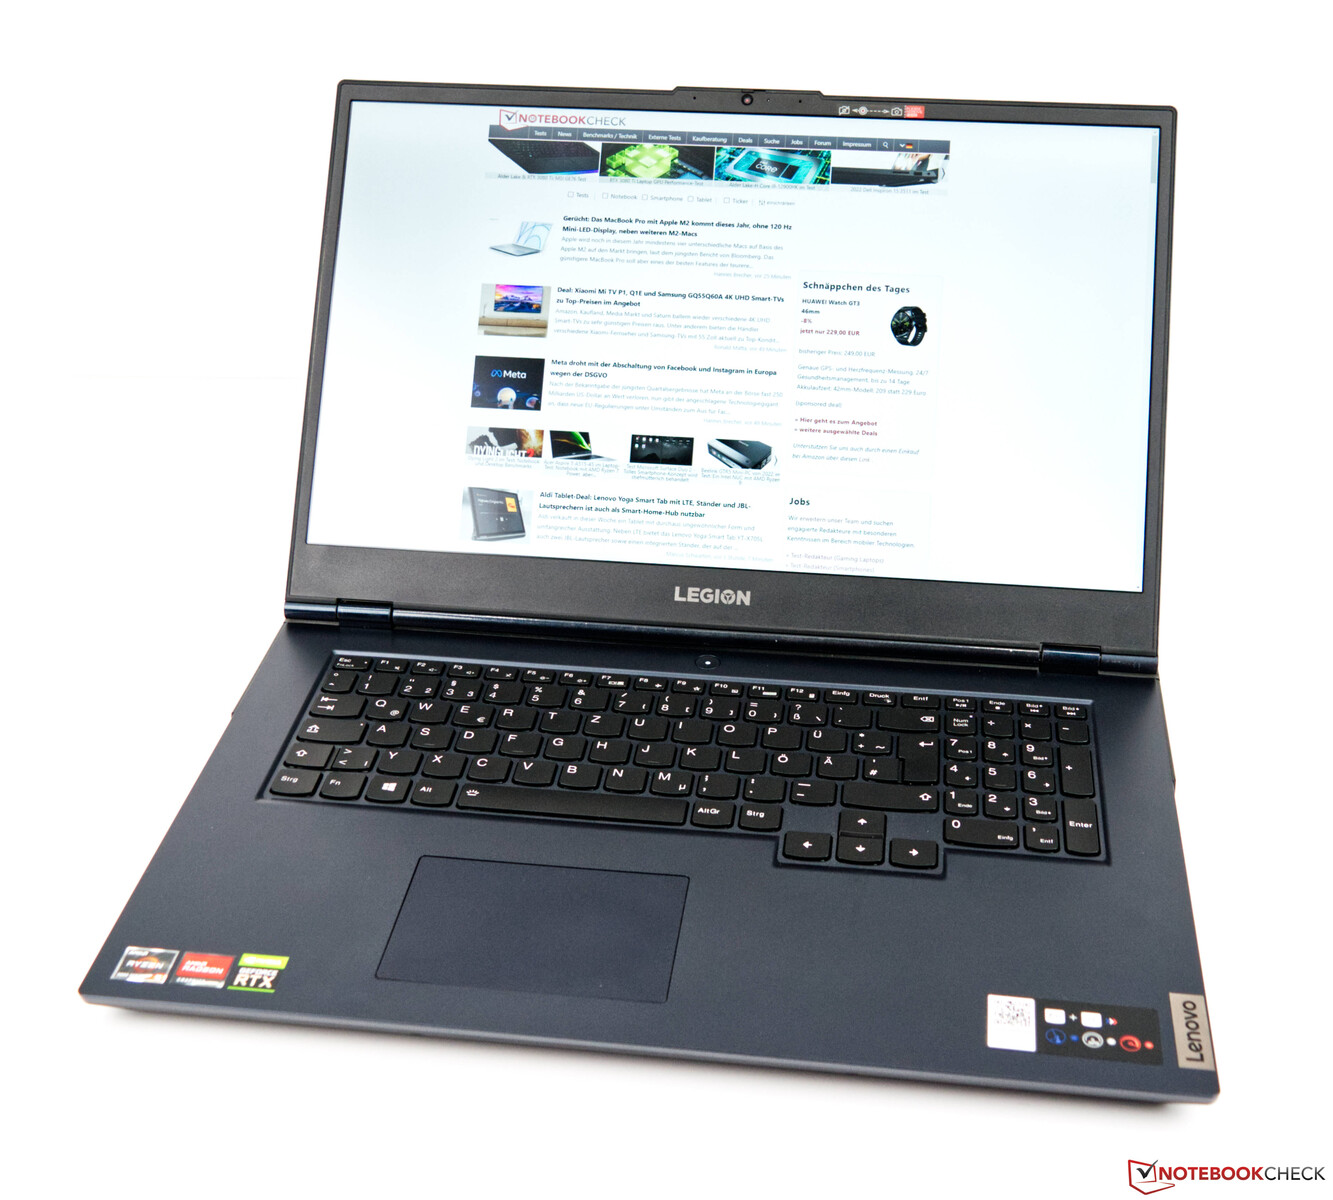
Lenovo Legion 5 17 with RTX 3060 in review: Strong gaming laptop with current-gen AMD Ryzen CPU

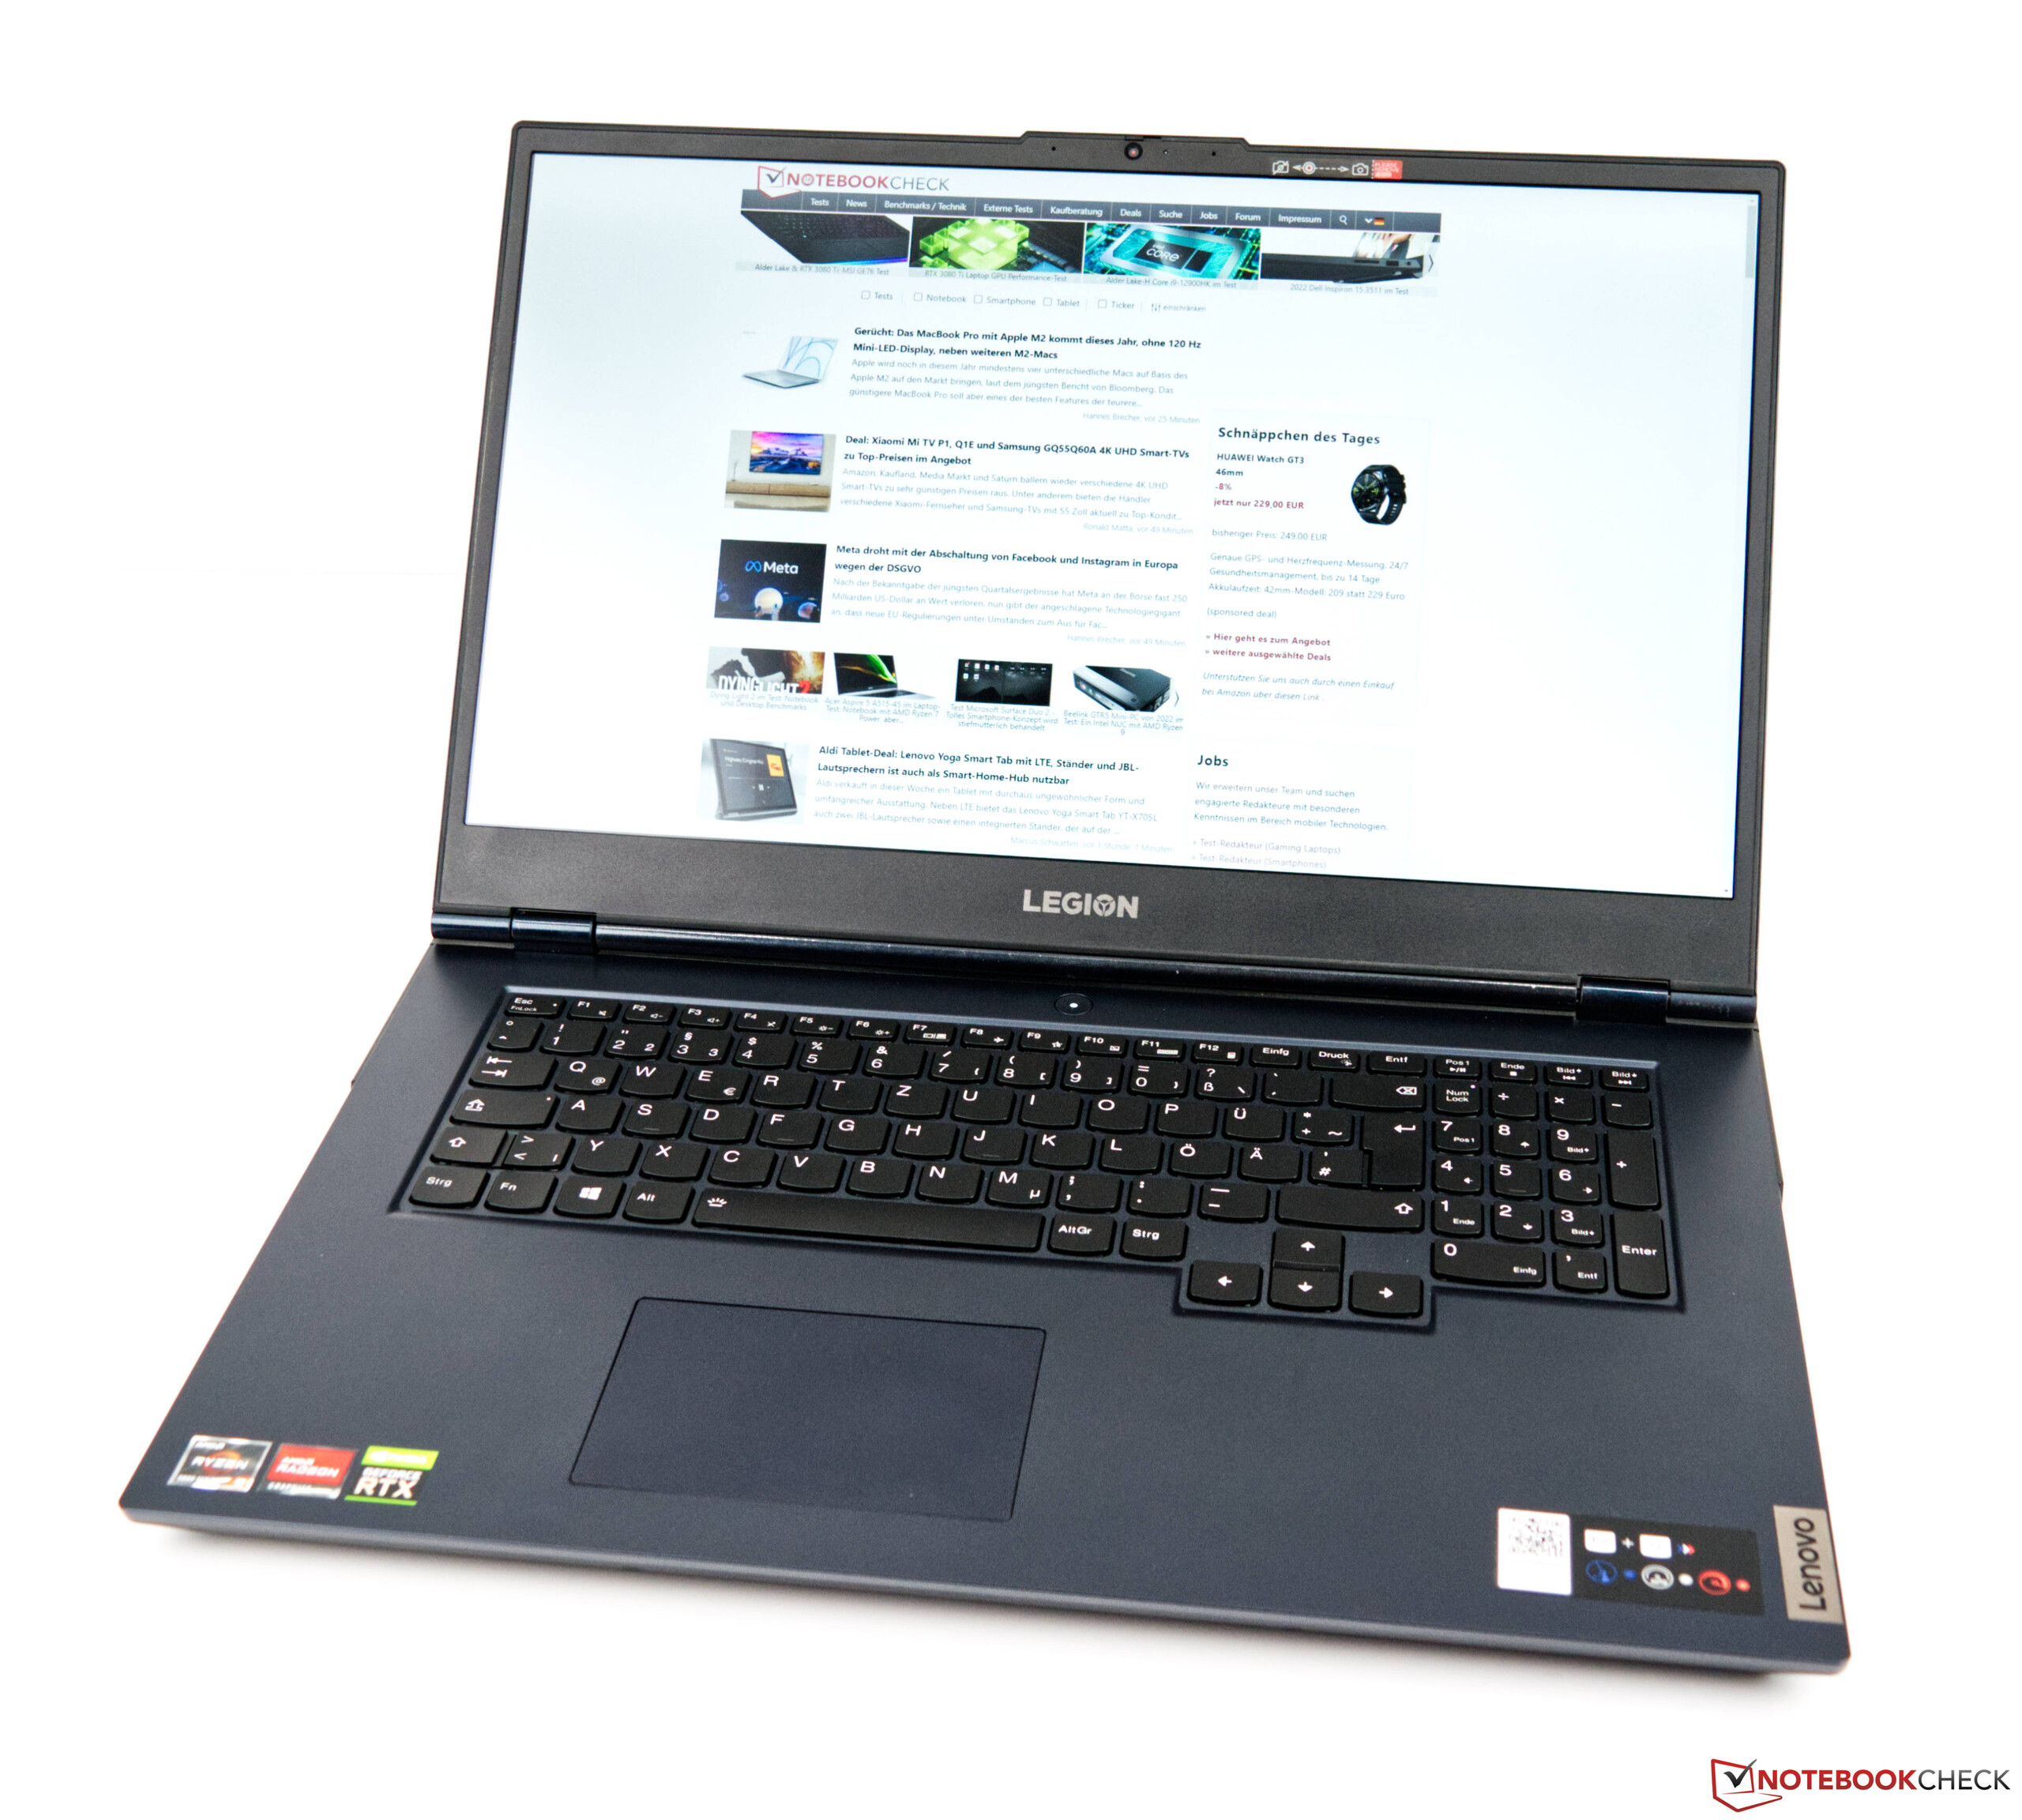
The Legion series from Lenovo has been a household name in the gaming scene for a long time now. The Legion 5 is far from inconspicuous visually, since its striking design has also made it to the latest 2022 model, which is based on an AMD APU.
On top of the AMD Ryzen 5 5600H and the AMD Ryzen 7 5800H, users may choose from three different Nvidia GPUs. The GeForce RTX 3050 base model of the Lenovo Legion 5 17 starts at 1150 USD, while our test configuration with a GeForce RTX 3060 mobile GPU is available for approximately 1220 USD. For the price, users also receive a 144-Hz 1080p display, 16 GB of RAM, and a 512-GB NVMe SSD. Windows 11 Home edition is included by default. The system can be configured according to your preferences through Lenovo's online shop.
We used similarly equipped devices for comparison purposes. The table below shows the competitors we chose.
Potential Competitors in Comparison
Rating | Date | Model | Weight | Height | Size | Resolution | Best Price |
|---|---|---|---|---|---|---|---|
| 85.2 % | 02/2022 | Lenovo Legion 5 17ACH6H-82JY0003GE R5 5600H, GeForce RTX 3060 Laptop GPU | 3.1 kg | 24.3 mm | 17.30" | 1920x1080 | |
| 83.9 % | 06/2021 | SCHENKER XMG Core 17 (Early 2021) i7-10870H, GeForce RTX 3060 Laptop GPU | 2.5 kg | 30.05 mm | 17.30" | 2560x1440 | |
| 82.8 % | 06/2021 | Asus TUF Gaming F17 FX706HM i9-11900H, GeForce RTX 3060 Laptop GPU | 2.7 kg | 26 mm | 17.30" | 1920x1080 | |
| 80.4 % | 06/2021 | MSI Katana GF76 11UE i7-11800H, GeForce RTX 3060 Laptop GPU | 2.7 kg | 25.2 mm | 17.30" | 1920x1080 | |
| 83.4 % | 11/2021 | SCHENKER XMG Apex 17 M21 R7 5800H, GeForce RTX 3070 Laptop GPU | 2.6 kg | 32.4 mm | 17.30" | 1920x1080 | |
| 83.2 % | 10/2021 | Gigabyte A7 X1 R9 5900HX, GeForce RTX 3070 Laptop GPU | 2.5 kg | 34 mm | 17.30" | 1920x1080 |
Case
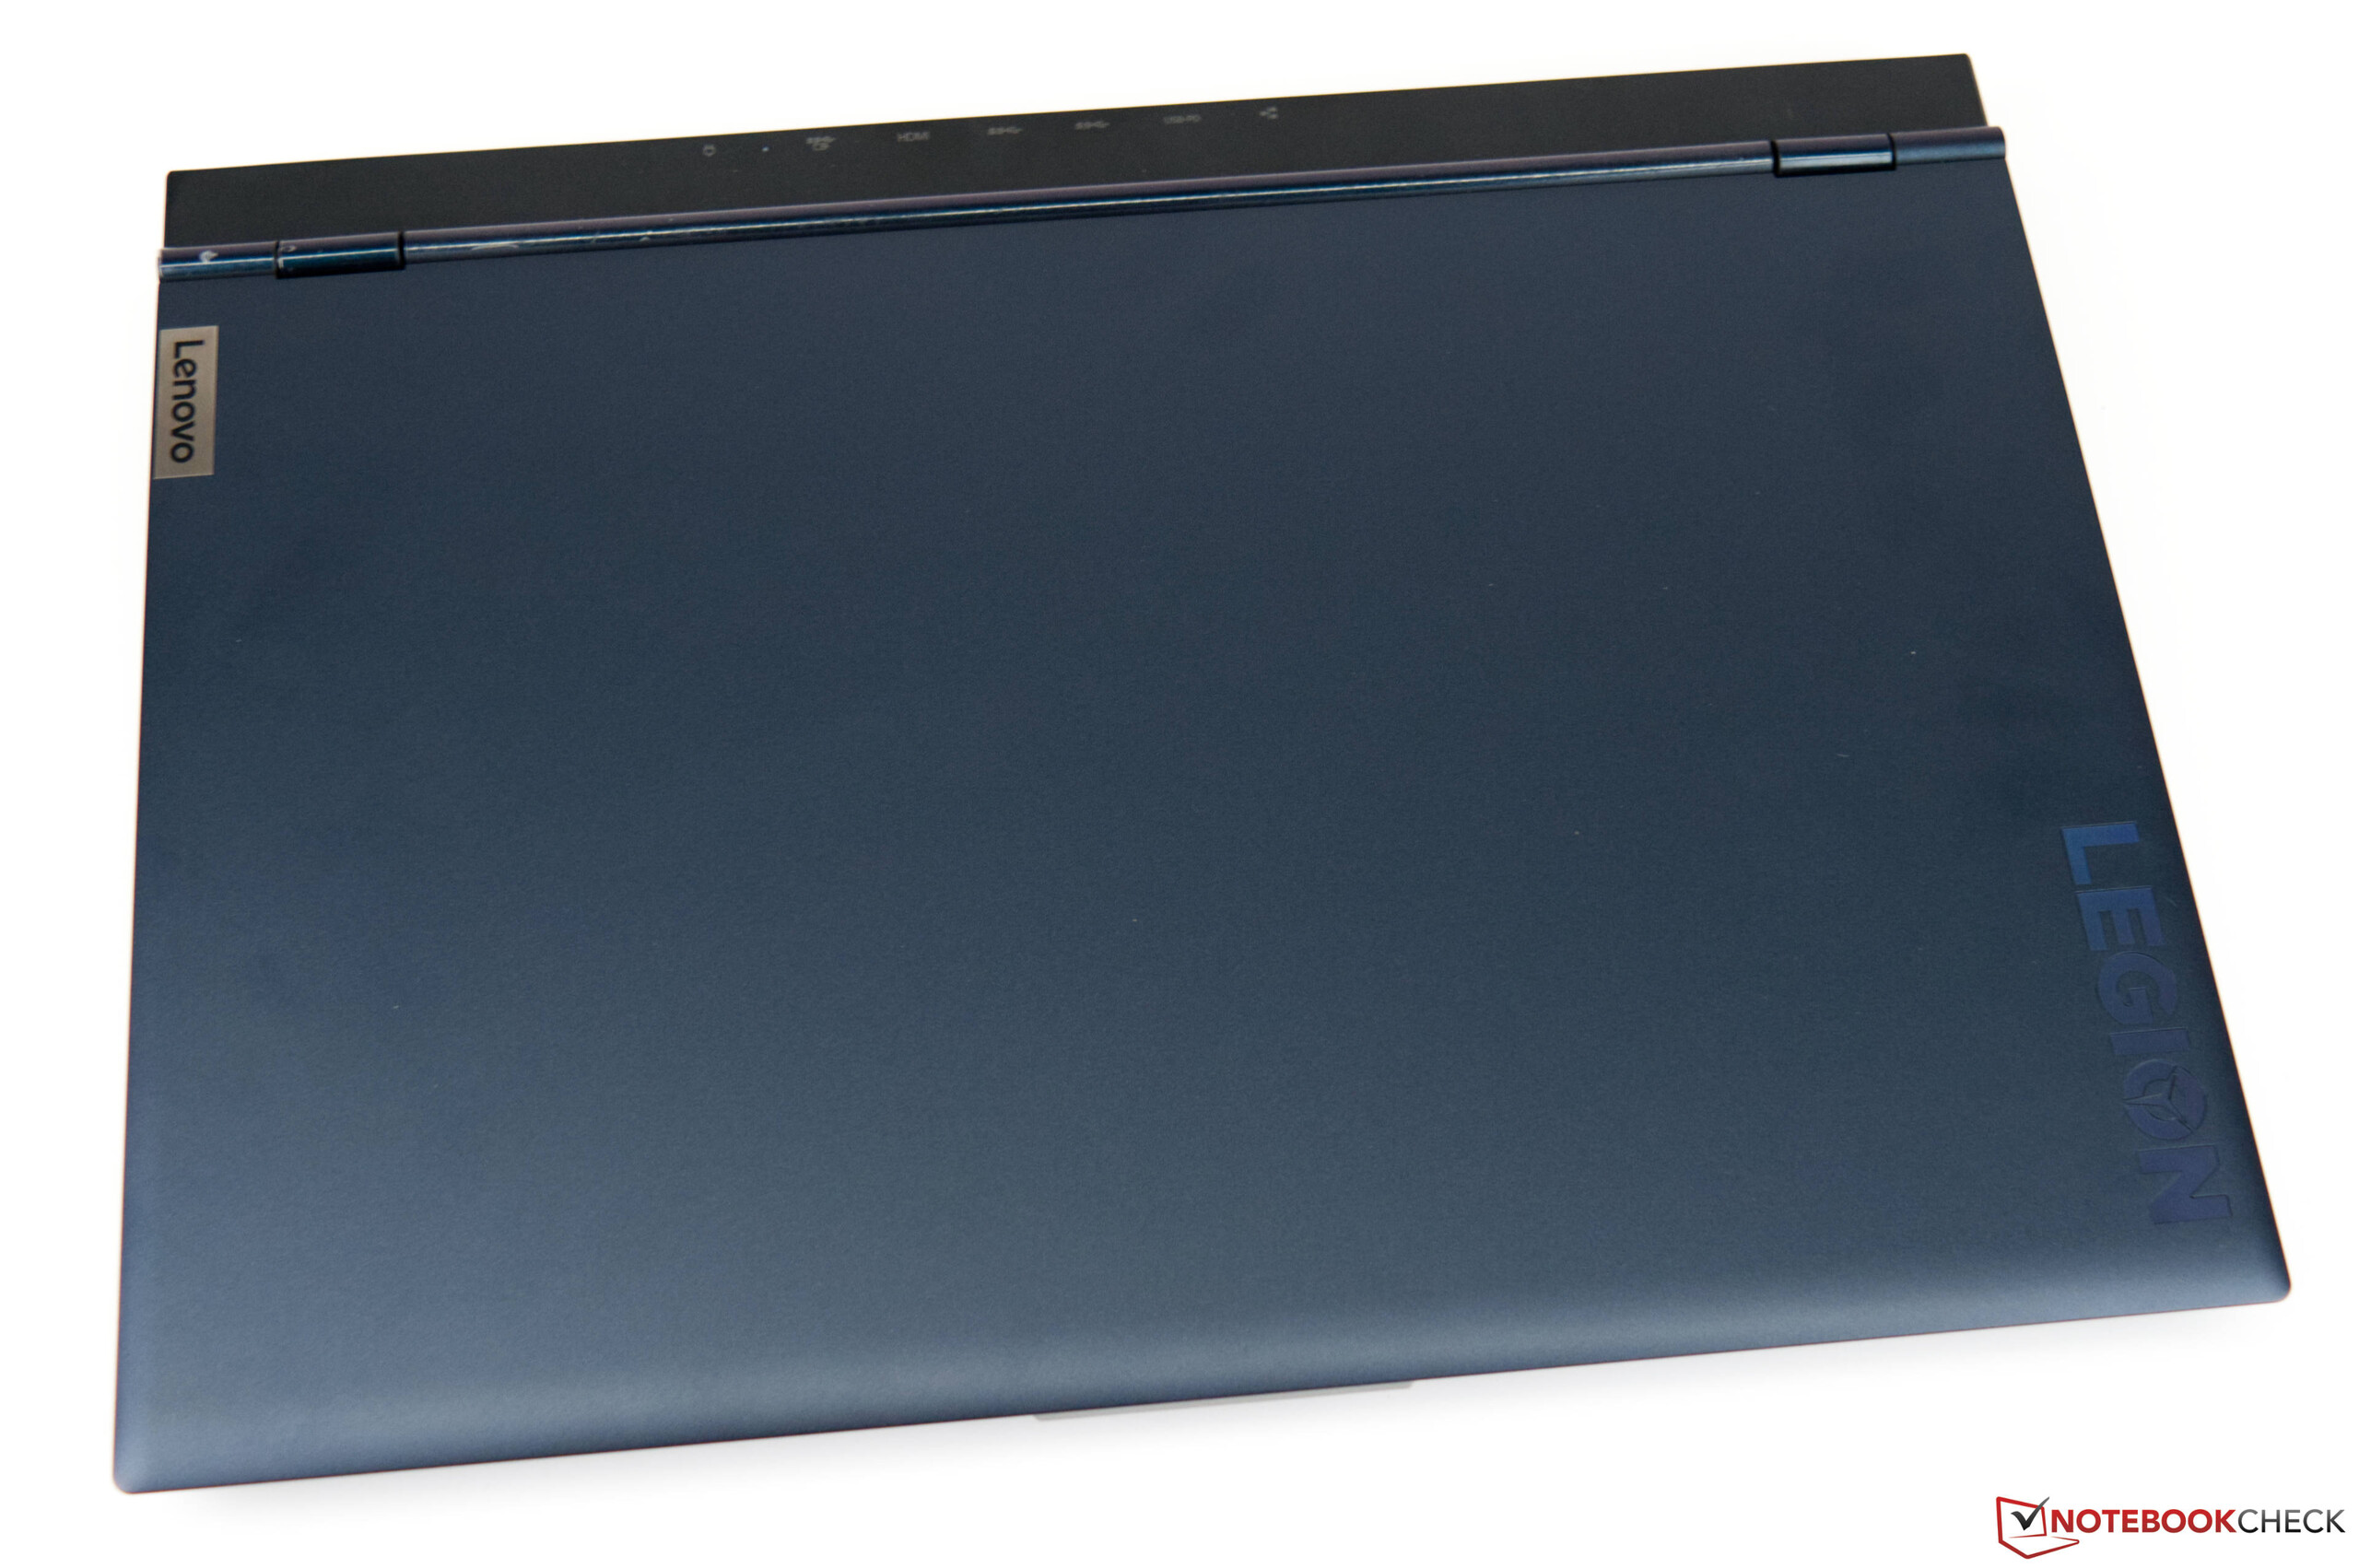
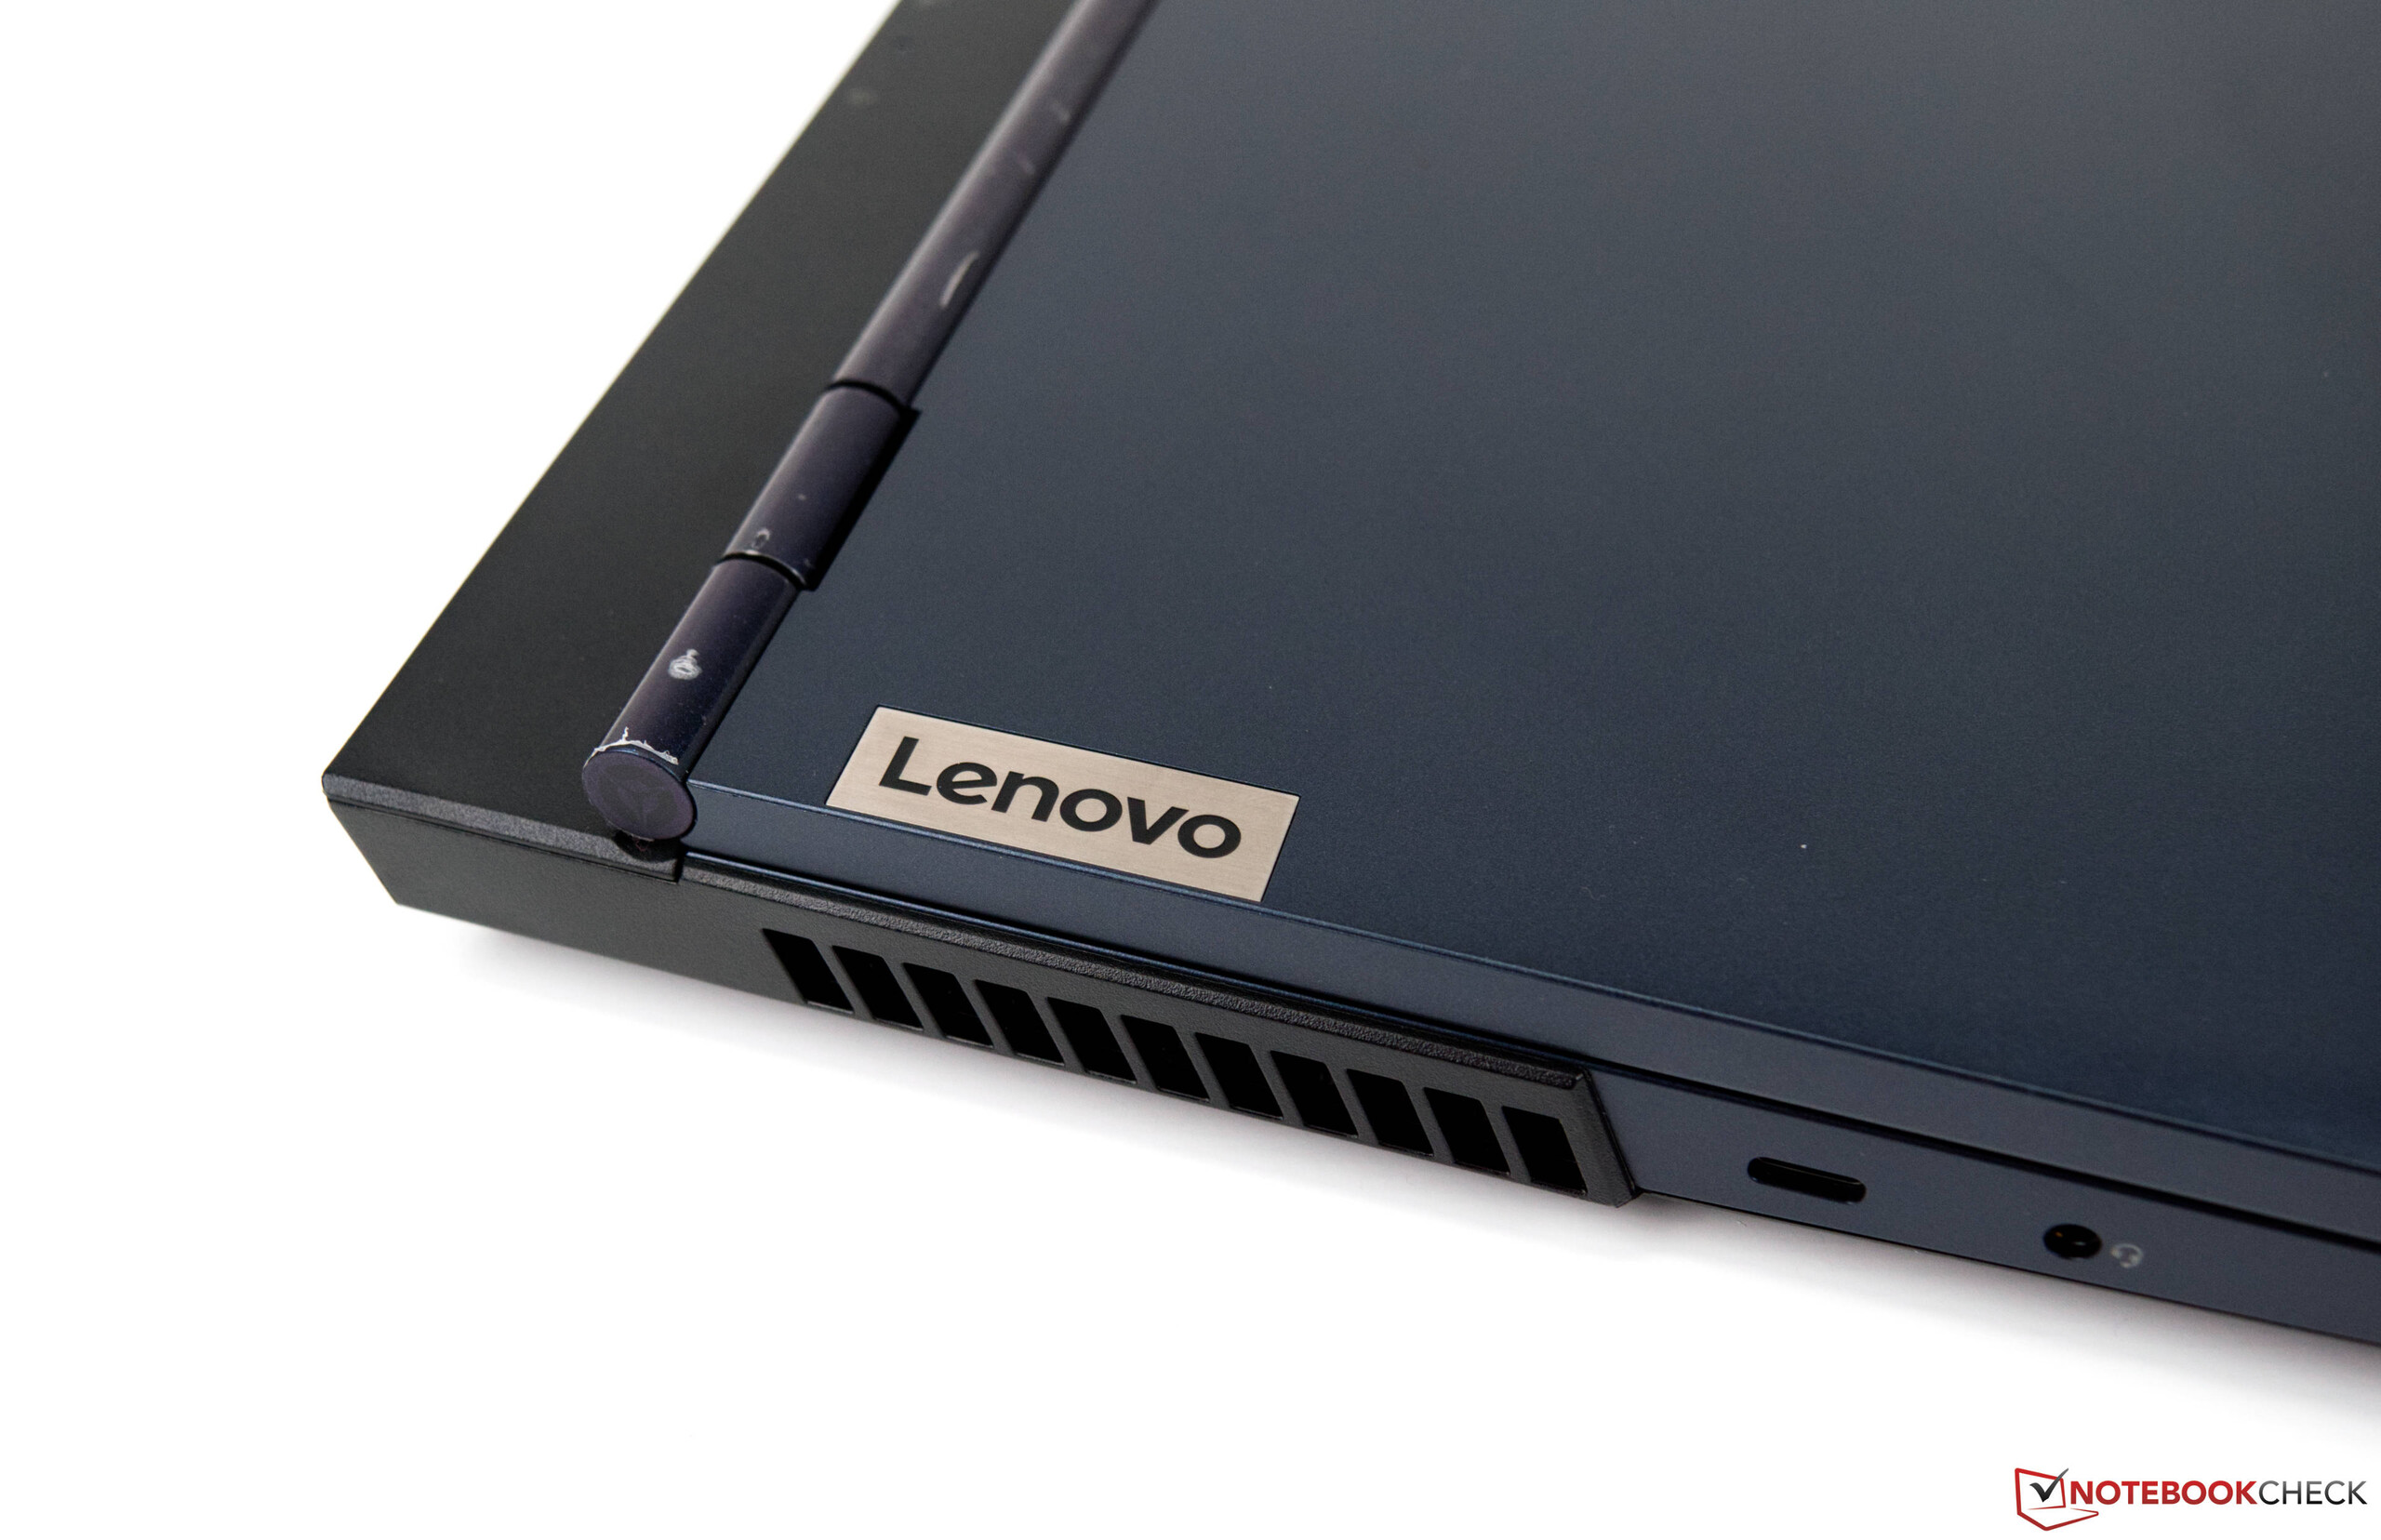
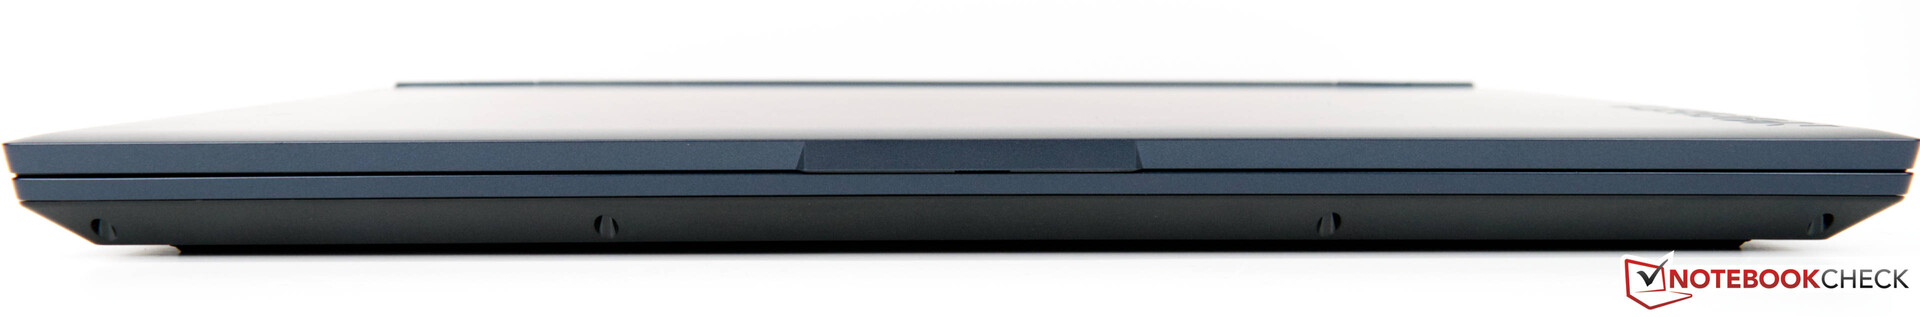
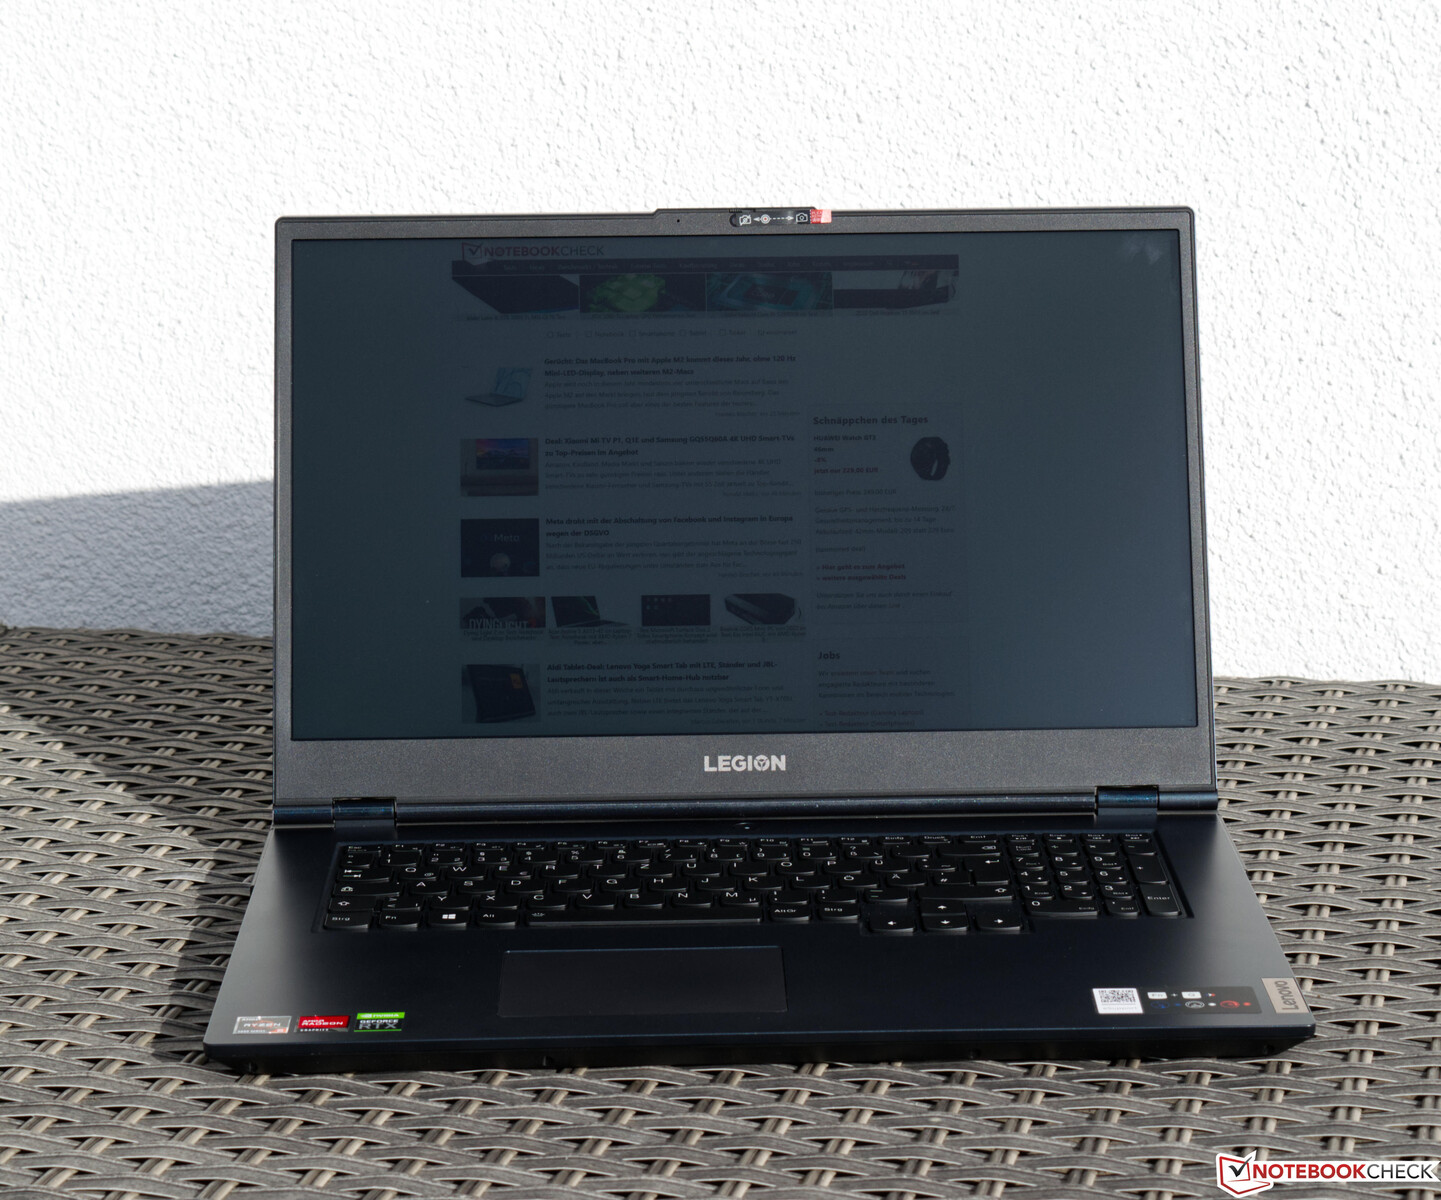
Aesthetically, the Lenovo Legion 5 17 is very clearly a gaming laptop. The lid is adorned by visual accents in the form of the Legion logo. The Lenovo Legion 5 17 comes without any RGB lighting. The selection of materials is good, since the device feels very premium despite the plastic-based construction. Although the base is decently rigid, although the center of the keyboard area slightly yields under pressure. This is not very pronounced, however. We would have liked to see a similar level of rigidity for the lid, which is unfortunately very susceptible to twisting. At least, it is fairly resistant against concentrated applicationis of pressure. The lid can be opened up to a wide maximum angle of 180 °. The two hinges reliably prevent teetering. Aditionally, the base is heavy enough for one-handed opening.

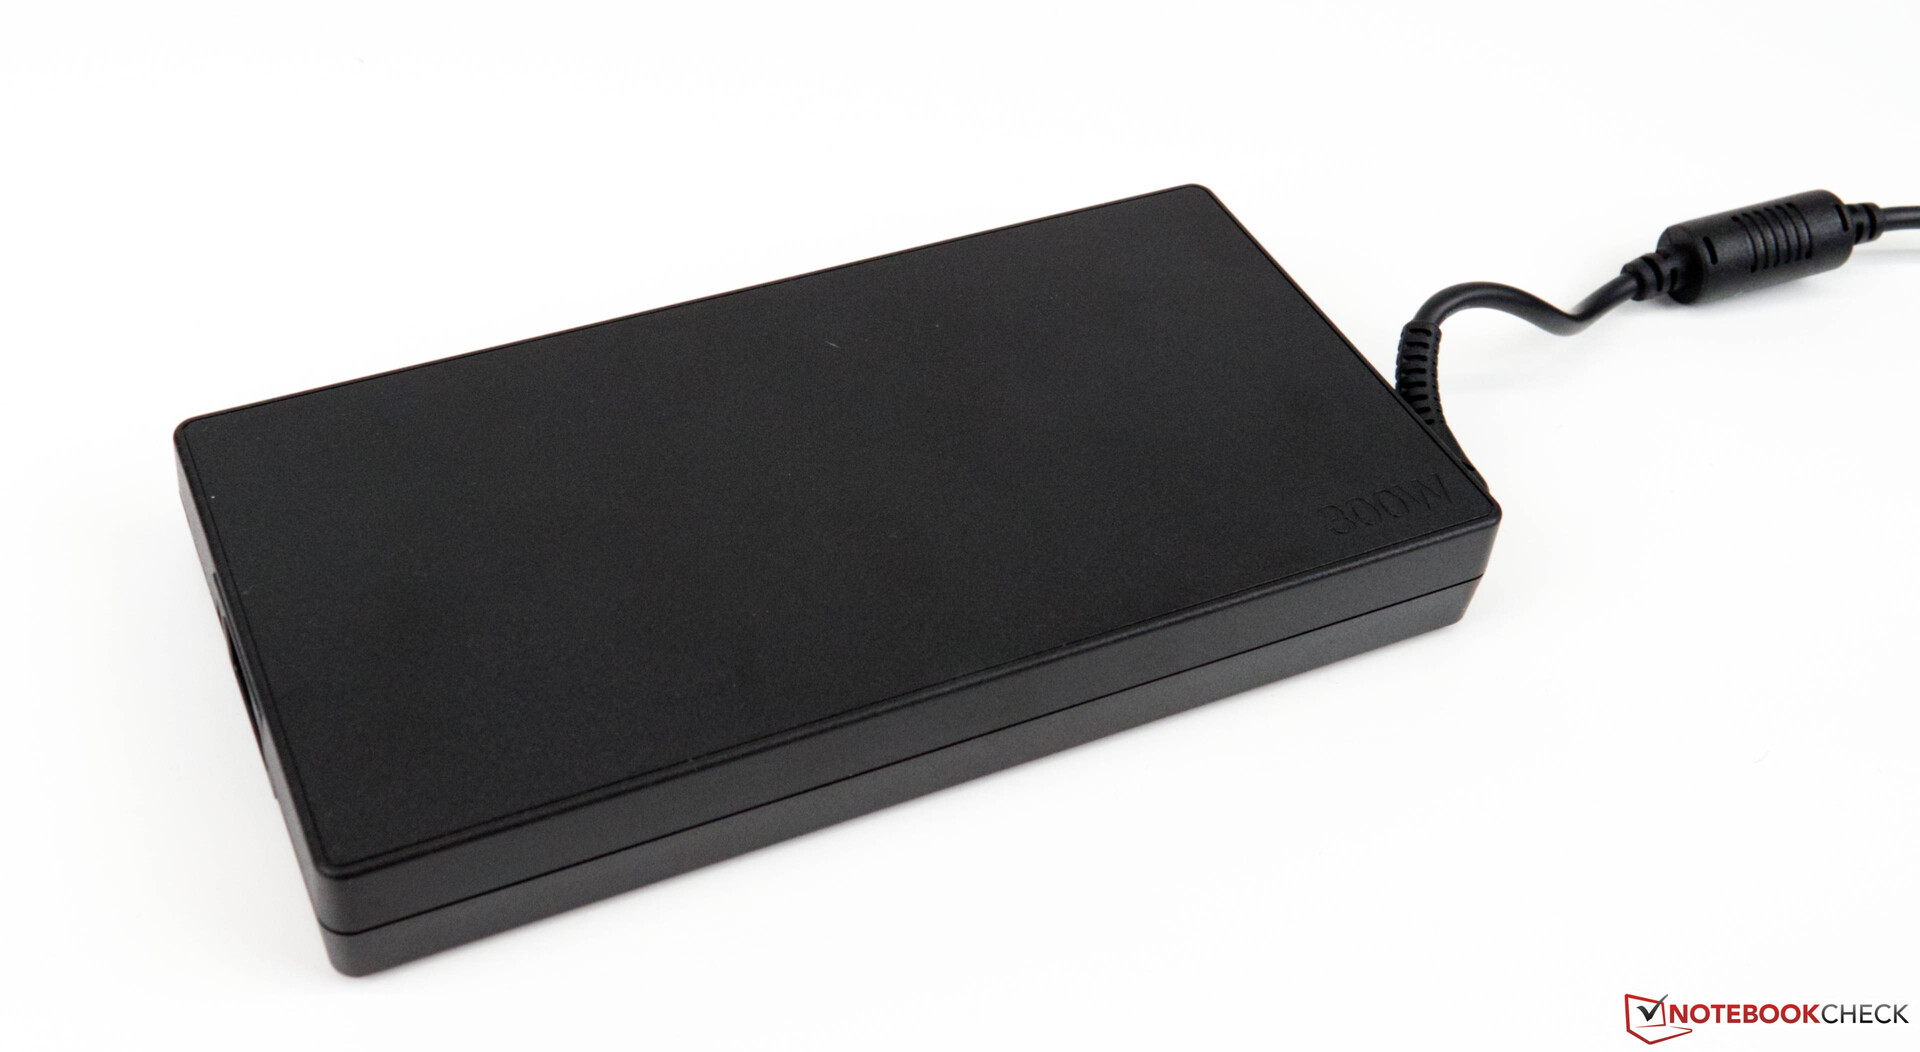
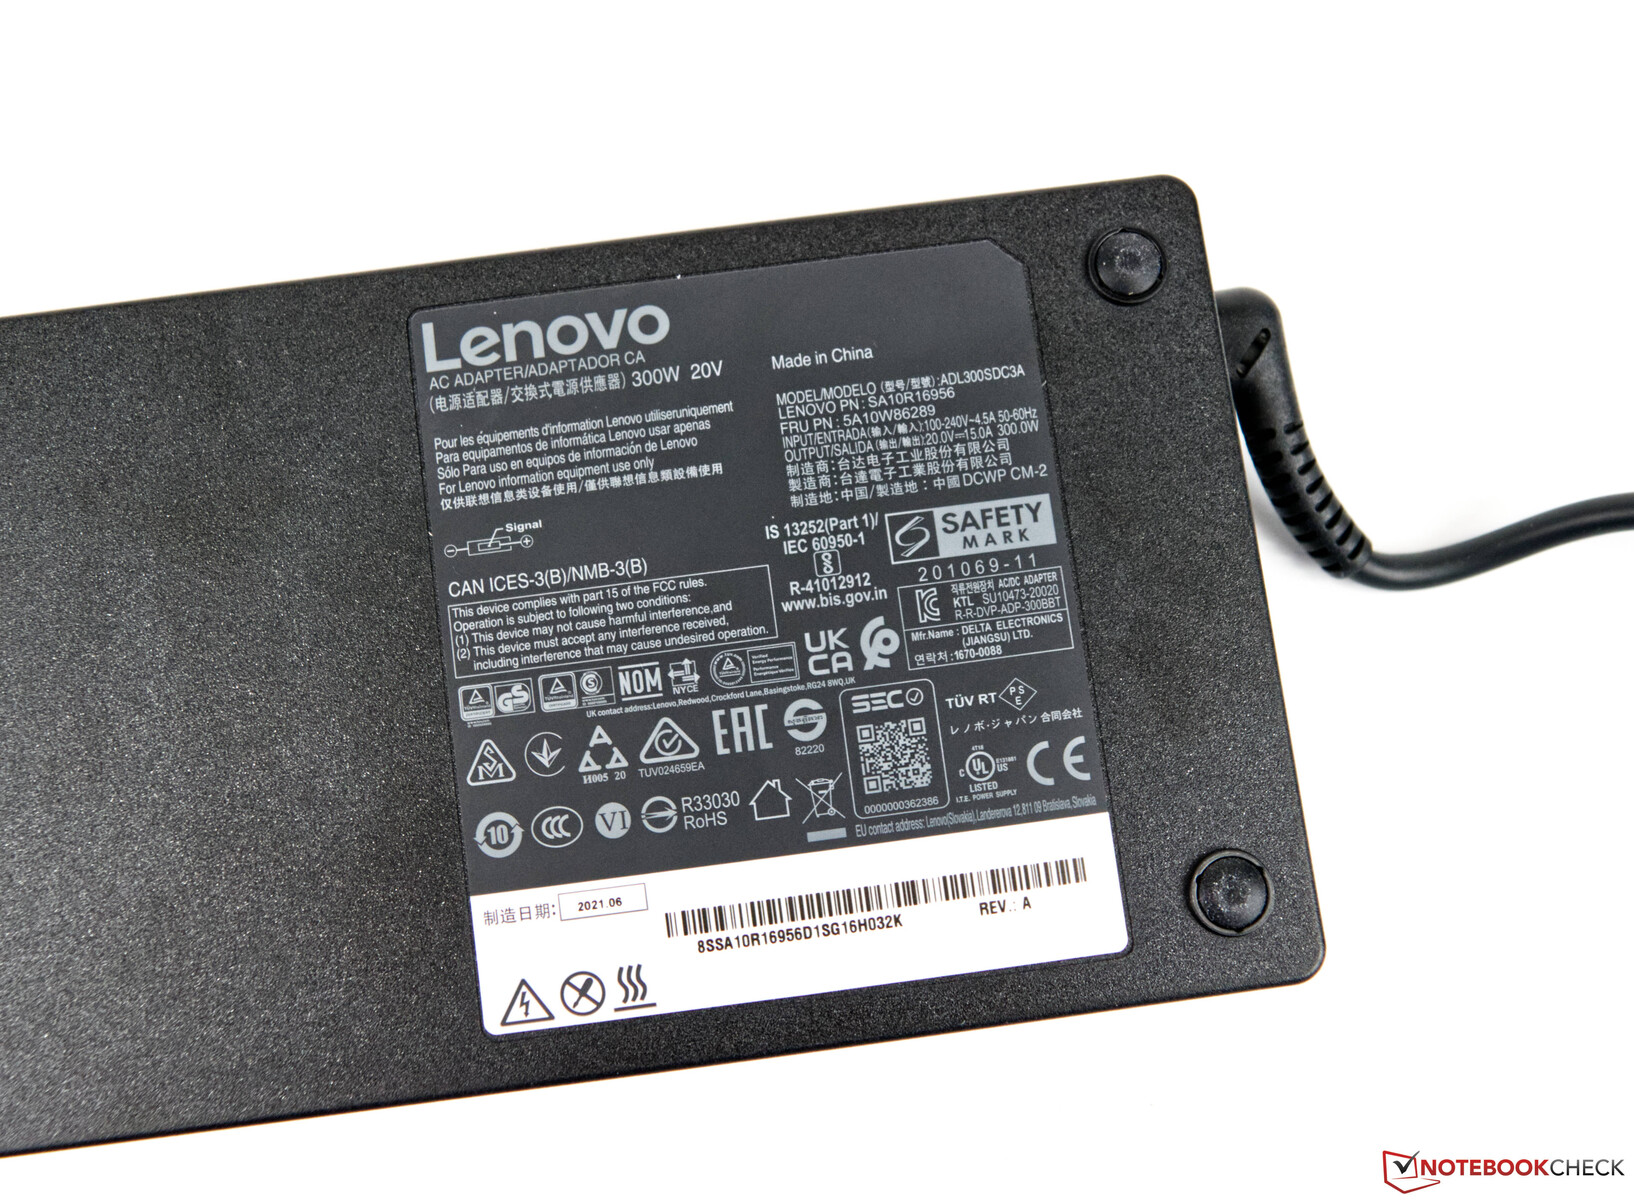
With 3.1 kg (~6.83 lbs), the Lenovo Legion 5 17 is significantly heavier than its competitors. Similarly, the footprint of our test unit is larger. The 300-watt AC adapter, which is both slim and powerful, weighs just above one kilogram (~2.2 lbs).
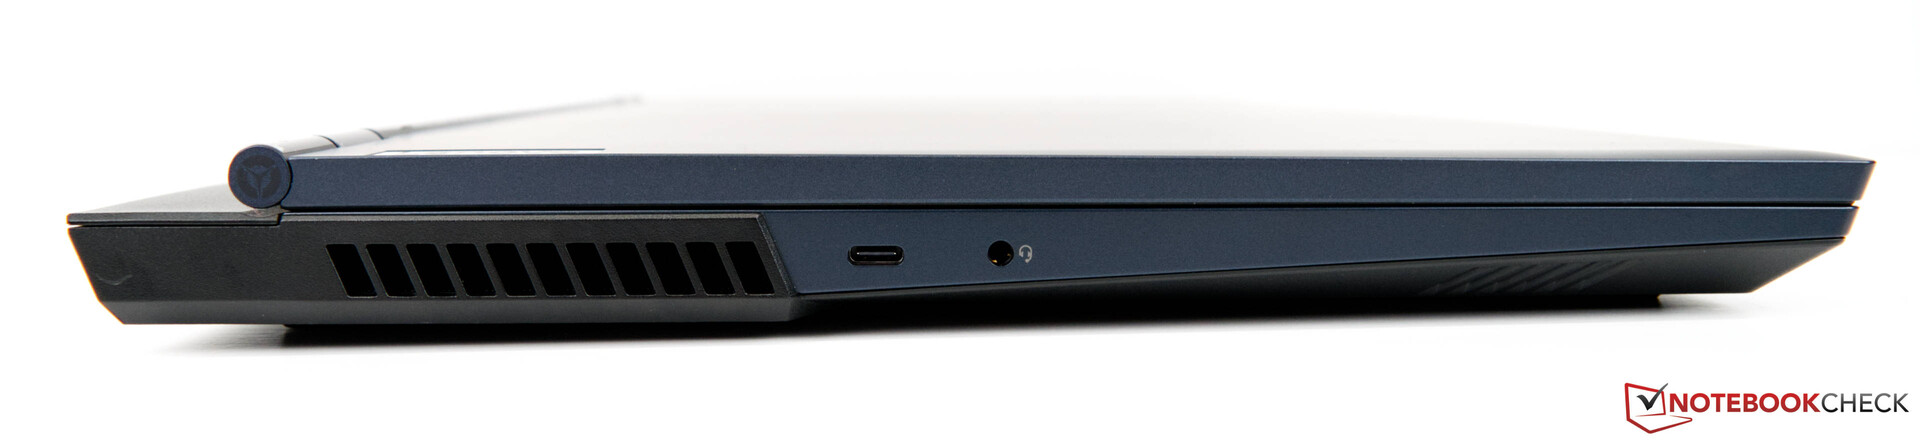
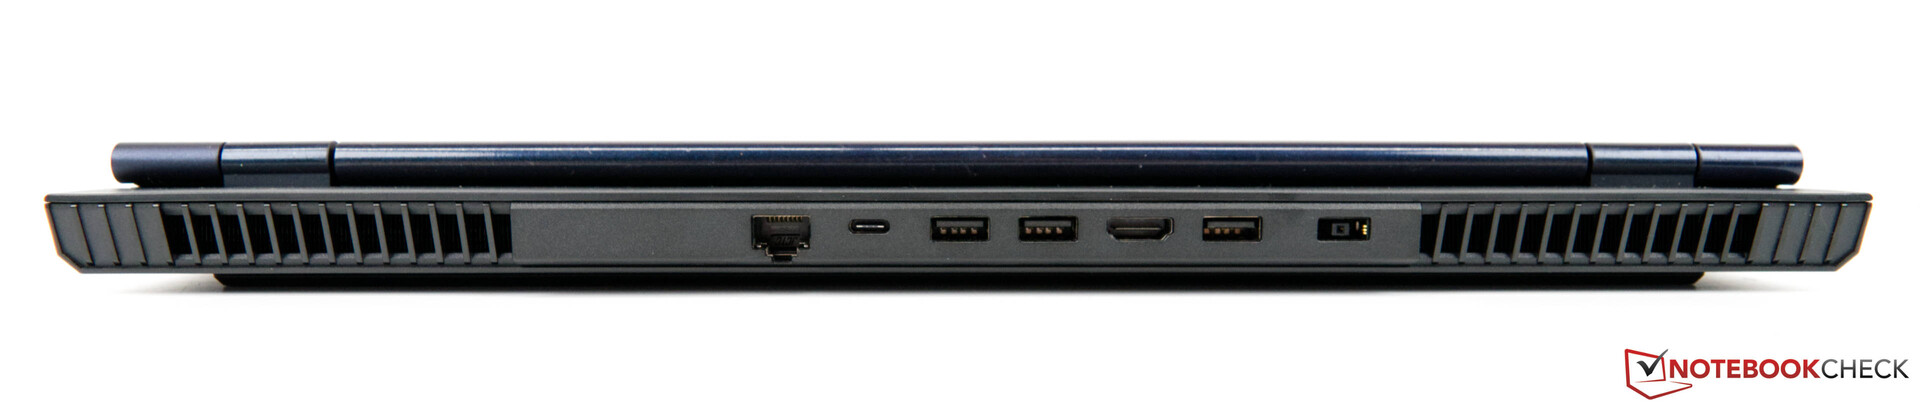
Connectivity
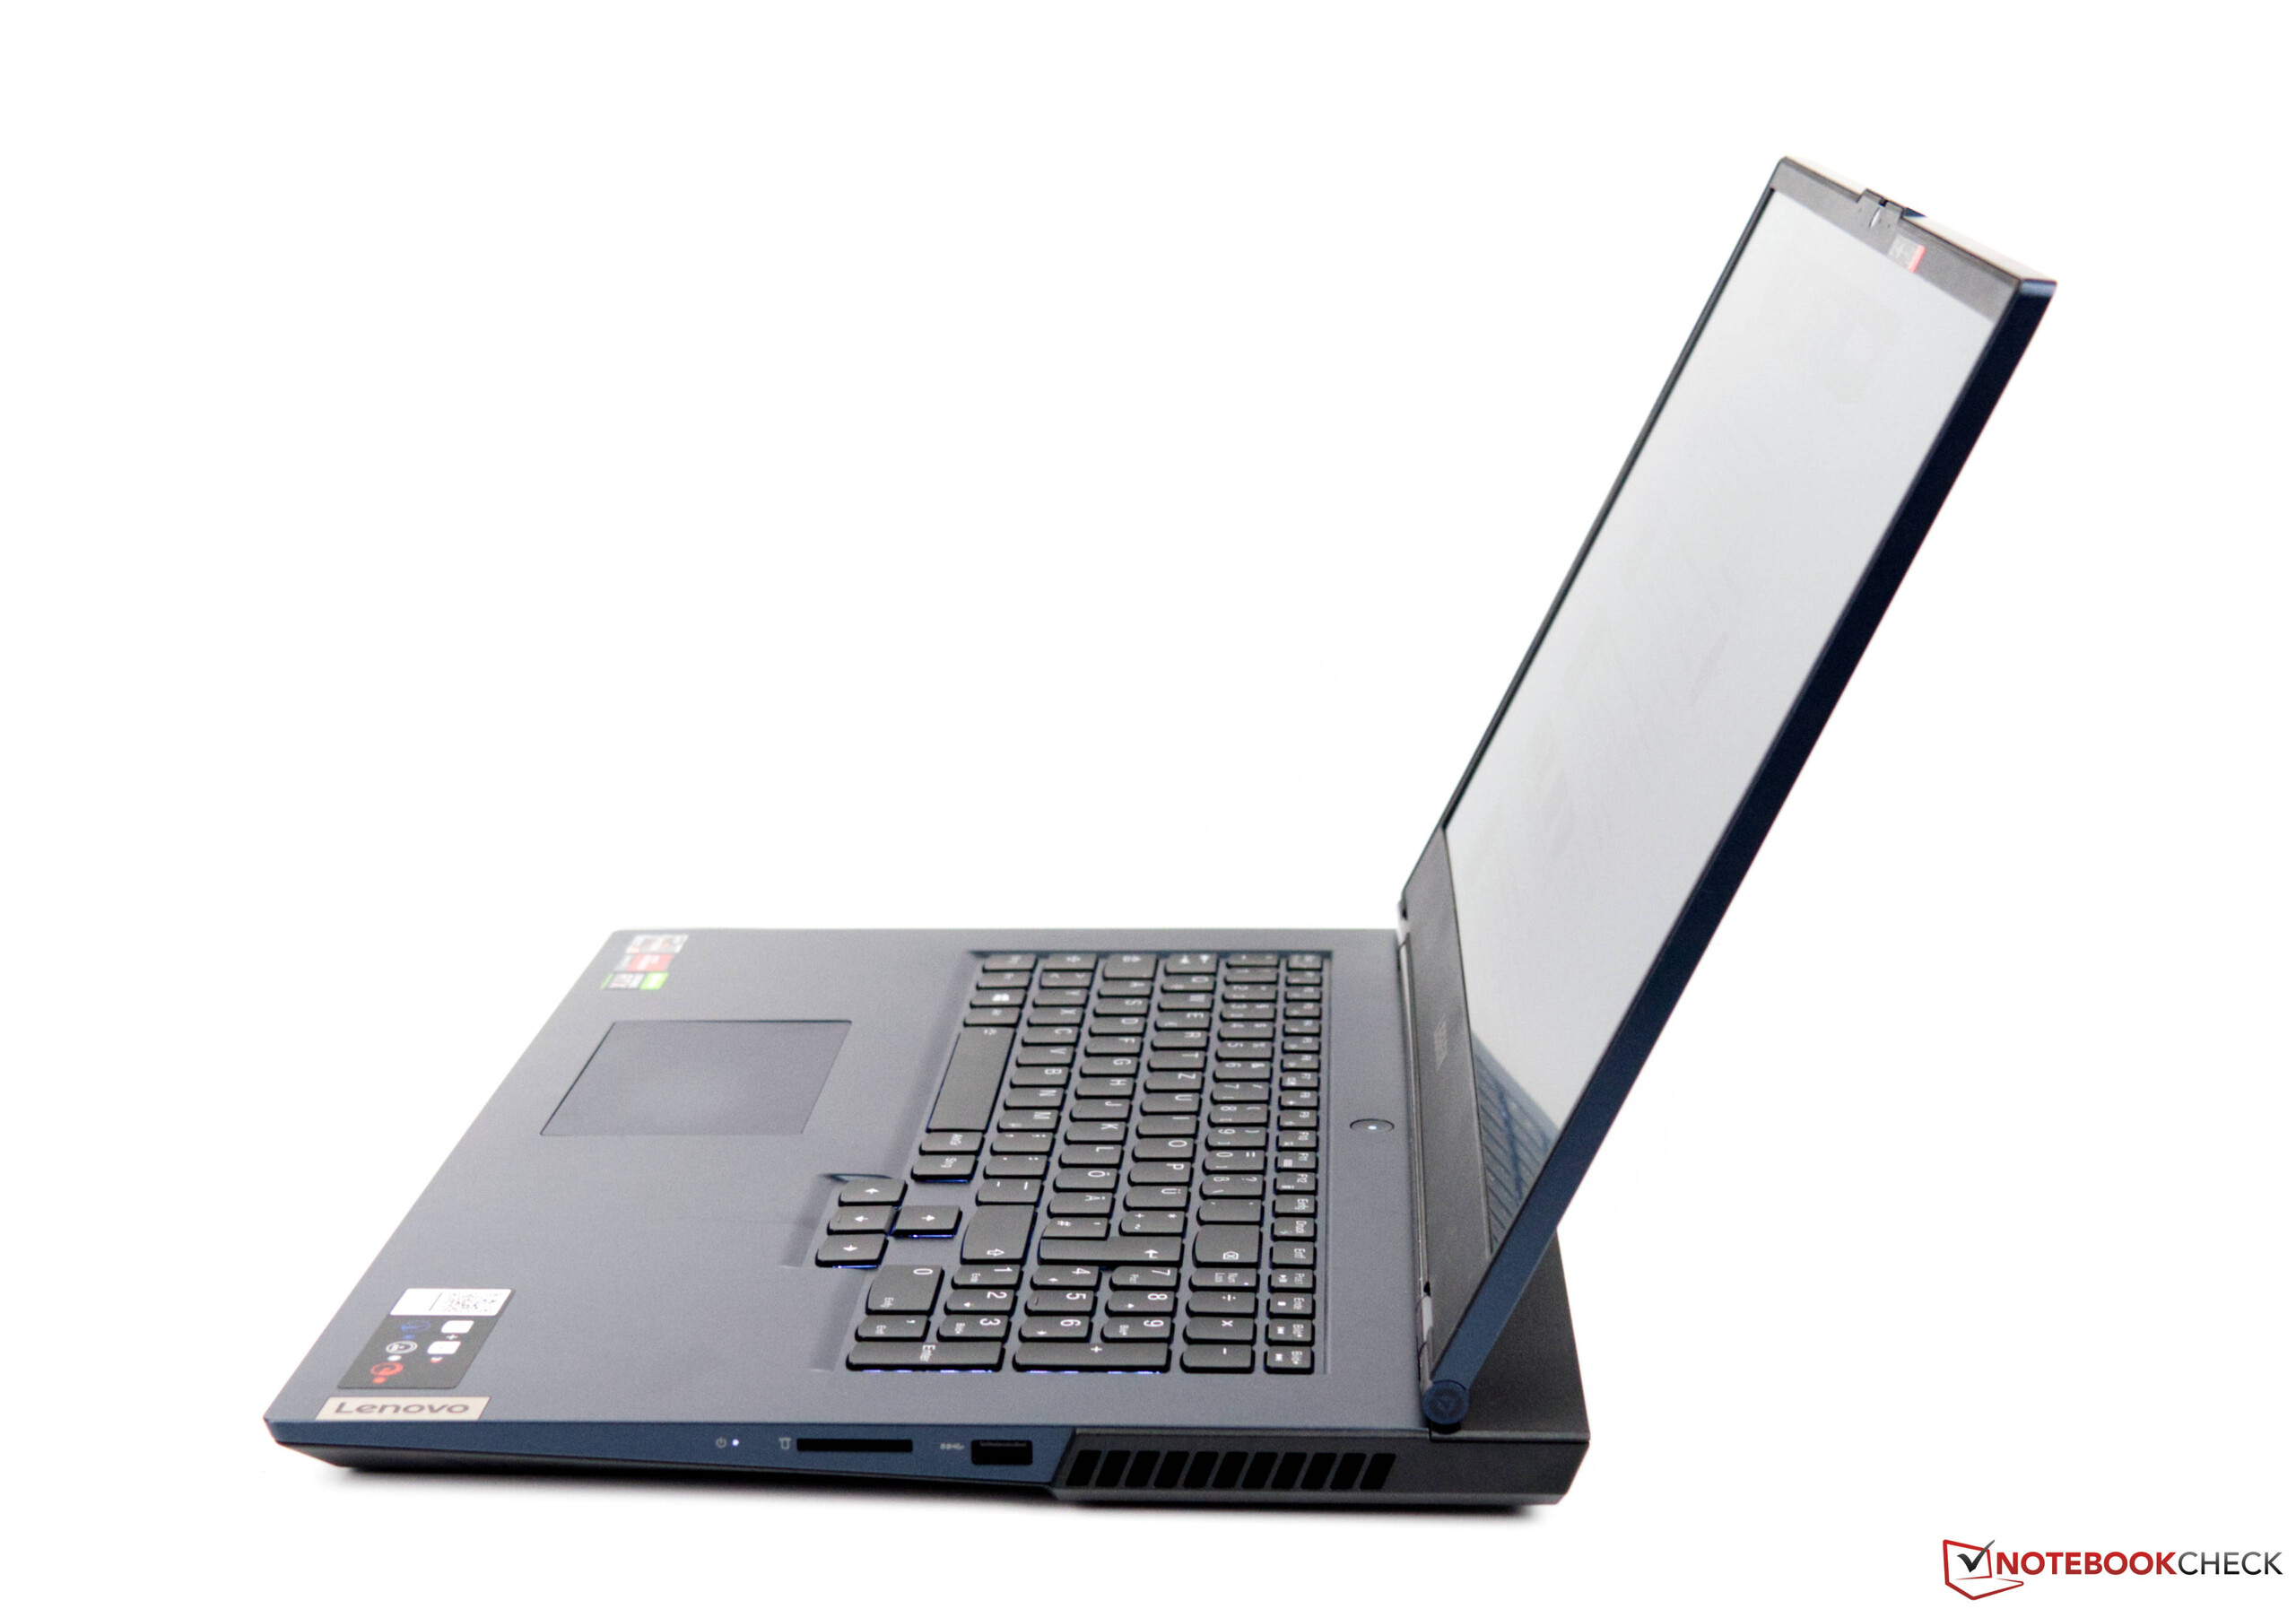
When it comes to the port selection, the Lenovo Legion 5 17 offers a good variety of ports and a sensible layout. Most of the ports are on the back. However, there is still one USB port on each side and an SD card reader. There is still some room for improvement, since the space on the back of the device could have been used to keep the ports further apart and give the USB ports in particular slightly more room to breathe.
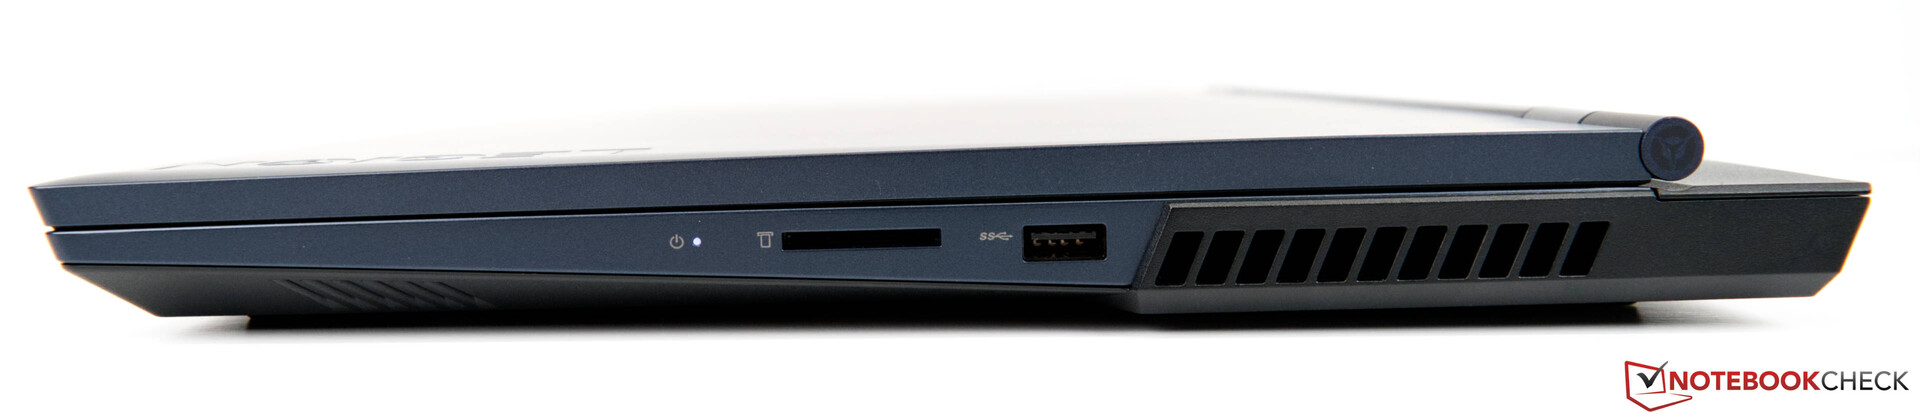
SD Card Reader
Unlike the Lenovo Legion Y740-17IRHg, Lenovo has once again equipped the Legion 5 17 with a fullsize SD card reader. It offers USB 3.0 speeds and reaches close to 90 MB/s during our sequential read benchmark. For this purpose, we used our reference card (Angelbird AV Pro V60).
| SD Card Reader | |
| average JPG Copy Test (av. of 3 runs) | |
| Average of class Gaming (19 - 202, n=100, last 2 years) | |
| Lenovo Legion 5 17ACH6H-82JY0003GE (AV Pro SD microSD 128 GB V60) | |
| SCHENKER XMG Core 17 (Early 2021) (AV PRO microSD 128 GB V60) | |
| maximum AS SSD Seq Read Test (1GB) | |
| Average of class Gaming (25.8 - 269, n=94, last 2 years) | |
| Lenovo Legion 5 17ACH6H-82JY0003GE (AV Pro SD microSD 128 GB V60) | |
| SCHENKER XMG Core 17 (Early 2021) (AV PRO microSD 128 GB V60) | |
Communication
The Lenovo Legion 5 17 is equipped with a Realtek Wi-Fi module. In our test, the Wi-Fi module performs sufficiently well for day-to-day use. Compared to competitors equipped with fast Intel modules, our test sample performs significantly worse. Overall, the performance of the Realtek Wi-Fi module falls behind compared to the gaming class average results.
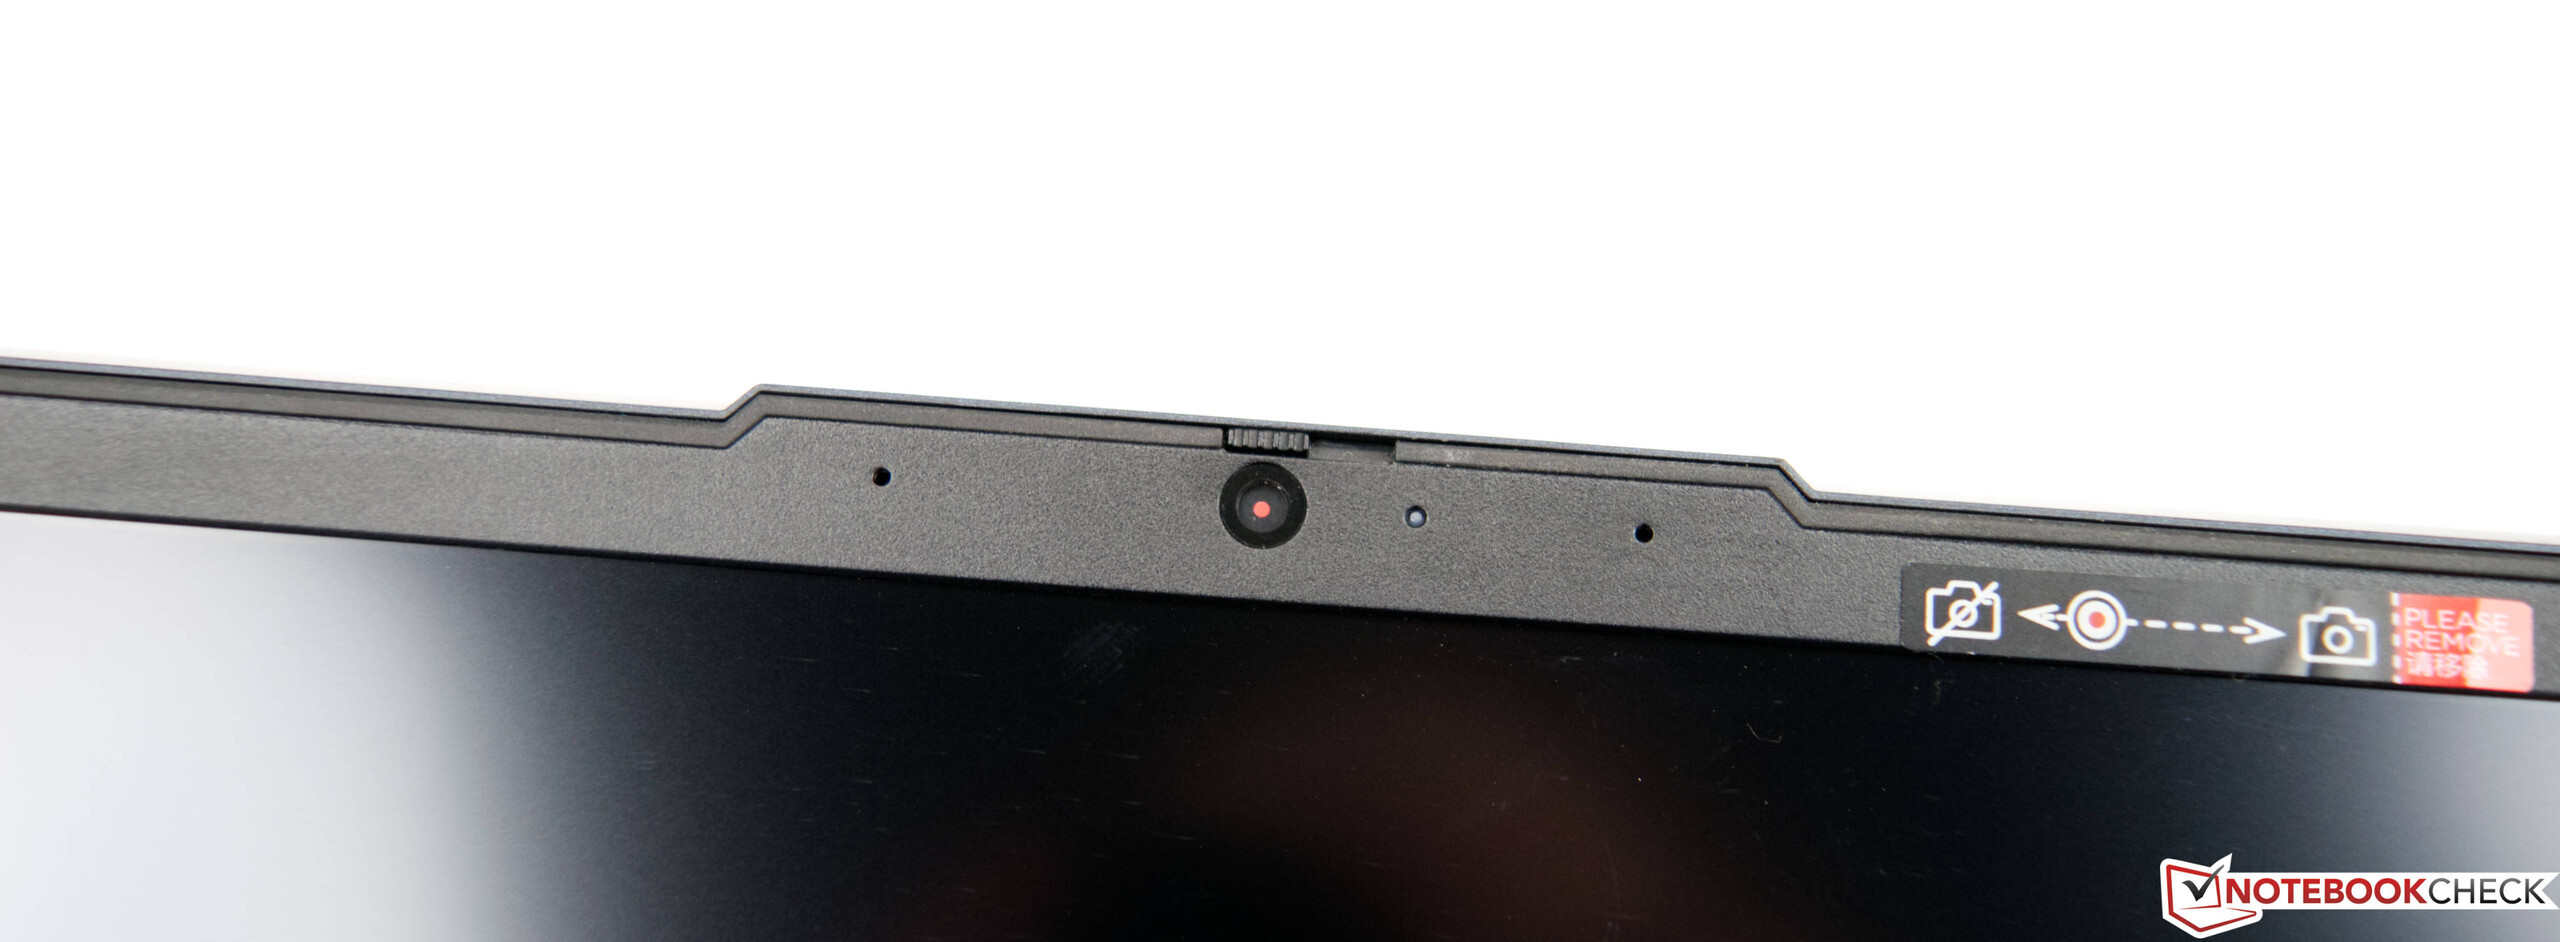
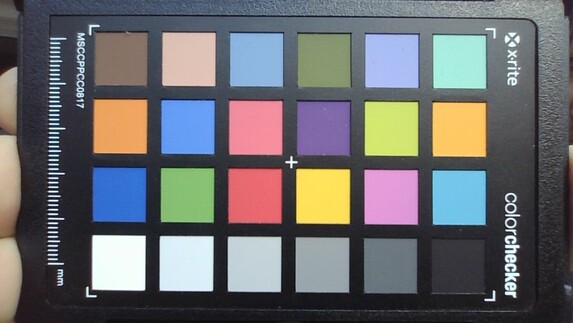
Webcam
There are barely any gaming laptops with good webcam quality out there. Consequently, the Lenovo Legion 5 17 is lacking in terms of color accuracy and sharpness, as the pictures show.


Accessories
The scope of delivery includes a 300-watt AC adapter that weighs close to 1 kg (~2.2 lbs) and a few pamphlets.
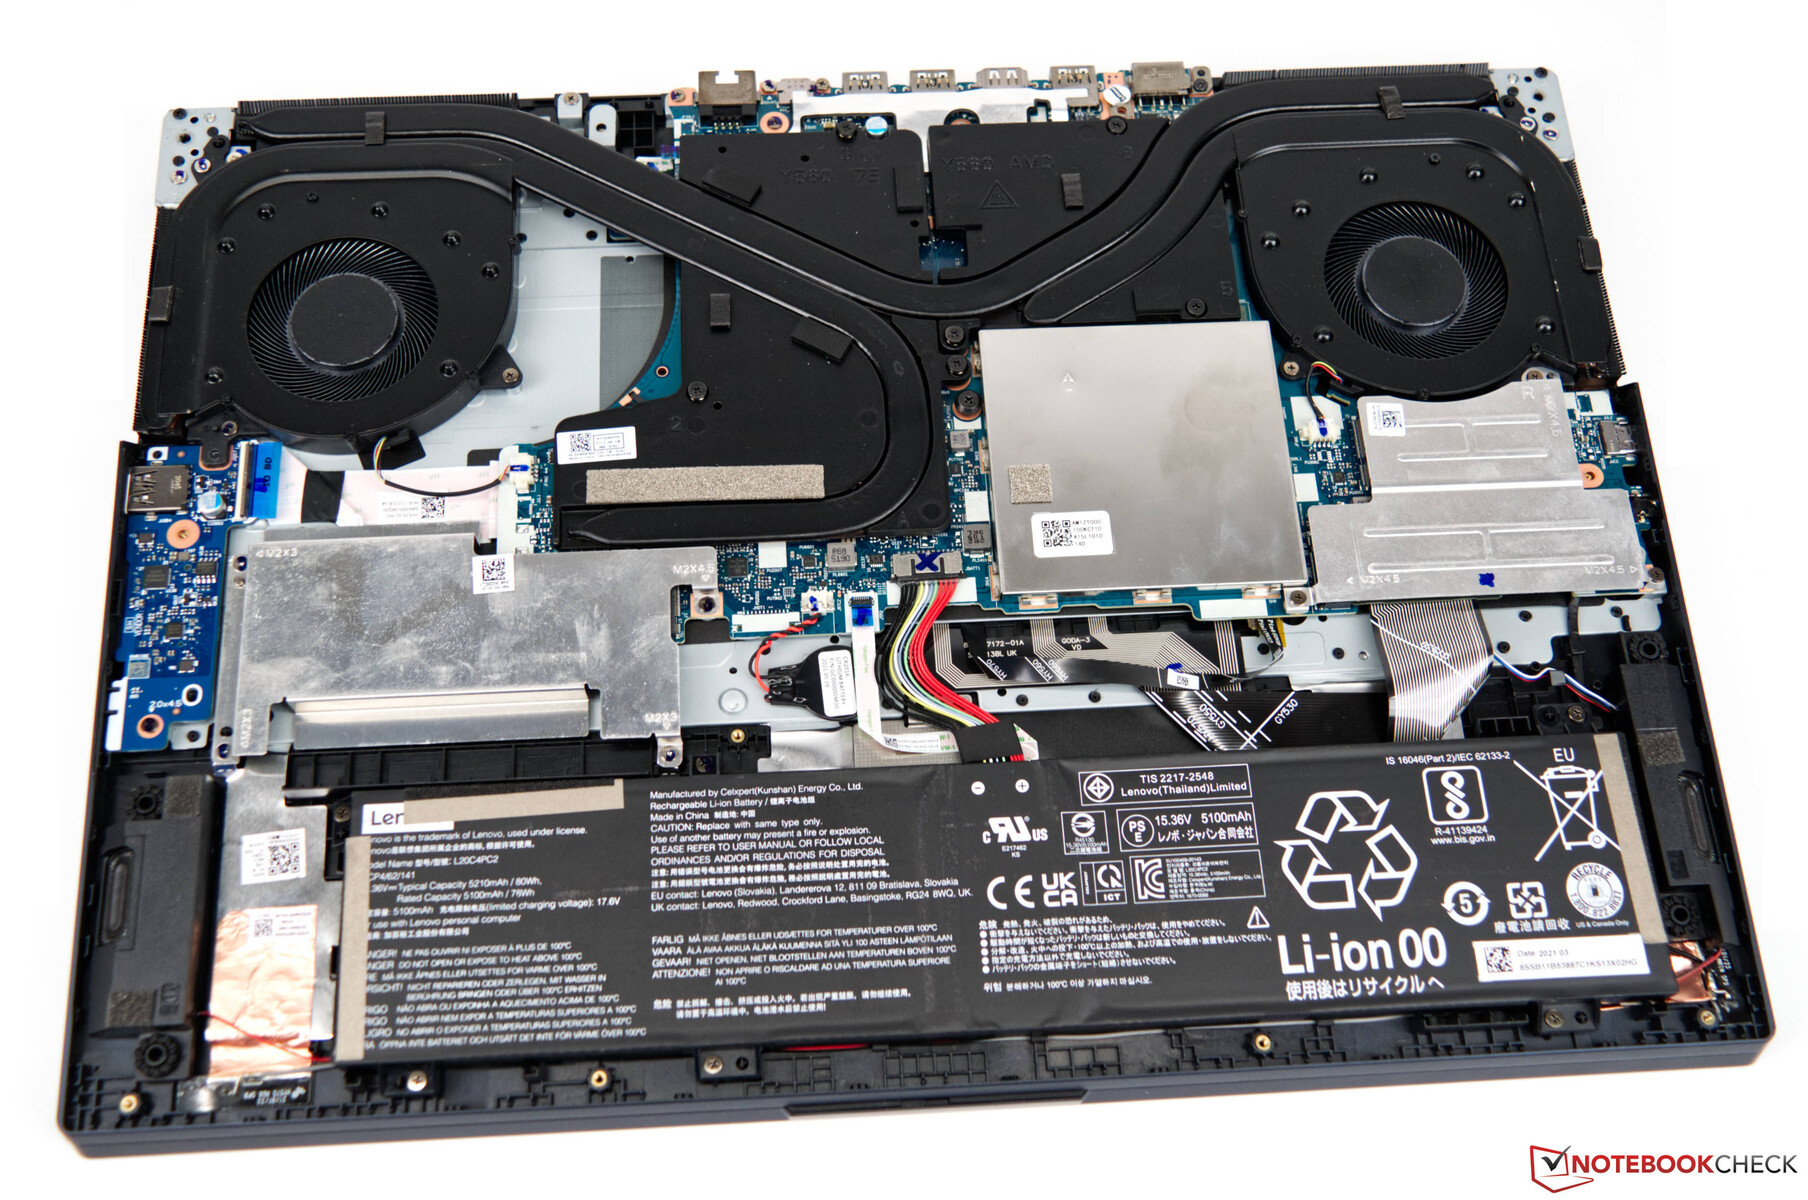
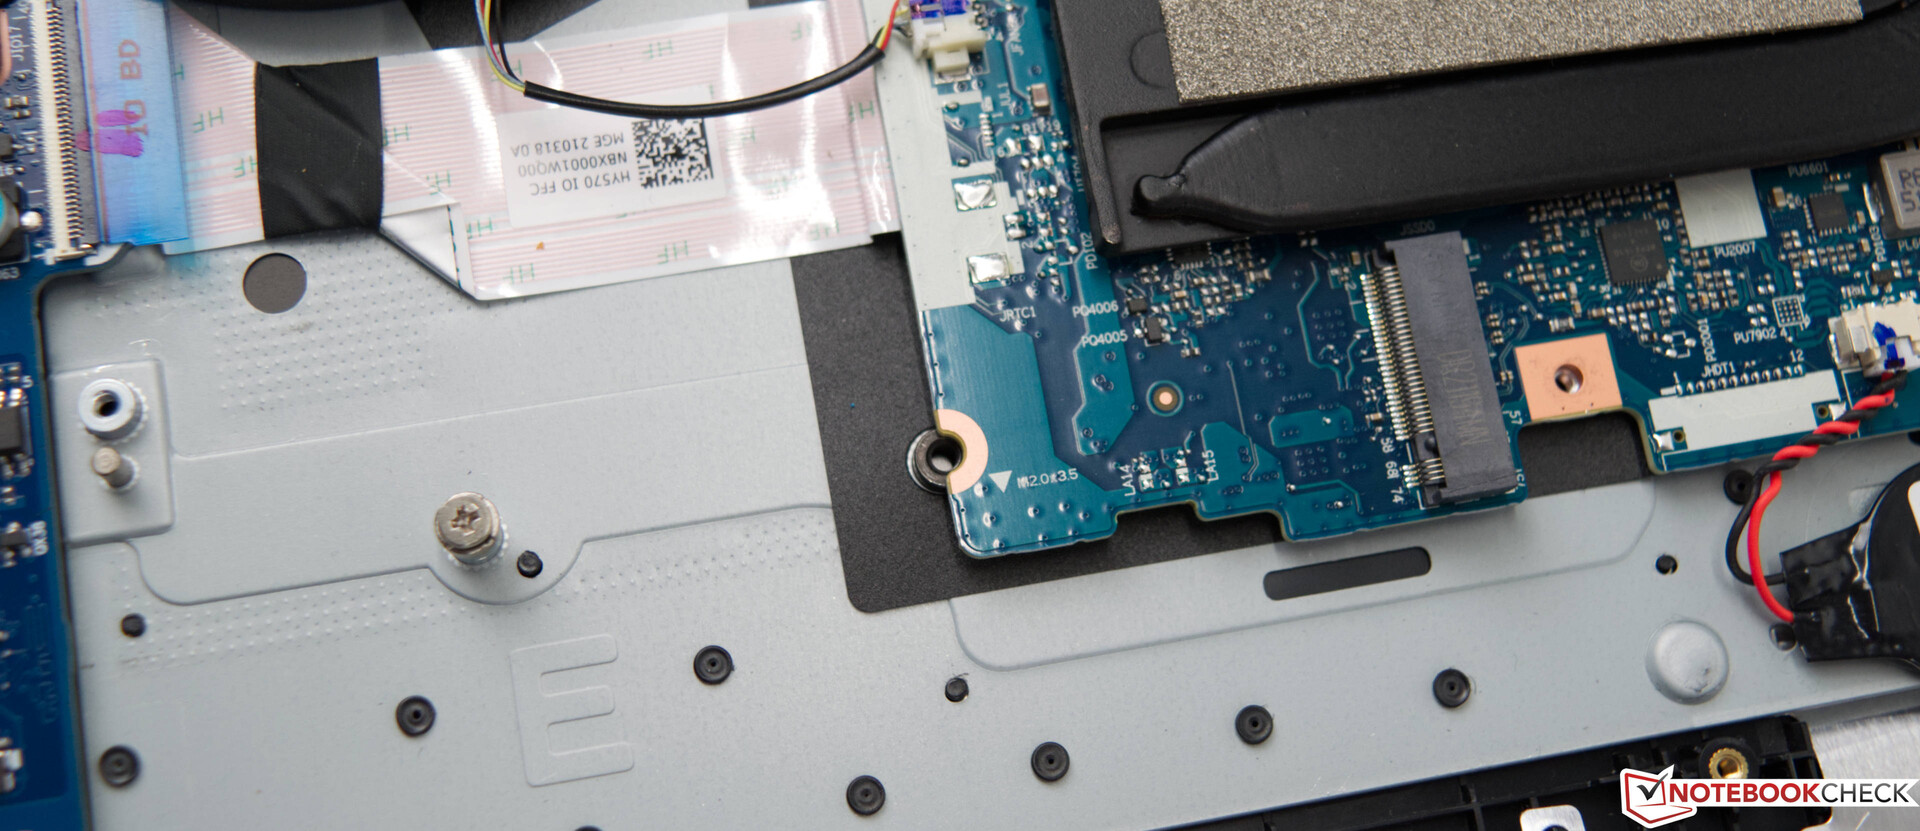
Mainetenance
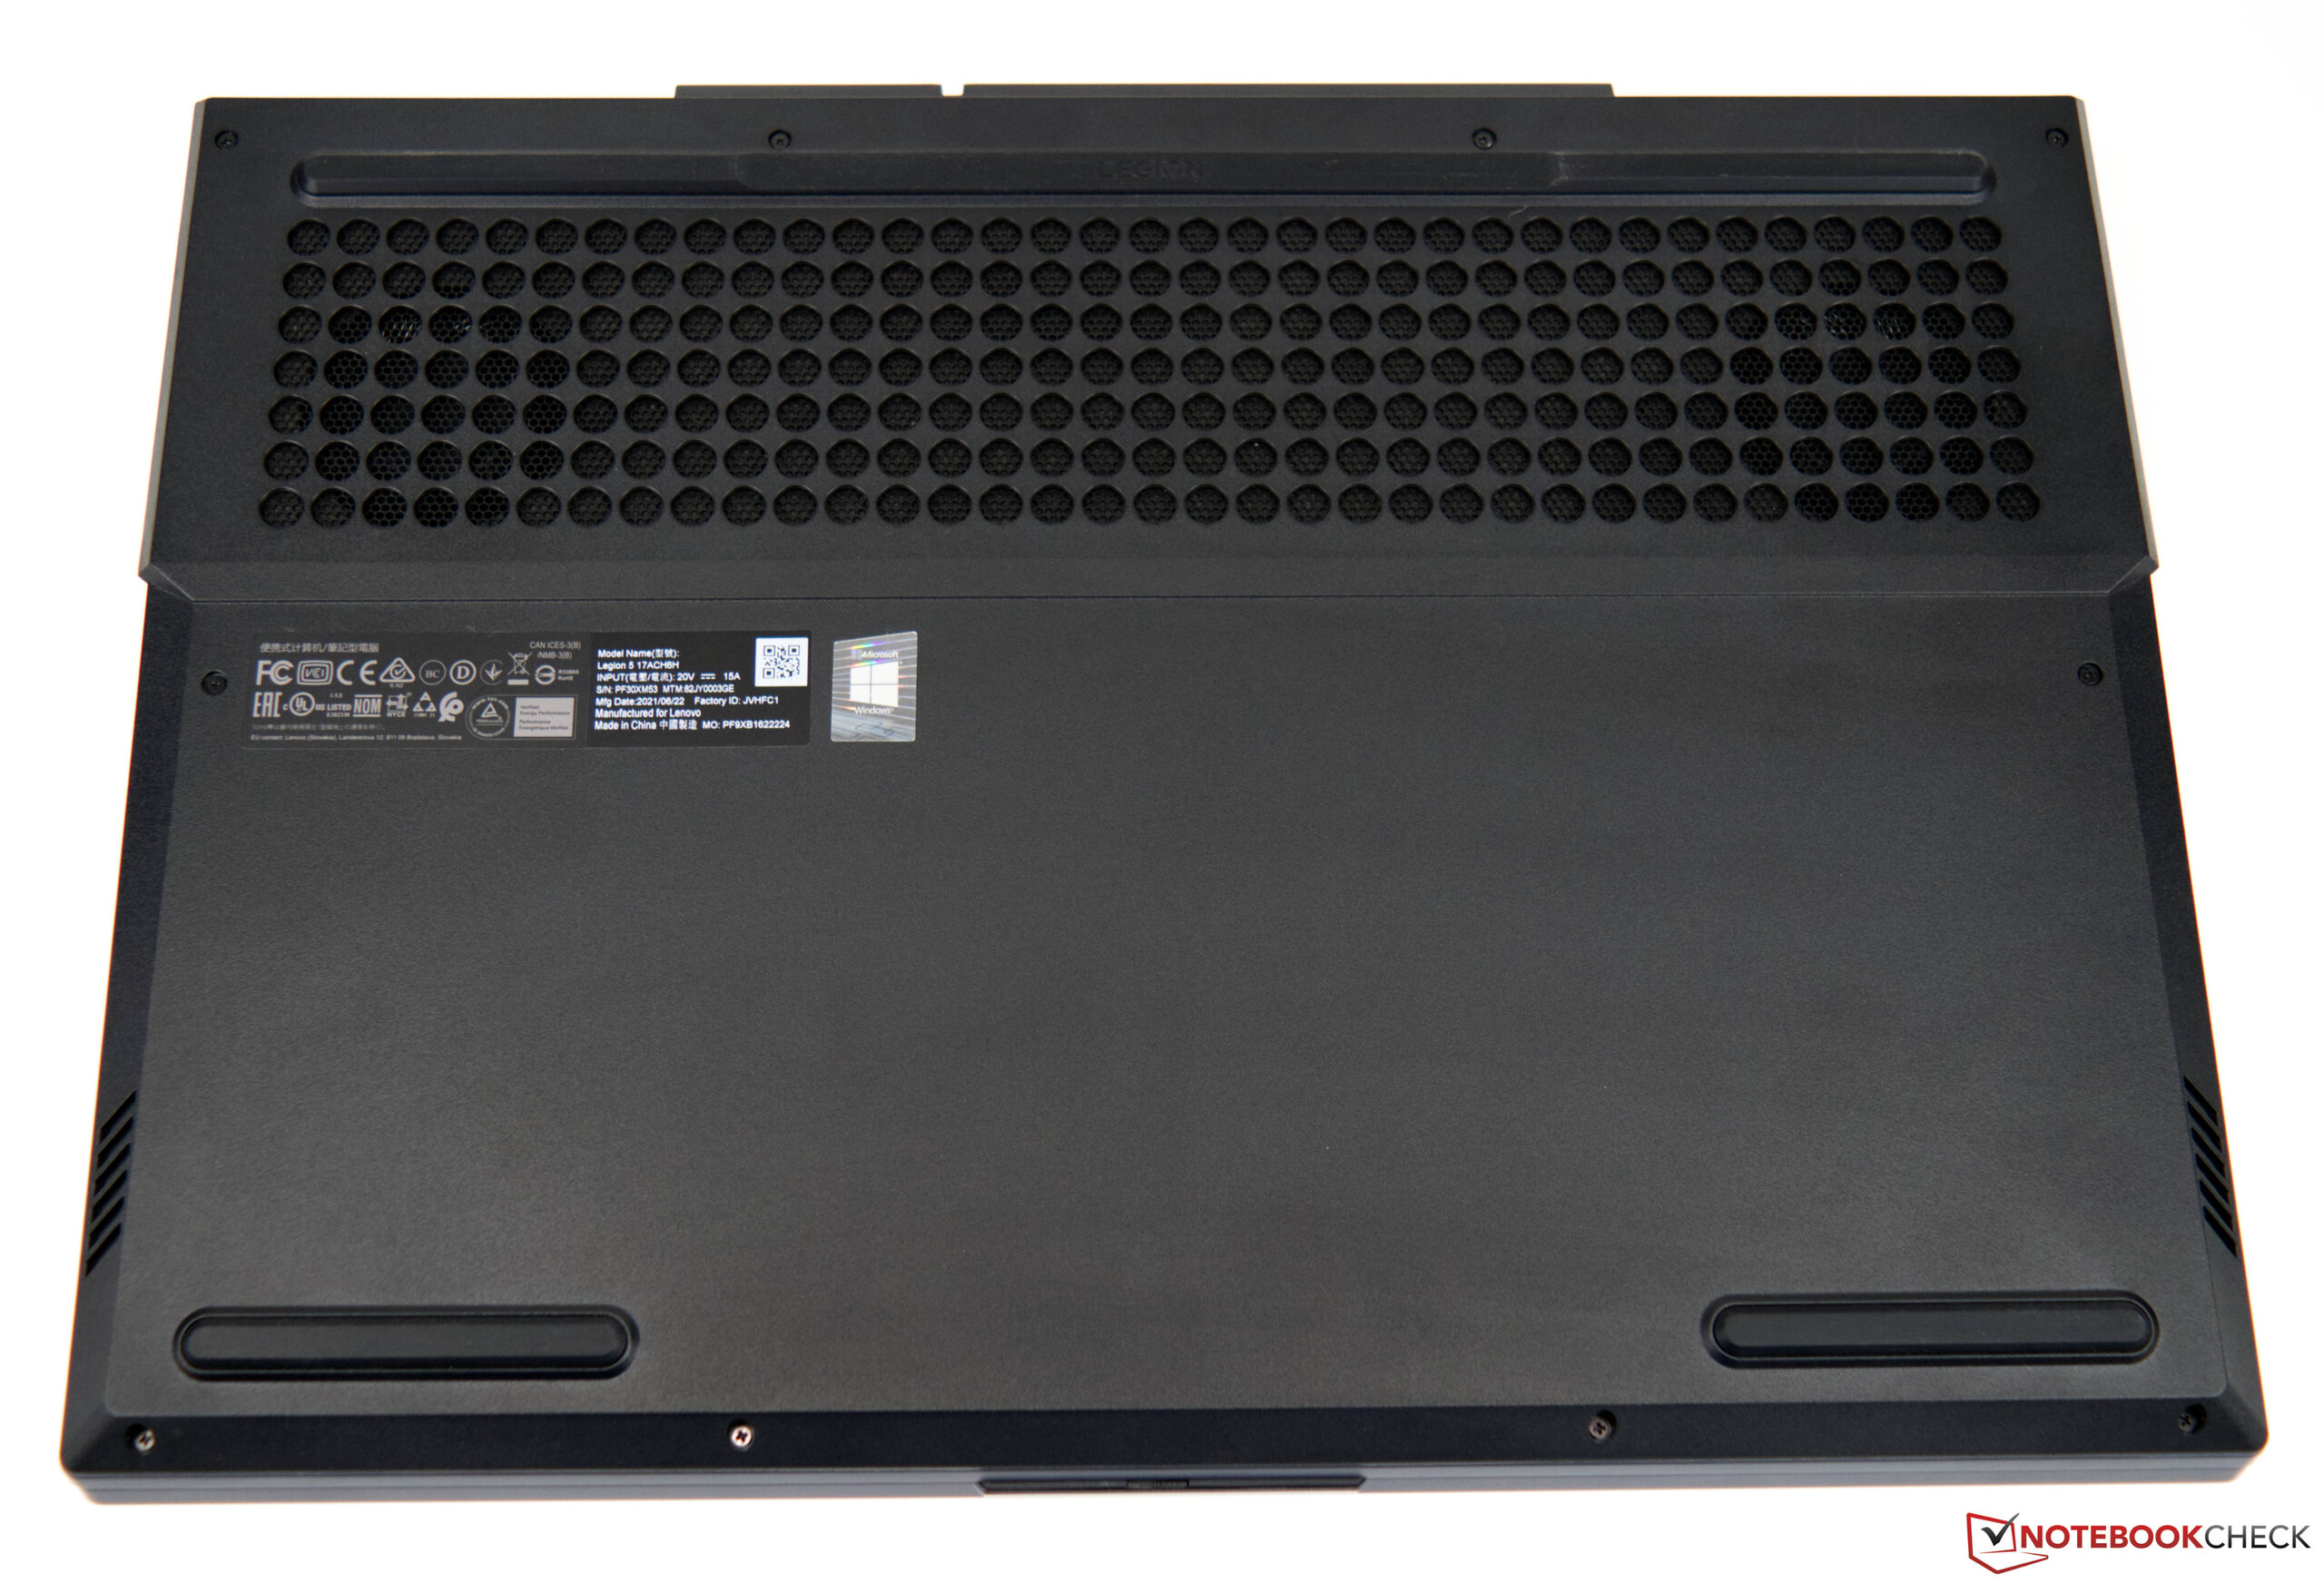
The bottom plate has to be removed for users to access the components. Using appropriate tools to prevent accidentally damaging the laptop is recommended. An additional cover protects both RAM modules and the two SSD slots. The 80-Wh battery and the cooling solution, which consists of three heatpipes and two fans, take up the majoriity of the room.
Warranty
Lenovo offers a 1-year depot or carry-in base warranty with warranty extension options when purchasing from its online shop.
Input Devices
Keyboard
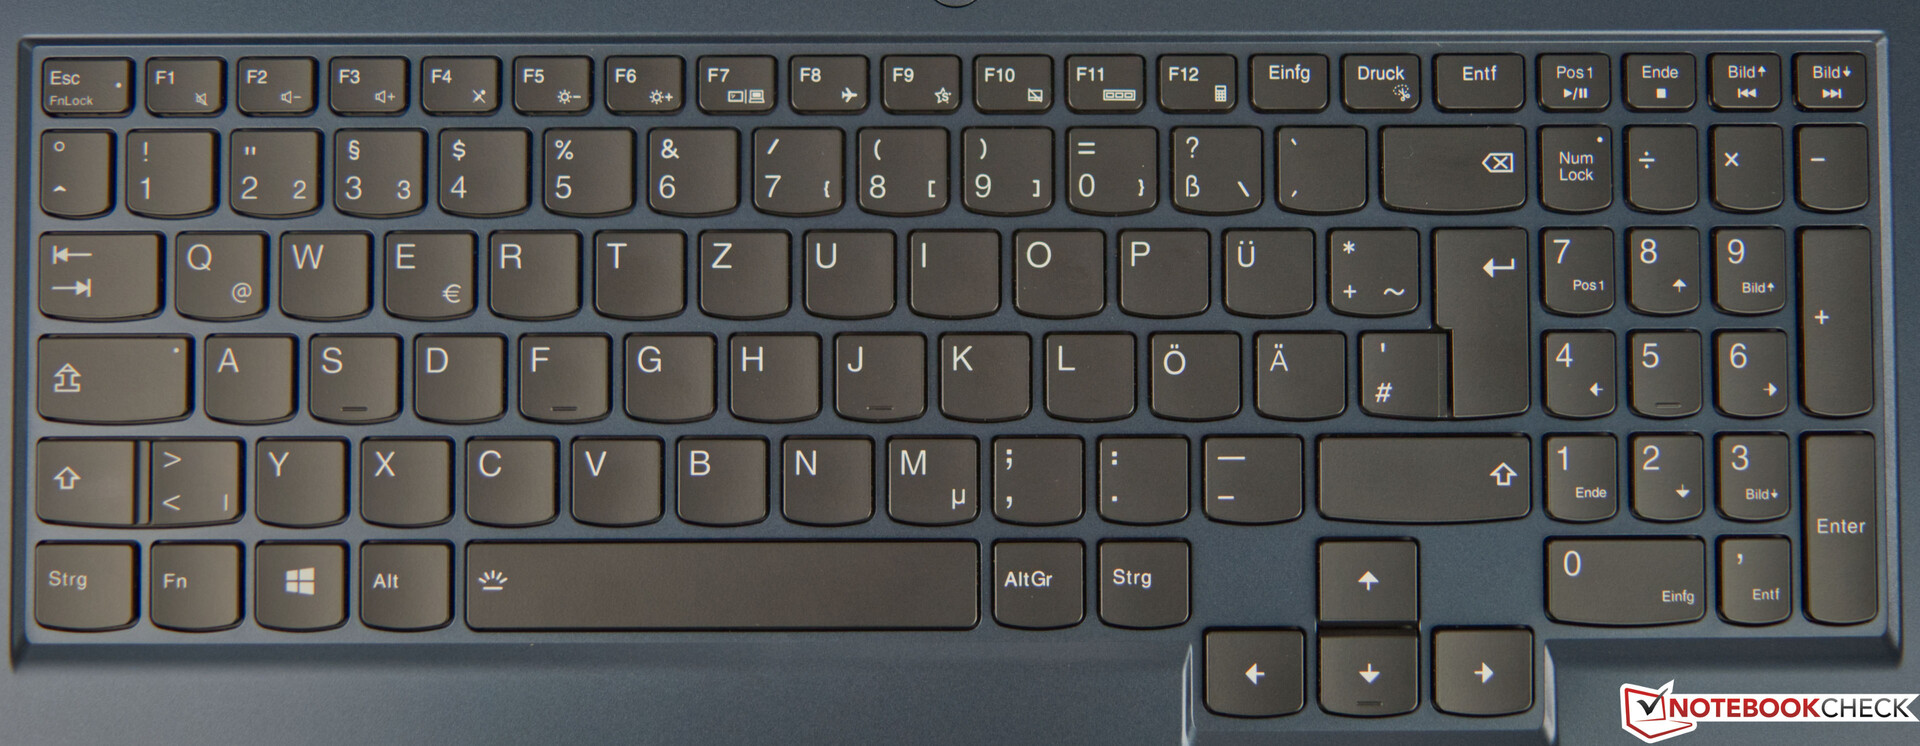
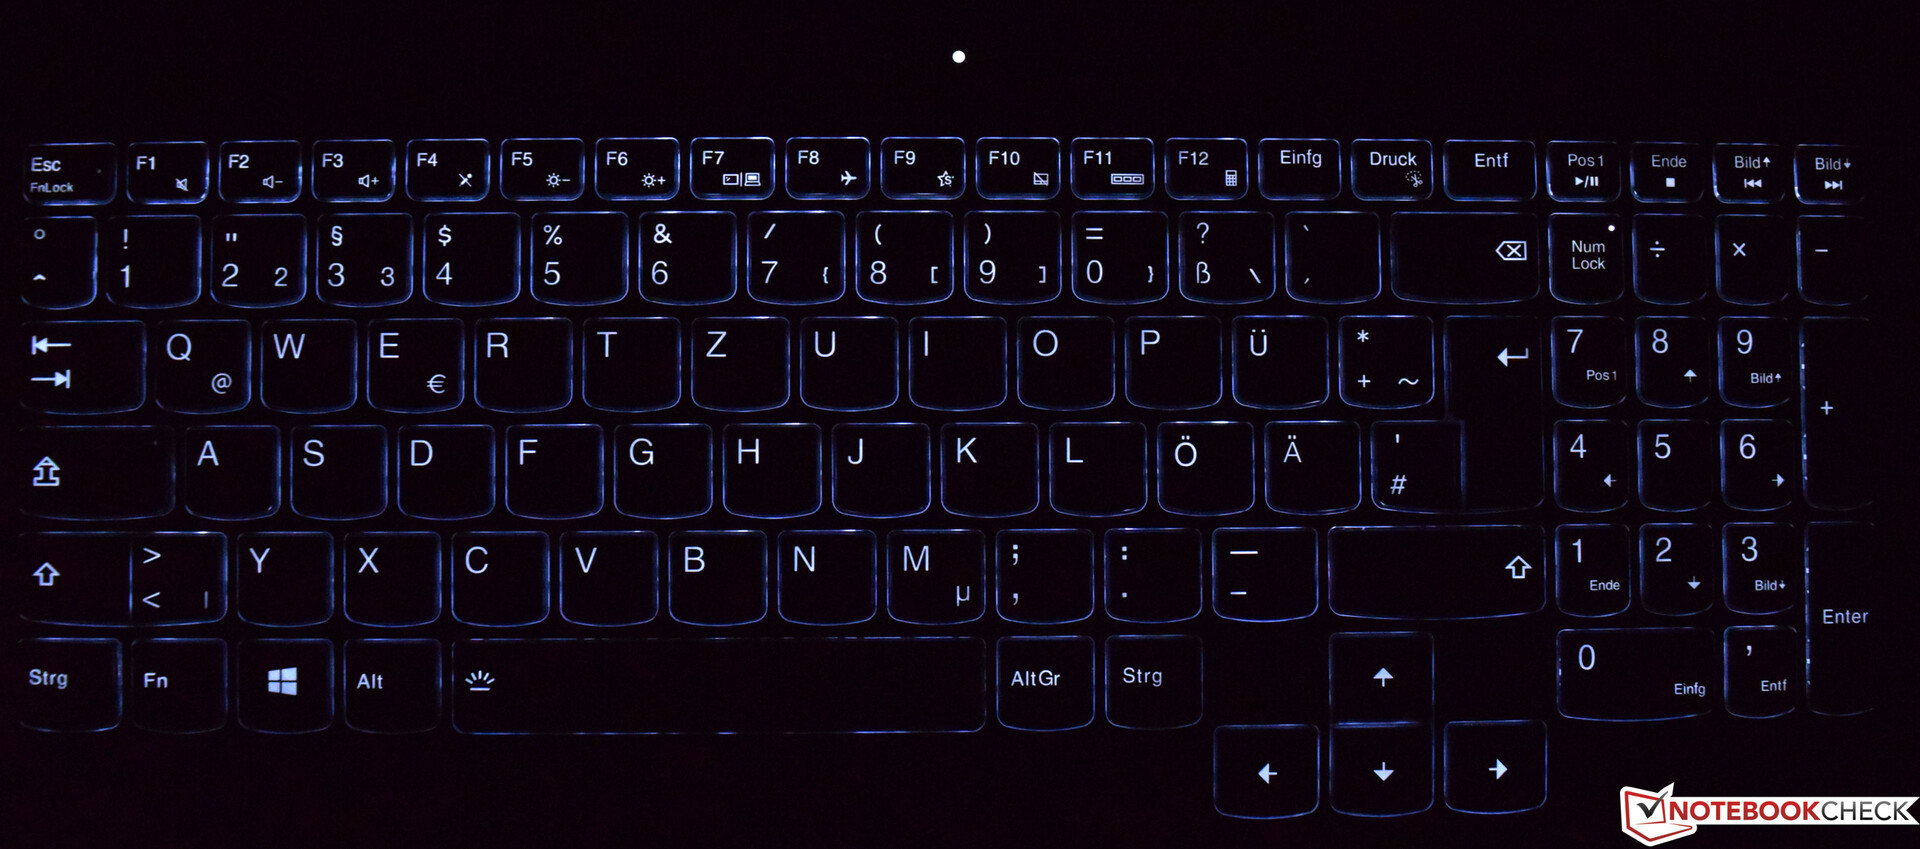
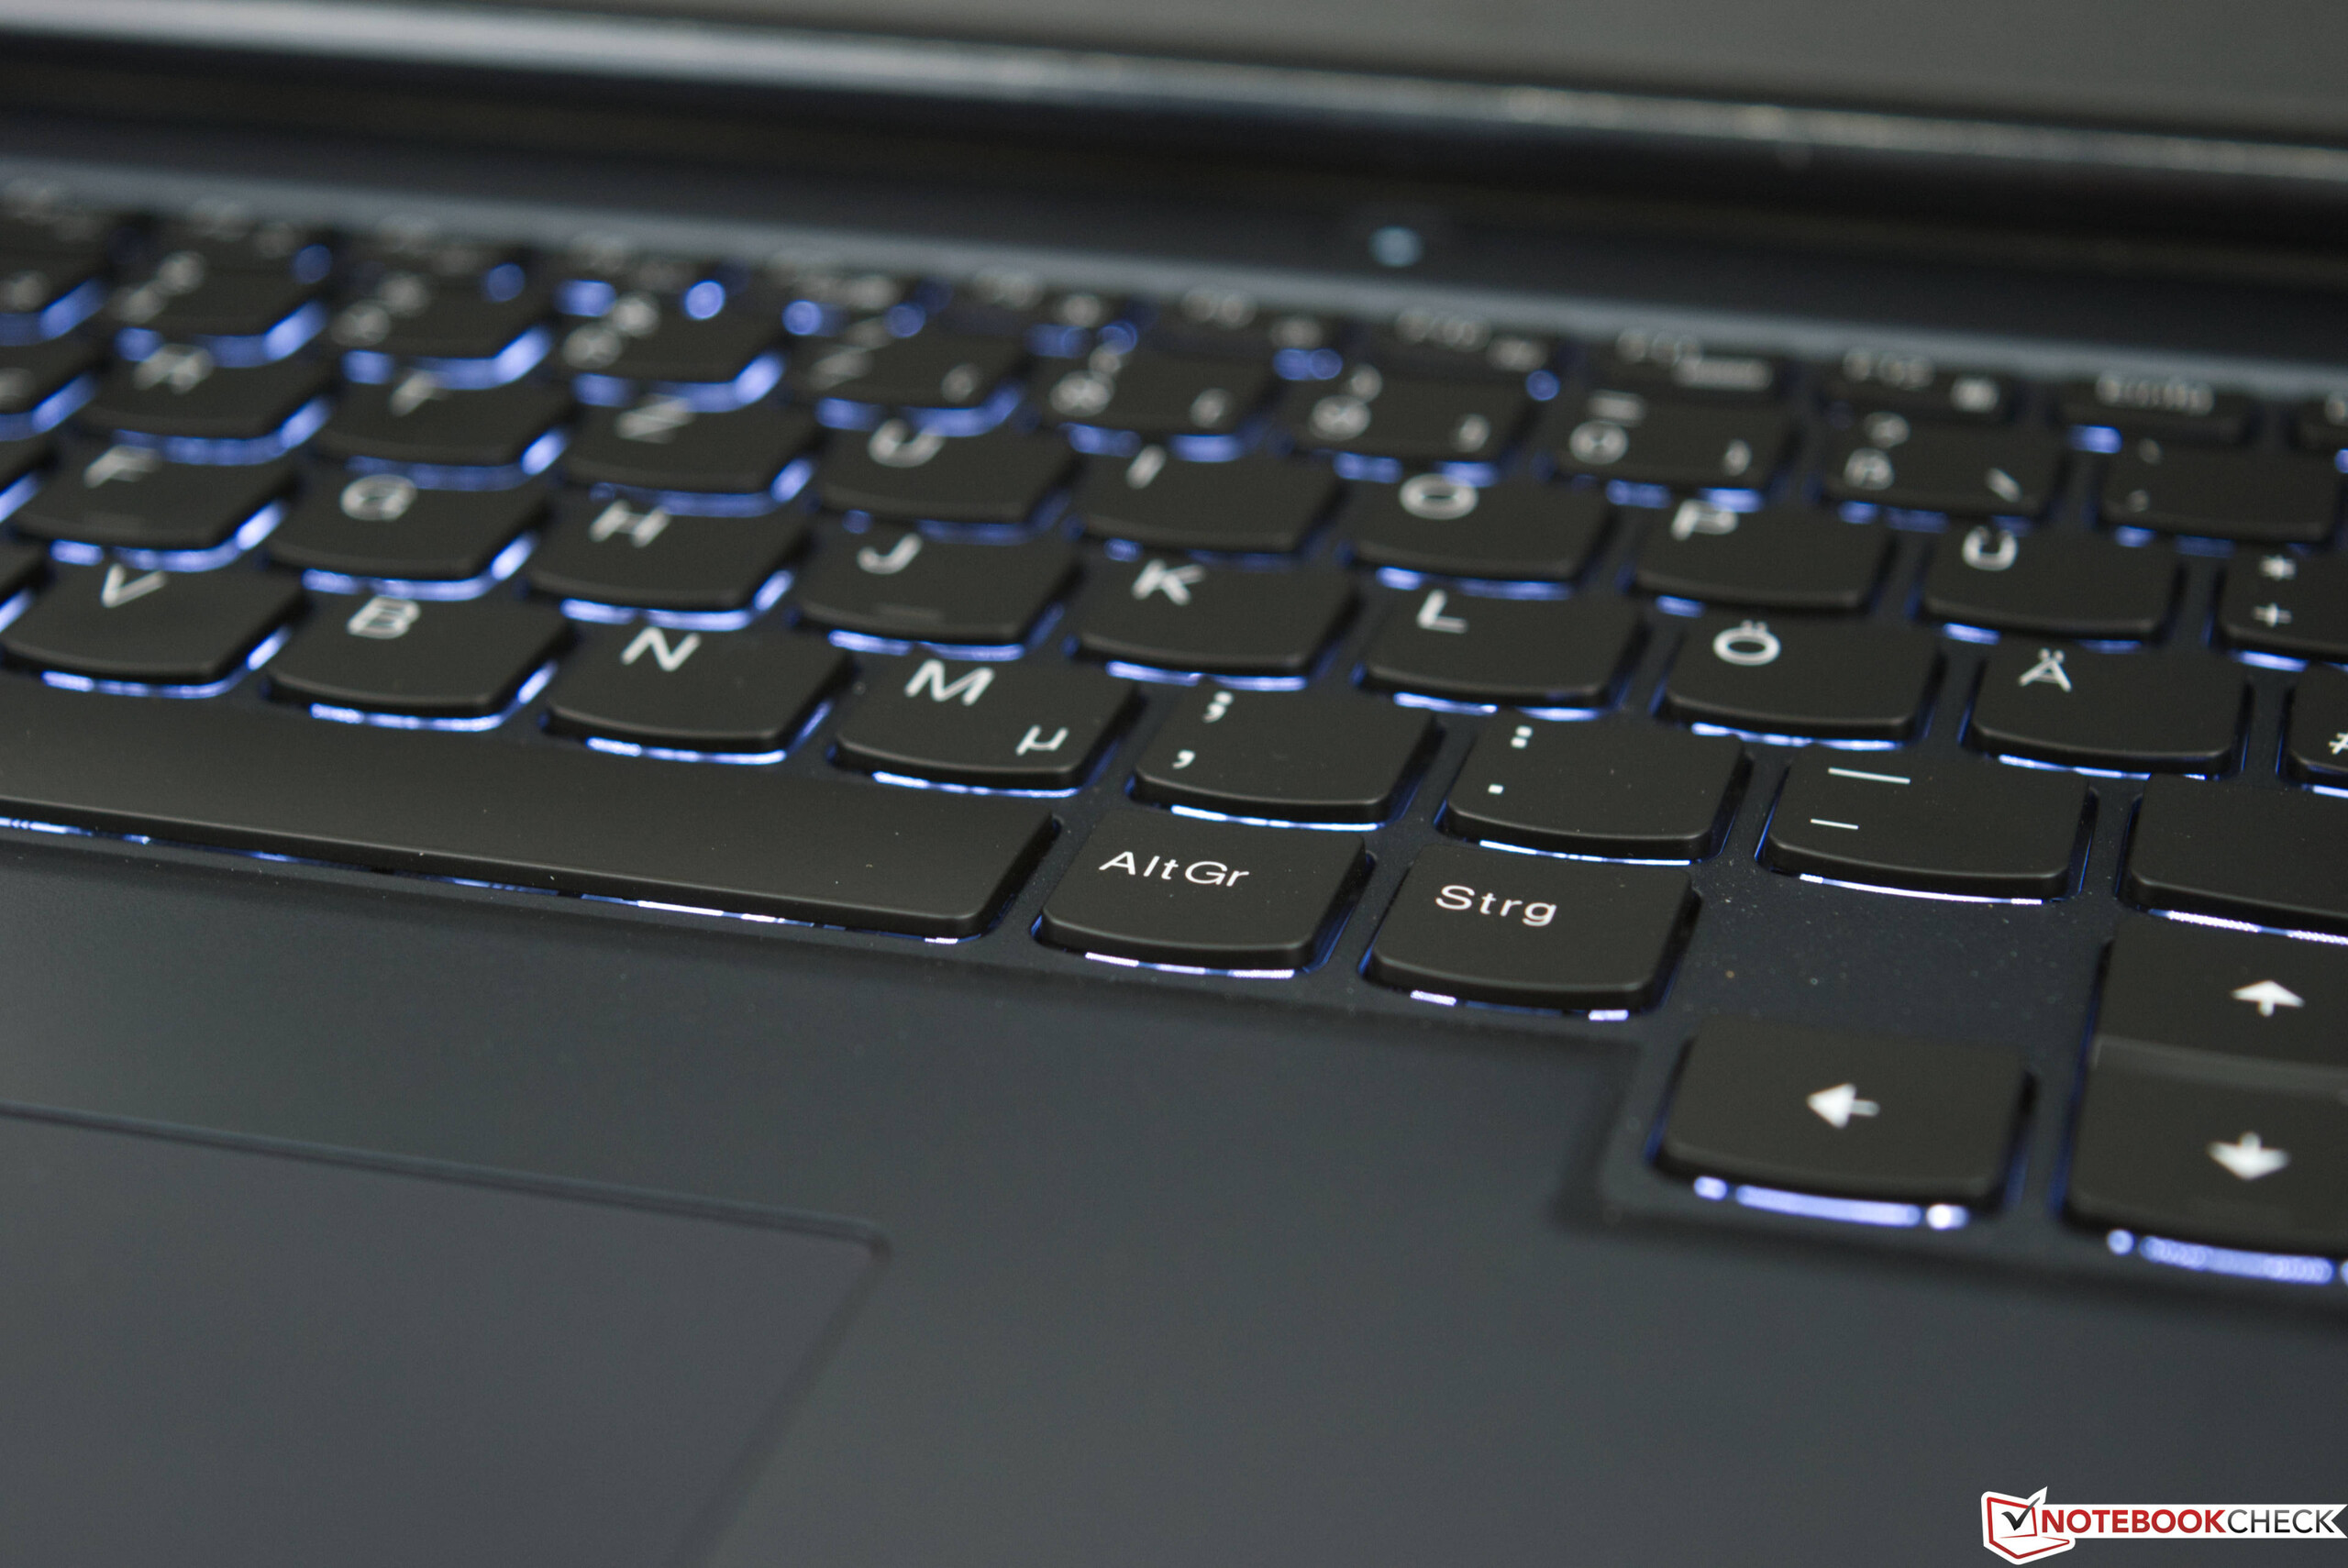
Lenovo equips the Legion 5 17 with a 6-row chiclet keyboard with subtle backlighting and two brightness levels. If desired, the backlight can also be disabled entirely. The keys are sufficiently large and the arrow keys are normal sized. The shallow travel of just 1.5 mm is accompanied by a somewhat dull feedback and a distinct actuation point. As a result, the keys do not feel spongy.
Touchpad
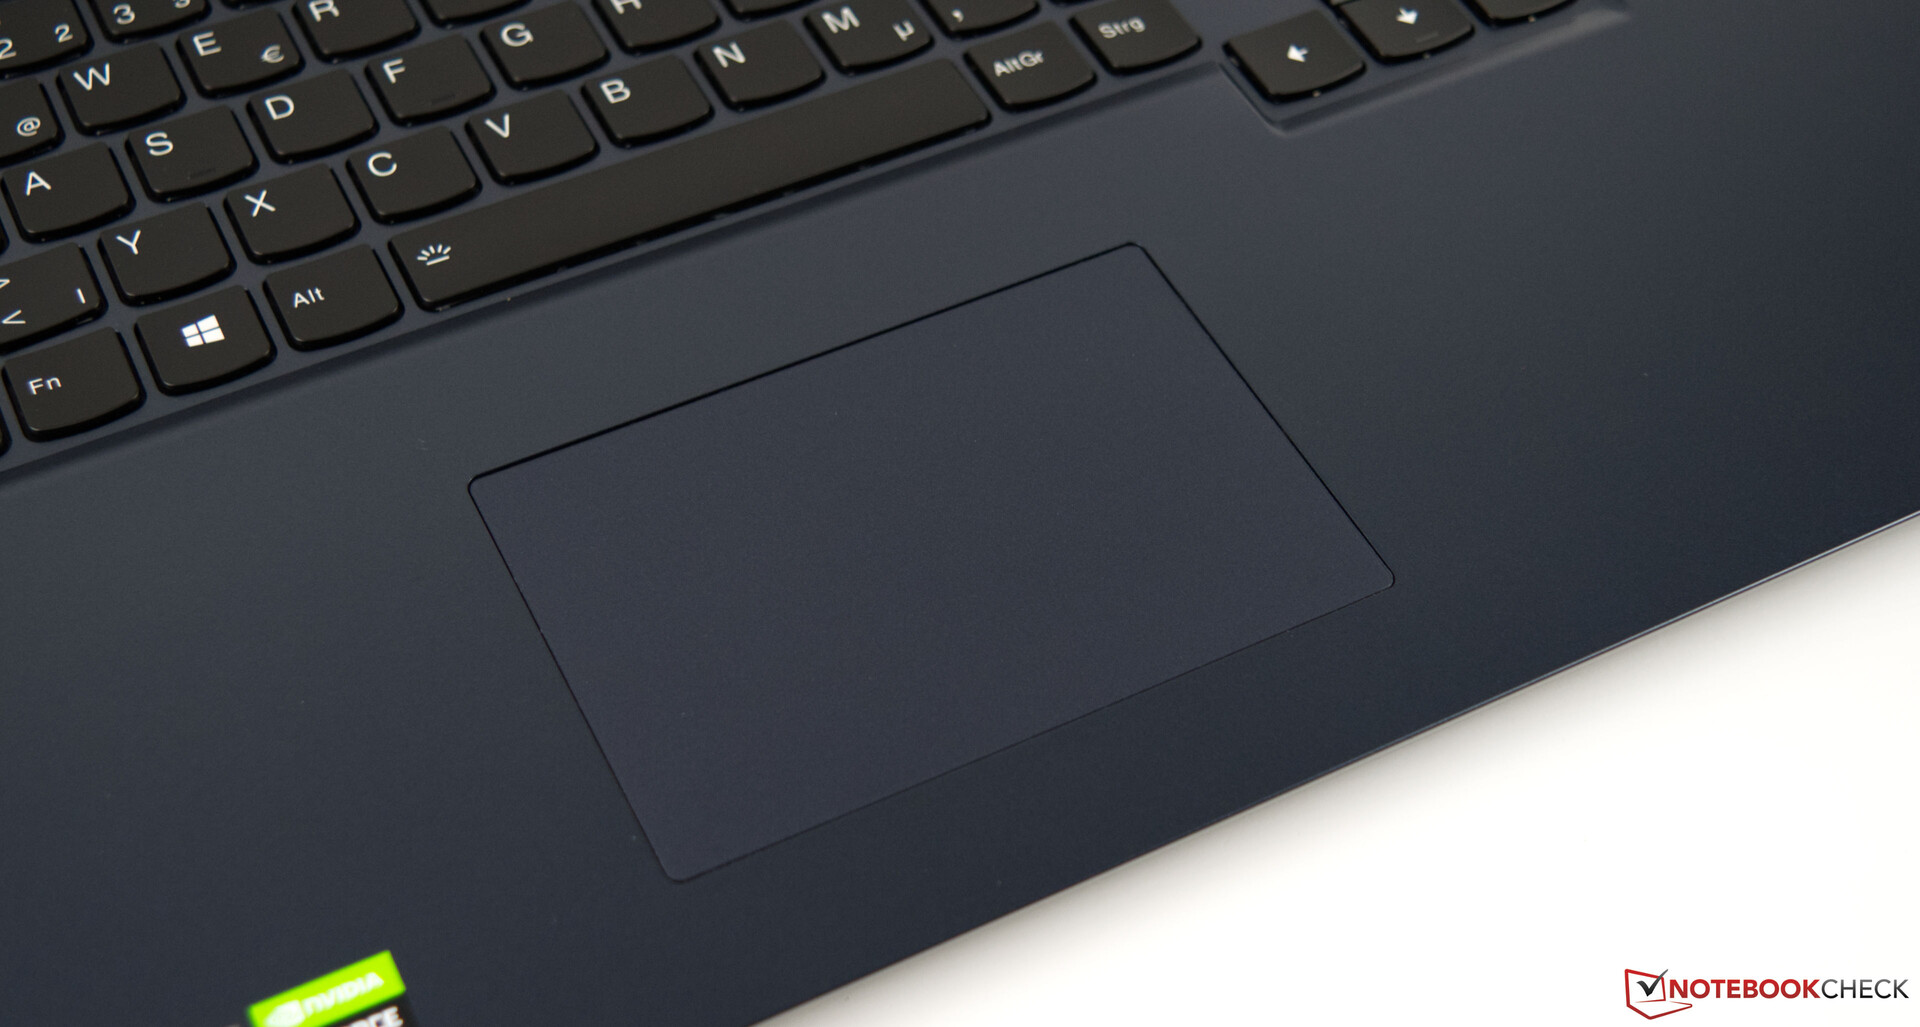
The integrated touchpad occupies an area of 7 x 10.5 cm (2.8 x 4.1 in) and looks somewhat lost on the large palm rest. The smooth surface is very responsive and responds very quickly to inputs. We did not encouter inconsistent behavior from any area of the touchpad of our test unit. The two buttons are located on the bottom and produce a distinct audible click when pressed. We find the position of the touchpad to be slightly too far towards the left. We would often accidentally press the right mouse button instead of the left one during daily use.
Display - 144 Hz and No PWM
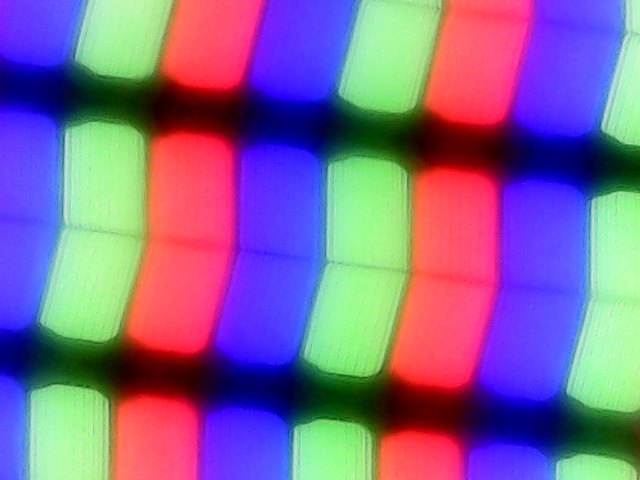

The Lenovo Legion 5 17 comes with a matte Dolby Vision panel and a 144-Hz refresh rate. The 17-inch display has a native resolution of 1920 x 1080 pixels for a pixel density of 127 PPI. Alternatively, the Legion 5 17 is also available with a traditional 60-Hz panel.
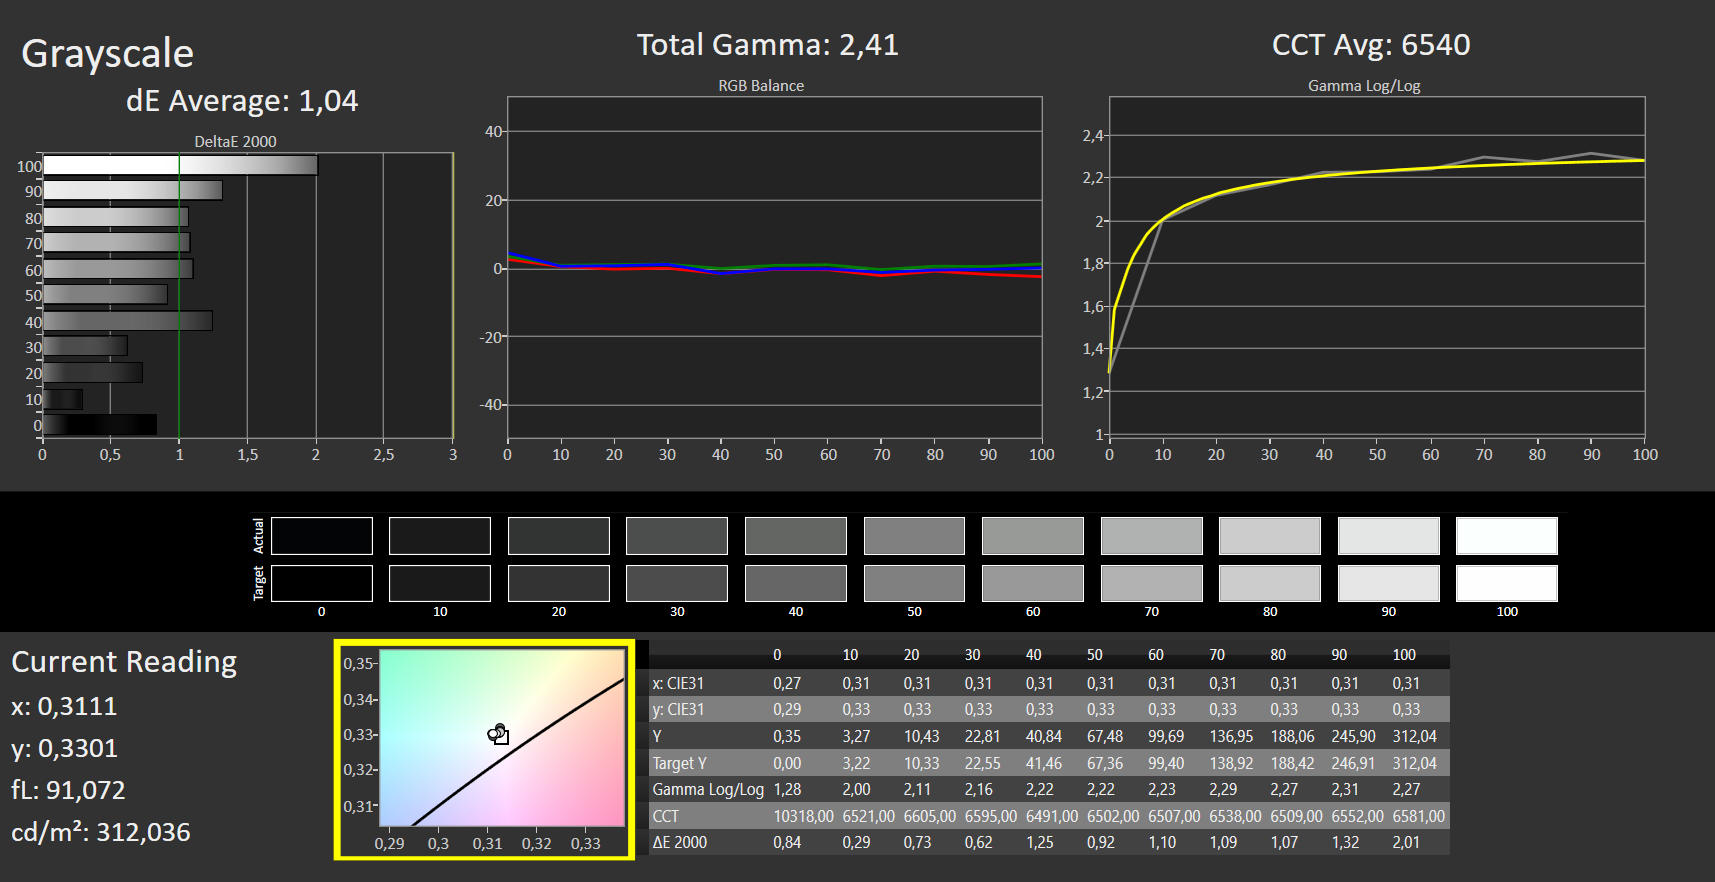
We were able to confirm the advertised brightness of the panel with our own measurements. With 305 nits, it only slightly exceeds the promised value (300 nits). The contrast ratio of 1292:1 matches our expectations for an IPS panel. However, competitors cannot quite keep up due to their slightly worse black values.
Users of the Lenovo Legion 5 17 will not have to worry about PWM eye strain, since it does not rely on PWM for controlling the display's brightness. Unfortunately, our test device suffers from backlight bleeding. During dark scenes, there is significant screen bleeding around the edges.
| |||||||||||||||||||||||||
Brightness Distribution: 89 %
Center on Battery: 325 cd/m²
Contrast: 1292:1 (Black: 0.25 cd/m²)
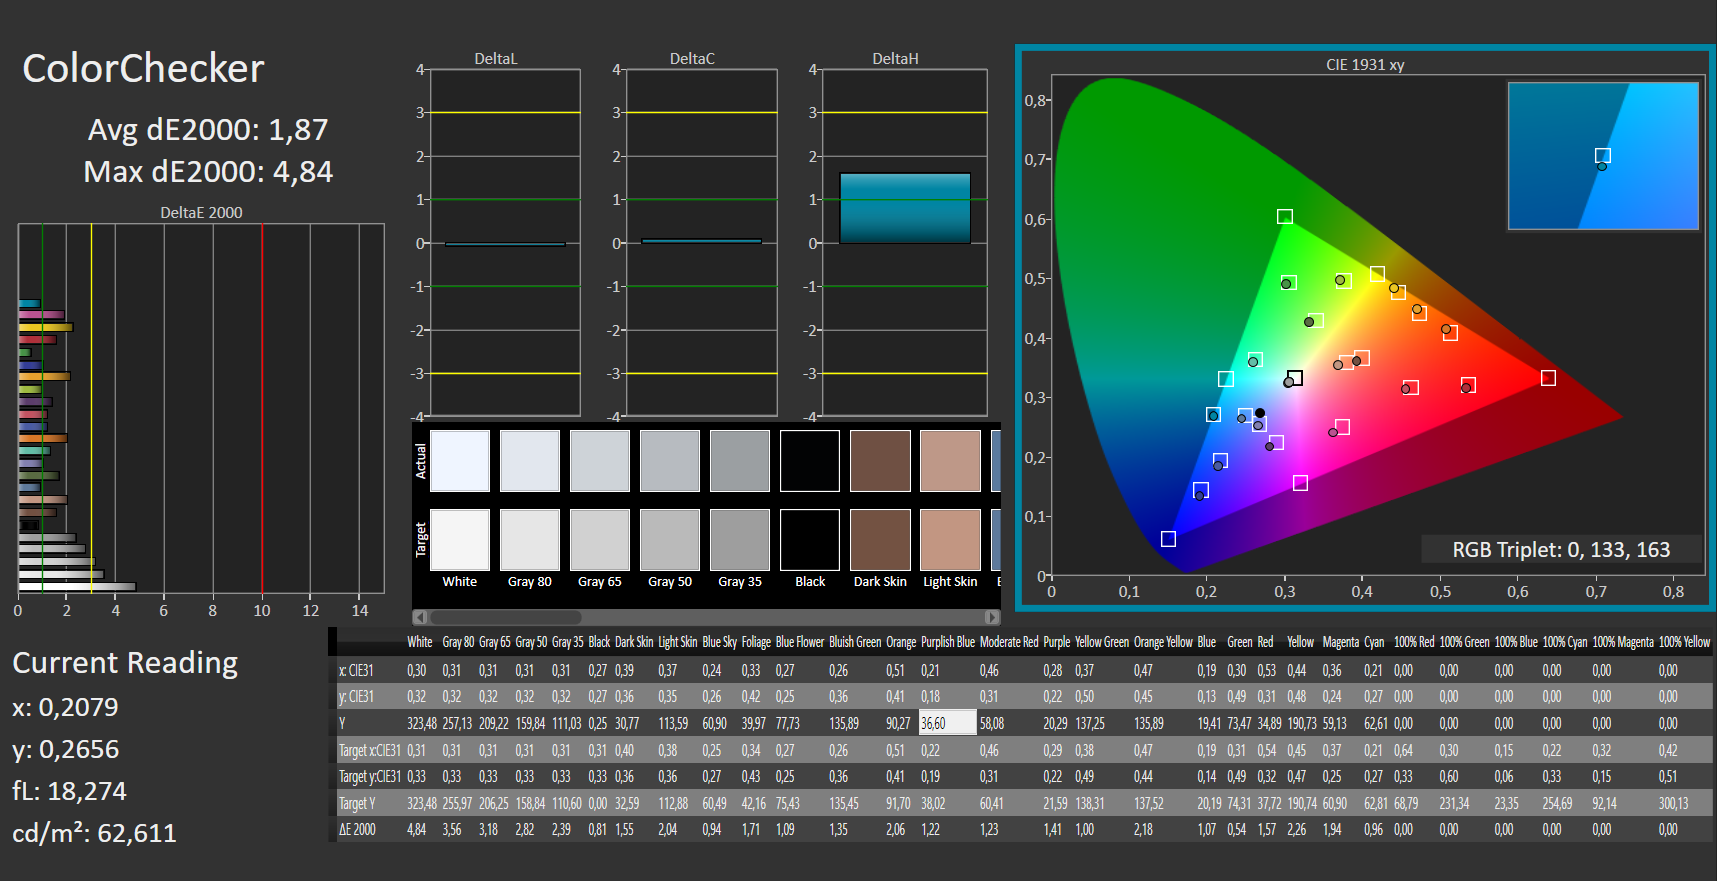
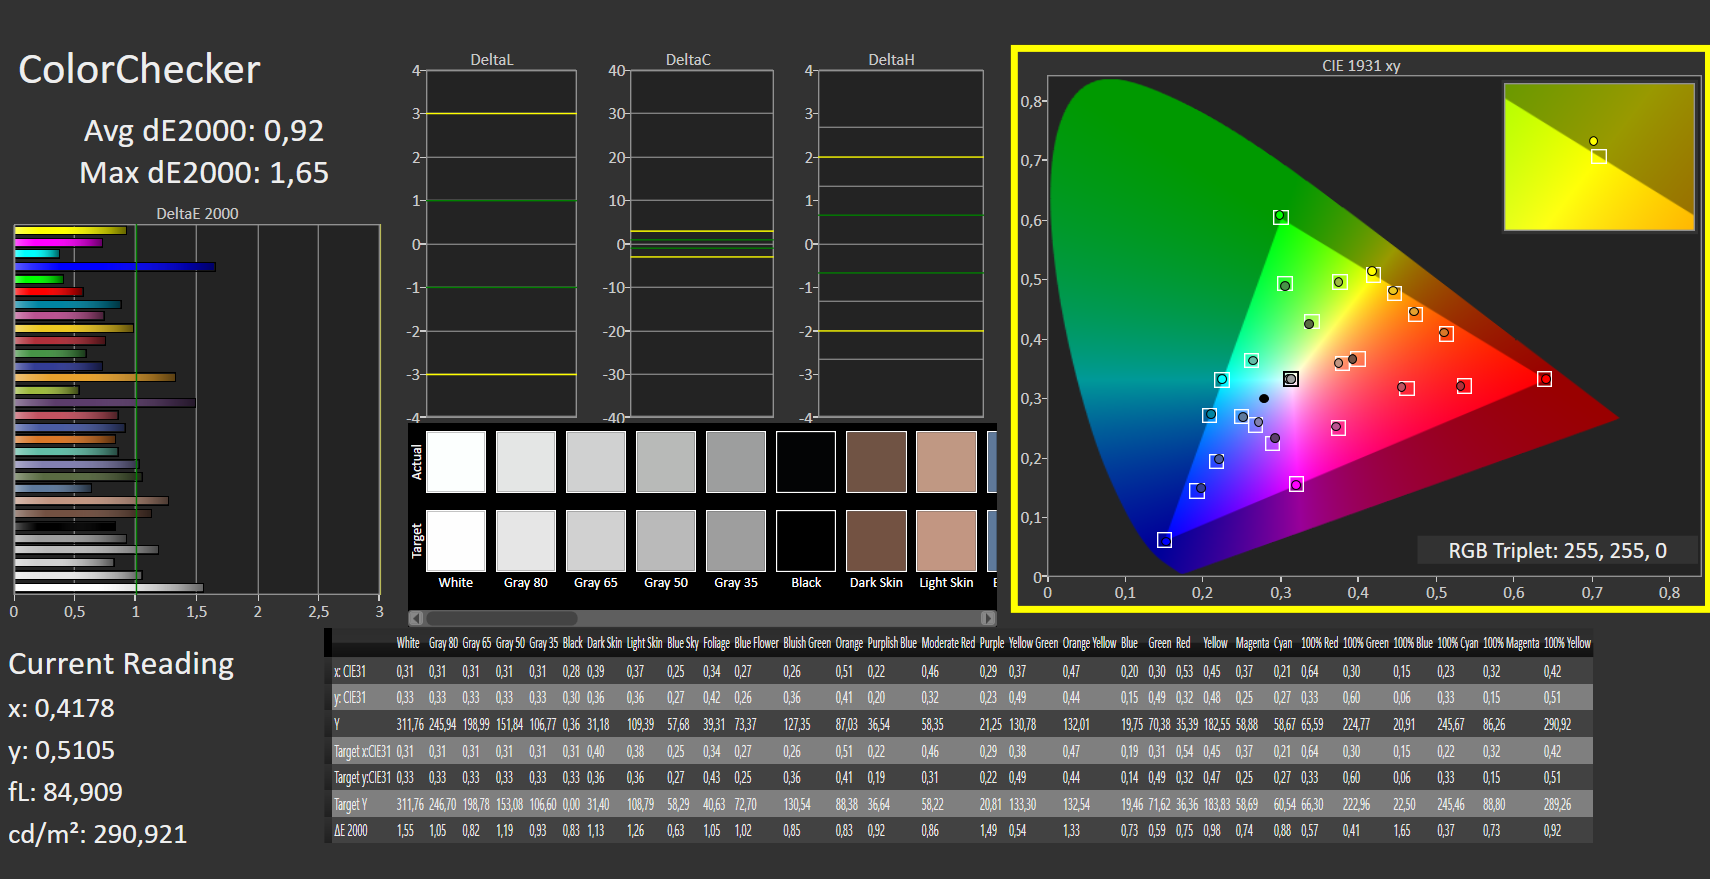
ΔE Color 1.87 | 0.5-29.43 Ø5, calibrated: 0.92
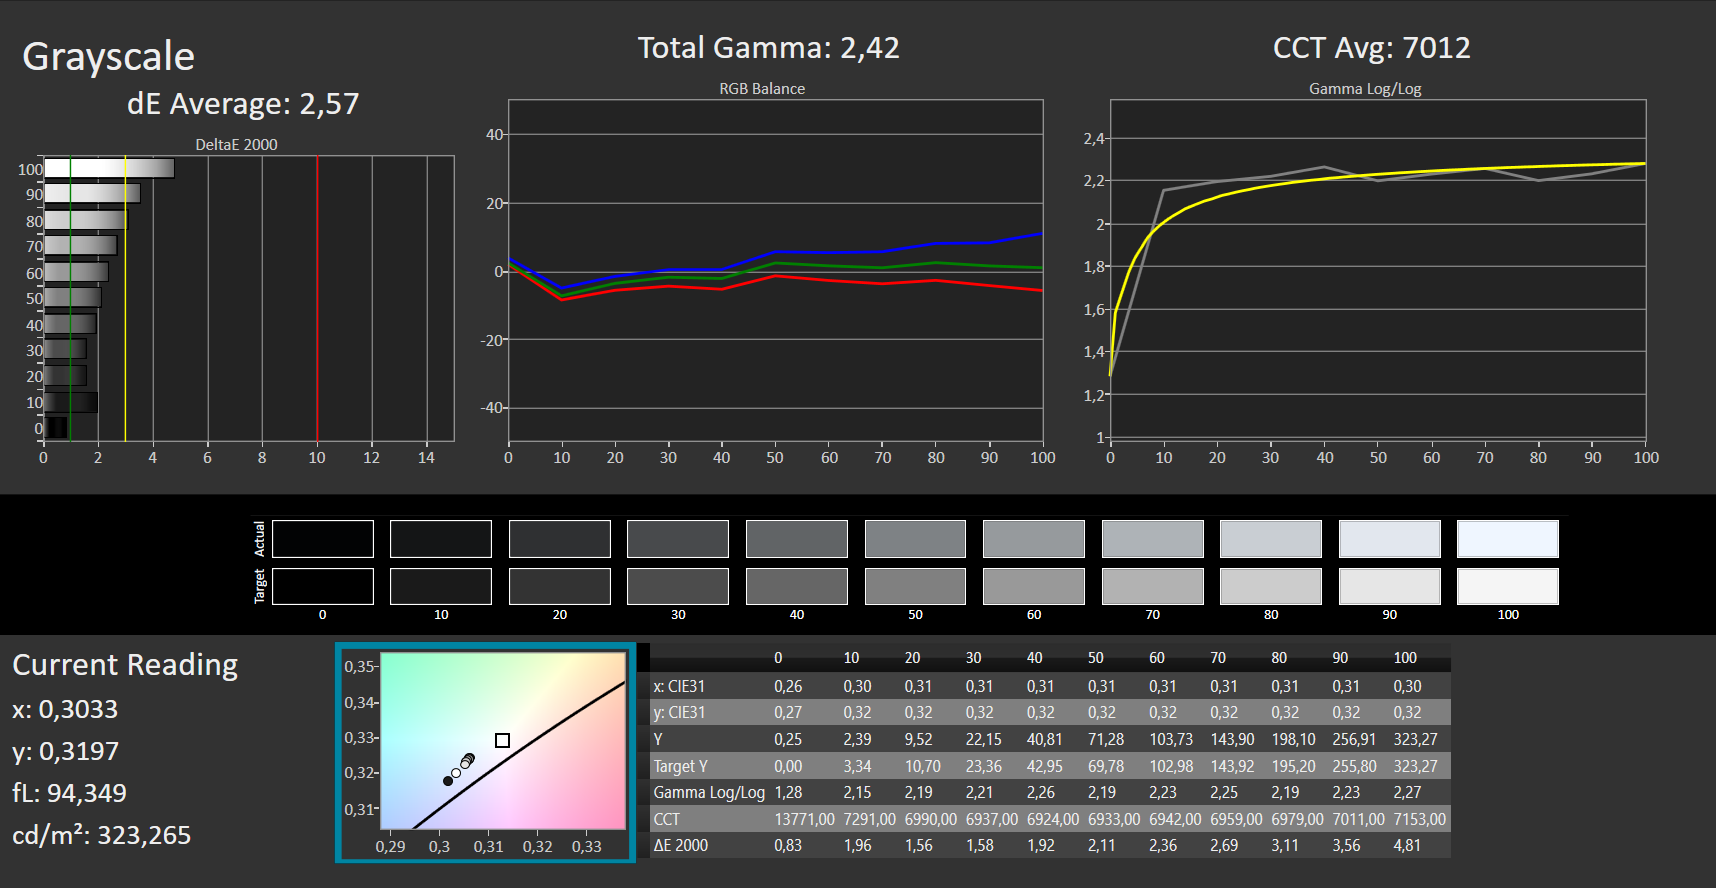
ΔE Greyscale 2.57 | 0.57-98 Ø5.3
66.7% AdobeRGB 1998 (Argyll 2.2.0 3D)
97.2% sRGB (Argyll 2.2.0 3D)
64.8% Display P3 (Argyll 2.2.0 3D)
Gamma: 2.42
| Lenovo Legion 5 17ACH6H-82JY0003GE LEN173FHD, IPS, 1920x1080, 17.30 | SCHENKER XMG Core 17 (Early 2021) BOE CQ NE173QHM-NY2, IPS, 2560x1440, 17.30 | Asus TUF Gaming F17 FX706HM AU Optronics AUI8294 (B173HAN04.9), IPS, 1920x1080, 17.30 | MSI Katana GF76 11UE AU Optronics B173HAN04.9, IPS, 1920x1080, 17.30 | SCHENKER XMG Apex 17 M21 LG Philips LP173WFG-SPB3, IPS, 1920x1080, 17.30 | Gigabyte A7 X1 AU Optronics AUO8E8D, IPS, 1920x1080, 17.30 | |
|---|---|---|---|---|---|---|
| Display | 3% | -38% | -39% | -1% | -5% | |
| Display P3 Coverage | 64.8 | 68.1 5% | 40.1 -38% | 39.8 -39% | 65 0% | 61.5 -5% |
| sRGB Coverage | 97.2 | 98.5 1% | 60 -38% | 59.5 -39% | 95.9 -1% | 90.9 -6% |
| AdobeRGB 1998 Coverage | 66.7 | 69.3 4% | 41.4 -38% | 41.12 -38% | 65.8 -1% | 63.2 -5% |
| Response Times | -12% | -133% | -167% | -9% | -14% | |
| Response Time Grey 50% / Grey 80% * | 15 ? | 16.8 ? -12% | 32.4 -116% | 36.8 ? -145% | 15.2 ? -1% | 16 ? -7% |
| Response Time Black / White * | 9 ? | 10 ? -11% | 22.4 -149% | 26 ? -189% | 10.4 ? -16% | 10.8 ? -20% |
| PWM Frequency | ||||||
| Screen | -24% | -61% | -85% | -30% | -50% | |
| Brightness middle | 323 | 370 15% | 266 -18% | 260 -20% | 292 -10% | 325 1% |
| Brightness | 305 | 333 9% | 264 -13% | 251 -18% | 285 -7% | 318 4% |
| Brightness Distribution | 89 | 84 -6% | 79 -11% | 85 -4% | 94 6% | 95 7% |
| Black Level * | 0.25 | 0.38 -52% | 0.32 -28% | 0.26 -4% | 0.355 -42% | 0.29 -16% |
| Contrast | 1292 | 974 -25% | 831 -36% | 1000 -23% | 823 -36% | 1121 -13% |
| Colorchecker dE 2000 * | 1.87 | 2.41 -29% | 3.97 -112% | 3.9 -109% | 2.47 -32% | 4.33 -132% |
| Colorchecker dE 2000 max. * | 4.84 | 7.32 -51% | 8.93 -85% | 20.64 -326% | 8.69 -80% | 8.6 -78% |
| Colorchecker dE 2000 calibrated * | 0.92 | 1.19 -29% | 3.5 -280% | 3.71 -303% | 0.96 -4% | 1.95 -112% |
| Greyscale dE 2000 * | 2.57 | 3.9 -52% | 1.8 30% | 1.6 38% | 4.3 -67% | 5.5 -114% |
| Gamma | 2.42 91% | 2.287 96% | 2.31 95% | 2.068 106% | 2.298 96% | 2.142 103% |
| CCT | 7012 93% | 7302 89% | 6754 96% | 6511 100% | 7000 93% | 7893 82% |
| Color Space (Percent of AdobeRGB 1998) | 69 | 41.4 | ||||
| Color Space (Percent of sRGB) | 93 | 60 | ||||
| Total Average (Program / Settings) | -11% /
-17% | -77% /
-67% | -97% /
-87% | -13% /
-21% | -23% /
-35% |
* ... smaller is better
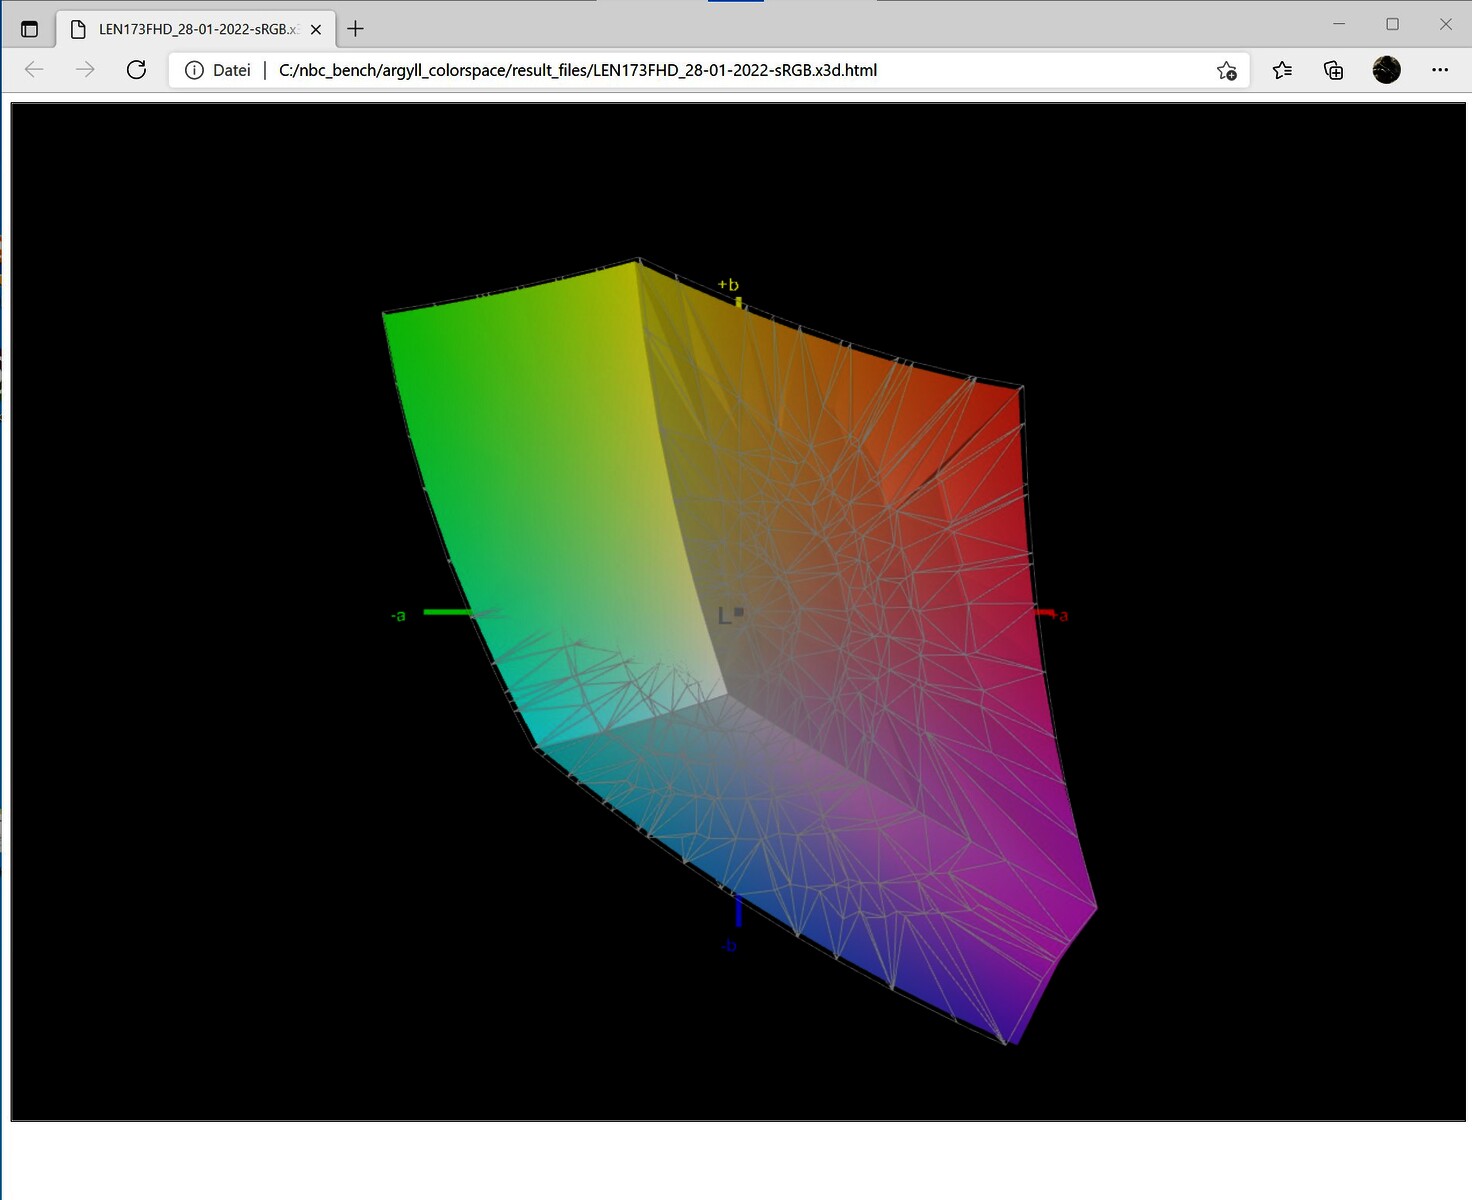
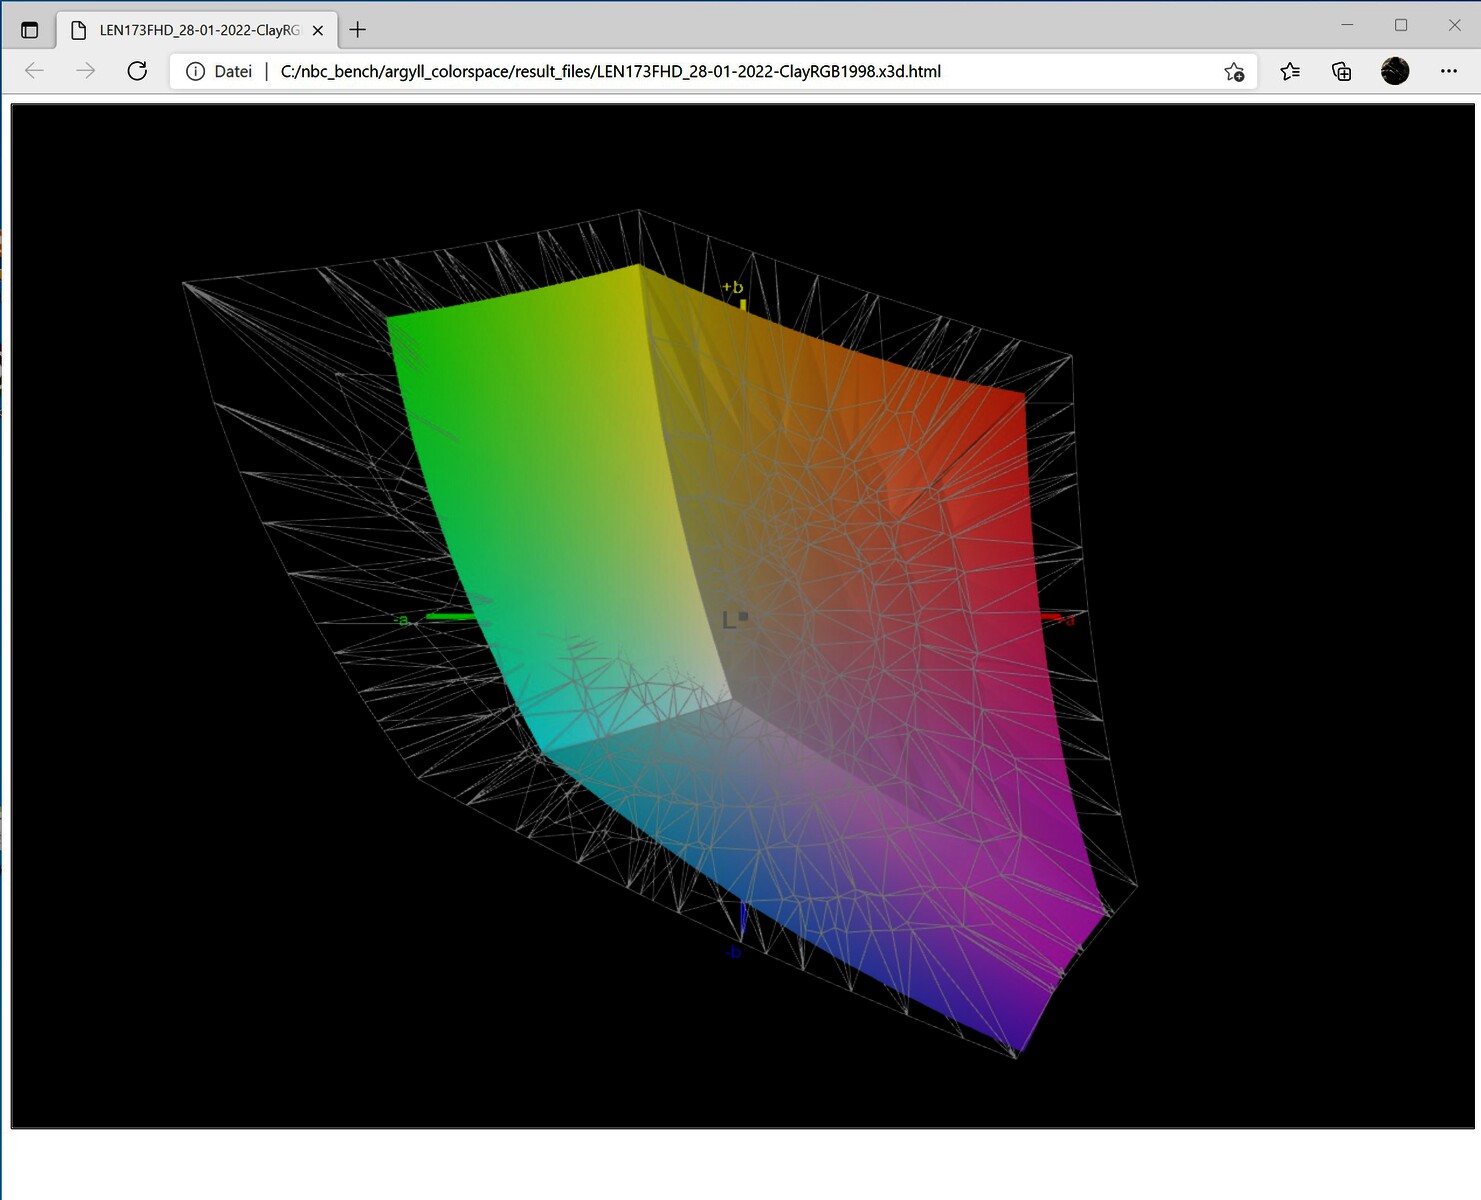
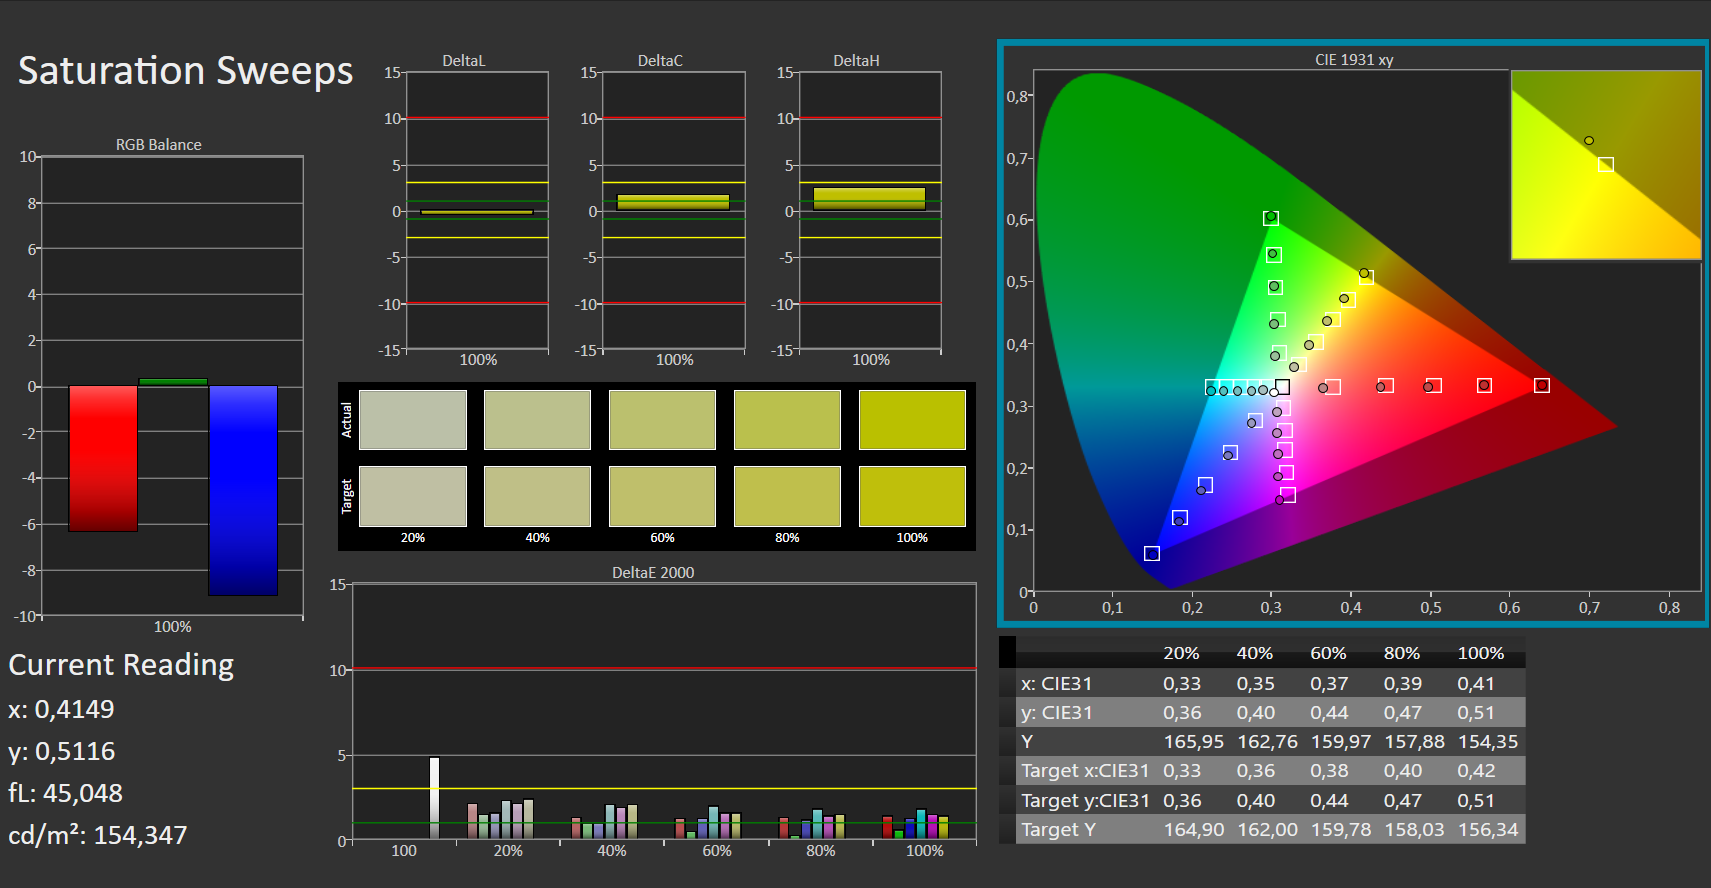
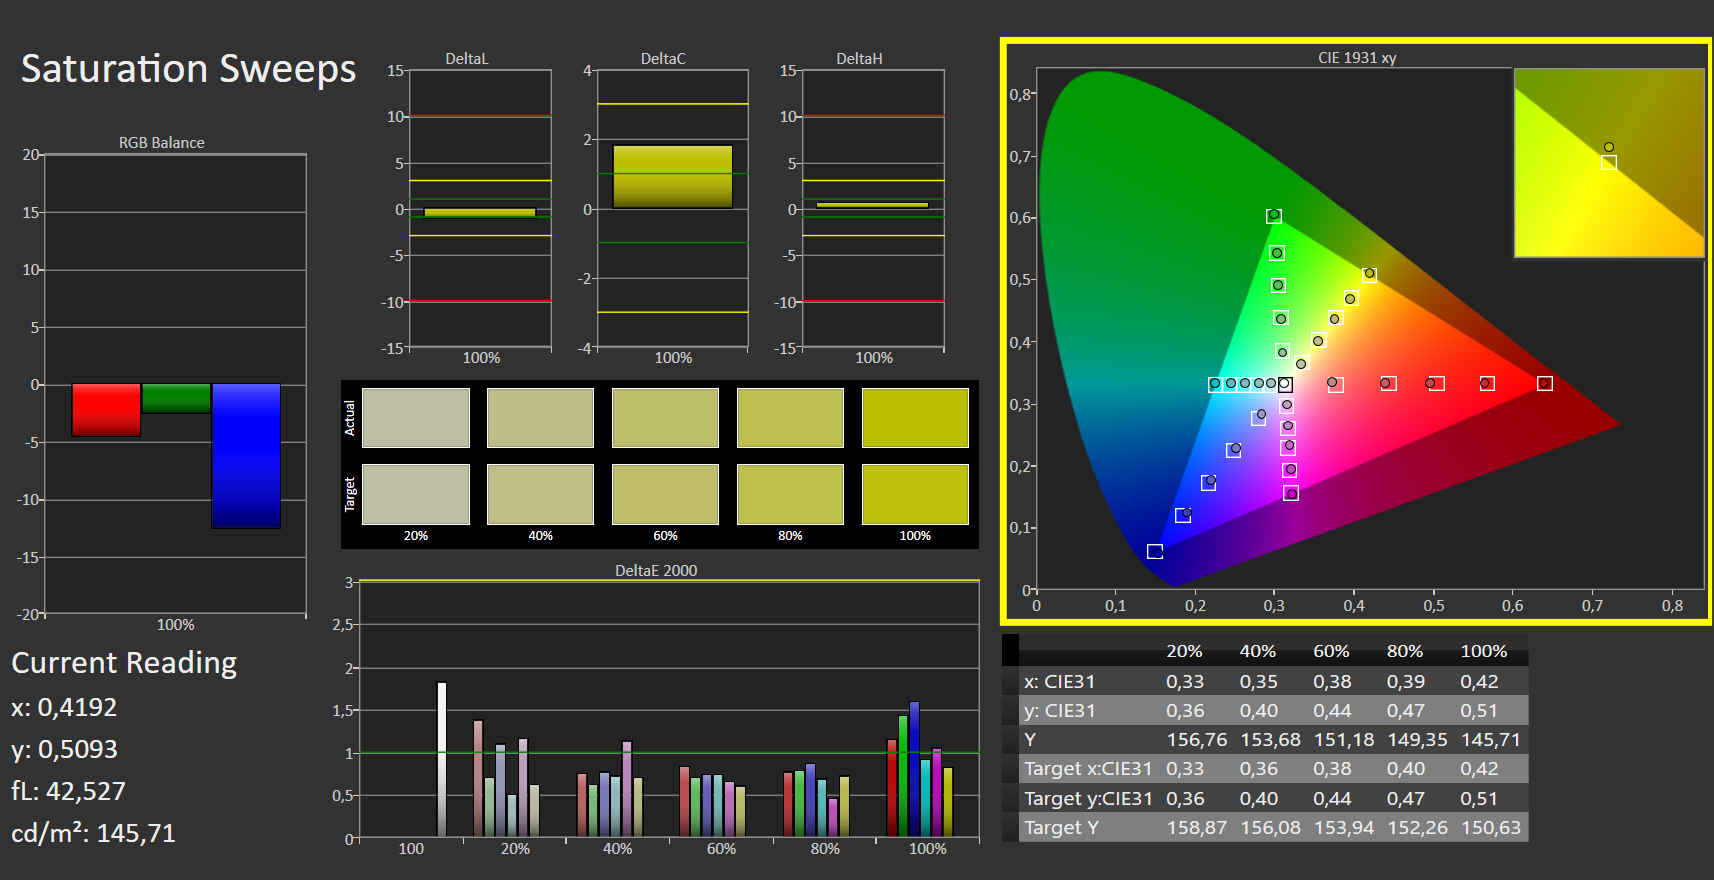
The display quality is consistently good in all aspects. Despite the matte surface, there is no graininess. Furthermore, Lenovo appears to have precalibrated the display of the Lenovo Legion 5 17, since the deltaE-2000 values of the grayscale and colors relative to the sRGB color space fall within the ideal range of less than 3. While there is a minor blue tint, this is very common for IPS screens. Regardless, we were able to minimize it through our manual calibration. Additionally, we were able to further improve the low deltaE-2000 values by a small margin.
Display Response Times
| ↔ Response Time Black to White | ||
|---|---|---|
| 9 ms ... rise ↗ and fall ↘ combined | ↗ 5 ms rise |  |
| ↘ 4 ms fall | ||
| The screen shows fast response rates in our tests and should be suited for gaming. In comparison, all tested devices range from 0.1 (minimum) to 240 (maximum) ms. » 20 % of all devices are better. This means that the measured response time is better than the average of all tested devices (21.5 ms). | ||
| ↔ Response Time 50% Grey to 80% Grey | ||
| 15 ms ... rise ↗ and fall ↘ combined | ↗ 7 ms rise |  |
| ↘ 8 ms fall | ||
| The screen shows good response rates in our tests, but may be too slow for competitive gamers. In comparison, all tested devices range from 0.2 (minimum) to 636 (maximum) ms. » 24 % of all devices are better. This means that the measured response time is better than the average of all tested devices (33.7 ms). | ||
Screen Flickering / PWM (Pulse-Width Modulation)
| Screen flickering / PWM not detected |  | ||
In comparison: 53 % of all tested devices do not use PWM to dim the display. If PWM was detected, an average of 17900 (minimum: 5 - maximum: 3846000) Hz was measured. | |||
The outdoor suitability of our Lenovo Legion 5 17 is limited. If you choose to use the laptop outside anyway, staying in the shade is recommended. The brightness level is then sufficient for most tasks. Our viewing angle test shows a result that is typical for an IPS panel. Only the four corner pictures appear to show a faint veil. During normal use, this is not visible.

Performance
For a gaming laptop, the CPU and GPU performance are the highest priority. If price is a consideration as well, all roads eventually lead to the Legion 5 17, since the AMD Ryzen 5 5600H and Nvidia GeForce RTX 3060 mobile GPU work well together for a solid gaming performance that is entirely sufficient for native 1080p gaming. Those who are still looking for faster performance can configure the Lenovo Legion 5 17 with an AMD Ryzen 7 5800H and a Nvidia GeForce RTX 3070 mobile GPU. Naturally, these options come at a price premium.
Test Conditions
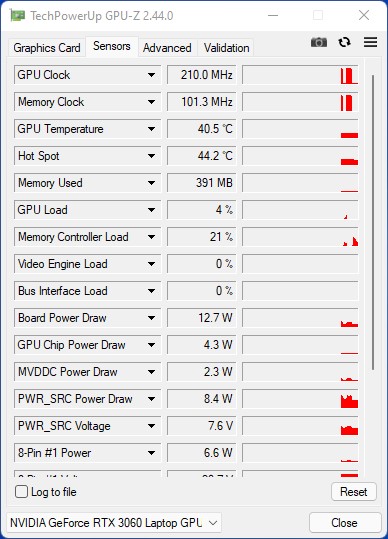
The preinstalled Lenovo Vantage Center allows users to customize various system settings. For example, the GPU performance can be adjusted with the predefined energy profiles. All benchmarks were run with the performance profile enabled. This allows the Nvidia GeForce RTX 3060 to access its full power budget of 130 watts.
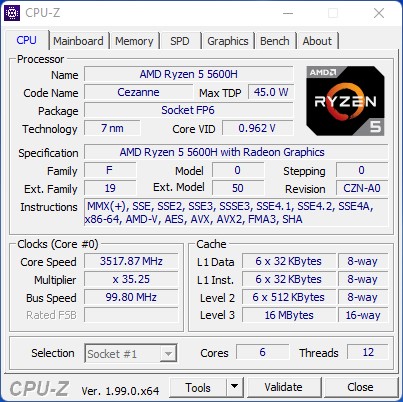
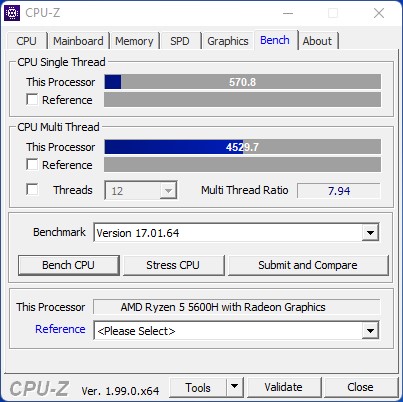
Processor
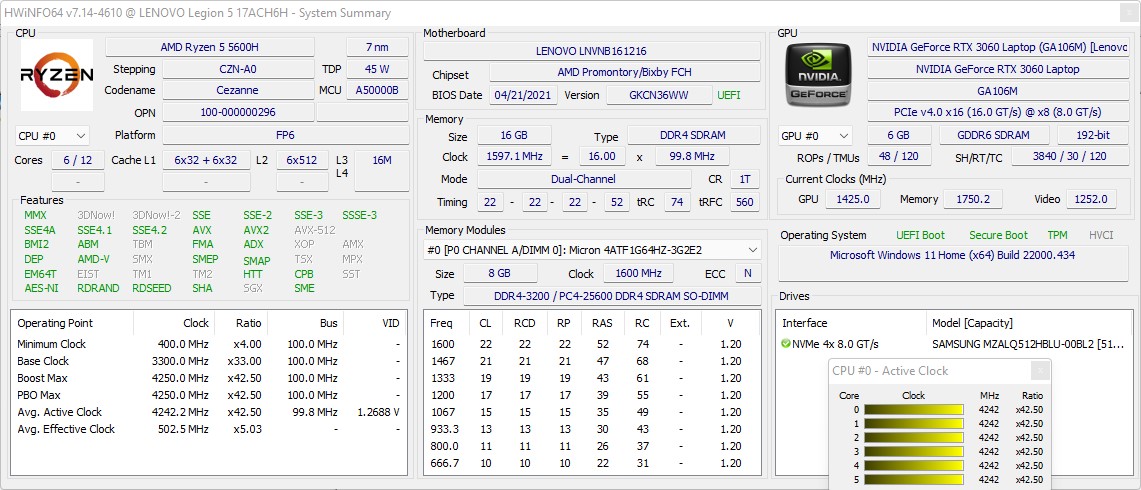
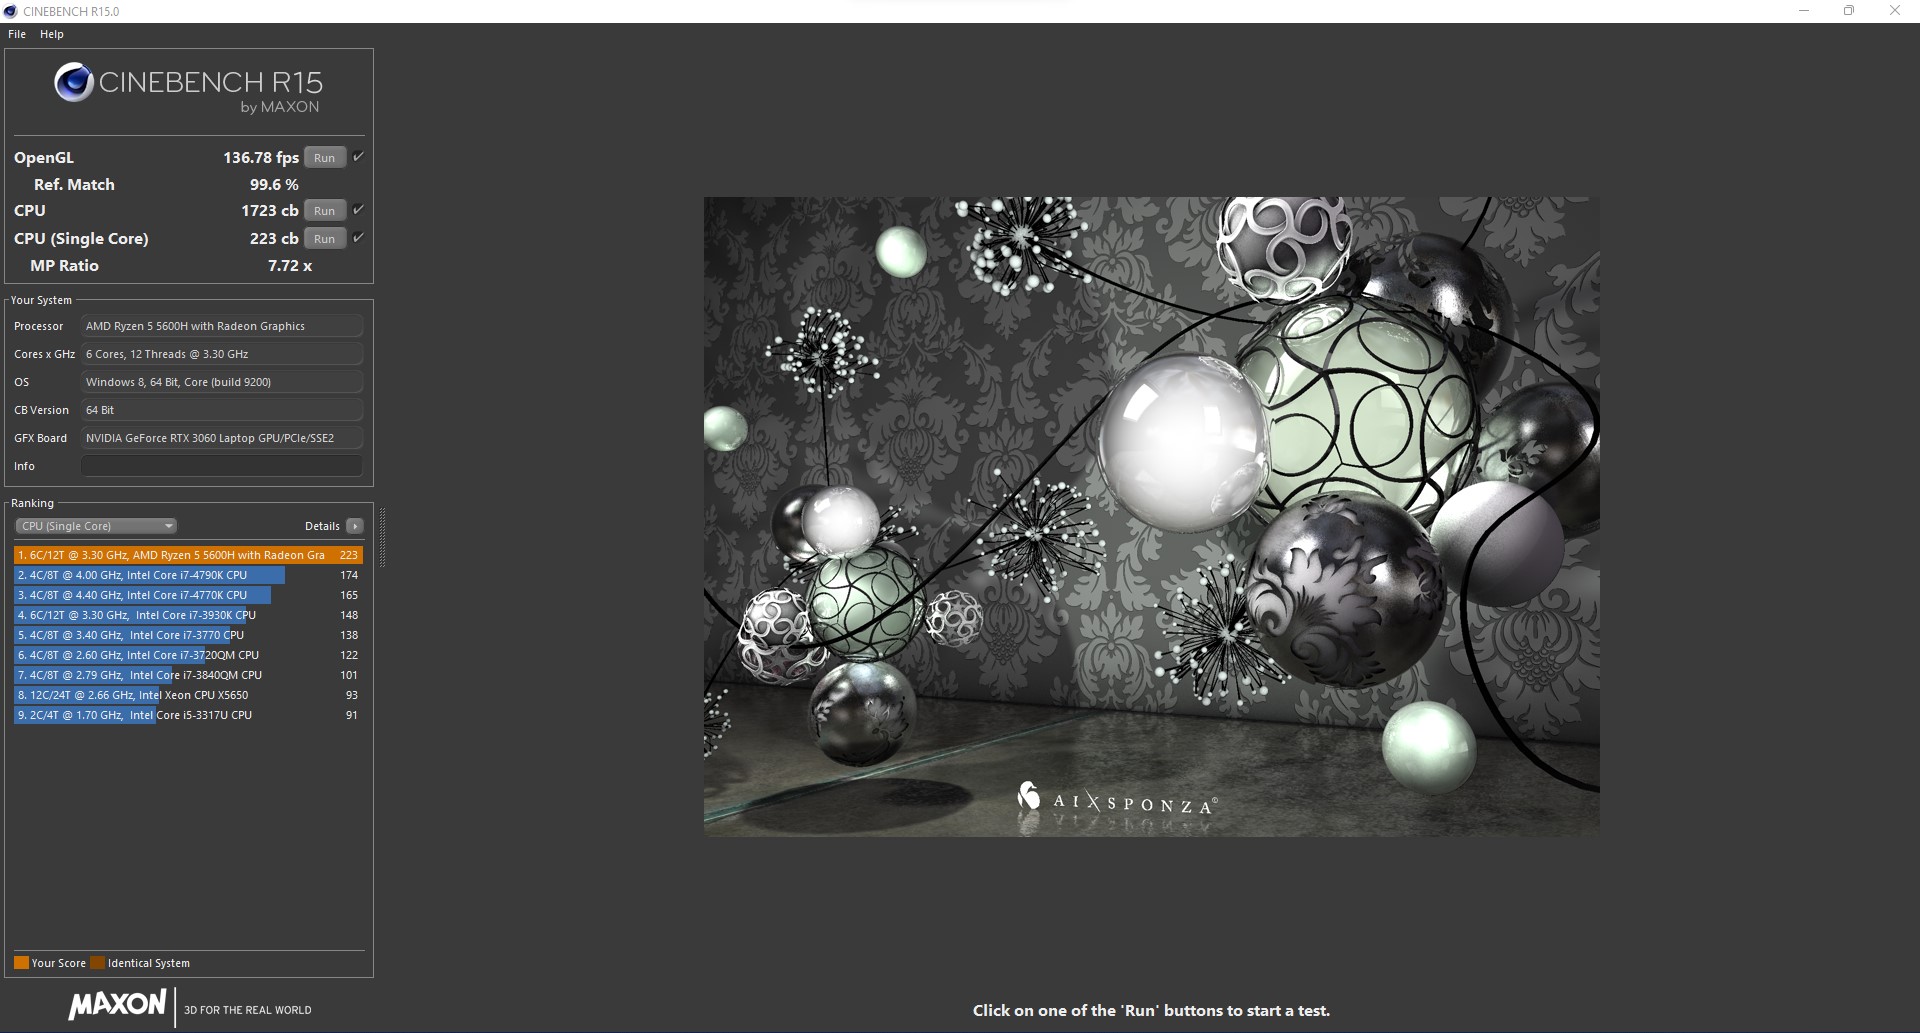
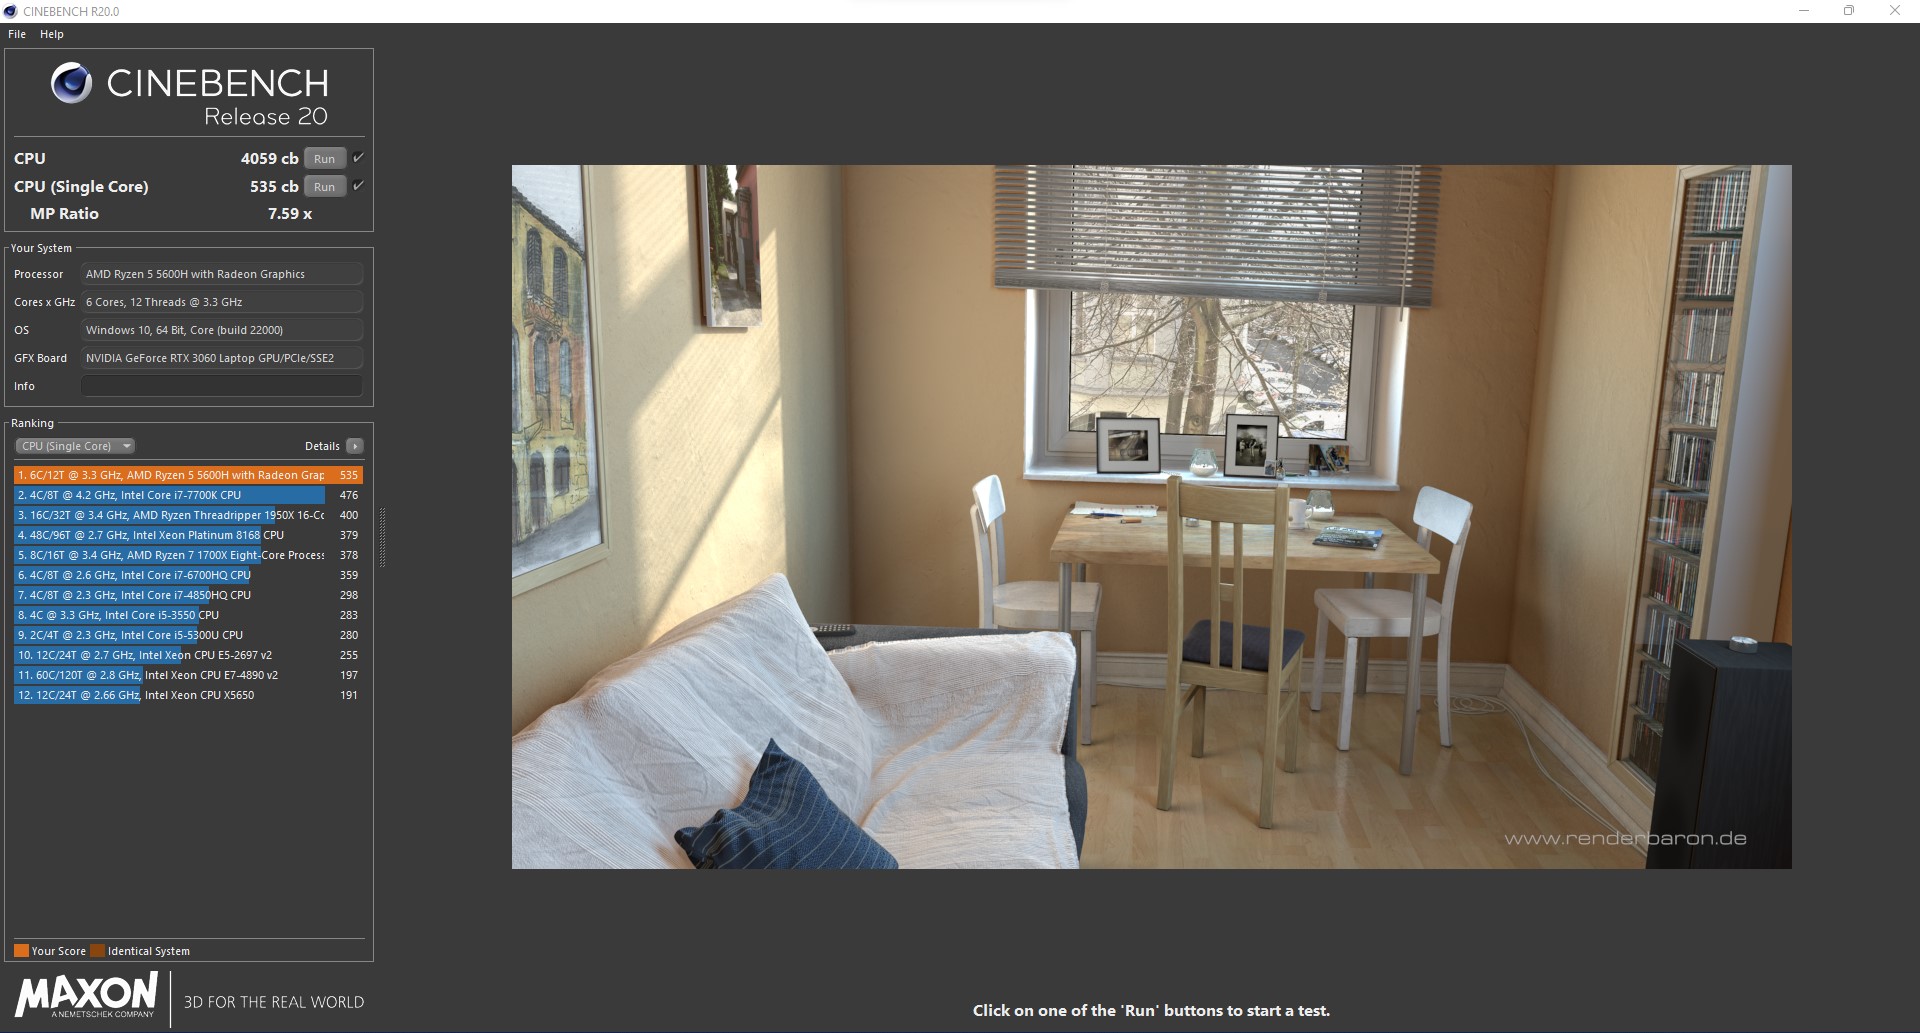
With six cores and twelve threads, the AMD Ryzen 5 5600H offers decently fast performance. However, the Lenovo Legion 5 17 cannot keep up with its octa-core competitors. The AMD Ryzen 5 5600H still performs well and the results are above the average for this CPU.
Our Lenovo Legion 5 17 performs relatively well in our stress test, which consists of running Cinebench R15 multi in a loop. The performance remains consistent and we did not observe any dips.
More comparisons and benchmarks can be found in our CPU comparison table.
Cinebench R15 Multi Loop
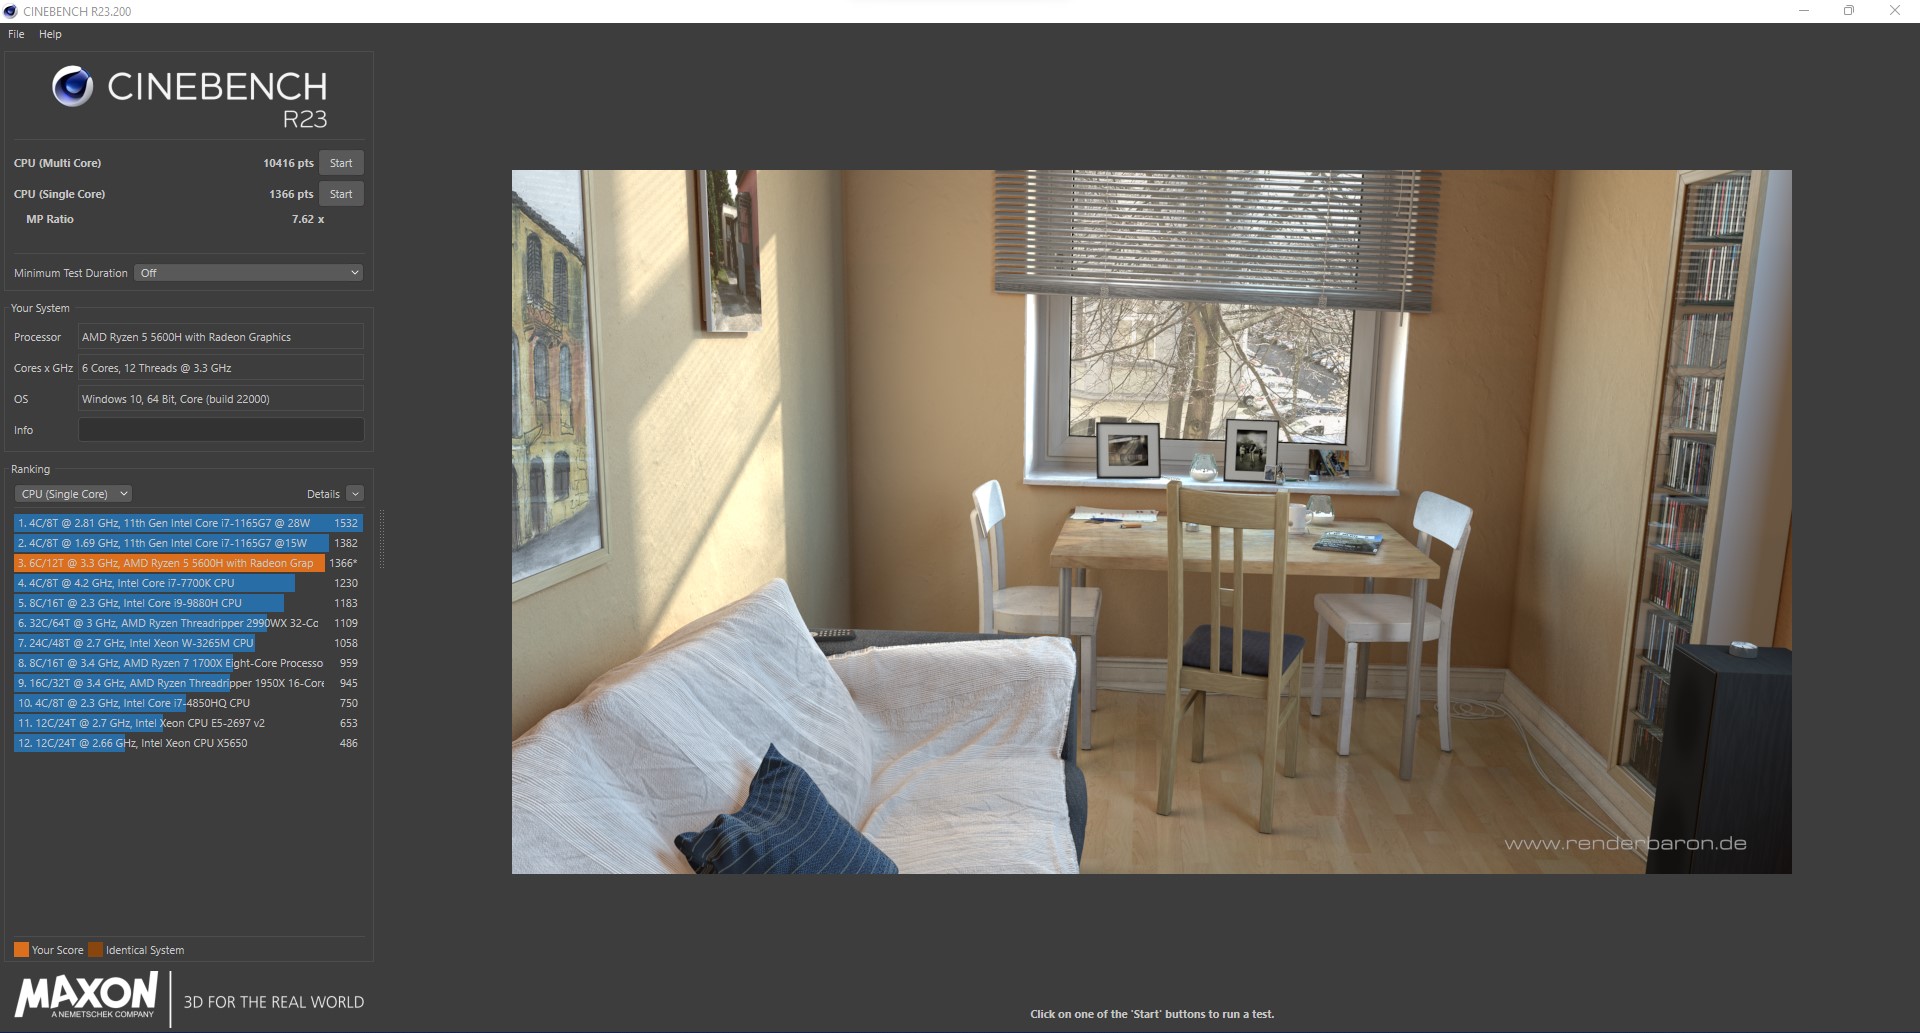
Cinebench R23: Multi Core | Single Core
Cinebench R20: CPU (Multi Core) | CPU (Single Core)
Cinebench R15: CPU Multi 64Bit | CPU Single 64Bit
Blender: v2.79 BMW27 CPU
7-Zip 18.03: 7z b 4 | 7z b 4 -mmt1
Geekbench 5.5: Multi-Core | Single-Core
HWBOT x265 Benchmark v2.2: 4k Preset
LibreOffice : 20 Documents To PDF
R Benchmark 2.5: Overall mean
| CPU Performance Rating | |
| Average of class Gaming | |
| SCHENKER XMG Apex 17 M21 | |
| Asus TUF Gaming F17 FX706HM | |
| Gigabyte A7 X1 | |
| MSI Katana GF76 11UE | |
| Lenovo Legion 5 17ACH6H-82JY0003GE | |
| Average AMD Ryzen 5 5600H | |
| SCHENKER XMG Core 17 (Early 2021) | |
| Cinebench R23 / Multi Core | |
| Average of class Gaming (2435 - 34613, n=232, last 2 years) | |
| SCHENKER XMG Apex 17 M21 | |
| Gigabyte A7 X1 | |
| Asus TUF Gaming F17 FX706HM | |
| MSI Katana GF76 11UE | |
| Lenovo Legion 5 17ACH6H-82JY0003GE | |
| Average AMD Ryzen 5 5600H (7945 - 10416, n=13) | |
| SCHENKER XMG Core 17 (Early 2021) | |
| Cinebench R23 / Single Core | |
| Average of class Gaming (527 - 2235, n=230, last 2 years) | |
| Asus TUF Gaming F17 FX706HM | |
| MSI Katana GF76 11UE | |
| Gigabyte A7 X1 | |
| SCHENKER XMG Apex 17 M21 | |
| Lenovo Legion 5 17ACH6H-82JY0003GE | |
| Average AMD Ryzen 5 5600H (1316 - 1381, n=13) | |
| SCHENKER XMG Core 17 (Early 2021) | |
| Cinebench R20 / CPU (Multi Core) | |
| Average of class Gaming (930 - 13769, n=230, last 2 years) | |
| SCHENKER XMG Apex 17 M21 | |
| Gigabyte A7 X1 | |
| Asus TUF Gaming F17 FX706HM | |
| MSI Katana GF76 11UE | |
| Lenovo Legion 5 17ACH6H-82JY0003GE | |
| Average AMD Ryzen 5 5600H (3074 - 4059, n=16) | |
| SCHENKER XMG Core 17 (Early 2021) | |
| Cinebench R20 / CPU (Single Core) | |
| Average of class Gaming (169 - 855, n=230, last 2 years) | |
| Asus TUF Gaming F17 FX706HM | |
| Gigabyte A7 X1 | |
| MSI Katana GF76 11UE | |
| SCHENKER XMG Apex 17 M21 | |
| Lenovo Legion 5 17ACH6H-82JY0003GE | |
| Average AMD Ryzen 5 5600H (527 - 538, n=15) | |
| SCHENKER XMG Core 17 (Early 2021) | |
| Cinebench R15 / CPU Multi 64Bit | |
| Average of class Gaming (400 - 5663, n=235, last 2 years) | |
| Gigabyte A7 X1 | |
| SCHENKER XMG Apex 17 M21 | |
| Asus TUF Gaming F17 FX706HM | |
| MSI Katana GF76 11UE | |
| Lenovo Legion 5 17ACH6H-82JY0003GE | |
| Average AMD Ryzen 5 5600H (1319 - 1723, n=16) | |
| SCHENKER XMG Core 17 (Early 2021) | |
| Cinebench R15 / CPU Single 64Bit | |
| Average of class Gaming (79.2 - 318, n=234, last 2 years) | |
| Asus TUF Gaming F17 FX706HM | |
| Gigabyte A7 X1 | |
| SCHENKER XMG Apex 17 M21 | |
| MSI Katana GF76 11UE | |
| Lenovo Legion 5 17ACH6H-82JY0003GE | |
| Average AMD Ryzen 5 5600H (218 - 225, n=14) | |
| SCHENKER XMG Core 17 (Early 2021) | |
| Blender / v2.79 BMW27 CPU | |
| SCHENKER XMG Core 17 (Early 2021) | |
| Average AMD Ryzen 5 5600H (300 - 384, n=14) | |
| Lenovo Legion 5 17ACH6H-82JY0003GE | |
| MSI Katana GF76 11UE | |
| Gigabyte A7 X1 | |
| Asus TUF Gaming F17 FX706HM | |
| SCHENKER XMG Apex 17 M21 | |
| Average of class Gaming (87 - 1259, n=228, last 2 years) | |
| 7-Zip 18.03 / 7z b 4 | |
| Average of class Gaming (11386 - 140932, n=229, last 2 years) | |
| SCHENKER XMG Apex 17 M21 | |
| Gigabyte A7 X1 | |
| Asus TUF Gaming F17 FX706HM | |
| Lenovo Legion 5 17ACH6H-82JY0003GE | |
| MSI Katana GF76 11UE | |
| Average AMD Ryzen 5 5600H (36315 - 46562, n=14) | |
| SCHENKER XMG Core 17 (Early 2021) | |
| 7-Zip 18.03 / 7z b 4 -mmt1 | |
| Average of class Gaming (2685 - 7581, n=229, last 2 years) | |
| Asus TUF Gaming F17 FX706HM | |
| Gigabyte A7 X1 | |
| SCHENKER XMG Apex 17 M21 | |
| MSI Katana GF76 11UE | |
| SCHENKER XMG Core 17 (Early 2021) | |
| Lenovo Legion 5 17ACH6H-82JY0003GE | |
| Average AMD Ryzen 5 5600H (5213 - 5446, n=14) | |
| Geekbench 5.5 / Multi-Core | |
| Average of class Gaming (1946 - 22200, n=234, last 2 years) | |
| SCHENKER XMG Apex 17 M21 | |
| MSI Katana GF76 11UE | |
| Asus TUF Gaming F17 FX706HM | |
| Gigabyte A7 X1 | |
| SCHENKER XMG Core 17 (Early 2021) | |
| Lenovo Legion 5 17ACH6H-82JY0003GE | |
| Average AMD Ryzen 5 5600H (4990 - 7253, n=14) | |
| Geekbench 5.5 / Single-Core | |
| Average of class Gaming (158 - 2210, n=234, last 2 years) | |
| Asus TUF Gaming F17 FX706HM | |
| MSI Katana GF76 11UE | |
| Gigabyte A7 X1 | |
| SCHENKER XMG Apex 17 M21 | |
| Lenovo Legion 5 17ACH6H-82JY0003GE | |
| Average AMD Ryzen 5 5600H (1365 - 1445, n=14) | |
| SCHENKER XMG Core 17 (Early 2021) | |
| HWBOT x265 Benchmark v2.2 / 4k Preset | |
| Average of class Gaming (3 - 37.6, n=232, last 2 years) | |
| SCHENKER XMG Apex 17 M21 | |
| Asus TUF Gaming F17 FX706HM | |
| Gigabyte A7 X1 | |
| MSI Katana GF76 11UE | |
| Lenovo Legion 5 17ACH6H-82JY0003GE | |
| Average AMD Ryzen 5 5600H (9.92 - 13.3, n=14) | |
| SCHENKER XMG Core 17 (Early 2021) | |
| LibreOffice / 20 Documents To PDF | |
| Average AMD Ryzen 5 5600H (52.2 - 81.5, n=14) | |
| Gigabyte A7 X1 | |
| SCHENKER XMG Core 17 (Early 2021) | |
| Lenovo Legion 5 17ACH6H-82JY0003GE | |
| MSI Katana GF76 11UE | |
| Average of class Gaming (32.8 - 332, n=226, last 2 years) | |
| SCHENKER XMG Apex 17 M21 | |
| Asus TUF Gaming F17 FX706HM | |
| R Benchmark 2.5 / Overall mean | |
| SCHENKER XMG Core 17 (Early 2021) | |
| MSI Katana GF76 11UE | |
| Average AMD Ryzen 5 5600H (0.526 - 0.596, n=14) | |
| Lenovo Legion 5 17ACH6H-82JY0003GE | |
| Asus TUF Gaming F17 FX706HM | |
| SCHENKER XMG Apex 17 M21 | |
| Gigabyte A7 X1 | |
| Average of class Gaming (0.3609 - 4.47, n=229, last 2 years) | |
* ... smaller is better
AIDA64: FP32 Ray-Trace | FPU Julia | CPU SHA3 | CPU Queen | FPU SinJulia | FPU Mandel | CPU AES | CPU ZLib | FP64 Ray-Trace | CPU PhotoWorxx
| Performance Rating | |
| Average of class Gaming | |
| Lenovo Legion 5 17ACH6H-82JY0003GE | |
| Average AMD Ryzen 5 5600H | |
| AIDA64 / FP32 Ray-Trace | |
| Average of class Gaming (3069 - 60169, n=225, last 2 years) | |
| Lenovo Legion 5 17ACH6H-82JY0003GE | |
| Average AMD Ryzen 5 5600H (9181 - 12636, n=14) | |
| AIDA64 / FPU Julia | |
| Average of class Gaming (18567 - 252486, n=225, last 2 years) | |
| Lenovo Legion 5 17ACH6H-82JY0003GE | |
| Average AMD Ryzen 5 5600H (51994 - 78250, n=14) | |
| AIDA64 / CPU SHA3 | |
| Average of class Gaming (629 - 10389, n=225, last 2 years) | |
| Lenovo Legion 5 17ACH6H-82JY0003GE | |
| Average AMD Ryzen 5 5600H (1587 - 2675, n=14) | |
| AIDA64 / CPU Queen | |
| Average of class Gaming (15371 - 200651, n=225, last 2 years) | |
| Lenovo Legion 5 17ACH6H-82JY0003GE | |
| Average AMD Ryzen 5 5600H (66699 - 77213, n=14) | |
| AIDA64 / FPU SinJulia | |
| Average of class Gaming (2137 - 32988, n=225, last 2 years) | |
| Lenovo Legion 5 17ACH6H-82JY0003GE | |
| Average AMD Ryzen 5 5600H (8340 - 9159, n=14) | |
| AIDA64 / FPU Mandel | |
| Average of class Gaming (10291 - 134044, n=225, last 2 years) | |
| Lenovo Legion 5 17ACH6H-82JY0003GE | |
| Average AMD Ryzen 5 5600H (28268 - 43274, n=14) | |
| AIDA64 / CPU AES | |
| Average of class Gaming (19065 - 328679, n=225, last 2 years) | |
| Lenovo Legion 5 17ACH6H-82JY0003GE | |
| Average AMD Ryzen 5 5600H (39852 - 98939, n=14) | |
| AIDA64 / CPU ZLib | |
| Average of class Gaming (150.9 - 2409, n=225, last 2 years) | |
| Lenovo Legion 5 17ACH6H-82JY0003GE | |
| Average AMD Ryzen 5 5600H (507 - 649, n=14) | |
| AIDA64 / FP64 Ray-Trace | |
| Average of class Gaming (1518 - 31796, n=225, last 2 years) | |
| Lenovo Legion 5 17ACH6H-82JY0003GE | |
| Average AMD Ryzen 5 5600H (4811 - 6652, n=14) | |
| AIDA64 / CPU PhotoWorxx | |
| Average of class Gaming (10805 - 60161, n=226, last 2 years) | |
| Average AMD Ryzen 5 5600H (7419 - 24746, n=14) | |
| Lenovo Legion 5 17ACH6H-82JY0003GE | |
System Performance
In terms of the system performance benchmarks, the Lenovo Legion 5 17 achieves good results. Despite its lack of cores compared to its competitors, it keeps up admirably. Here, the performance is once again significantly faster than the class average.
CrossMark: Overall | Productivity | Creativity | Responsiveness
| PCMark 10 / Score | |
| Average of class Gaming (5235 - 9852, n=200, last 2 years) | |
| SCHENKER XMG Apex 17 M21 | |
| Asus TUF Gaming F17 FX706HM | |
| Gigabyte A7 X1 | |
| Lenovo Legion 5 17ACH6H-82JY0003GE | |
| MSI Katana GF76 11UE | |
| Average AMD Ryzen 5 5600H, NVIDIA GeForce RTX 3060 Laptop GPU (6341 - 6615, n=2) | |
| SCHENKER XMG Core 17 (Early 2021) | |
| PCMark 10 / Essentials | |
| Average of class Gaming (8300 - 12334, n=199, last 2 years) | |
| Asus TUF Gaming F17 FX706HM | |
| SCHENKER XMG Apex 17 M21 | |
| Gigabyte A7 X1 | |
| Average AMD Ryzen 5 5600H, NVIDIA GeForce RTX 3060 Laptop GPU (9639 - 10127, n=2) | |
| MSI Katana GF76 11UE | |
| Lenovo Legion 5 17ACH6H-82JY0003GE | |
| SCHENKER XMG Core 17 (Early 2021) | |
| PCMark 10 / Productivity | |
| Average of class Gaming (6662 - 11833, n=199, last 2 years) | |
| Gigabyte A7 X1 | |
| SCHENKER XMG Apex 17 M21 | |
| Asus TUF Gaming F17 FX706HM | |
| Lenovo Legion 5 17ACH6H-82JY0003GE | |
| Average AMD Ryzen 5 5600H, NVIDIA GeForce RTX 3060 Laptop GPU (8829 - 9027, n=2) | |
| MSI Katana GF76 11UE | |
| SCHENKER XMG Core 17 (Early 2021) | |
| PCMark 10 / Digital Content Creation | |
| Average of class Gaming (6462 - 18475, n=199, last 2 years) | |
| SCHENKER XMG Apex 17 M21 | |
| Gigabyte A7 X1 | |
| Asus TUF Gaming F17 FX706HM | |
| Lenovo Legion 5 17ACH6H-82JY0003GE | |
| MSI Katana GF76 11UE | |
| Average AMD Ryzen 5 5600H, NVIDIA GeForce RTX 3060 Laptop GPU (7740 - 9026, n=2) | |
| SCHENKER XMG Core 17 (Early 2021) | |
| CrossMark / Overall | |
| Average of class Gaming (1247 - 2334, n=170, last 2 years) | |
| Lenovo Legion 5 17ACH6H-82JY0003GE | |
| Average AMD Ryzen 5 5600H, NVIDIA GeForce RTX 3060 Laptop GPU () | |
| CrossMark / Productivity | |
| Average of class Gaming (1299 - 2204, n=170, last 2 years) | |
| Lenovo Legion 5 17ACH6H-82JY0003GE | |
| Average AMD Ryzen 5 5600H, NVIDIA GeForce RTX 3060 Laptop GPU () | |
| CrossMark / Creativity | |
| Average of class Gaming (1275 - 2514, n=170, last 2 years) | |
| Lenovo Legion 5 17ACH6H-82JY0003GE | |
| Average AMD Ryzen 5 5600H, NVIDIA GeForce RTX 3060 Laptop GPU () | |
| CrossMark / Responsiveness | |
| Average of class Gaming (1030 - 2330, n=170, last 2 years) | |
| Lenovo Legion 5 17ACH6H-82JY0003GE | |
| Average AMD Ryzen 5 5600H, NVIDIA GeForce RTX 3060 Laptop GPU () | |
| PCMark 10 Score | 6615 points | |
Help | ||
| AIDA64 / Memory Copy | |
| Average of class Gaming (21842 - 92565, n=225, last 2 years) | |
| Lenovo Legion 5 17ACH6H-82JY0003GE | |
| Average AMD Ryzen 5 5600H (20549 - 42141, n=14) | |
| AIDA64 / Memory Read | |
| Average of class Gaming (24879 - 90647, n=225, last 2 years) | |
| Lenovo Legion 5 17ACH6H-82JY0003GE | |
| Average AMD Ryzen 5 5600H (22917 - 47595, n=14) | |
| AIDA64 / Memory Write | |
| Average of class Gaming (21619 - 103259, n=225, last 2 years) | |
| Lenovo Legion 5 17ACH6H-82JY0003GE | |
| Average AMD Ryzen 5 5600H (20226 - 44872, n=14) | |
| AIDA64 / Memory Latency | |
| Average of class Gaming (59.5 - 152.5, n=222, last 2 years) | |
| Average AMD Ryzen 5 5600H (75 - 89.1, n=14) | |
| Lenovo Legion 5 17ACH6H-82JY0003GE | |
* ... smaller is better
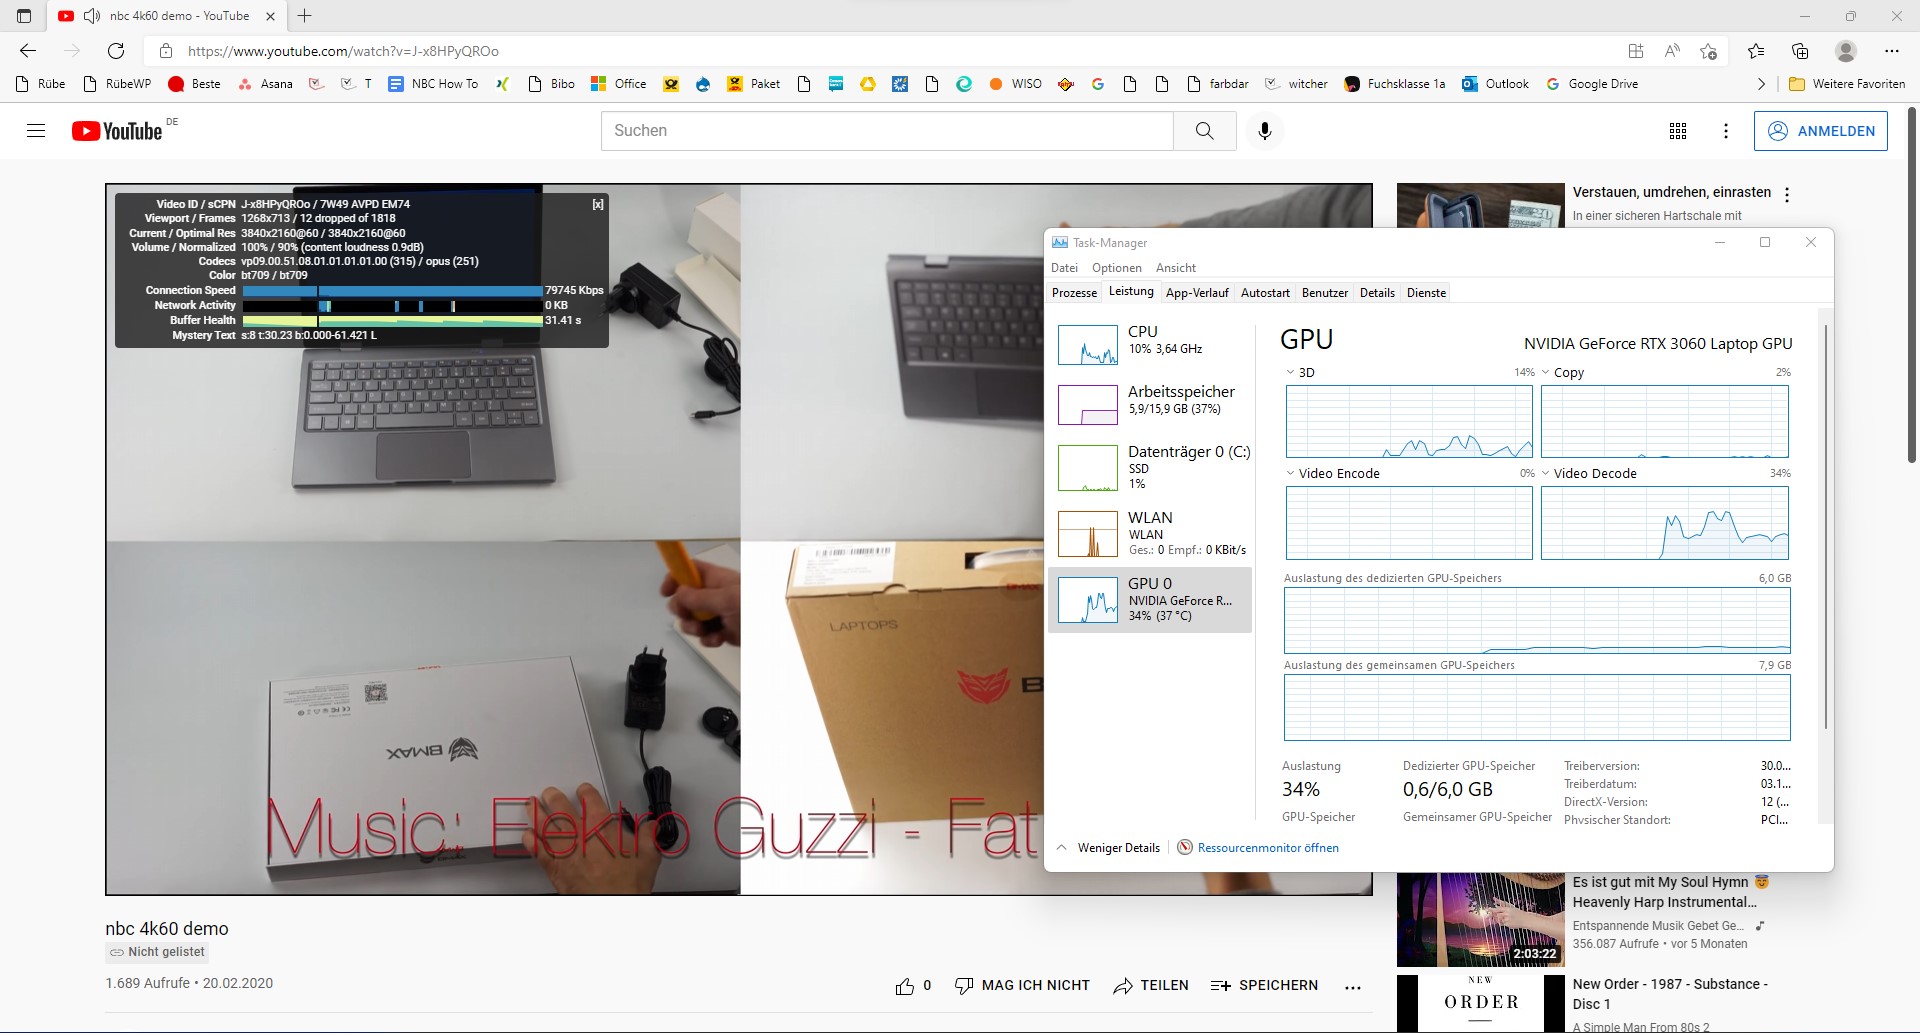
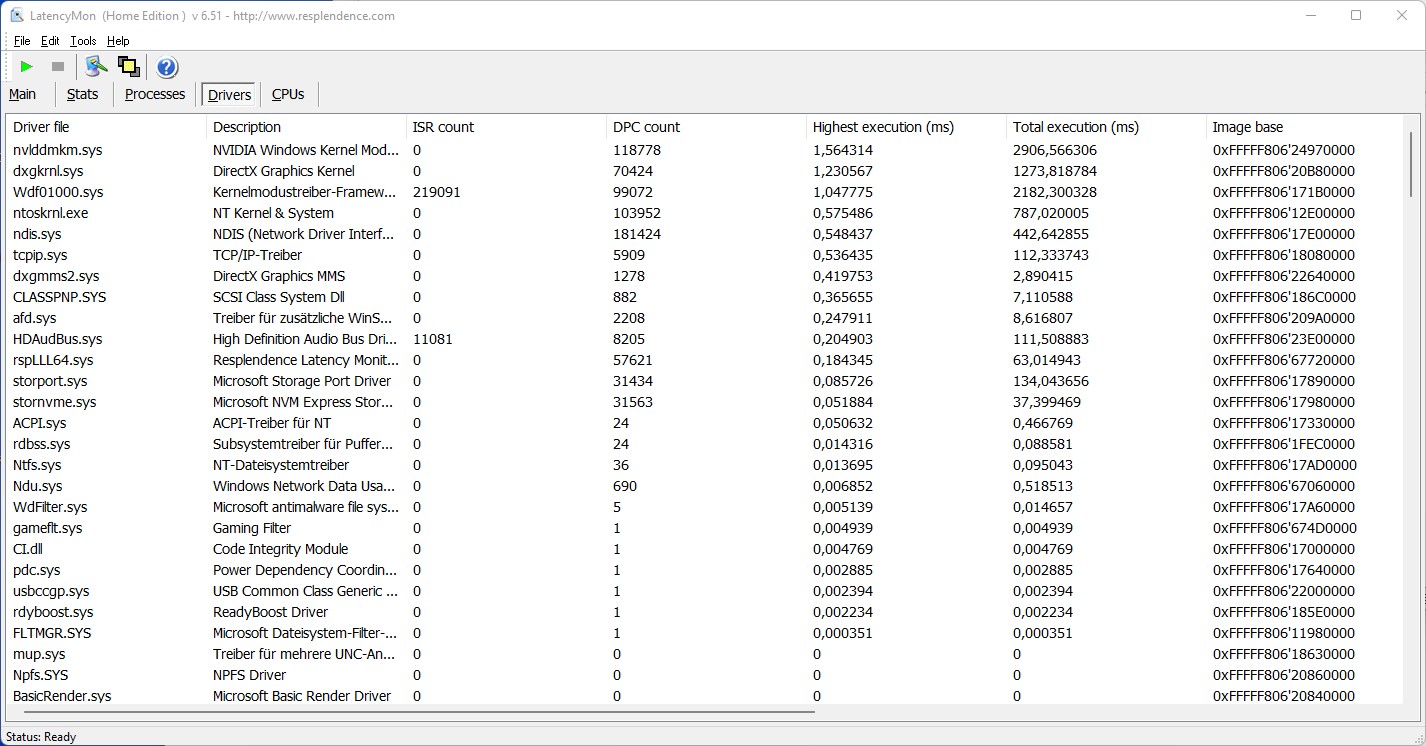
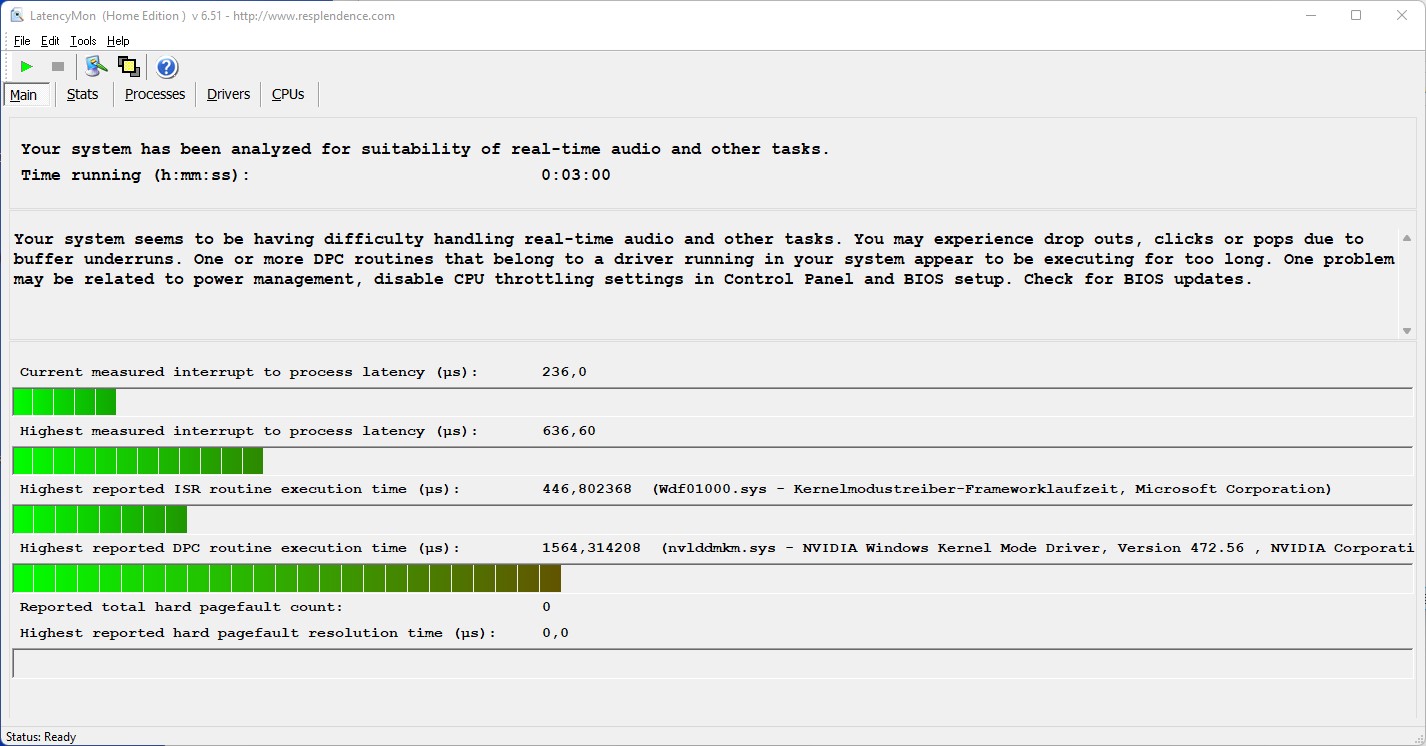
DPC Latencies
Opening multiple browser tabs in Edge and playing a 4K YouTube video did not produce problematic results. The latencies only slightly increase after running Prime95. The GPU load during our test viideo is roughly 30 %.
| DPC Latencies / LatencyMon - interrupt to process latency (max), Web, Youtube, Prime95 | |
| MSI Katana GF76 11UE | |
| Lenovo Legion 5 17ACH6H-82JY0003GE | |
| SCHENKER XMG Apex 17 M21 | |
| Asus TUF Gaming F17 FX706HM | |
| Gigabyte A7 X1 | |
| SCHENKER XMG Core 17 (Early 2021) | |
* ... smaller is better
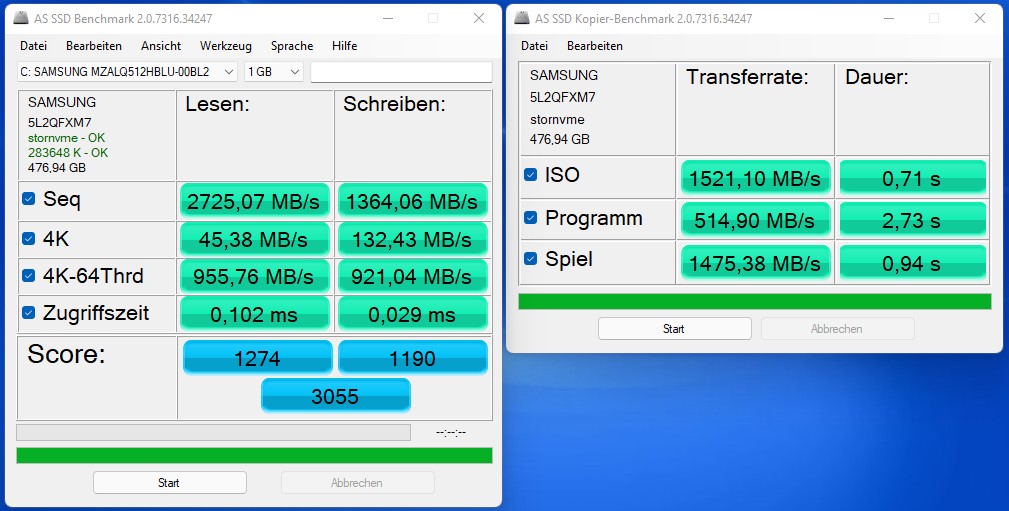
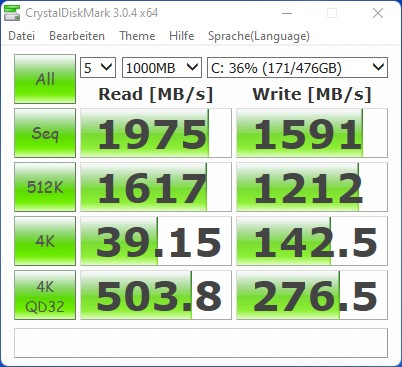
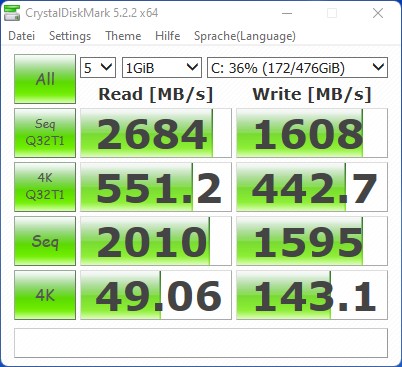
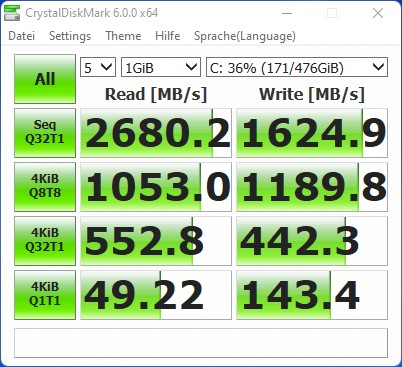
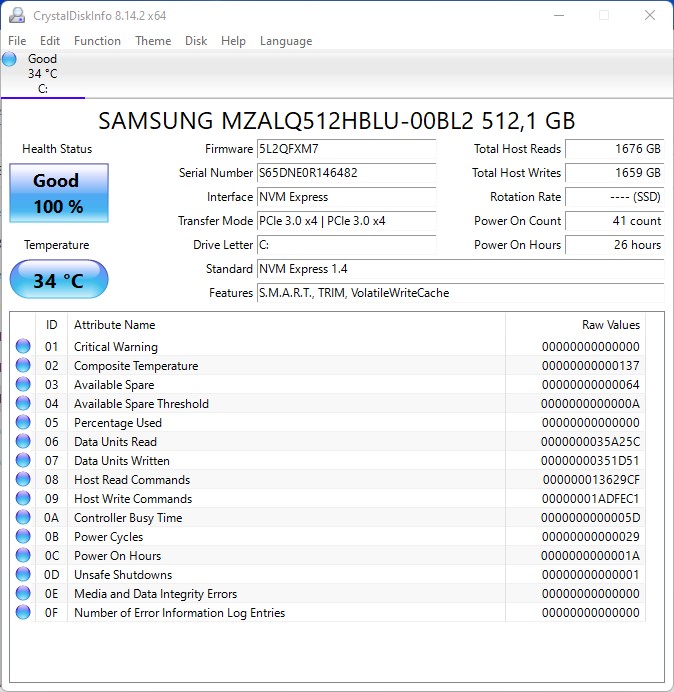
Storage Solution
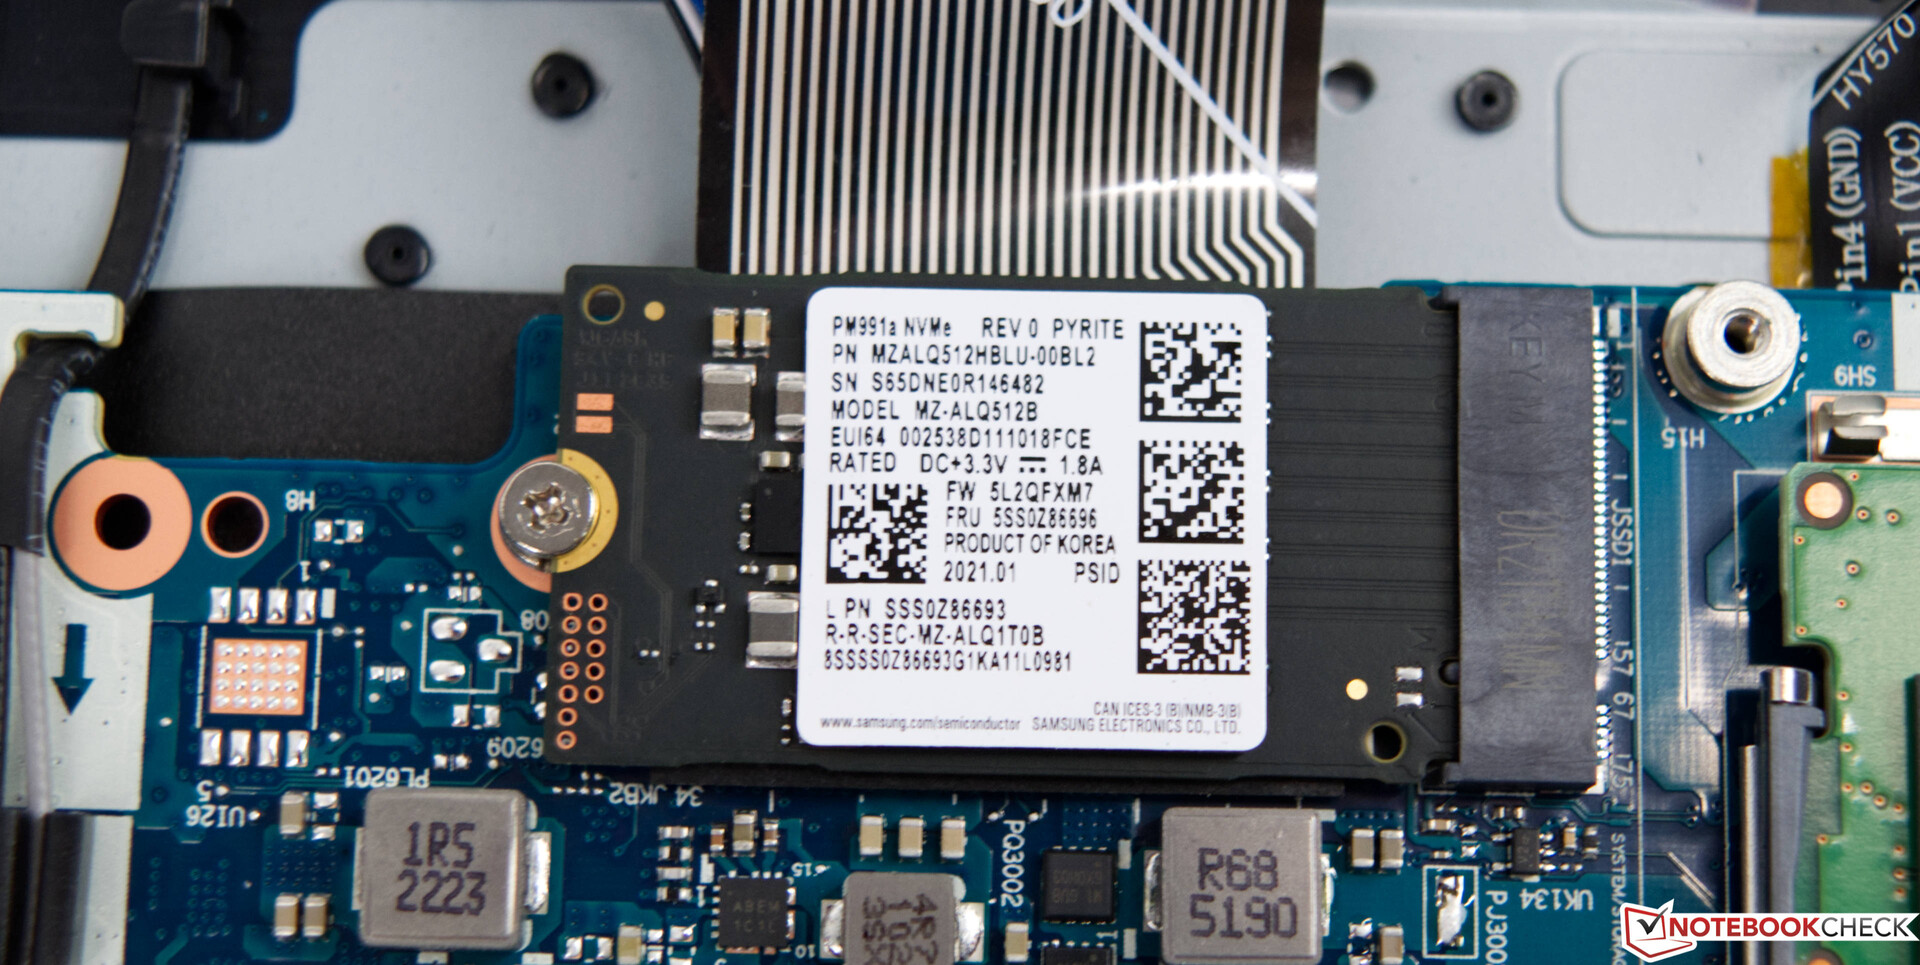
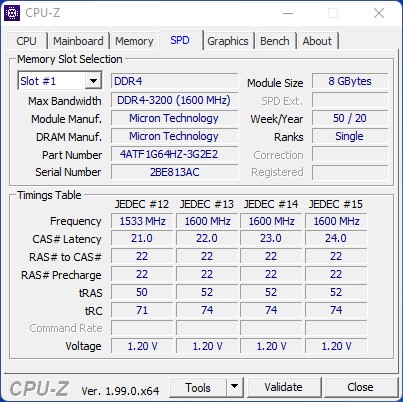
For the Legion 5 17, Lenovo relies on a fast Samsung SSD. In this case, it has a capacity of 512 GB and uses the fast M.2 PCIe interface for data transfers. As our results show, however, this setup cannot quite keep up with the competition. At 512 GB, the capacity is not exactly massive, either. On a gaming laptop, we expect at least 1 TB of storage space.
More comparisons and benchmarks can be found in our comparison table.

* ... smaller is better
Disk Throttling: DiskSpd Read Loop, Queue Depth 8
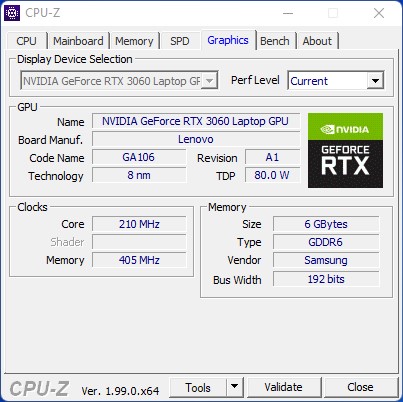
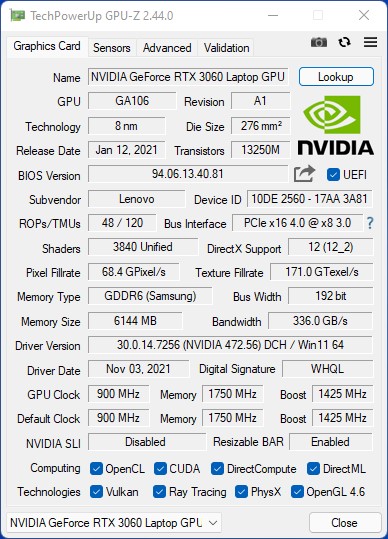
GPU Performance
For our test deviice, the Nvidia GeForce RTX 3060 mobile GPU serves as the graphics card. Due to the configurable power limit of 80 to 130 watts, the performance of different models can vary widely. Here, the Nvidia GeForce RTX 3060 mobile GPU can consume up to 130 watts when set to performance mode via the Lenovo Vantage tool. As a result, it achieves excellent results in synthetic benchmarks. The Lenovo Legion 5 17 is only behind by a few percentage points compared to the much more powerful Schenker XMG Apex 17 M21.
More comparisons and benchmarks can be found in our GPU comparison table.
| 3DMark Ice Storm Standard Score | 201496 points | |
| 3DMark Cloud Gate Standard Score | 44638 points | |
| 3DMark Fire Strike Score | 19801 points | |
| 3DMark Fire Strike Extreme Score | 10073 points | |
| 3DMark Time Spy Score | 8579 points | |
Help | ||
Gaming Performance
In terms of the gaming performance, the Lenovo 5 17 falls behind most devices in our comparison. Competitors based on Intel SoCs appear to reach better results in games. Regardless, we do not want to downplay the absolute performance of our test device. The frame rates are high and even current titles such as Far Cry 6 run smoothly at the native display resolution and with maximum details.
| The Witcher 3 | |
| 1920x1080 High Graphics & Postprocessing (Nvidia HairWorks Off) | |
| Average of class Gaming (17.5 - 449, n=166, last 2 years) | |
| SCHENKER XMG Apex 17 M21 | |
| Average NVIDIA GeForce RTX 3060 Laptop GPU (81 - 186.8, n=41) | |
| SCHENKER XMG Core 17 (Early 2021) | |
| Asus TUF Gaming F17 FX706HM | |
| MSI Katana GF76 11UE | |
| Lenovo Legion 5 17ACH6H-82JY0003GE | |
| 1920x1080 Ultra Graphics & Postprocessing (HBAO+) | |
| Average of class Gaming (8.61 - 216, n=226, last 2 years) | |
| SCHENKER XMG Apex 17 M21 | |
| Gigabyte A7 X1 | |
| Lenovo Legion 5 17ACH6H-82JY0003GE | |
| SCHENKER XMG Core 17 (Early 2021) | |
| Average NVIDIA GeForce RTX 3060 Laptop GPU (58.2 - 91.5, n=48) | |
| Asus TUF Gaming F17 FX706HM | |
| MSI Katana GF76 11UE | |
The performance remains consistent durinig our The Witcher 3 stress test at ultra settings. Thus, we do not expect the frame rates to drop to unplayable levels even after prolonged gaming sessions.
Witcher 3 FPS Chart
| low | med. | high | ultra | |
| GTA V (2015) | 172 | 167 | 149 | 78.6 |
| The Witcher 3 (2015) | 281 | 221 | 125 | 81.4 |
| Dota 2 Reborn (2015) | 138.8 | 127.8 | 119.3 | 117.6 |
| Final Fantasy XV Benchmark (2018) | 157 | 113 | 85.2 | |
| X-Plane 11.11 (2018) | 95 | 86.3 | 71.3 | |
| Far Cry 5 (2018) | 125 | 111 | 106 | 99 |
| Strange Brigade (2018) | 353 | 225 | 180 | 155 |
| Far Cry New Dawn (2019) | 107 | 96 | 94 | 86 |
| Metro Exodus (2019) | 151 | 104 | 79.8 | 62.3 |
| Borderlands 3 (2019) | 116 | 102 | 90.3 | 74.3 |
| F1 2020 (2020) | 239 | 204 | 193 | 142 |
| F1 2021 (2021) | 257 | 233 | 198 | 107 |
| Far Cry 6 (2021) | 102 | 90.8 | 81.2 | 59.8 |
Emissions
System Noise
For gaming laptops, the noise level of the cooling solution is often a big issue. High performance characteristics are often accompanied by a noisy system. The Lenovo Legioin 5 17 strikes a good balance. The cooling solution, which consists of three heatpipes and two fans, is effective and relatively quiet in most cases. While idling, the device is often completely silent. With 37.5 dB(A), the Lenovo Legion 5 17 is one of the quieter gaming laptops. At worst, we measured up to 51 dB(A) during our stress test.
Noise Level
| Idle |
| 25 / 25 / 30.5 dB(A) |
| Load |
| 37.5 / 51 dB(A) |
 | ||
30 dB silent 40 dB(A) audible 50 dB(A) loud |
||
min: | ||
| Lenovo Legion 5 17ACH6H-82JY0003GE GeForce RTX 3060 Laptop GPU, R5 5600H, Samsung PM991a MZALQ512HBLU | SCHENKER XMG Core 17 (Early 2021) GeForce RTX 3060 Laptop GPU, i7-10870H, Samsung SSD 970 EVO Plus 1TB | Asus TUF Gaming F17 FX706HM GeForce RTX 3060 Laptop GPU, i9-11900H, SK Hynix HFM001TD3JX013N | MSI Katana GF76 11UE GeForce RTX 3060 Laptop GPU, i7-11800H, Kingston OM8PCP3512F-AB | SCHENKER XMG Apex 17 M21 GeForce RTX 3070 Laptop GPU, R7 5800H, Samsung SSD 970 EVO Plus 1TB | Gigabyte A7 X1 GeForce RTX 3070 Laptop GPU, R9 5900HX, ESR512GTLCG-EAC-4 | |
|---|---|---|---|---|---|---|
| Noise | -19% | -10% | -23% | -14% | -16% | |
| off / environment * | 25 | 25 -0% | 25 -0% | 25 -0% | 25 -0% | 24 4% |
| Idle Minimum * | 25 | 30 -20% | 26 -4% | 33 -32% | 25 -0% | 25 -0% |
| Idle Average * | 25 | 32 -28% | 31 -24% | 34 -36% | 28 -12% | 29 -16% |
| Idle Maximum * | 30.5 | 36 -18% | 33 -8% | 35 -15% | 31 -2% | 35 -15% |
| Load Average * | 37.5 | 53 -41% | 48 -28% | 53 -41% | 57 -52% | 58 -55% |
| Load Maximum * | 51 | 54 -6% | 49 4% | 57 -12% | 59 -16% | 59 -16% |
| Witcher 3 ultra * | 51 | 47 | 49 | 57 | 57 |
* ... smaller is better
Temperature
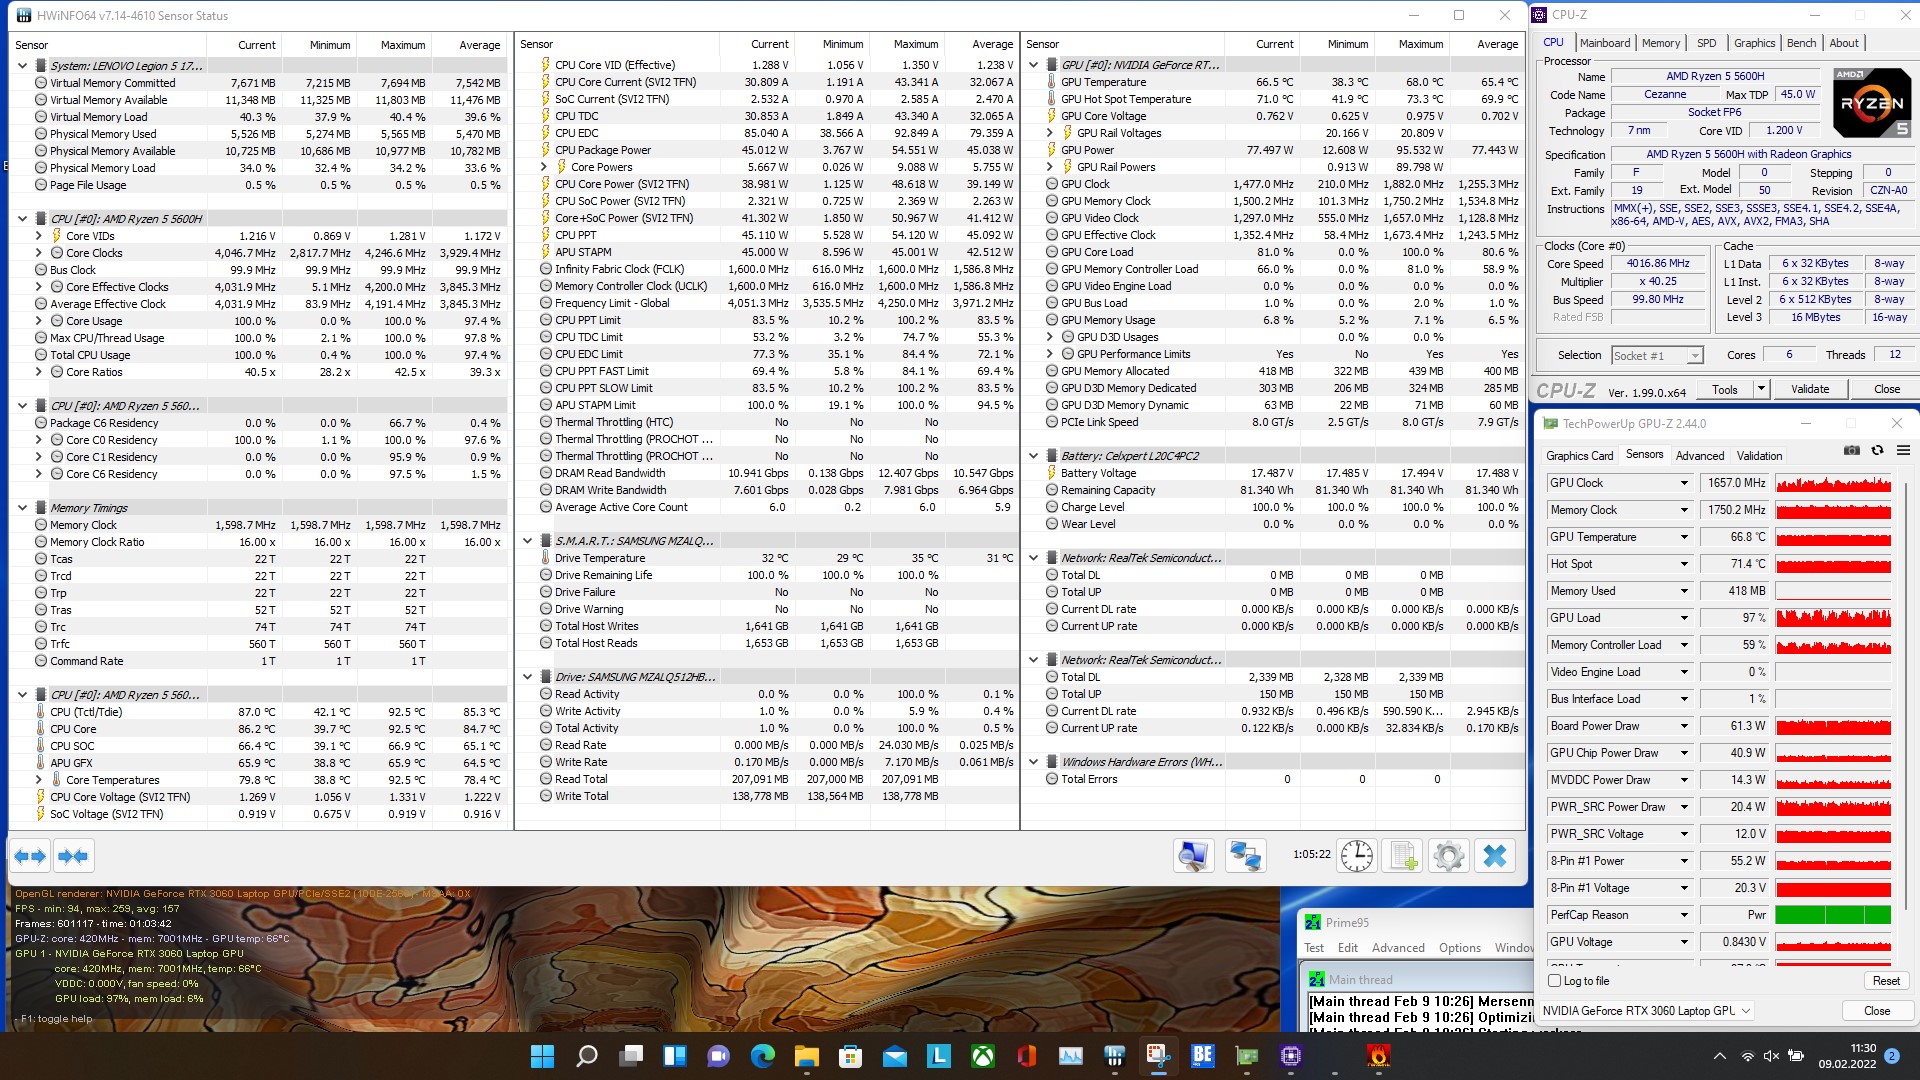
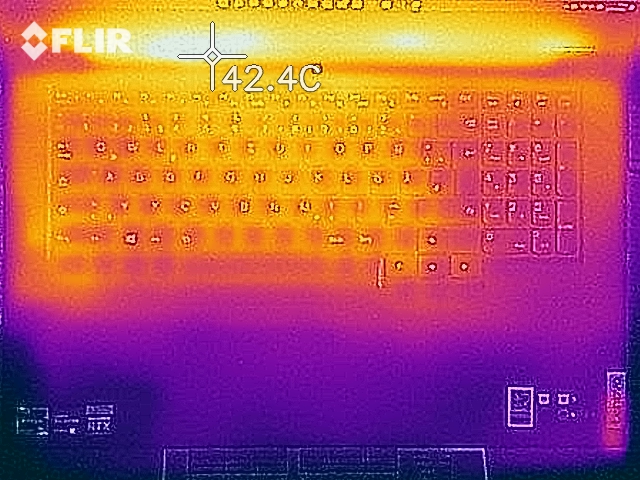
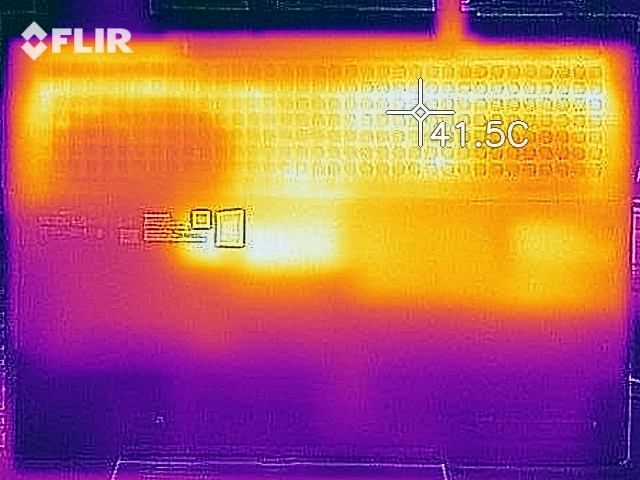
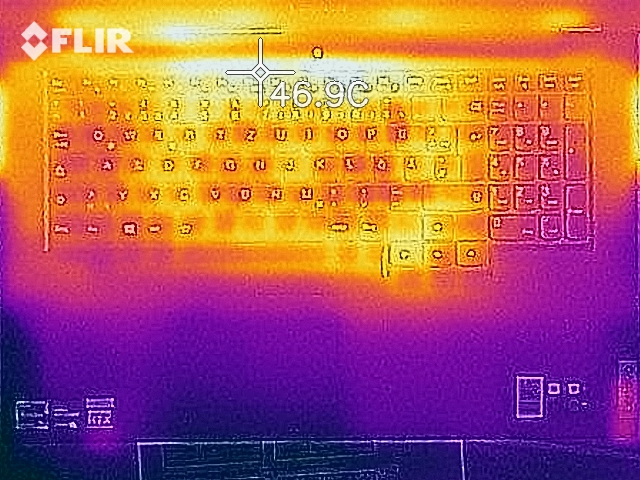
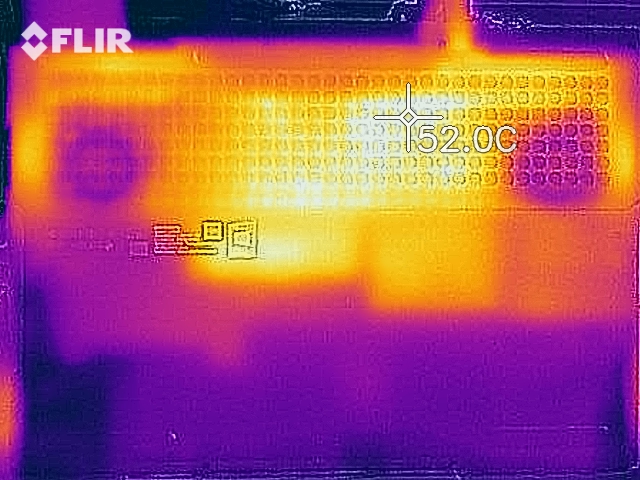
The Lenovo Legion 5 17 handles its heat development very well overall. With a maximum temperature of 51 °C (123.8 °F), the surface temperatures are not problematic, either. We have seen much worse in this category. We still advise against using the device on your legs, since this may adversely affect the airflow. The SoC and the GPU reach 92.5 °C (198.5 °F) and 73.3 °C (163.94 °F), respectively, during our stress test. All of these values are non-critical, which explains why the Lenovo Legion 5 17 did not have to throttle during our load scenarios (e.g.: Cinebench R15 multi loop and The Witcher 3).
(±) The maximum temperature on the upper side is 42.2 °C / 108 F, compared to the average of 40.4 °C / 105 F, ranging from 21.2 to 68.8 °C for the class Gaming.
(-) The bottom heats up to a maximum of 50.9 °C / 124 F, compared to the average of 43.2 °C / 110 F
(+) In idle usage, the average temperature for the upper side is 29.1 °C / 84 F, compared to the device average of 33.8 °C / 93 F.
(+) The palmrests and touchpad are cooler than skin temperature with a maximum of 25.6 °C / 78.1 F and are therefore cool to the touch.
(+) The average temperature of the palmrest area of similar devices was 28.9 °C / 84 F (+3.3 °C / 5.9 F).
| Lenovo Legion 5 17ACH6H-82JY0003GE AMD Ryzen 5 5600H, NVIDIA GeForce RTX 3060 Laptop GPU | SCHENKER XMG Core 17 (Early 2021) Intel Core i7-10870H, NVIDIA GeForce RTX 3060 Laptop GPU | Asus TUF Gaming F17 FX706HM Intel Core i9-11900H, NVIDIA GeForce RTX 3060 Laptop GPU | MSI Katana GF76 11UE Intel Core i7-11800H, NVIDIA GeForce RTX 3060 Laptop GPU | SCHENKER XMG Apex 17 M21 AMD Ryzen 7 5800H, NVIDIA GeForce RTX 3070 Laptop GPU | Gigabyte A7 X1 AMD Ryzen 9 5900HX, NVIDIA GeForce RTX 3070 Laptop GPU | |
|---|---|---|---|---|---|---|
| Heat | -1% | -22% | -2% | 6% | 7% | |
| Maximum Upper Side * | 42.2 | 44 -4% | 58.5 -39% | 51 -21% | 45 -7% | 44 -4% |
| Maximum Bottom * | 50.9 | 50 2% | 58.5 -15% | 52 -2% | 49 4% | 49 4% |
| Idle Upper Side * | 34.3 | 30 13% | 38 -11% | 32 7% | 27 21% | 27 21% |
| Idle Bottom * | 32 | 36 -13% | 39 -22% | 29 9% | 30 6% | 30 6% |
* ... smaller is better
Speakers
The system comes with two stereo speakers. The sound is balanced overall and there is not a complete lack of bass. Unfortunately, Lenovo has decided against equipping the Legion 5 17 with a dedicated subwoofer. For an ideal audio experience, we recommend a headset. Appropriate models can be connected via the 3.5mm audio jack or USB.
Lenovo Legion 5 17ACH6H-82JY0003GE audio analysis
(±) | speaker loudness is average but good (78.3 dB)
Bass 100 - 315 Hz
(-) | nearly no bass - on average 19.1% lower than median
(±) | linearity of bass is average (13.8% delta to prev. frequency)
Mids 400 - 2000 Hz
(+) | balanced mids - only 3% away from median
(+) | mids are linear (5% delta to prev. frequency)
Highs 2 - 16 kHz
(+) | balanced highs - only 4.8% away from median
(+) | highs are linear (6.7% delta to prev. frequency)
Overall 100 - 16.000 Hz
(±) | linearity of overall sound is average (15.8% difference to median)
Compared to same class
» 34% of all tested devices in this class were better, 7% similar, 59% worse
» The best had a delta of 6%, average was 18%, worst was 132%
Compared to all devices tested
» 20% of all tested devices were better, 5% similar, 75% worse
» The best had a delta of 4%, average was 25%, worst was 134%
Gigabyte A7 X1 audio analysis
(+) | speakers can play relatively loud (85 dB)
Bass 100 - 315 Hz
(-) | nearly no bass - on average 30.3% lower than median
(±) | linearity of bass is average (13.4% delta to prev. frequency)
Mids 400 - 2000 Hz
(±) | higher mids - on average 6.8% higher than median
(±) | linearity of mids is average (11.3% delta to prev. frequency)
Highs 2 - 16 kHz
(+) | balanced highs - only 4.4% away from median
(+) | highs are linear (5.4% delta to prev. frequency)
Overall 100 - 16.000 Hz
(±) | linearity of overall sound is average (23.5% difference to median)
Compared to same class
» 83% of all tested devices in this class were better, 5% similar, 12% worse
» The best had a delta of 6%, average was 18%, worst was 132%
Compared to all devices tested
» 66% of all tested devices were better, 7% similar, 27% worse
» The best had a delta of 4%, average was 25%, worst was 134%
Energy Management
Energy Consumption
The power consumption of the Lenovo Legion 5 17 during idle could have been significantly better. This ends up costing it important points in our ranking. A good example for this category is the Asus TUF Gaming F17. By contrast, the Legion 5 17 is pleasantly economical under load and while gaming. We measured a maximum consumption of 170 watts. This makes the 300-watt AC adapter look almost excessive.
| Off / Standby | |
| Idle | |
| Load |
|
| Lenovo Legion 5 17ACH6H-82JY0003GE R5 5600H, GeForce RTX 3060 Laptop GPU, Samsung PM991a MZALQ512HBLU, IPS, 1920x1080, 17.30 | SCHENKER XMG Core 17 (Early 2021) i7-10870H, GeForce RTX 3060 Laptop GPU, Samsung SSD 970 EVO Plus 1TB, IPS, 2560x1440, 17.30 | Asus TUF Gaming F17 FX706HM i9-11900H, GeForce RTX 3060 Laptop GPU, SK Hynix HFM001TD3JX013N, IPS, 1920x1080, 17.30 | MSI Katana GF76 11UE i7-11800H, GeForce RTX 3060 Laptop GPU, Kingston OM8PCP3512F-AB, IPS, 1920x1080, 17.30 | SCHENKER XMG Apex 17 M21 R7 5800H, GeForce RTX 3070 Laptop GPU, Samsung SSD 970 EVO Plus 1TB, IPS, 1920x1080, 17.30 | Gigabyte A7 X1 R9 5900HX, GeForce RTX 3070 Laptop GPU, ESR512GTLCG-EAC-4, IPS, 1920x1080, 17.30 | Average NVIDIA GeForce RTX 3060 Laptop GPU | Average of class Gaming | |
|---|---|---|---|---|---|---|---|---|
| Power Consumption | -3% | 19% | 16% | 2% | -1% | 13% | -6% | |
| Idle Minimum * | 15.6 | 13 17% | 10.3 34% | 9 42% | 10 36% | 12 23% | 10.4 ? 33% | 13.8 ? 12% |
| Idle Average * | 20.7 | 16 23% | 13.1 37% | 13 37% | 14 32% | 14 32% | 14.5 ? 30% | 19.2 ? 7% |
| Idle Maximum * | 22.9 | 29 -27% | 14.1 38% | 20 13% | 20 13% | 19 17% | 21.4 ? 7% | 27 ? -18% |
| Load Average * | 134 | 100 25% | 110 18% | 102 24% | 112 16% | 118 12% | 109.3 ? 18% | 111.3 ? 17% |
| Witcher 3 ultra * | 135 | 173 -28% | 138 -2% | 149 -10% | 202 -50% | 205 -52% | ||
| Load Maximum * | 170 | 213 -25% | 190 -12% | 187 -10% | 231 -36% | 229 -35% | 206 ? -21% | 251 ? -48% |
* ... smaller is better
Energy Consumption Witcher 3 / Stress test
Energy Consumption external Monitor
Battery Life
With its fixed 80-Wh battery, the Lenovo Legion 5 17 lasts only 4.5 hours in our Wi-Fi test. However, several competitors do not do much better in this instance, either. Here, only the Asus TUF Gaming F17 is able to set itself apart with significantly longer battery life. Since the Lenovo Legion 5 17 is equipped with the second-largest battery in our comparison, we still expected more. At least the battery life is sufficient for a movie night when fully charged.
It should be noted that the CPU and GPU performance is slightly throttled in battery mode. This is the case for almost all current gaming laptops, however.

| Lenovo Legion 5 17ACH6H-82JY0003GE R5 5600H, GeForce RTX 3060 Laptop GPU, 80 Wh | SCHENKER XMG Core 17 (Early 2021) i7-10870H, GeForce RTX 3060 Laptop GPU, 62 Wh | Asus TUF Gaming F17 FX706HM i9-11900H, GeForce RTX 3060 Laptop GPU, 90 Wh | MSI Katana GF76 11UE i7-11800H, GeForce RTX 3060 Laptop GPU, 53 Wh | SCHENKER XMG Apex 17 M21 R7 5800H, GeForce RTX 3070 Laptop GPU, 49 Wh | Gigabyte A7 X1 R9 5900HX, GeForce RTX 3070 Laptop GPU, 48.96 Wh | Average of class Gaming | |
|---|---|---|---|---|---|---|---|
| Battery Runtime | 14% | 84% | -12% | -2% | -15% | 42% | |
| Reader / Idle | 331 | 462 40% | 286 -14% | 422 27% | 544 ? 64% | ||
| H.264 | 212 | 283 33% | 512 142% | 232 9% | 399 ? 88% | ||
| WiFi v1.3 | 263 | 293 11% | 454 73% | 220 -16% | 294 12% | 280 6% | 368 ? 40% |
| Load | 111 | 80 -28% | 151 36% | 80 -28% | 62 -44% | 72 -35% | 84.2 ? -24% |
| Witcher 3 ultra | 50 | 80.6 ? |
Pros
Cons
Verdict - Solid Gaming System without Major Weaknesses
The Lenovo Legion 5 17 is a current-gen 17-inch gaming laptop and equipped with the latest AMD CPU and a powerful GPU, that manages to reach its full potential. The AMD Ryzen 5 5600H is a very good choice for this laptop and able to maintain its performance level for long periods of time. Our test model only falls behind consistently in a direct comparison with its competitors that are often equipped with eight cores and 16 threads. Despite this, the Legion 5 17 leaves an excellent impression and is almost able to keep up with an Nvidia GeForce RTX 3070 mobile GPU in synthetic benchmarks thanks to its non-limited Nvidia GeForce RTX 3060 mobile GPU. We were also pleased with the 17-inch display, which comes precalibrated ex-factory. This is something we would like to see more of. The 144-Hz refresh rate clearly designates the Lenovo for gaming. However, it is also well suited to video or photo editing thanks to its low deltaE-2000 values.
The Lenovo Legion 5 17 is an overall solid gaming laptop with an up-to-date AMD Ryzen CPU and an Nvidia GeForce GPU without artificial limitations.
Overall, the Lenovo Legion 5 17 is a solid gaming laptop with a large port selection. Unfortunately, Thunderbolt is missing, although the fast GPU performance may offset this. There are not really any major weaknesses. We expected more battery life due to the large battery capacity. The size and position of the touchpad should potentially be revisited. That being said, the touchpad will likely be little more than an afterthought, since most users are going to connect an external mouse in the majority of cases. Furthermore, the system only produces moderate noise levels under load. In this regard, we are used to much worse results. We advise against being to stingy in terms of the storage options. At least 1 TB of storage should be the norm for a gaming laptop. Thankfully, the device has a slot for a secondary drive.
Price and Availability
At the time of writing, the laptop is on sale directly from Lenovo's online shop for around 1220 USD instead of about 1500 USD and listed as the "premium" model. However, it should be noted that shipping will take at least 2 months.
Lenovo Legion 5 17ACH6H-82JY0003GE
-
02/21/2022 v7
Sebastian Bade
More articles related to this device
Lenovo Legion 5 17ACH6H-82JY0003GE (Legion 5 17 Series)Related Articles


Pricecompare

