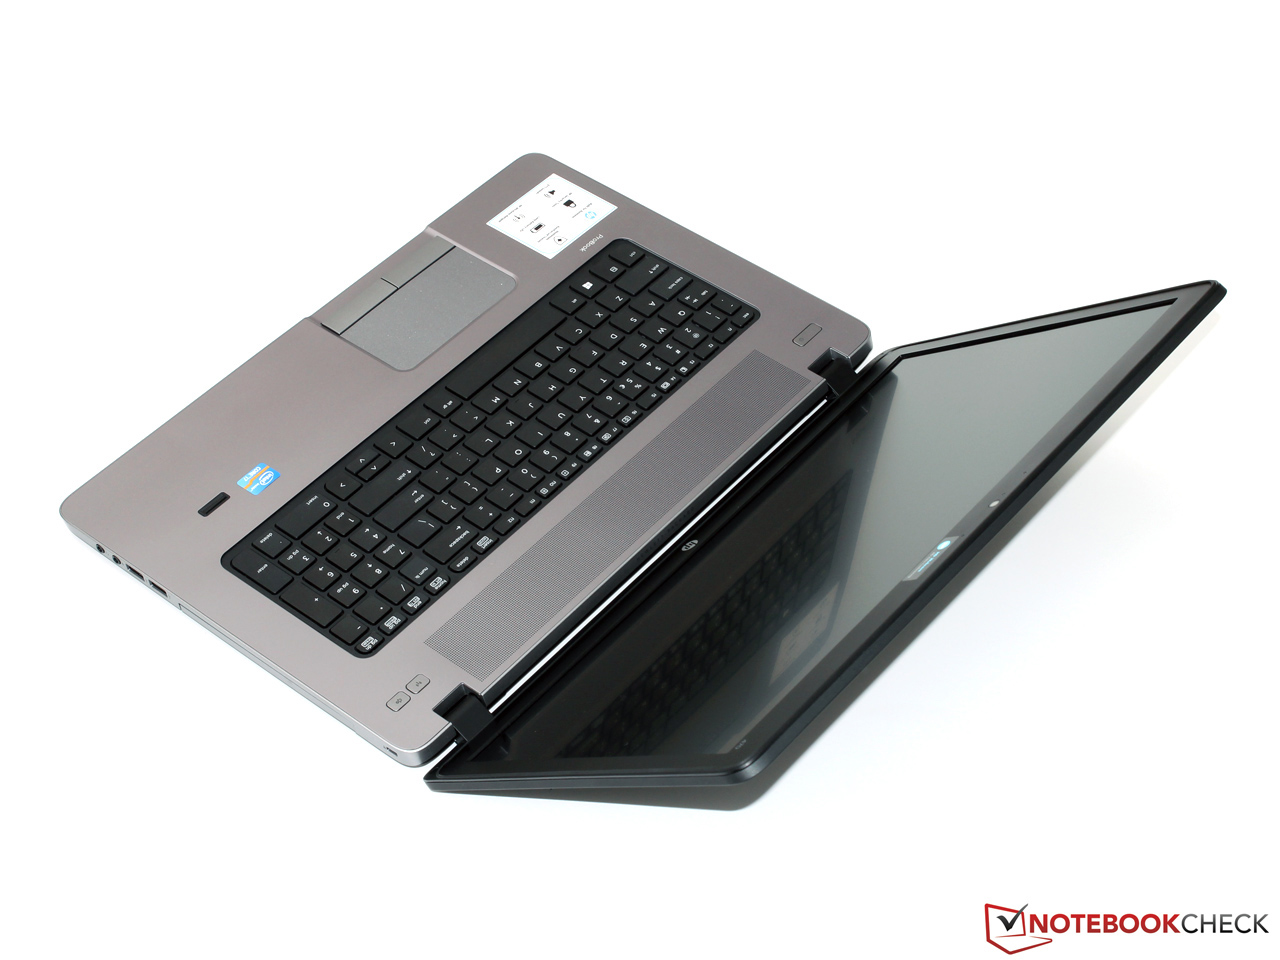
HP ProBook 470 G2 (G6W68EA) Notebook Review Update
")
For the original German review, see here.
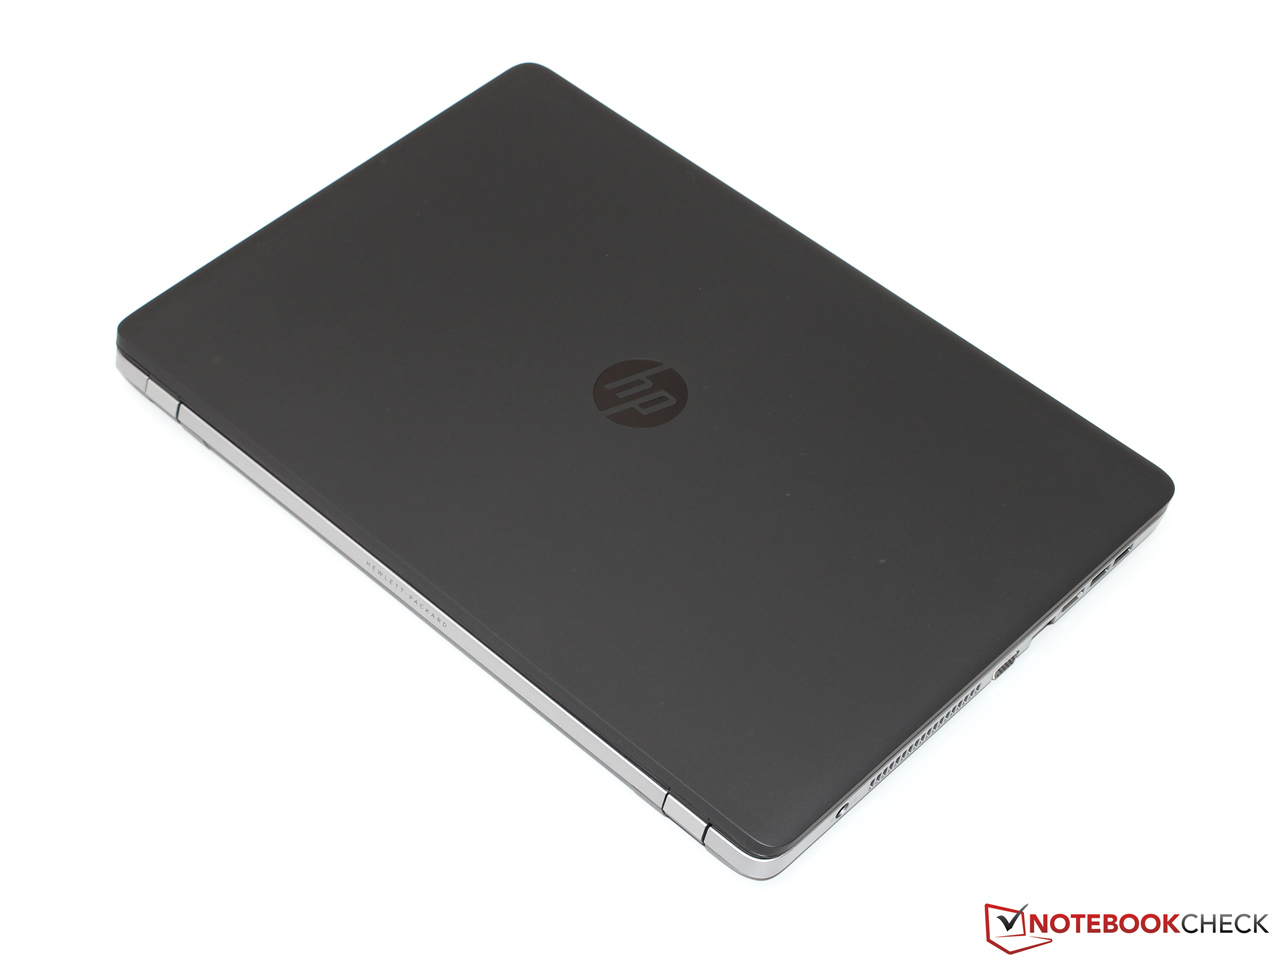
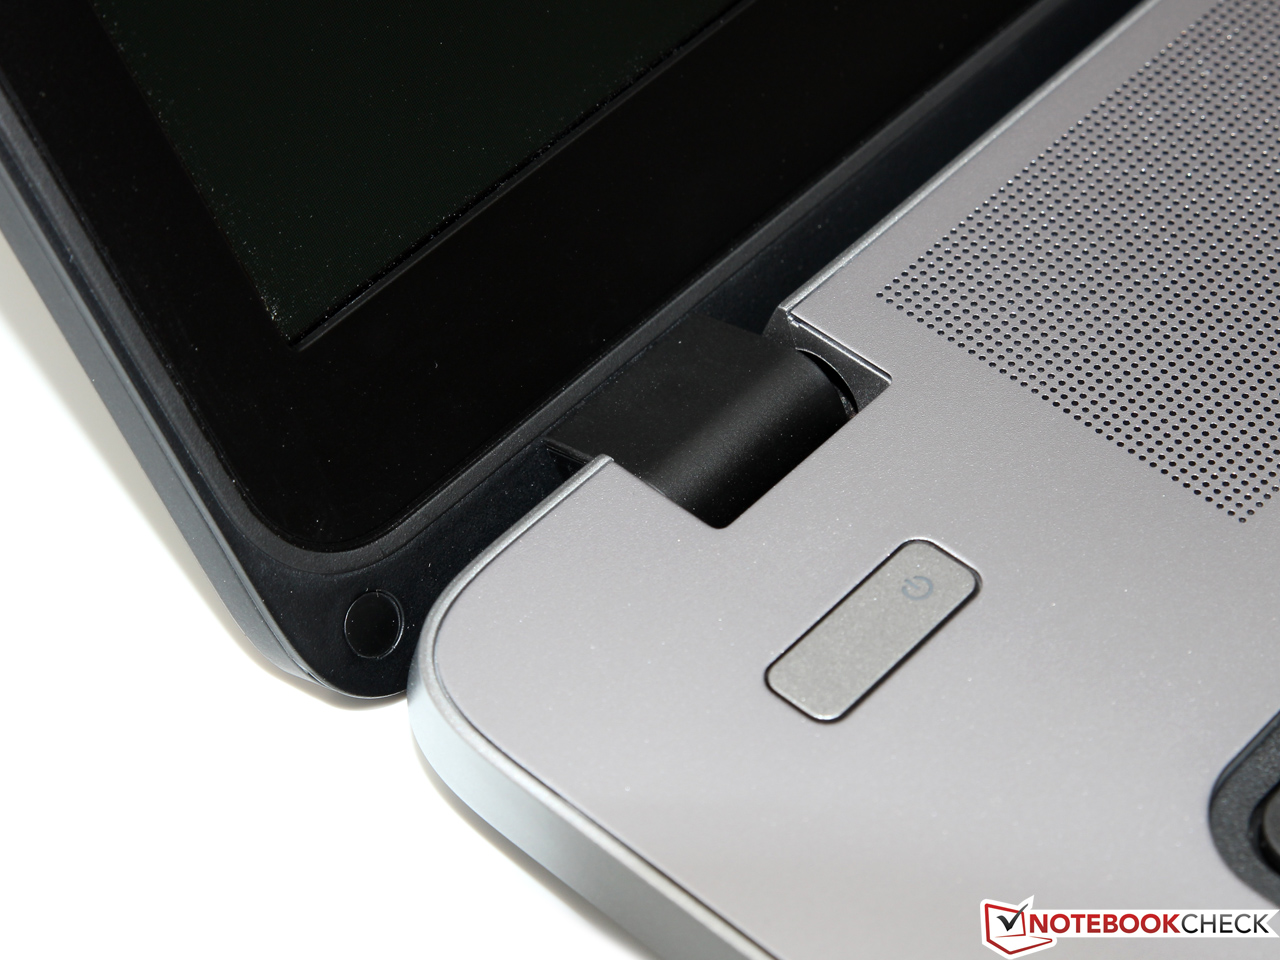
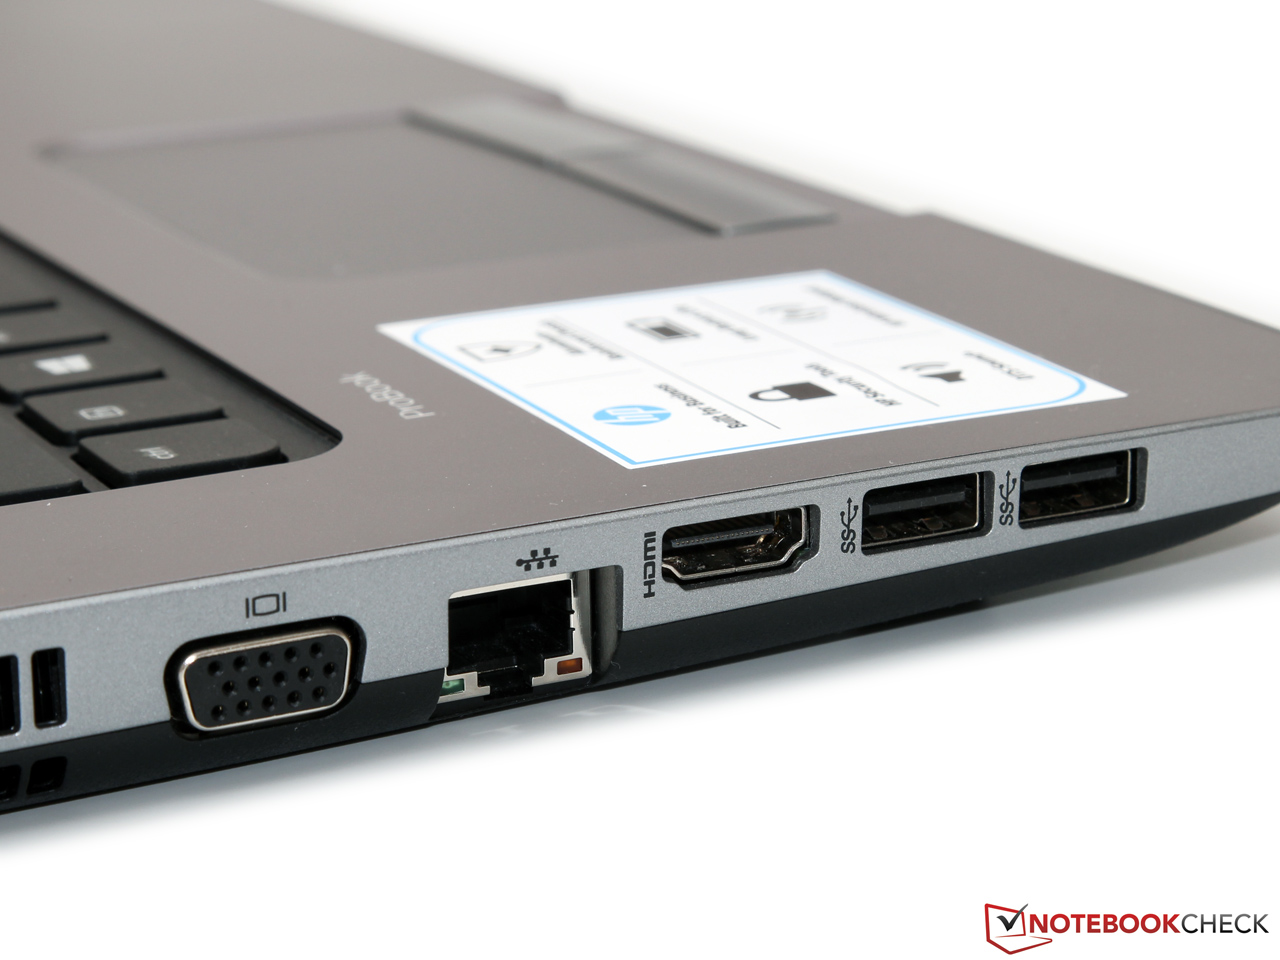
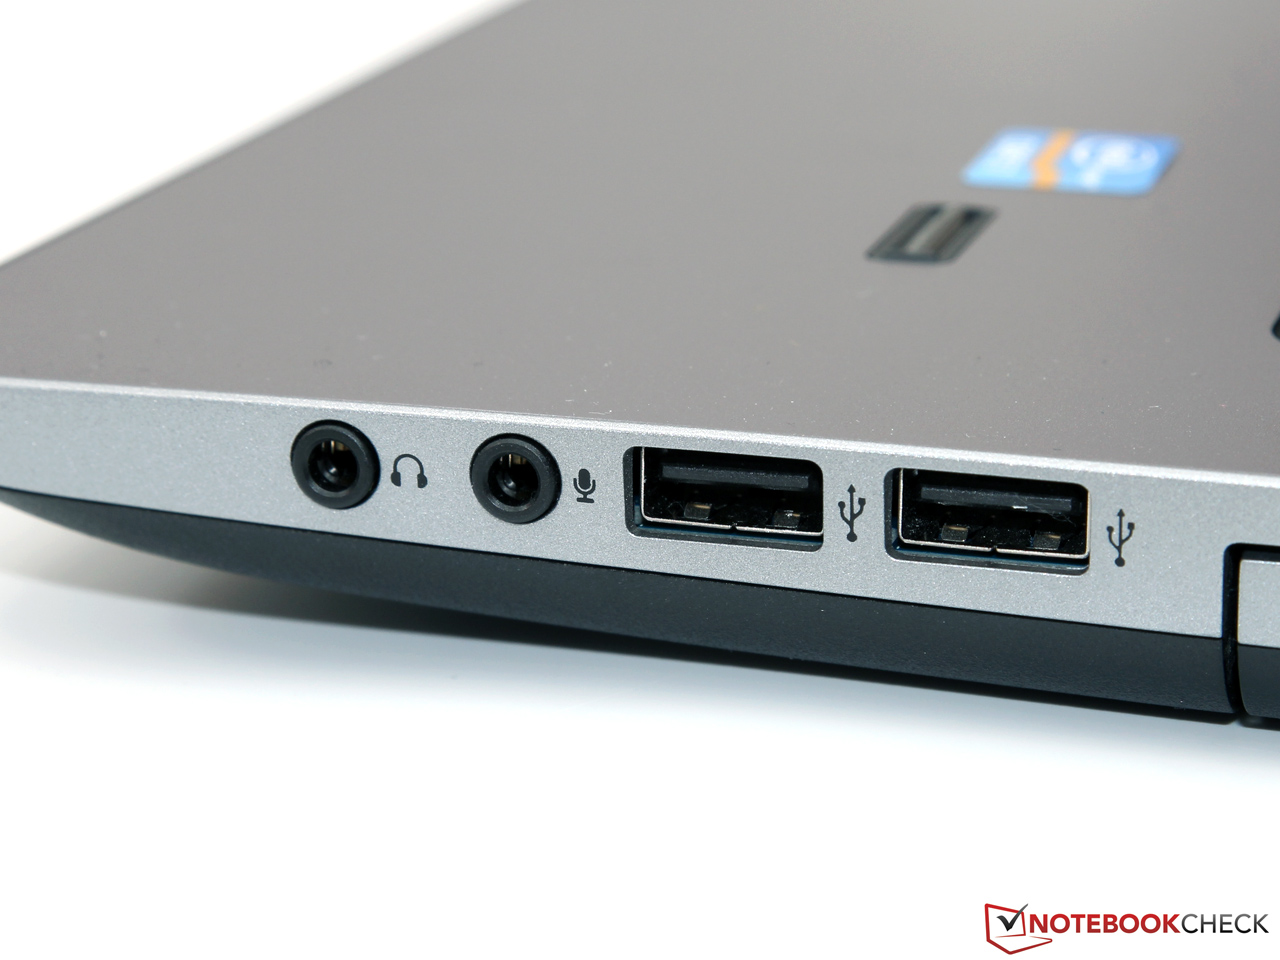
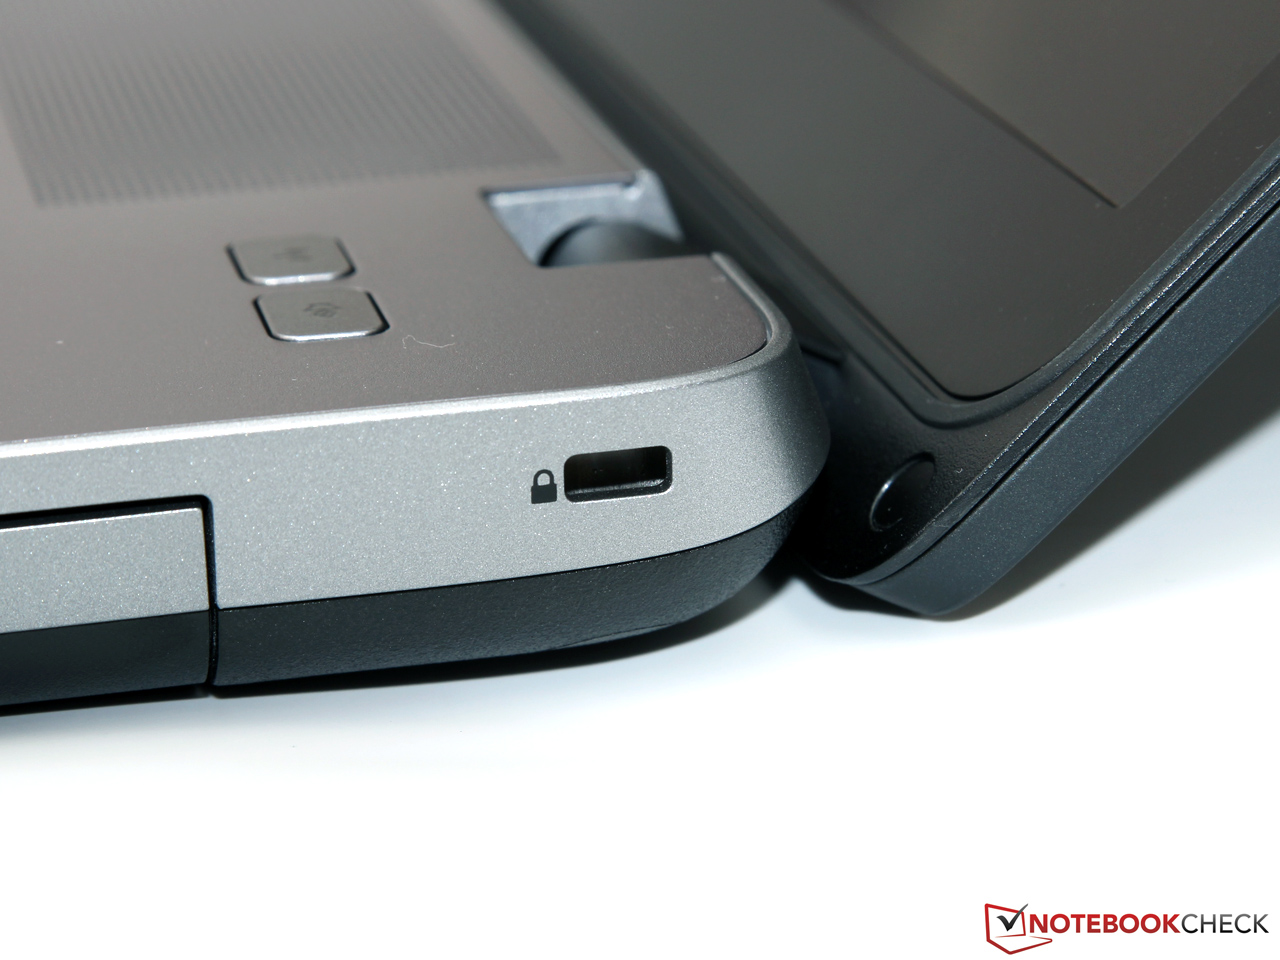
The segment of affordable 17-inch notebooks which are suitable for both work and play isn't exactly crowded. HP's offerings consists of machines in the 47XX-series of notebooks. In February, we looked at the predecessor HP ProBook 470 G1, which sports an Intel Core i5-4200M (2x 2.5 - 3.1 GHz, Hyper-threading, TDP 37 W), AMD Radeon HD 8750M and a display panel from AU Optronics. The G1 impressed us with its decent performance, high build quality, and very good input devices. The ancestor of both he G1 and the G2 is the Ivy Bridge-based ProBook 470 G0, which we reviewed in October of 2013. Since the three notebooks are identical save for the hardware components, we won't spend any time examining the chassis, connectivity, input devices, or the speakers, amongst other things. Please take a look at the G0 for more information. The G1 sold for about 850 Euro (~$1060), but the price has now dropped to about 620 Euro (~$770). Our review notebook costs 730 Euro (~$900) when purchased from HP directly but can be found for around 620 Euro (~$770) elsewhere. It's important to keep the original price difference in mind when comparing the models.
In addition to our review notebook (G6W68EA), HP also sells another variant of the Probook 470 G2 (G6W69EA) for about 950 Euro (~$1180) in their online store. This version ships with a Full-HD display, a faster Intel Core i7-4510U processor (2x 2.0 - 3.1 GHz, Hyperthreading, TDP 15 W), 8 GB RAM and a 750 GB hard drive. Both notebooks come with an AMD Radeon R5 M255, but the more expensive version features 2 GB instead of 1 GB of dedicated RAM. For our review update, we are going to focus on the display, the performance, the battery life, and benchmark differences between the various platforms - in particular, the predecessor ProBook 470 G1.
Display
Just like the predecessor, the new model is equipped with an inexpensive 17.3-inch TN panel and features a resolution of 1600 x 900 pixels, which results in a - by today's standard - fairly low pixel density of 125 ppi. At normal distances from the screen, the picture is always sharp and not pixelated and the size of the picture elements is close to ideal. Notebooks above 600 Euro (~$750) should feature a maximum brightness of 250 cd/m² in our opinion, this requirement was met by the ProBook 470 G1, but not by the successor. The brightness distribution of 82 % isn't exactly a reason for celebration, but at the least the screen doesn't suffer from bleeding issues. The screen measurements remain unchanged when the notebook is running on battery.
| |||||||||||||||||||||||||
Brightness Distribution: 82 %
Center on Battery: 224 cd/m²
Contrast: 400:1 (Black: 0.56 cd/m²)
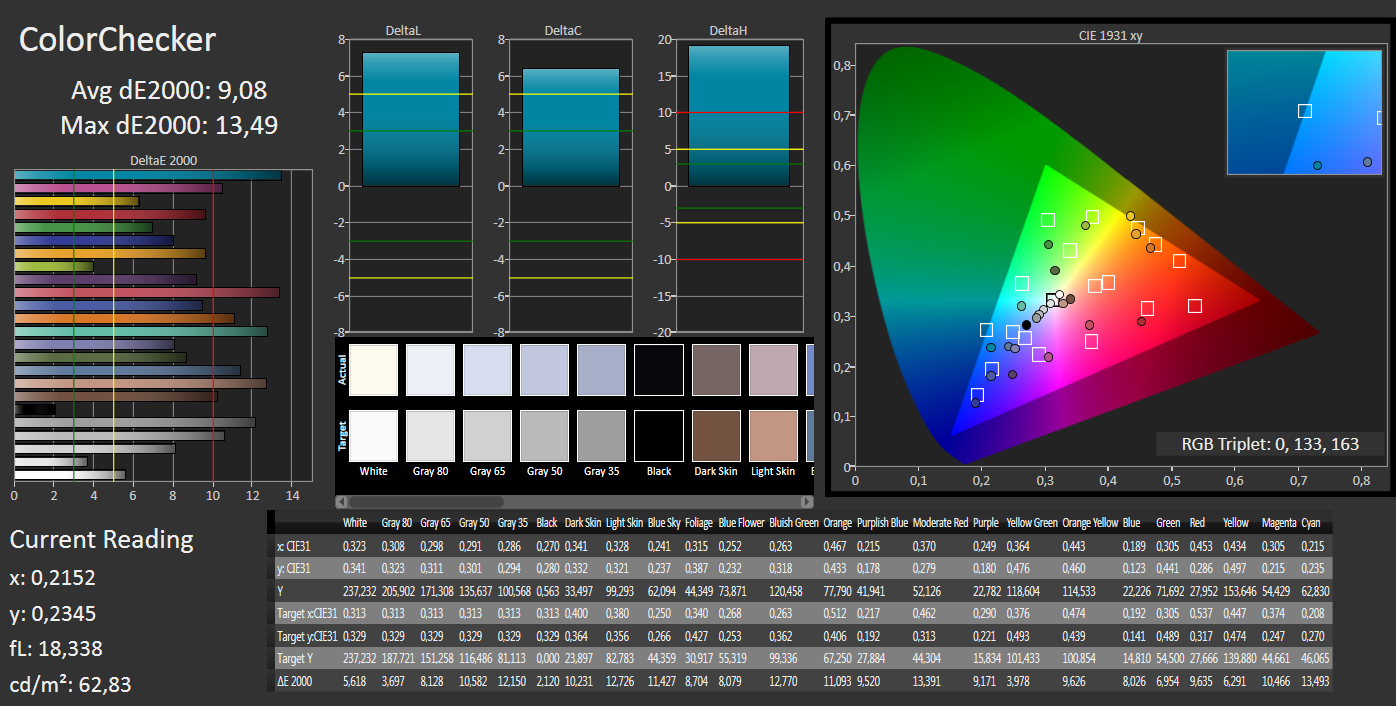
ΔE ColorChecker Calman: 9.08 | ∀{0.5-29.43 Ø4.81}
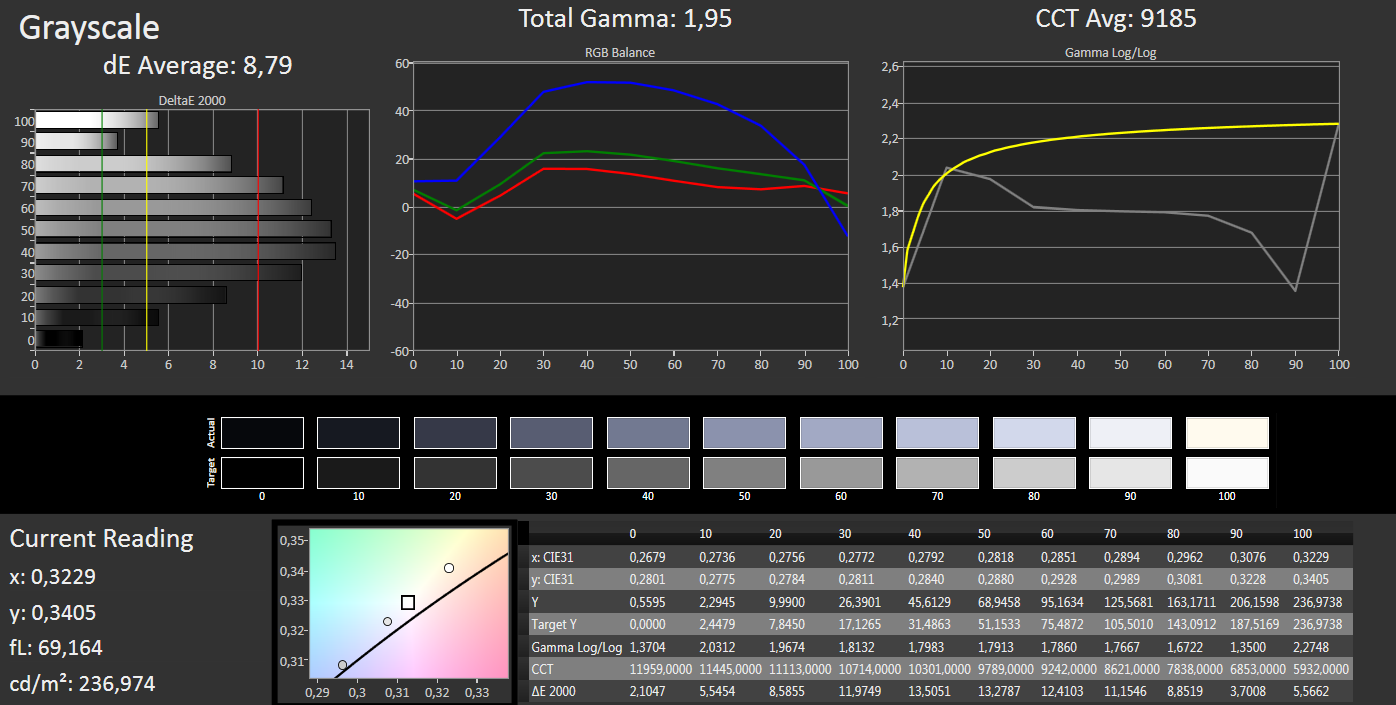
ΔE Greyscale Calman: 8.79 | ∀{0.09-98 Ø5.1}
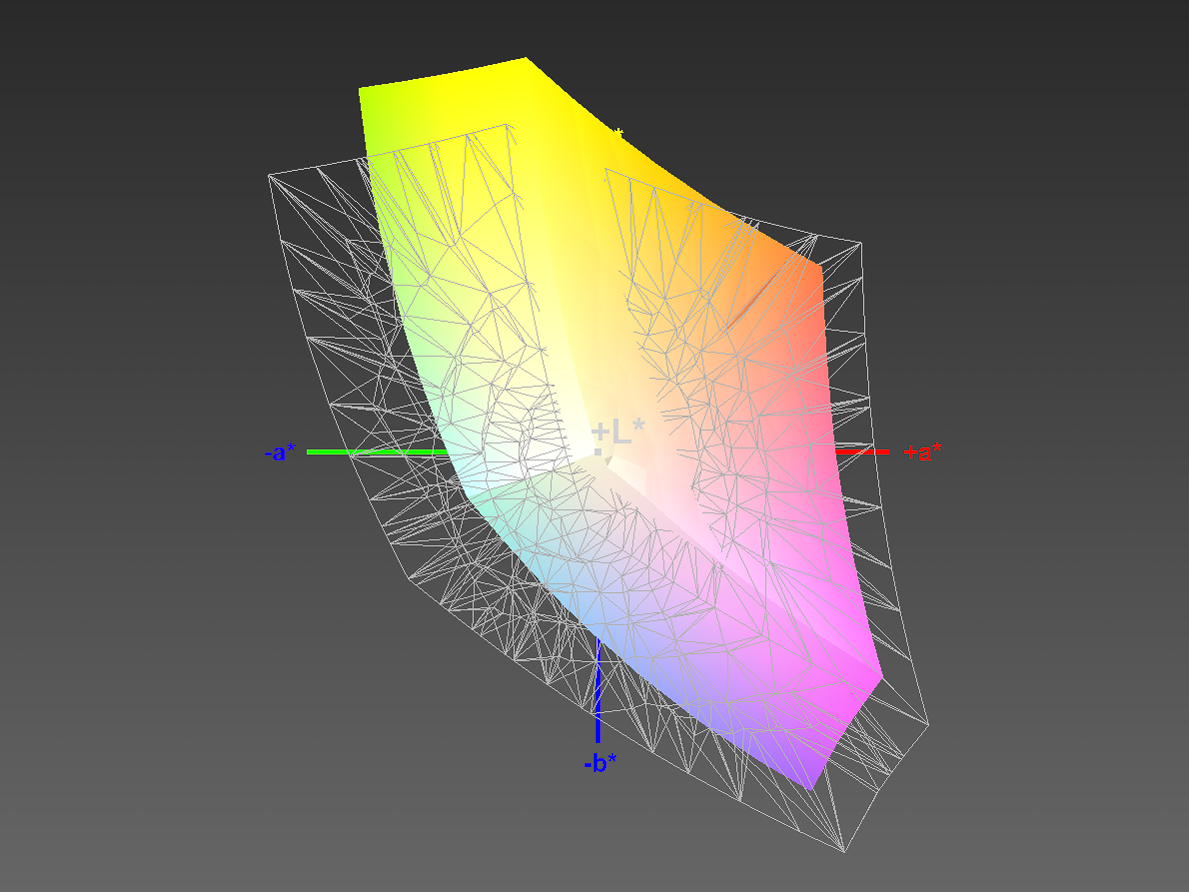
48% AdobeRGB 1998 (Argyll 1.6.3 3D)
53.7% AdobeRGB 1998 (Argyll 3D)
74.4% sRGB (Argyll 3D)
52.2% Display P3 (Argyll 3D)
Gamma: 1.95
CCT: 9185 K
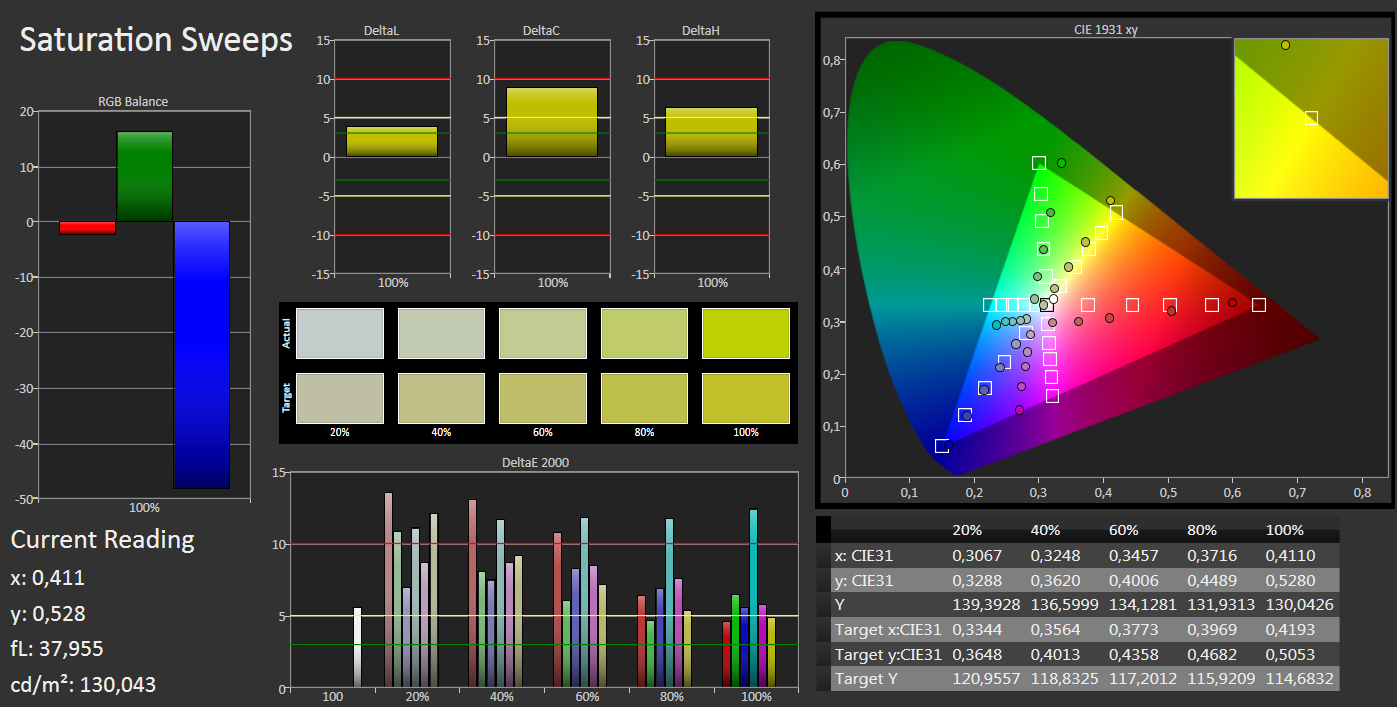
Despite the lower brightness, the review model still managed a contrast ratio of 400:1 thanks to a usable black value. Color reproduction is - similar to other TN displays - far from great, although the DeltaE deviation of 9 is high, but at least not devastatingly so. Just like the predecessor, the G2 only covers about 48 % of the professional AdobeRGB color space, which is about average for a TN display. All things considered, we prefer the display of the G1, since it is brighter, has better contrast and features slightly better color accuracy. The color profile we've attached below aims to reduce the bluish tint of the display and increase the overall warmth.

| HP ProBook 470 G2 (G6W68EA) Radeon R5 M255, 4210U, Seagate Momentus Thin ST500LT012-1DG142 | HP ProBook 470 G1 E9Y75EA Radeon HD 8750M, 4200M, Hitachi Travelstar Z5K500 HTS545050A7E380 | Dell Inspiron 15 3542-2293 GeForce 820M, 4210U, Seagate Momentus Thin ST500LT012-1DG142 | Acer Aspire E5-551-T8X3 Radeon R6 (Kaveri), A10-7300, Western Digital Scorpio Blue WD5000LPVX | |
|---|---|---|---|---|
| Display | -3% | -24% | -25% | |
| Display P3 Coverage (%) | 52.2 | 50.6 -3% | 38.83 -26% | 38.41 -26% |
| sRGB Coverage (%) | 74.4 | 72.5 -3% | 58.2 -22% | 56.8 -24% |
| AdobeRGB 1998 Coverage (%) | 53.7 | 52.4 -2% | 40.16 -25% | 39.9 -26% |
| Screen | 9% | 9% | -6% | |
| Brightness middle (cd/m²) | 224 | 269 20% | 228 2% | 178 -21% |
| Brightness (cd/m²) | 215 | 258 20% | 211 -2% | 179 -17% |
| Brightness Distribution (%) | 82 | 86 5% | 86 5% | 94 15% |
| Black Level * (cd/m²) | 0.56 | 0.58 -4% | 0.33 41% | 0.44 21% |
| Contrast (:1) | 400 | 464 16% | 691 73% | 405 1% |
| Colorchecker dE 2000 * | 9.08 | 7.49 18% | 9.6 -6% | 9.78 -8% |
| Greyscale dE 2000 * | 8.79 | 9.3 -6% | 10.17 -16% | 10.01 -14% |
| Gamma | 1.95 113% | 2.61 84% | 2.55 86% | 2.06 107% |
| CCT | 9185 71% | 10832 60% | 12431 52% | 11038 59% |
| Color Space (Percent of AdobeRGB 1998) (%) | 48 | 47.6 -1% | 37 -23% | 37 -23% |
| Total Average (Program / Settings) | 3% /
5% | -8% /
0% | -16% /
-11% |
* ... smaller is better
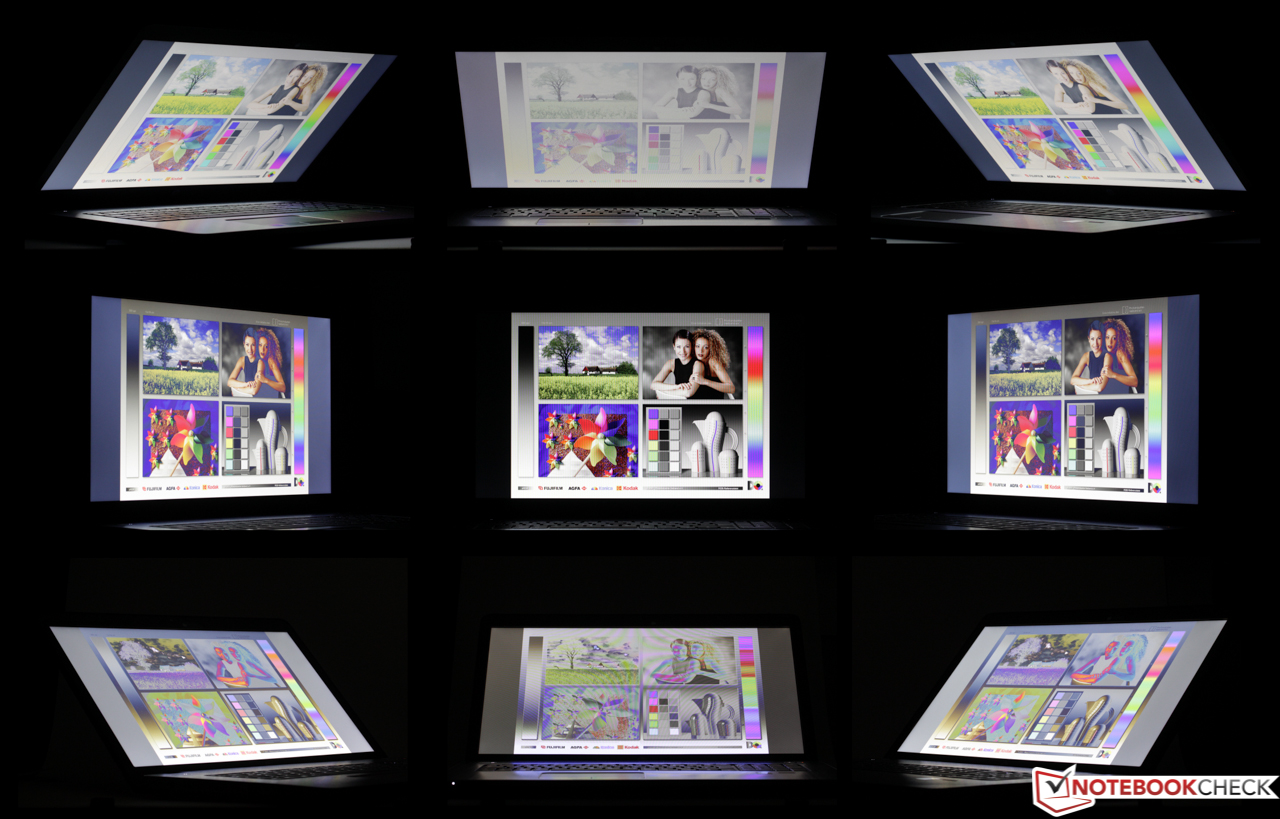
Despite the use of TN technology, the G2's viewing angle stability is still acceptable. Although the typical color inversions are still an issue, they happen at more shallow angles than what we are used to from budget TN displays. This is particular true in the horizontal plane. IPS panels are still vastly superior, however.

Performance
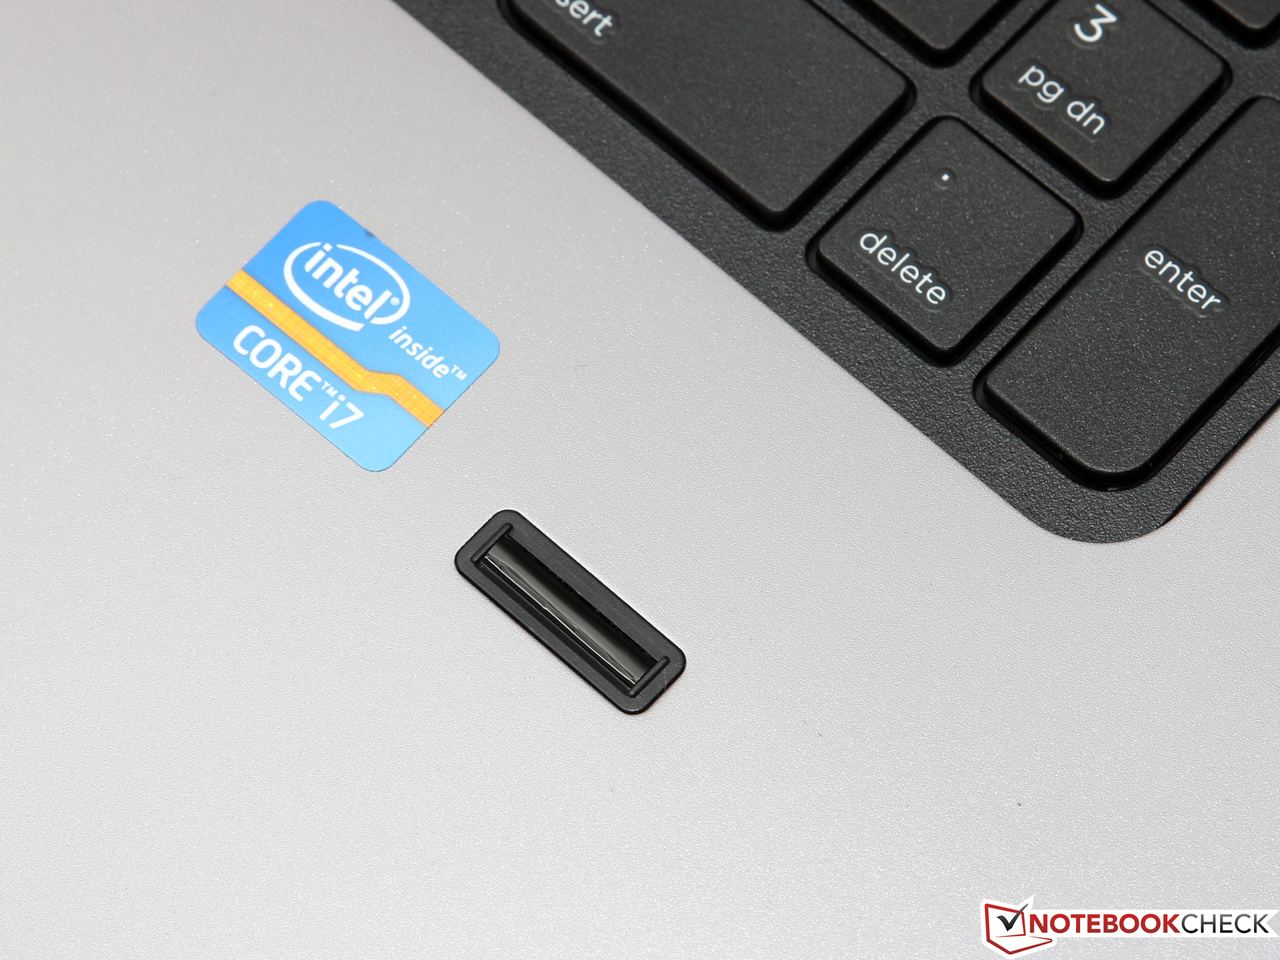
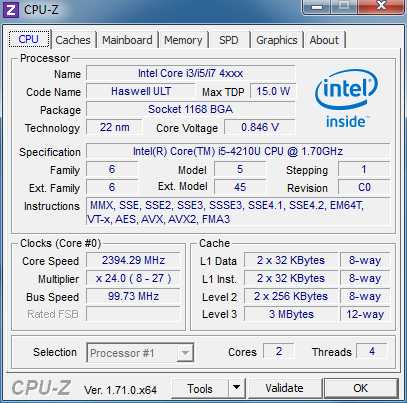
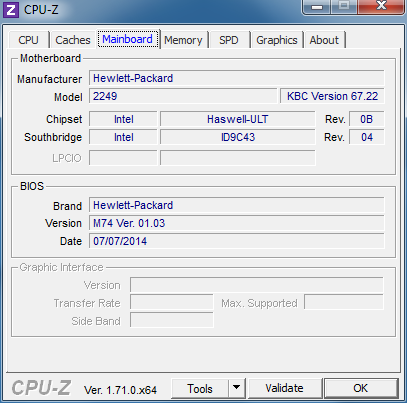
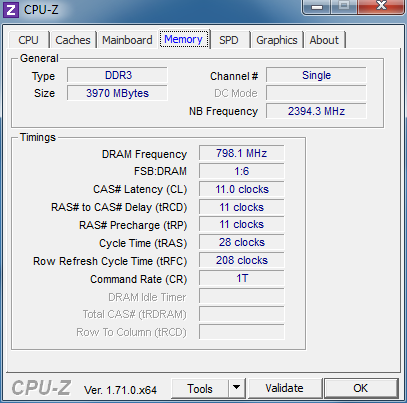
The HP ProBook 470 G2 (G6W68EA) is equipped with a frugal, but nonetheless fairly fast Intel Core i5-4210U (2x 1.7 - 2.7 GHz, Hyperthreading, TDP 15 W), a dedicated AMD Radeon R5 M255 graphics card with 1 GB of GDDR3 RAM, and a DVD-RW drive. Security features like a fingerprint reader and TPM chip are on board as well and the notebook, which sells for 730 Euro at the time of writing, competes as an entry-level business notebook with added multimedia functionality. The performance of the ProBook 470 G2 is more than sufficient to run a variety of software packages, including more demanding titles like Adobe Photoshop, and only reaches its limits with heavily parallelized applications, which profit from more than four physical cores. Even some current games are playable without stuttering, although concessions have to be made as far as the resolution and the quality settings are concerned.
Processor
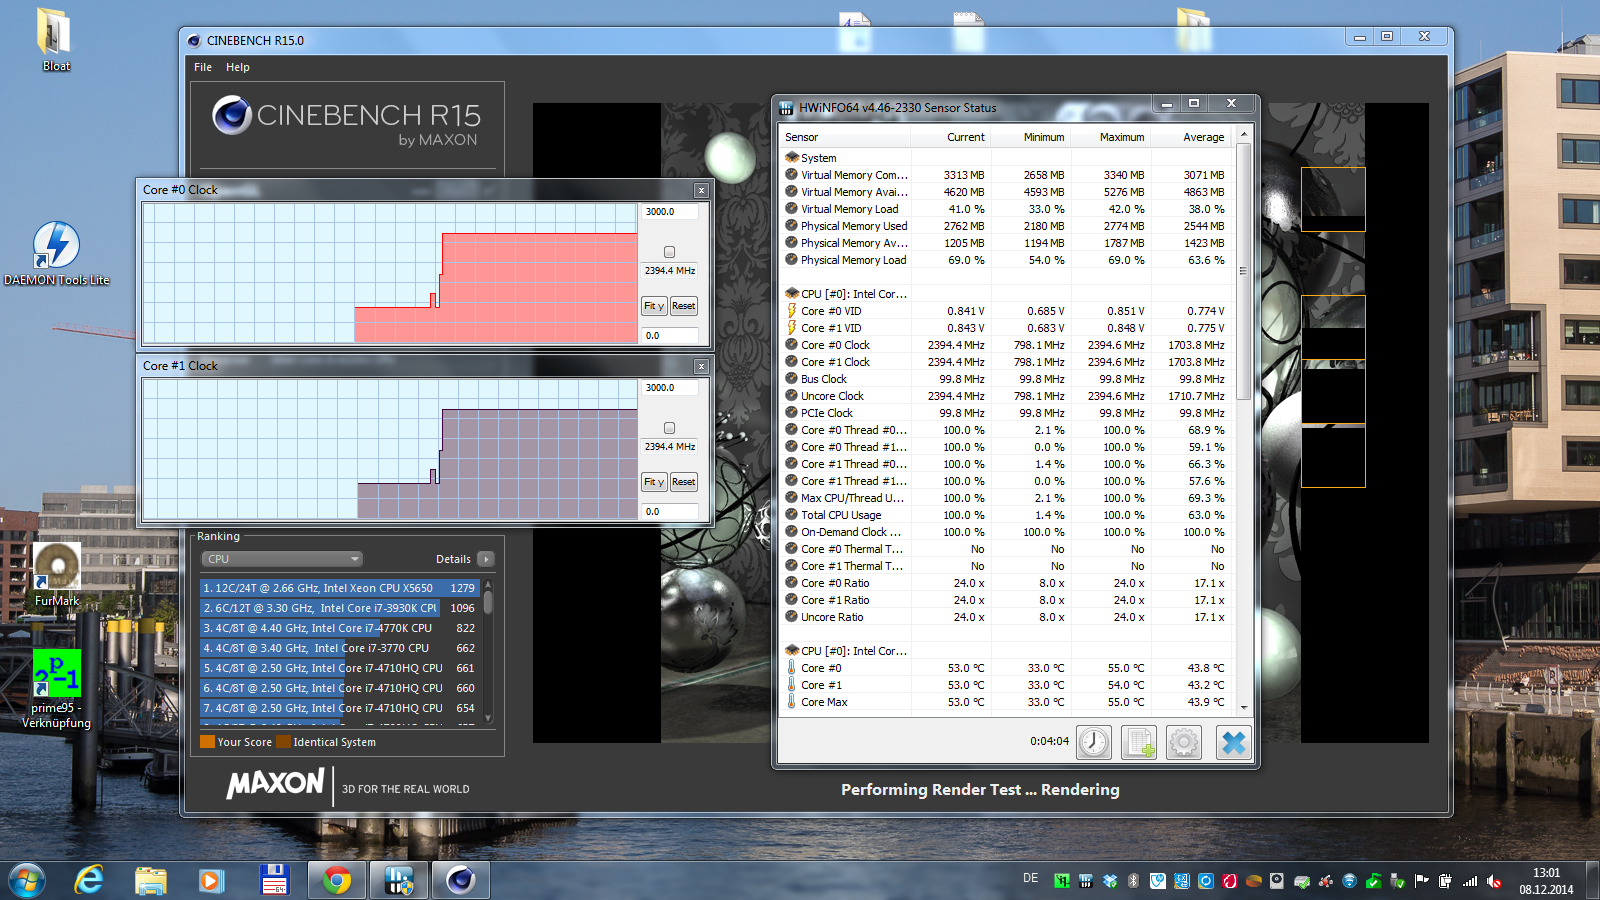
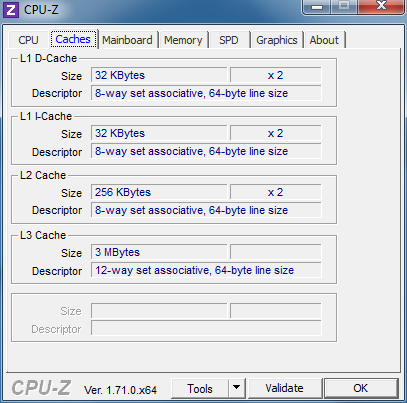
Just like the ubiquitous and slightly slower Core i5-4200U (2x 1.6 - 2.6 GHz, Hyperthreading, TDP 15 W), the i5-4210U (2x 1.7 - 2.7 GHz) is an allrounder Haswell ULV processor which, thanks to its low TDP, often sees duty in slim notebooks and Ultrabooks with display sizes starting at 11 inches. The CPU is manufactured using a 22nm process and supports, in addition to Hyperthreading (virtual doubling of the cores), new instruction sets like AVX2 and FMA. These instructions sets accelerate specialized software on top of the nominal 10 % per-MHz increase in performance the newer-generation CPU offers compared to the predecessor. The G1 comes with the faster, but a little more power-hungry Core i5-4200M (2x 2,5 - 3,1 GHz, TDP 37 W, which gives that notebook an advantage of 14 to 23 % when running Cinebench R11.5. The processor performance meets our expectations and is comparable to other notebooks with the same CPU. Both cores maintained 2.4 GHz during the multi-core portion of the Cinebench tests, which means that the Turbo is never compromised.
System Performance
To evaluate overall system performance, we use the time-proven PCMark 7 benchmark test, which not only takes the CPU performance into consideration, but also tests the RAM, HDD and the GPU. Based on the faster hardware, we would have expected the older ProBook 470 G1 to edge out more or a performance difference: 4 % are really not practically relevant. Other notebooks based on Intel/Nvida hardware (listed in the table below) offer comparable performance to the G1 and the G2; AMD-based systems don't do as well. Although the notebook generally performs without any stutters, we initially had issues with occasional and unexplained system lag. Since these issues disappeared towards the end of the review, we decided not to deduct a point as initially planned. The performance of the G2 would be even better if it was equipped with an SSD.
| PCMark 7 Score | 2586 points | |
| PCMark 8 Work Score Accelerated v2 | 4052 points | |
Help | ||
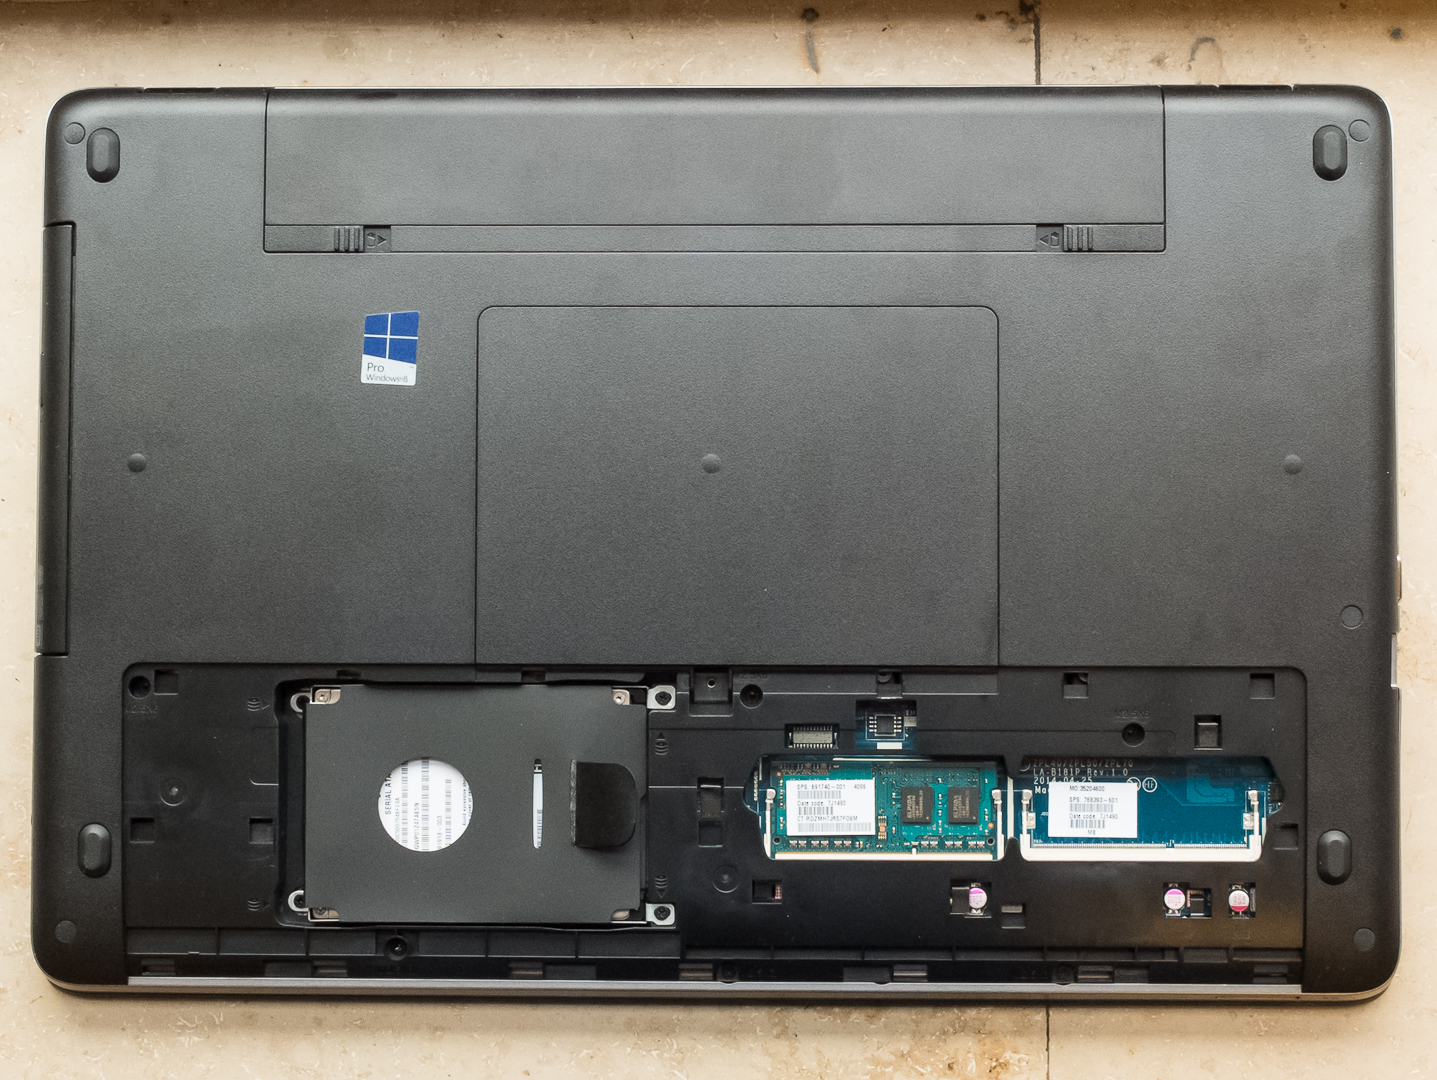
Storage Devices
The disk benchmark tool HD Tune attests the HP ProBook 470 G2 a very good sequential read rate of 88 MB/s, which corresponds with the performance of the Seagate Momentus Thin ST500LT012-1DG142 (500 GB, 5400 rpm) in other notebooks. The access time - important when reading small, distributed blocks of data and therefore crucial when it comes to program starts and system boots - unfortunately isn't great at 20 ms. The same model hard drive in the Acer TravelMate P256-M-39NG posted a score of 18.3 ms. The corresponding 4K test sequence in CrystalDiskMark 3.0 confirms the rather weak performance. An access time of around 16 ms is considered good. CrystalDiskMark shows that the G2's hard drive trails the HDD in the G1 in every discipline; the 4K speed difference is also very apparent.
| HP ProBook 470 G2 (G6W68EA) Radeon R5 M255, 4210U, Seagate Momentus Thin ST500LT012-1DG142 | HP ProBook 470 G1 E9Y75EA Radeon HD 8750M, 4200M, Hitachi Travelstar Z5K500 HTS545050A7E380 | Acer TravelMate P256-M-39NG HD Graphics 4400, 4005U, Seagate Momentus Thin ST500LT012-1DG142 | |
|---|---|---|---|
| CrystalDiskMark 3.0 | 25% | 3% | |
| Read Seq (MB/s) | 87.9 | 98.3 12% | 95.1 8% |
| Read 4k (MB/s) | 0.327 | 0.476 46% | 0.317 -3% |
| Read 4k QD32 (MB/s) | 0.753 | 0.884 17% | 0.788 5% |

GPU Performance
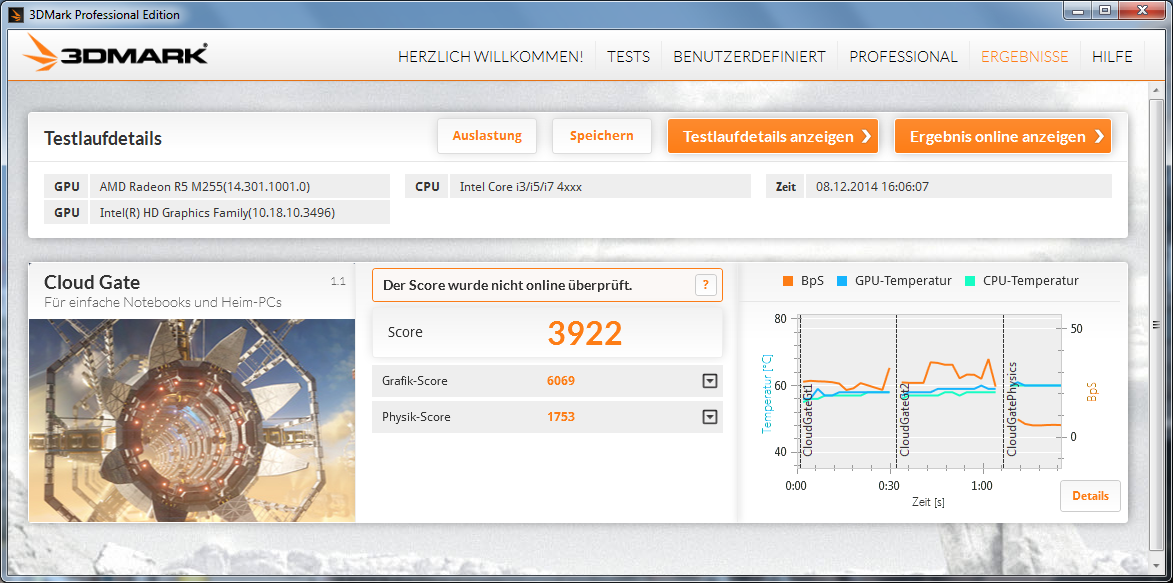
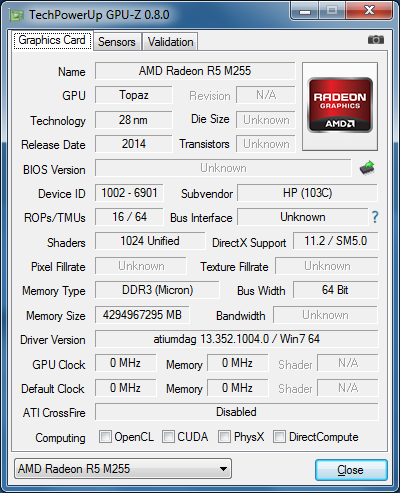
The AMD Radeon R5 M255 is a new DirectX11.2-compatible entry-level graphics card with 1 GB of dedicated RAM (accessed via a narrow 64-bit bus) and a maximum speed of up to 940 MHz. The performance is roughly between an integrated Intel HD 4600 and a dedicated Nvida GeForce 820M. Comparisons are a bit tricky, because the results of the 3DMark (2013) and 3DMark 11 benchmarks contradict each other. According to the latter test, there's no difference between the new GPU and the also already GNC-based Radeon HD 8750M (released towards the end of 2012) in the ProBook 470 G1. 3DMark (2013) shows a very different result, which is confirmed by the gaming benchmarks: the HD 8750M offers about 30 % more performance than the more frugal R5 M255. With the notebook running on battery, performance drops from 4621 points to 3922 points. We should add here that the graphics performance was not really affect, but the CPU-dependent physics score was. Our FAQ has a list of benchmarks for various graphics cards and their performance.
| 3DMark Vantage P Result | 5399 points | |
| 3DMark 11 Performance | 1896 points | |
| 3DMark Ice Storm Standard Score | 40334 points | |
| 3DMark Cloud Gate Standard Score | 4621 points | |
| 3DMark Fire Strike Score | 973 points | |
Help | ||
Gaming Performance
The benchmark results for Tomb Raider and Anno 2070 clearly show the predecessor G1 offering between 16 to 30 % better performance. We show a short comparison of gaming benchmarks at the end of our review in the "Verdict" section. The table attached below also speaks for itself: less demanding titles, like Diablo III and FIFA 15, don't pose any problems even at high settings, the new GRID: Autosport, Tomb Raider and Bioshock Infinite do OK on medium settings and a resolution of 1366 x 768, but power-hungry games like Hitman: Absolution and Thief are simply out of the question. A few fps can make all the difference as far as gaming is concerned, and here the G2 takes a step backwards compared to the predecessor G1.
| low | med. | high | ultra | |
|---|---|---|---|---|
| StarCraft 2 (2010) | 187 | 43 | 25.9 | |
| Anno 2070 (2011) | 100.3 | 45.7 | 27.6 | 12.8 |
| Diablo III (2012) | 64.3 | 51.6 | ||
| Hitman: Absolution (2012) | 21.85 | |||
| Tomb Raider (2013) | 72.2 | 36.2 | 22.7 | |
| BioShock Infinite (2013) | 58 | 34.25 | 27.21 | |
| Company of Heroes 2 (2013) | 29.67 | 24.61 | ||
| Dota 2 (2013) | 74.9 | 53.3 | 22.4 | |
| Thief (2014) | 21.1 | |||
| Wolfenstein: The New Order (2014) | 31.3 | 28.4 | ||
| GRID: Autosport (2014) | 106.1 | 47.5 | 22.04 | |
| Risen 3: Titan Lords (2014) | 38.1 | 22 | ||
| Fifa 15 (2014) | 75 | 56.2 | 27.5 |
Emissions
System Noise
We find no reason to complain about the noise level of our review notebook. The fan is always running, but barely audible over the ambient noise. Increasing the load to maximum results in the fan spooling up gradually. The wooshing sound is free of artifacts and doesn't get annoying. We do find it strange that the G2 is louder than the G1 regardless of the load level despite the more frugal hardware.
Noise Level
| Idle |
| 33.8 / 33.8 / 36 dB(A) |
| HDD |
| 33.8 dB(A) |
| DVD |
| 37.6 / dB(A) |
| Load |
| 37.4 / 43.7 dB(A) |
 | ||
30 dB silent 40 dB(A) audible 50 dB(A) loud |
||
min: | ||
Temperature
The notebooks is very well-behaved during idle as far as the encountered temperatures are concerned. During the admittedly not overly realistic stress test we measured a maximum of 42 °C (G1: 48 °C) on the bottom, which some might consider to be on the high side. On the other hand, it's doubtful that a 17.3-inch notebook will see duty on the lap while playing first-person-shooter games. The palm rests remain below body temperature at all times.
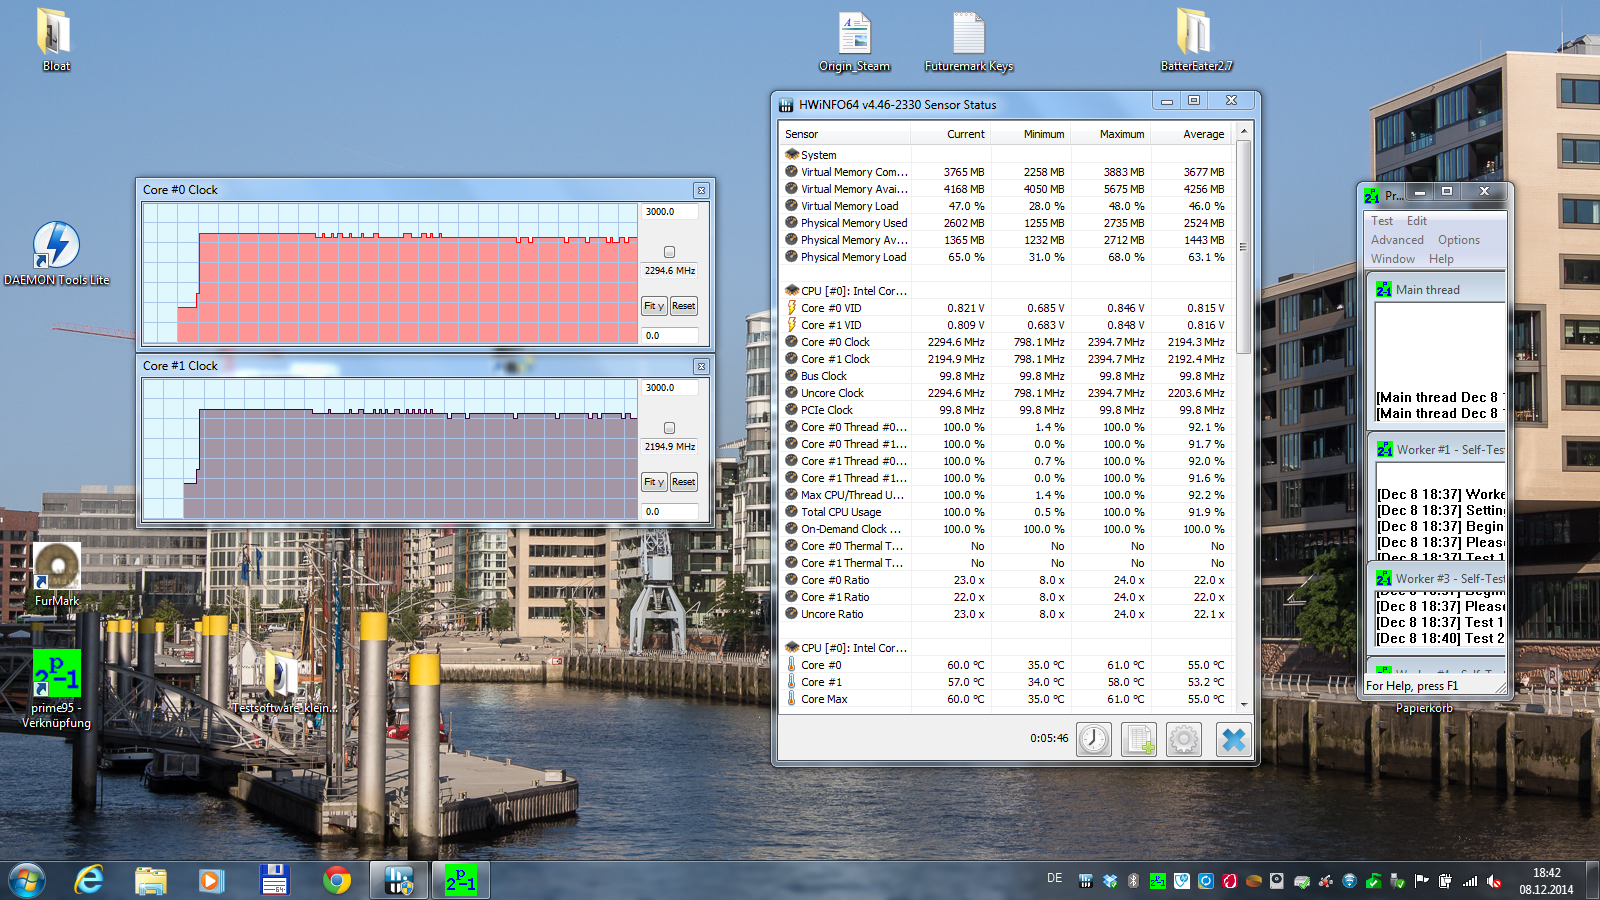
During our stress test with Prime95, the CPU cores settled to between 2.3 and 2.4 GHz after a while; when we added the GPU benchmark FurMark, we saw occasional drops to 2.2 GHz. Overall, the G2 utilizes the Turbo very well.
(±) The maximum temperature on the upper side is 40.5 °C / 105 F, compared to the average of 36.9 °C / 98 F, ranging from 21.1 to 71 °C for the class Multimedia.
(±) The bottom heats up to a maximum of 42.1 °C / 108 F, compared to the average of 39.2 °C / 103 F
(+) In idle usage, the average temperature for the upper side is 25.2 °C / 77 F, compared to the device average of 31.3 °C / 88 F.
(+) The palmrests and touchpad are reaching skin temperature as a maximum (35.4 °C / 95.7 F) and are therefore not hot.
(-) The average temperature of the palmrest area of similar devices was 28.7 °C / 83.7 F (-6.7 °C / -12 F).
Energy Management
Power Consumption
Idle consumption (average) of the HP ProBook 470 G2 is one of the lowest we've seen for 17.3-inch systems. The G1 consumed about 2 watts more, but required up to 3.5 watts less under load (average) despite the more powerful hardware components. Under maximum load, the G2 was once again in the lead with about 10 watts less. Good: when the notebook is turned off, the power consumption is too low to measure. The power adapter is powerful enough to handle system needs.
| Off / Standby | |
| Idle | |
| Load |
|
Key:
min: | |
Battery Life
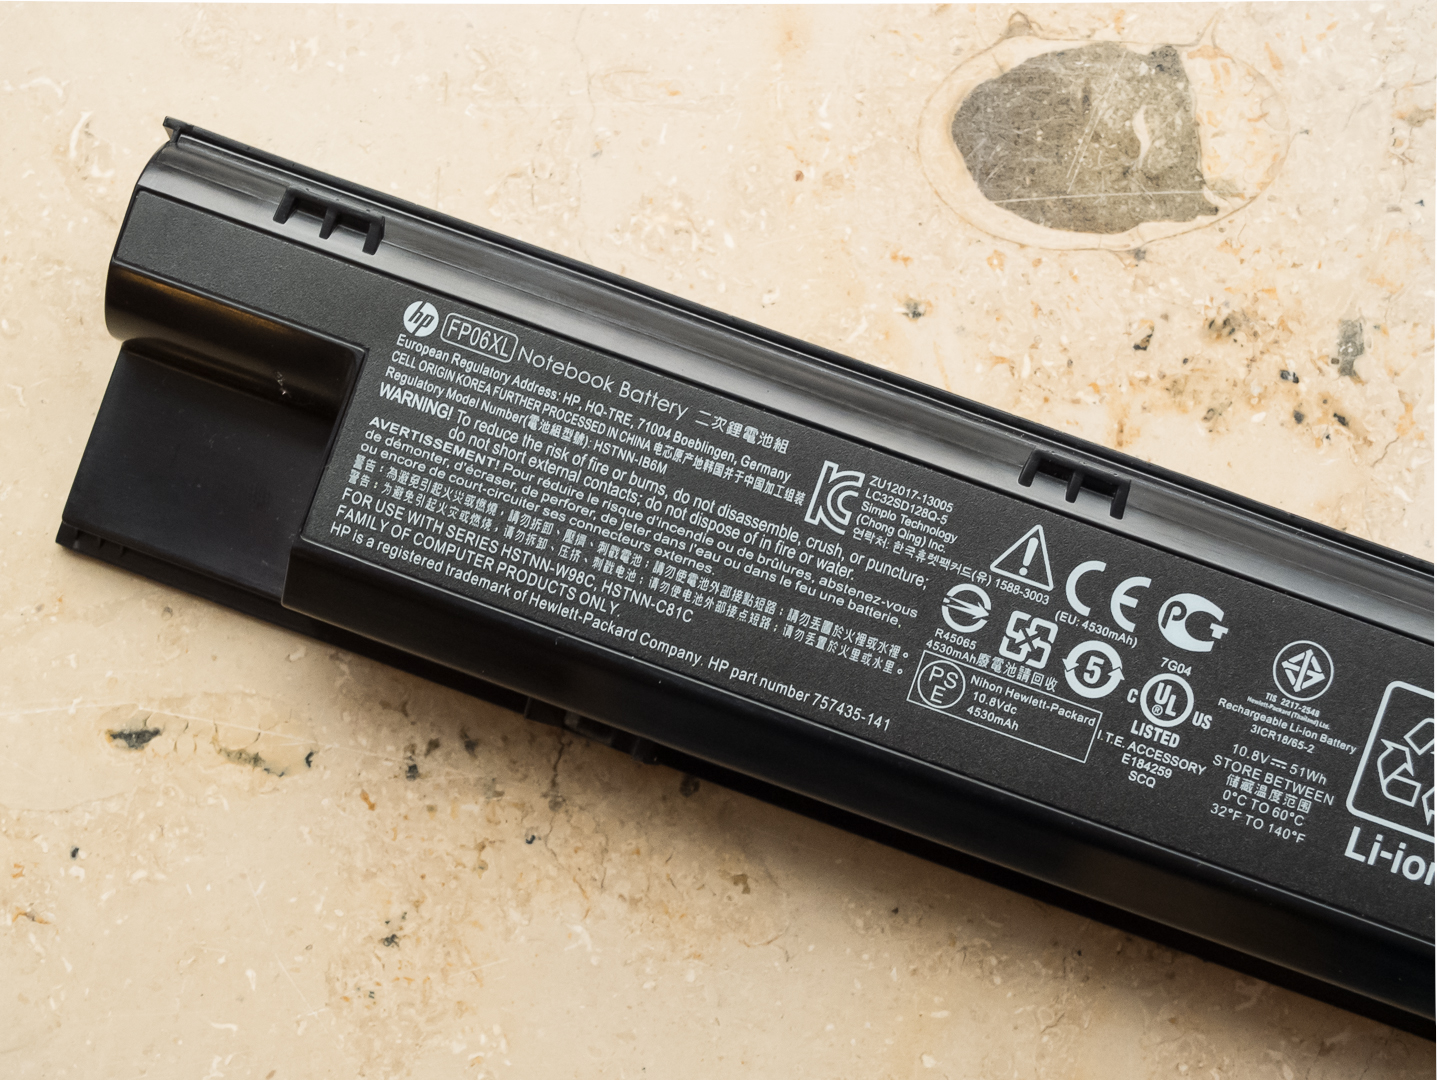
The review notebook proved its endurance when playing back DVDs with the display turned up to maximum brightness. In fact: the G2 and the predecessor lasted longer than any other 17.3-inch notebook we've reviewed in the last 12 months. Both notebooks also offer very comparable performance and rank in the upper third for the practically relevant WLAN test. 500 minutes is an excellent result for an otherwise not overly mobile notebook. Since the G1 has more powerful hardware and a smaller battery (47 vs. 51 Wh), we would've expected the G2 to do better, however. For details on our test procedures please take a look here.
Verdict

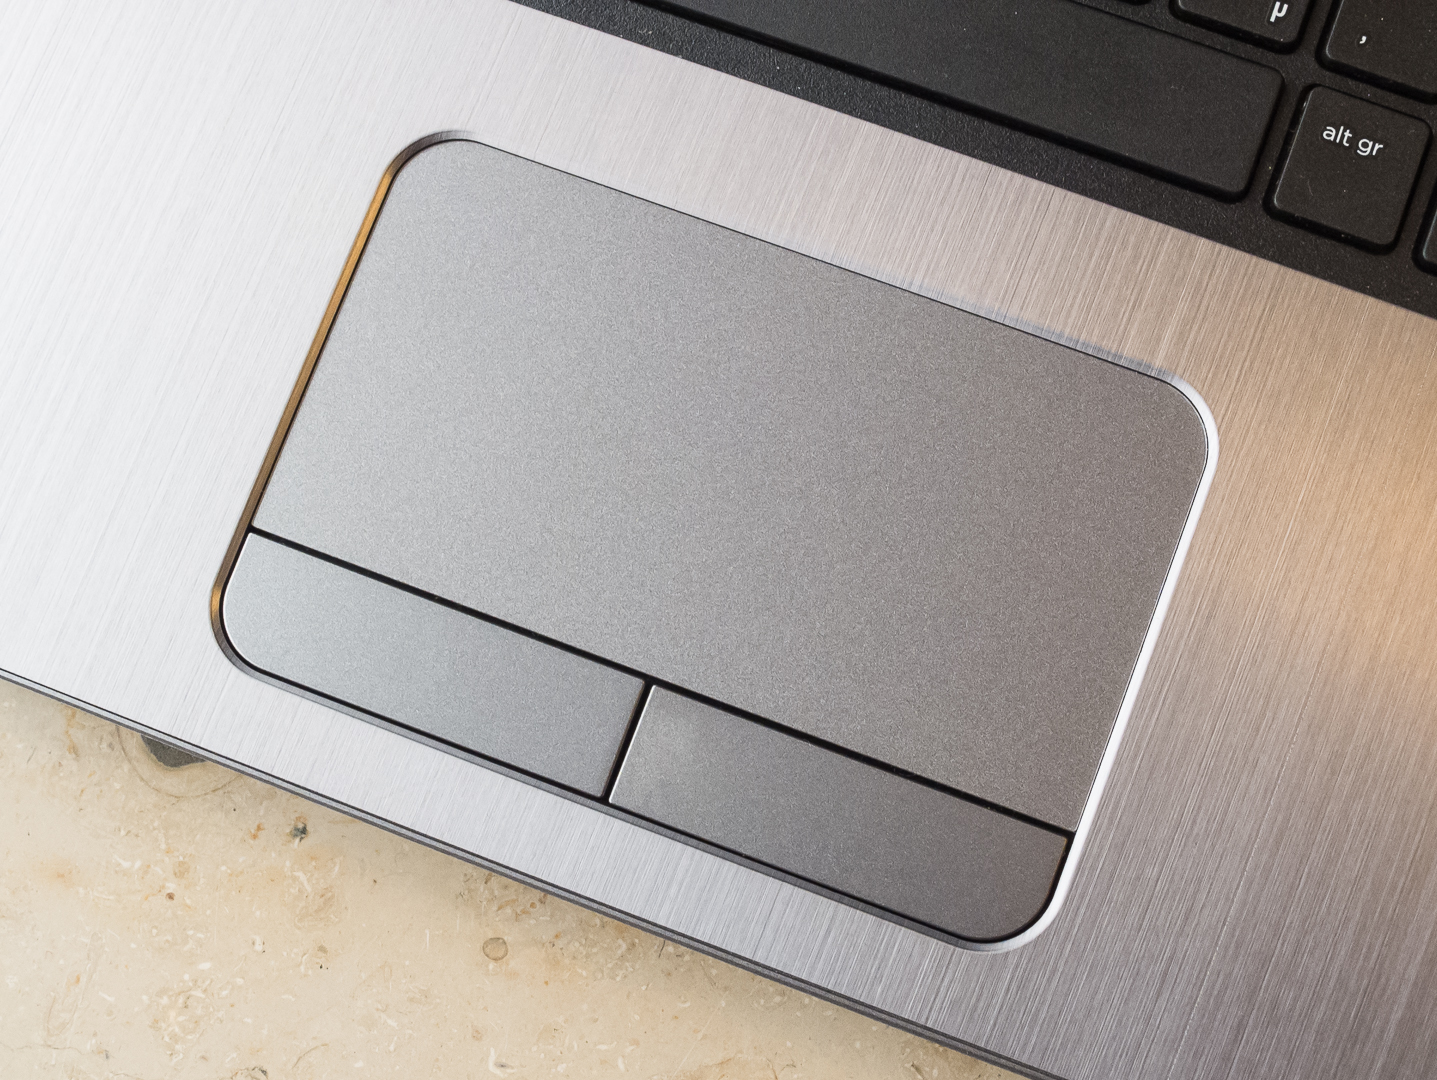
After the conclusion of our tests, we can't really find a compelling reason to pick the HP ProBook 470 G2 (G6W68EA) over the previous-generation G1 (E9Y75EA). In addition to the the price (which probably won't drop any further), the G1 has the slightly better display, offers more CPU and GPU performance and is a little more quiet as well. The new model also doesn't surpass the predecessor as far as temperatures, power consumption, and battery life are concerned. All things considered, the ProBook 470 G2 is a cool, quiet and well-designed business-multimedia hybrid, which offers good application and 3D performance for a price that is more than fair. The design and the input devices already impressed us when we evaluated the earlier models in the series, so there are no changes here. At this time, however, we can only recommend the new G2 once the predecessor is not available for purchase any longer.
| Anno 2070 | |
| 1024x768 Low Preset (sort by value) | |
| HP ProBook 470 G2 (G6W68EA) | |
| HP ProBook 470 G1 E9Y75EA | |
| Acer Aspire E5-551-T8X3 | |
| 1366x768 Medium Preset AA:on (sort by value) | |
| HP ProBook 470 G2 (G6W68EA) | |
| HP ProBook 470 G1 E9Y75EA | |
| Acer Aspire E5-551-T8X3 | |
| 1366x768 High Preset AA:on AF:2x (sort by value) | |
| HP ProBook 470 G2 (G6W68EA) | |
| HP ProBook 470 G1 E9Y75EA | |
| Acer Aspire E5-551-T8X3 | |