

Dell Latitude 5490 (i5-8350U, FHD) Laptop Review
The Latitude series is Dells business class. Special attention is paid to security features, making this laptop suited for companies and their employees. But even the average user may find an advantage in a device like this. In this review, we will cover whether this notebook is worth its price and whether security-conscious users are going to be satisfied with the features on offer.
After the Latitude E5470 from two generations ago, Dell removed the "E" from their naming scheme and the successor was simply called the Latitude 5480. The Latitude 5490 has a rather long options list. Dell does list nine different configurations on its website, although we have to note that we believe some of the information present there to be incorrect, as even the most affordable model is displayed with the entirety of (officially optional) upgrades.
Differences in hardware start with the display, which is available in three variants, various processors and memory options and also include a plethora of storage, security, and graphics card options. It is possible, to add a dedicated GPU to your configuration. The specific options are covered in detail in their respective sections of this review. At the time of testing, Dell has decreased the price of the Latitude. The most affordable version, based on an i5-8250U, a HD display, 8GB of memory and a 500 GB HDD is currently available for only 839 Euros ((~$1040) excl. VAT). Unfortunately, the touchscreen variant is limited to English speaking markets.
It should be no surprise, that to compare the Dell, we have brought in some strong competition. Our selection contains the HP EliteBook 840 G4, the Acer TravelMate P648-G2, the Lenovo ThinkPad T470 and the Fujitsu LifeBook U747. Last but not least, we also take a look at its predecessor, the Dell Latitude 5480. The latter achieved an exceptional 86% in last year’s test, owing this score to a great battery life. We had gripes with the displays low brightness, however.
We will cover, whether Dell actually took our criticism seriously, or whether this is just a simple Kaby-Lake refresh.
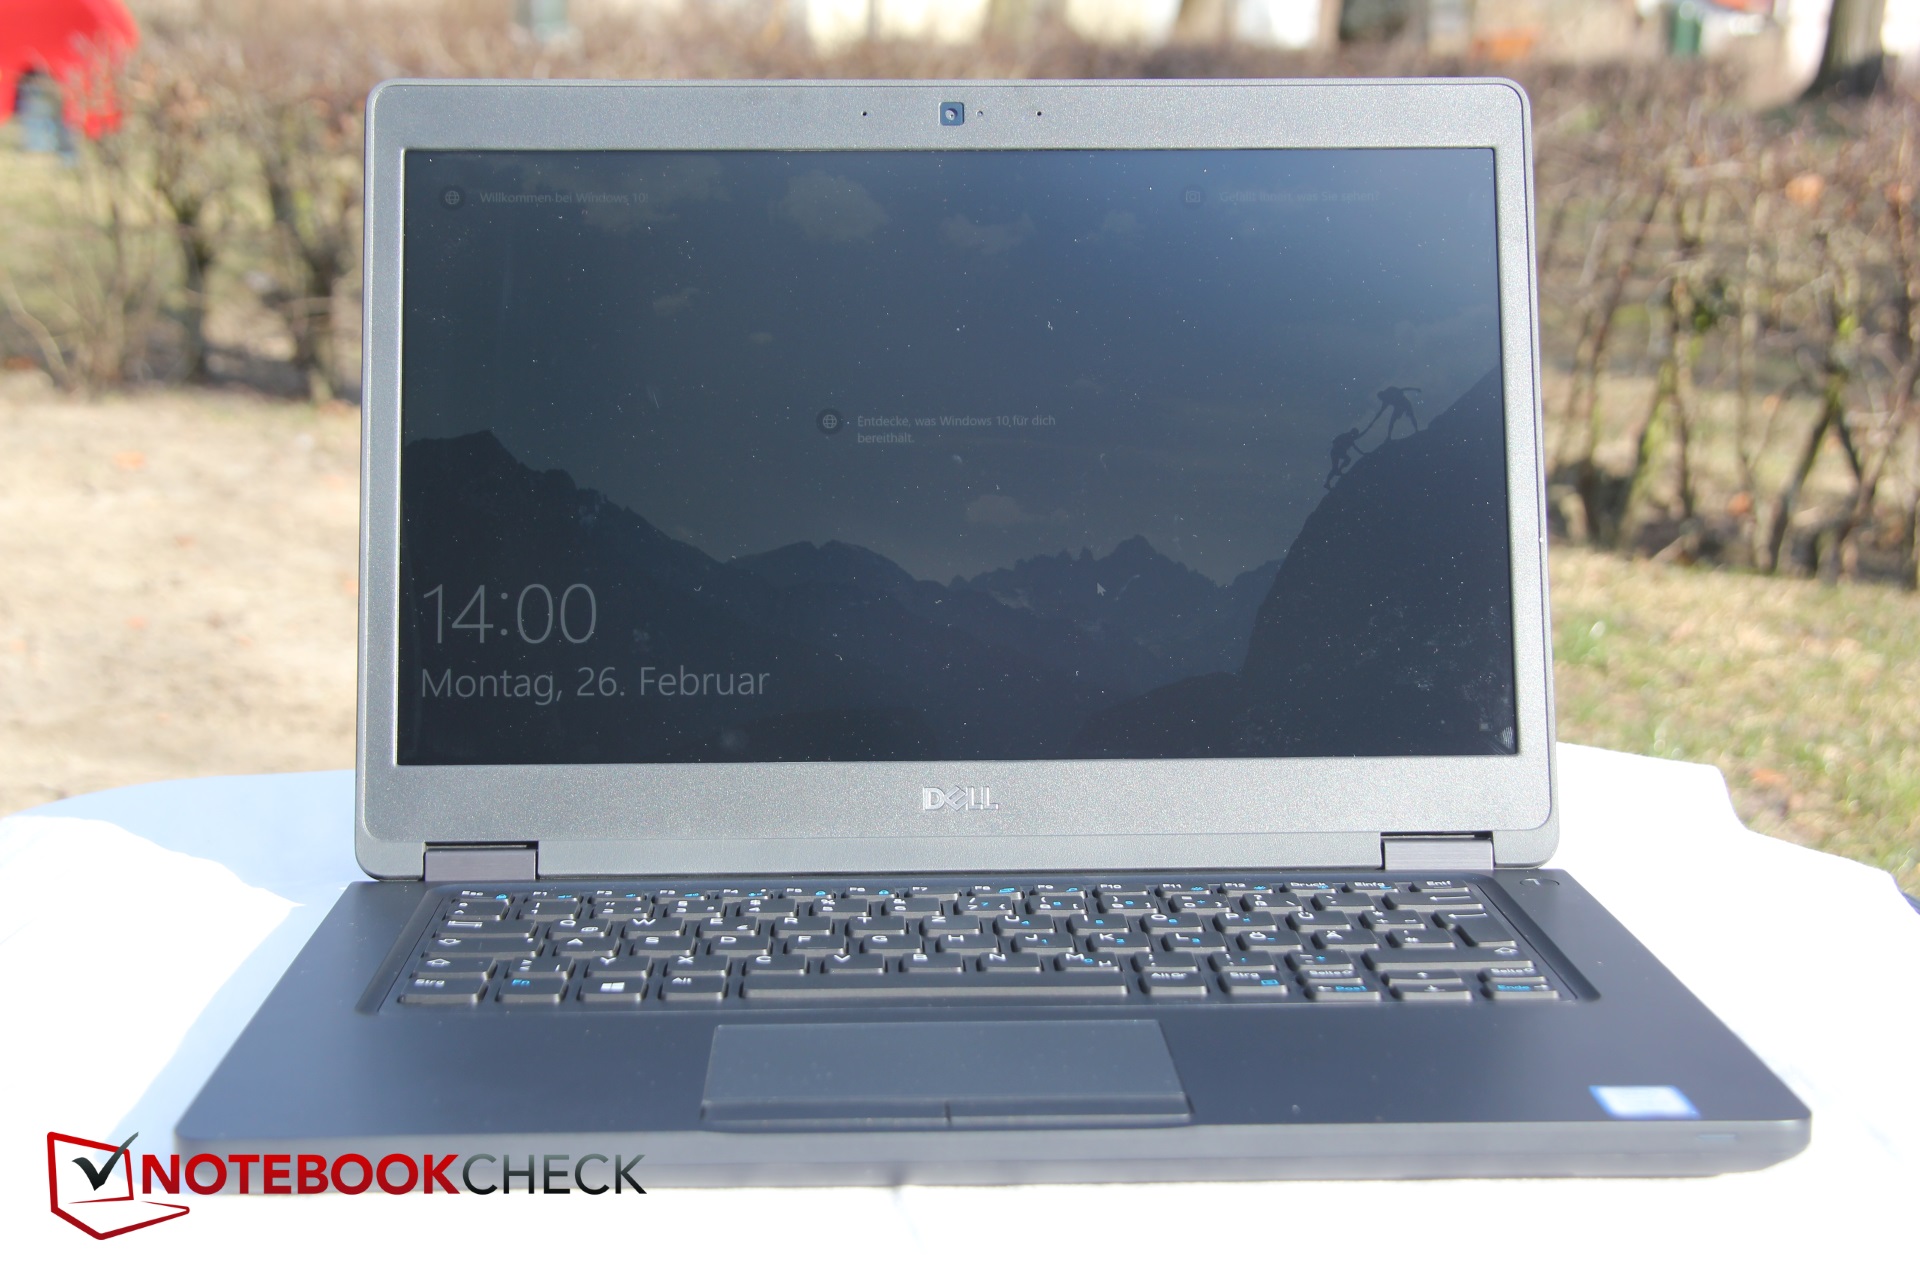
Chassis - Stable but heavy on stains
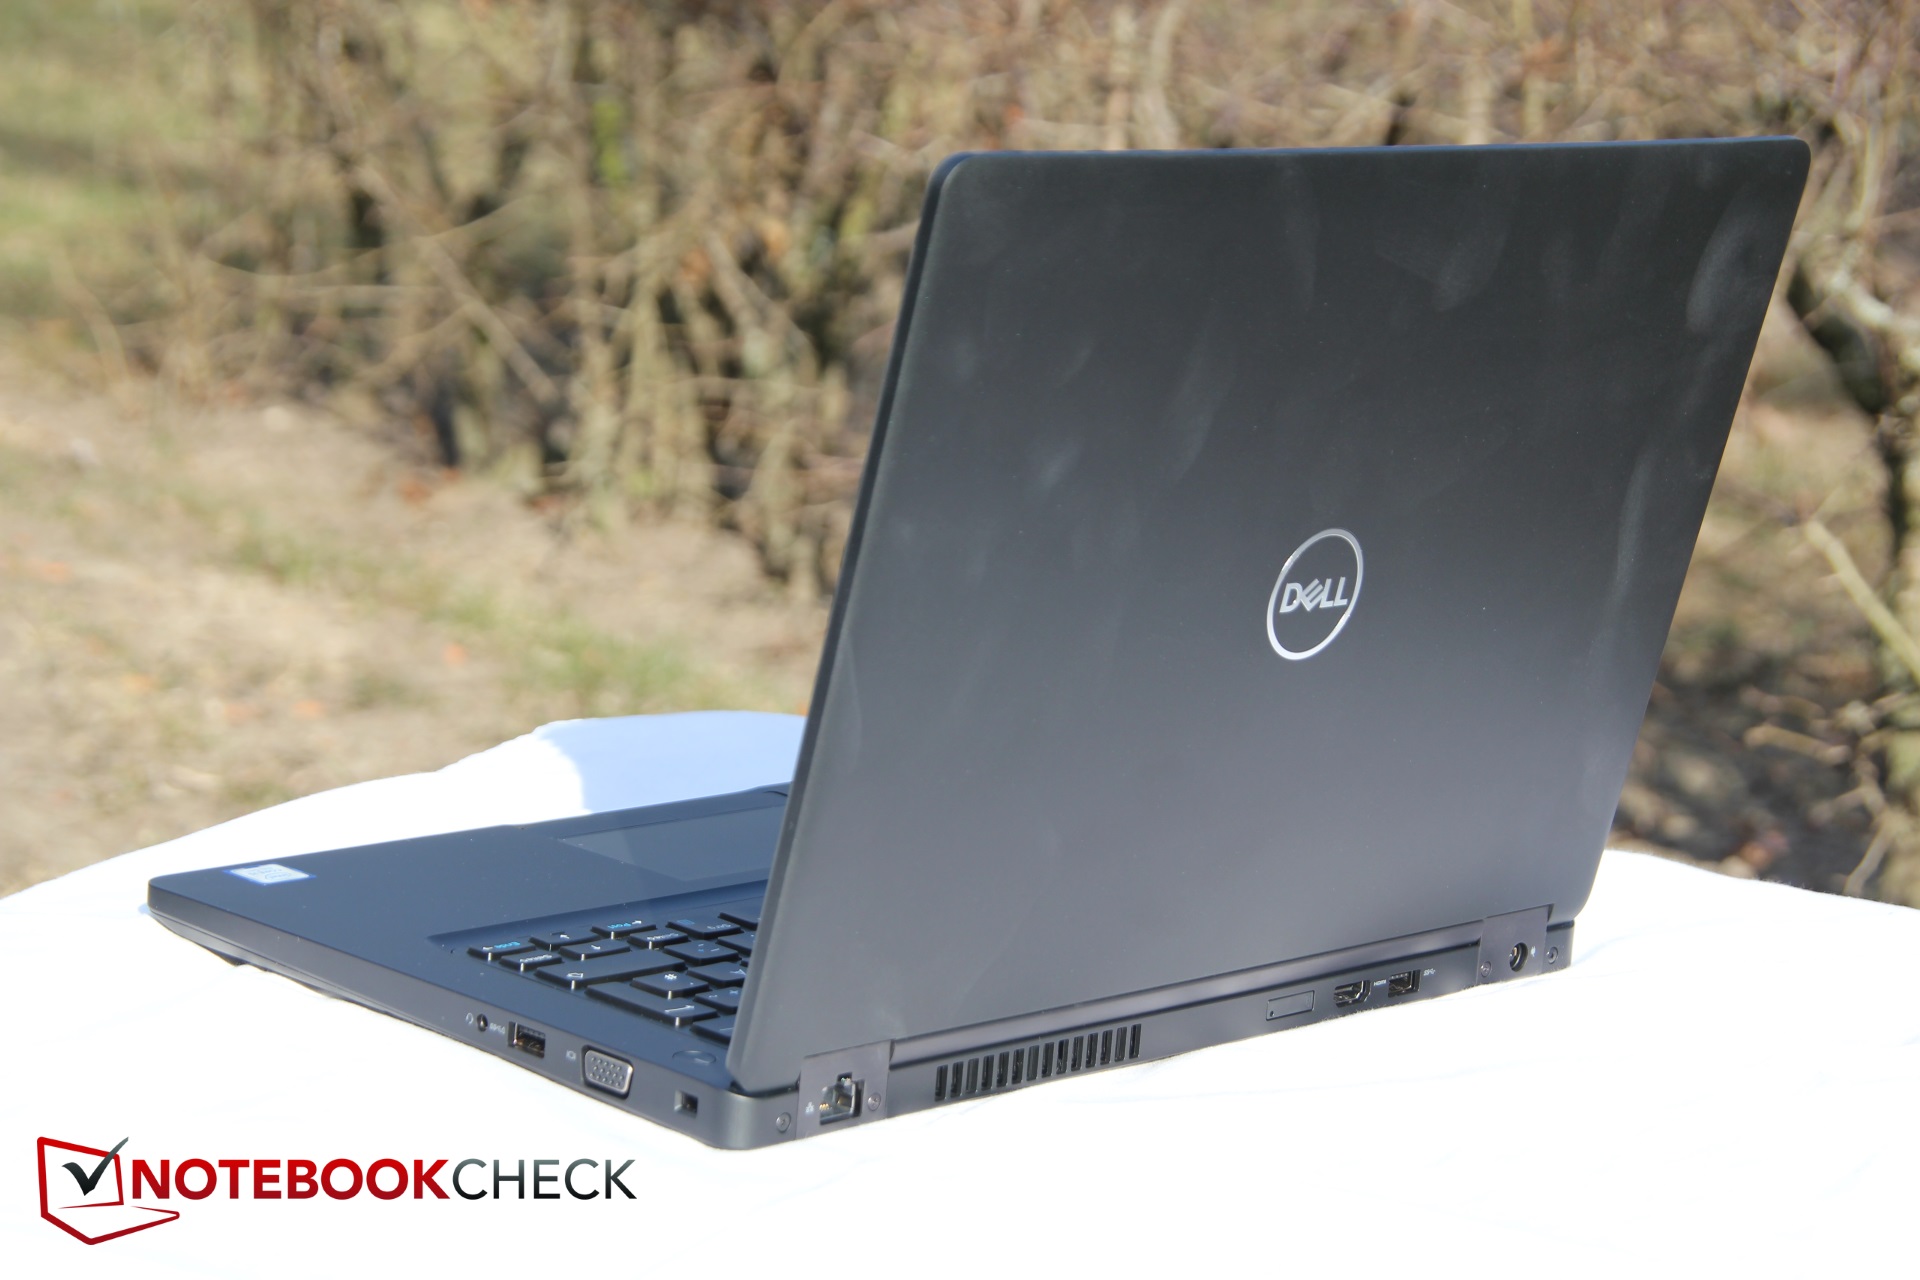
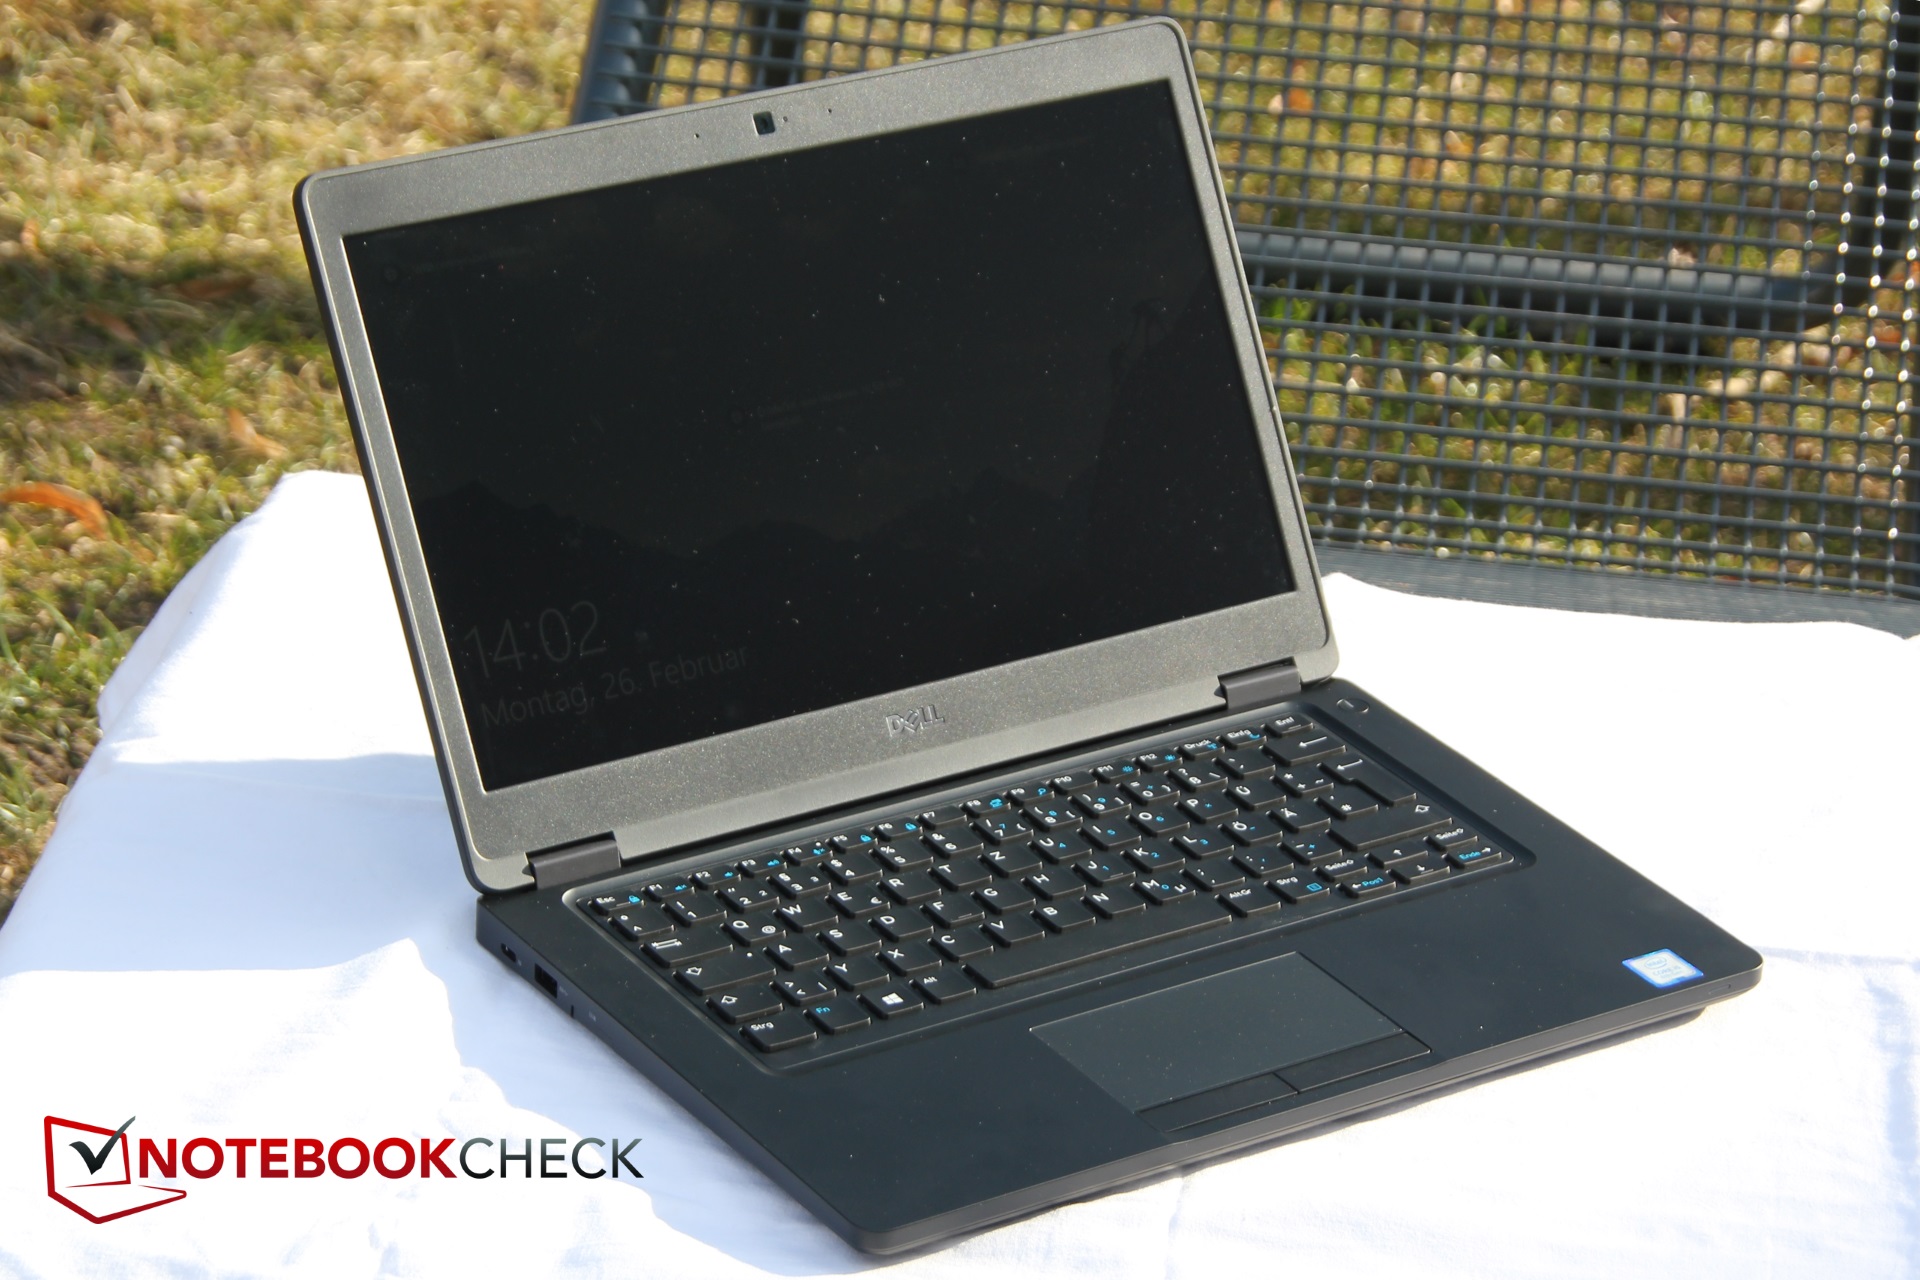
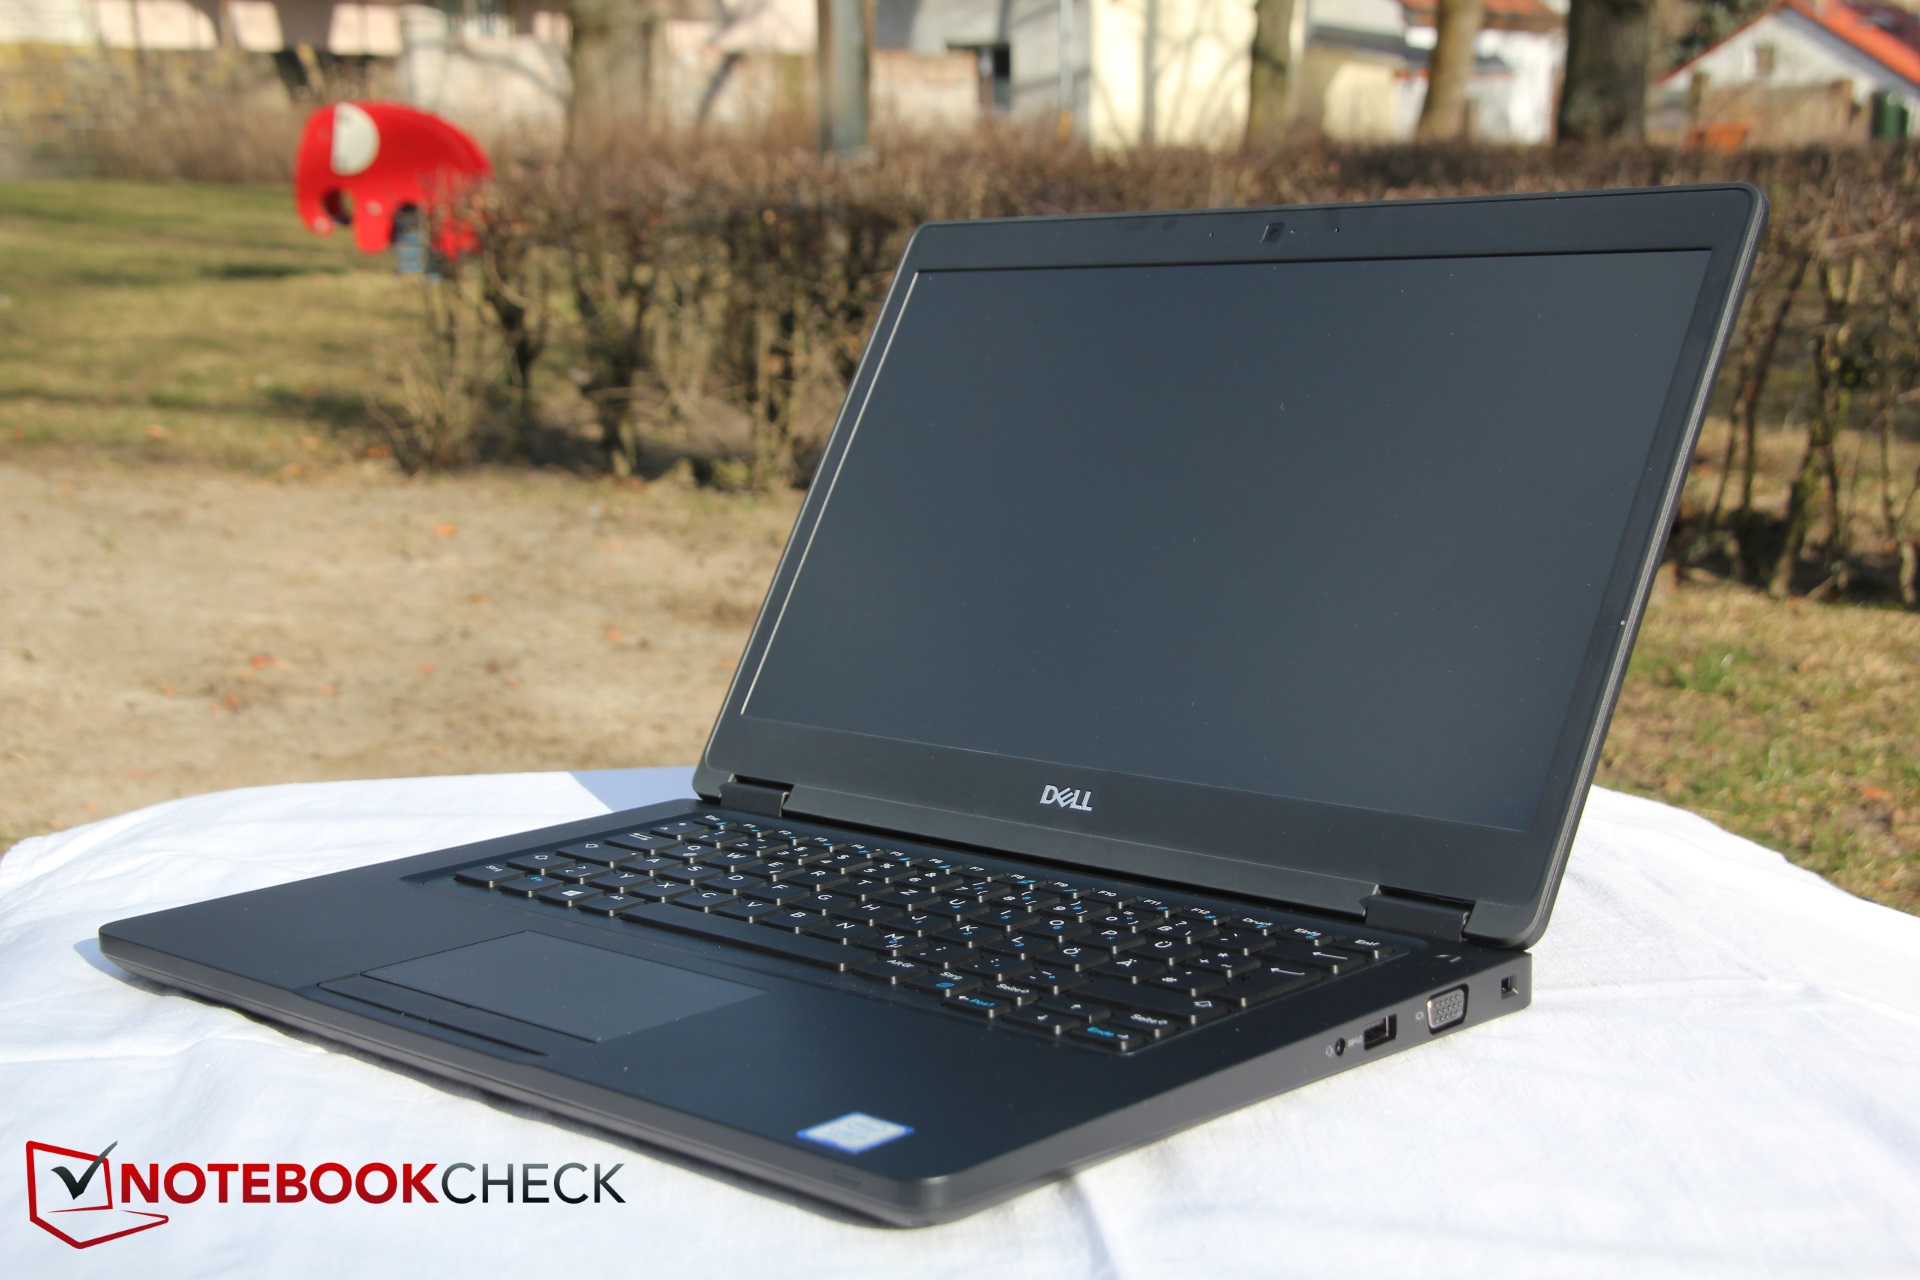
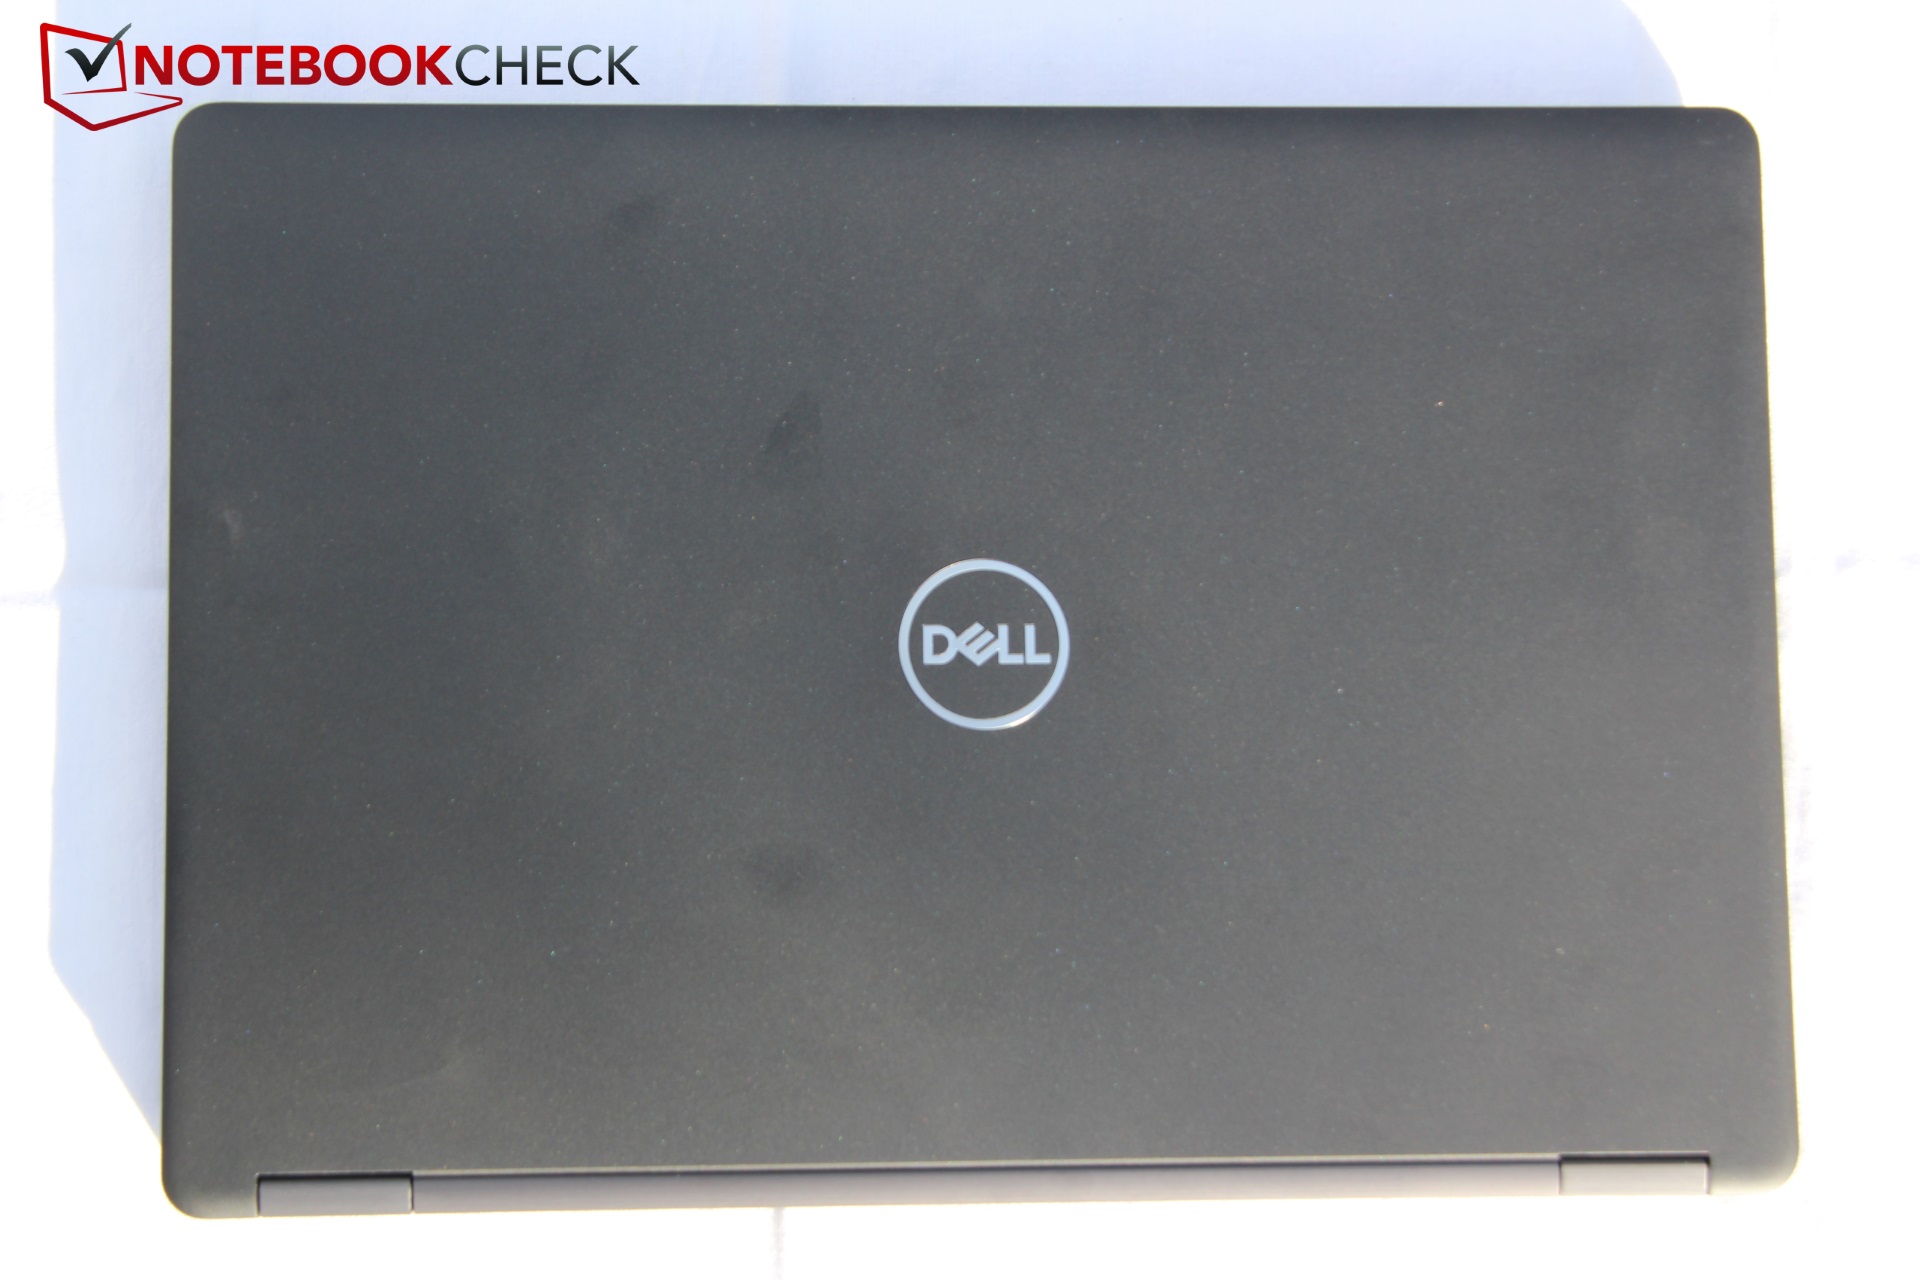
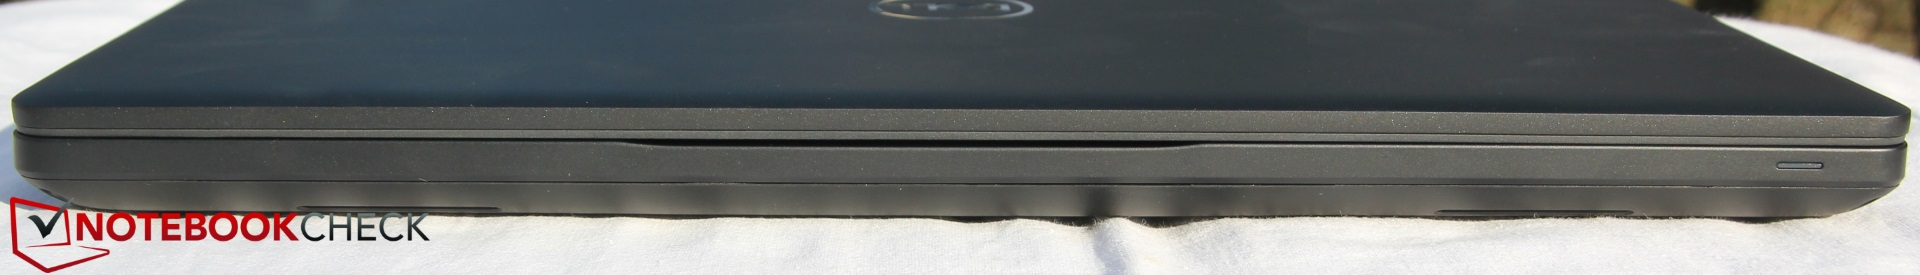
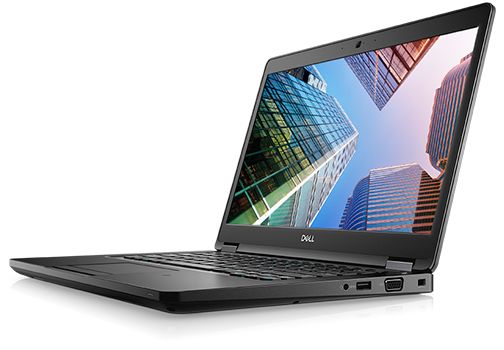
The chassis has not improved radically compared to its predecessor. This was not really required anyway, since the simple, matte-black chassis still looks good. One disadvantage of the matte surface is that smudges and fingerprints are accumulated in a brief amount of time. The only real optical accent is the Dell logo at the top. While the material is plastic, both the base and lid are very stable. The bottom of the keyboard appears to have been slightly improved. One can still press it in, but much more force is required than in the previous version, improving the tactical feel of the keyboard.
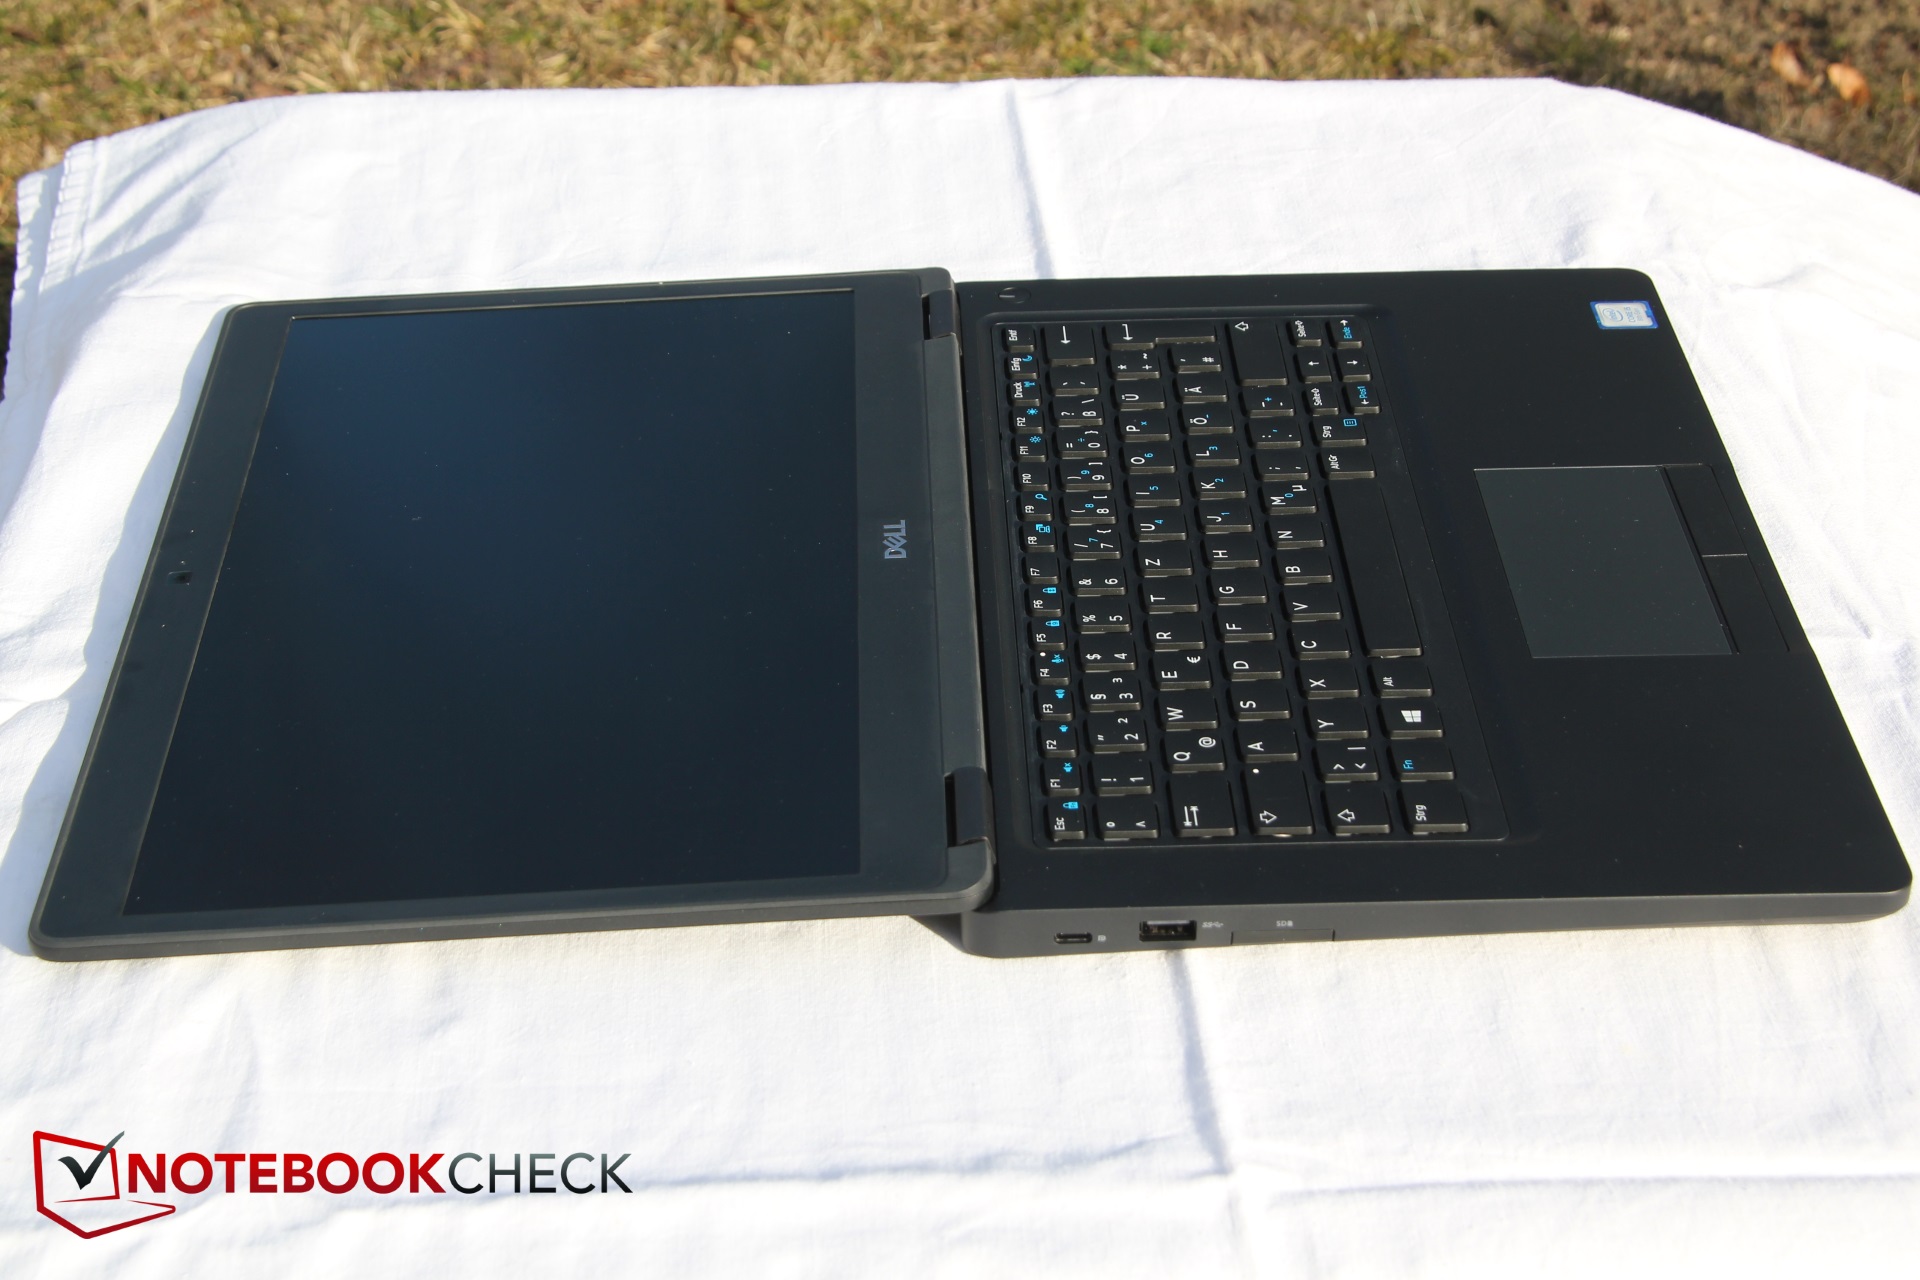
Only the edge of the display is graced with softer plastic. Surrounding it is small lip made of hardened rubber that keeps the dirt out of the device when the lid is closed. The hinges enable the display to open up to 180 degrees. While the battery is screwed in, the manual does contain a replacement guide.
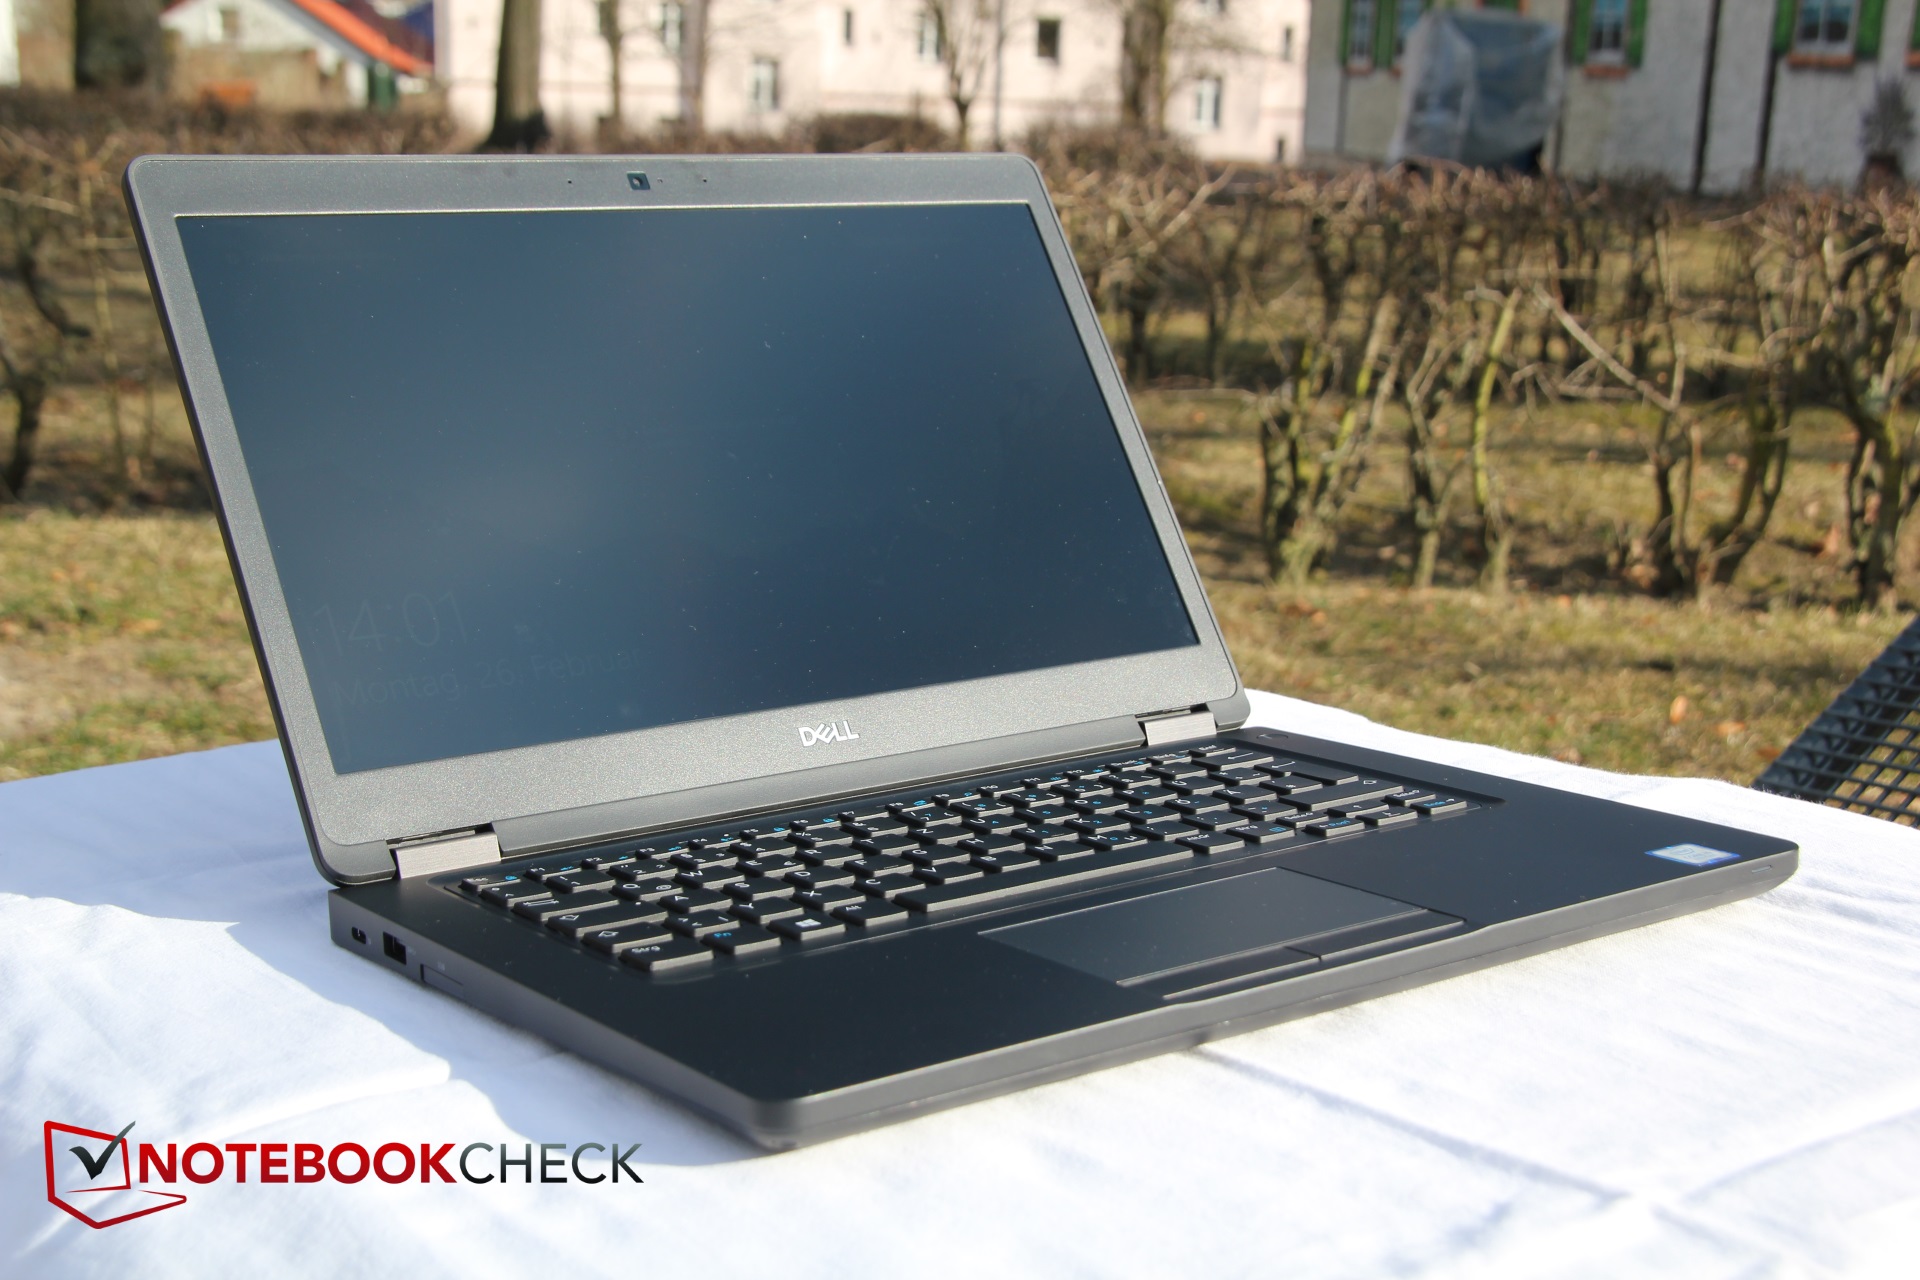
The 5490 with its 1.7 kg (~3.75 lb) is rather heavy for a business notebook. While offerings from Lenovo and Acer are similar in weight and the predecessor was even heavier, alternatives sold by HP and Fujitsu tend to be 200-300 grams (~0.45-0.66 lb) lighter. It should be noted that different configurations may also lead to fluctuations in weight.
The 5490 is similarly positioned in terms of thickness, being similar in depth to the Acer. Every other opponent is 1-2 mm slimmer (0.04 – 0.08 in). However, the overall footprint is smaller than competitors. Compared to its predecessor, its size has decreased minimally, though usually only by less than 1 mm (~0.04 in). The only exception is the thickness which has gone down by 1.5 mm (~0.06 in).
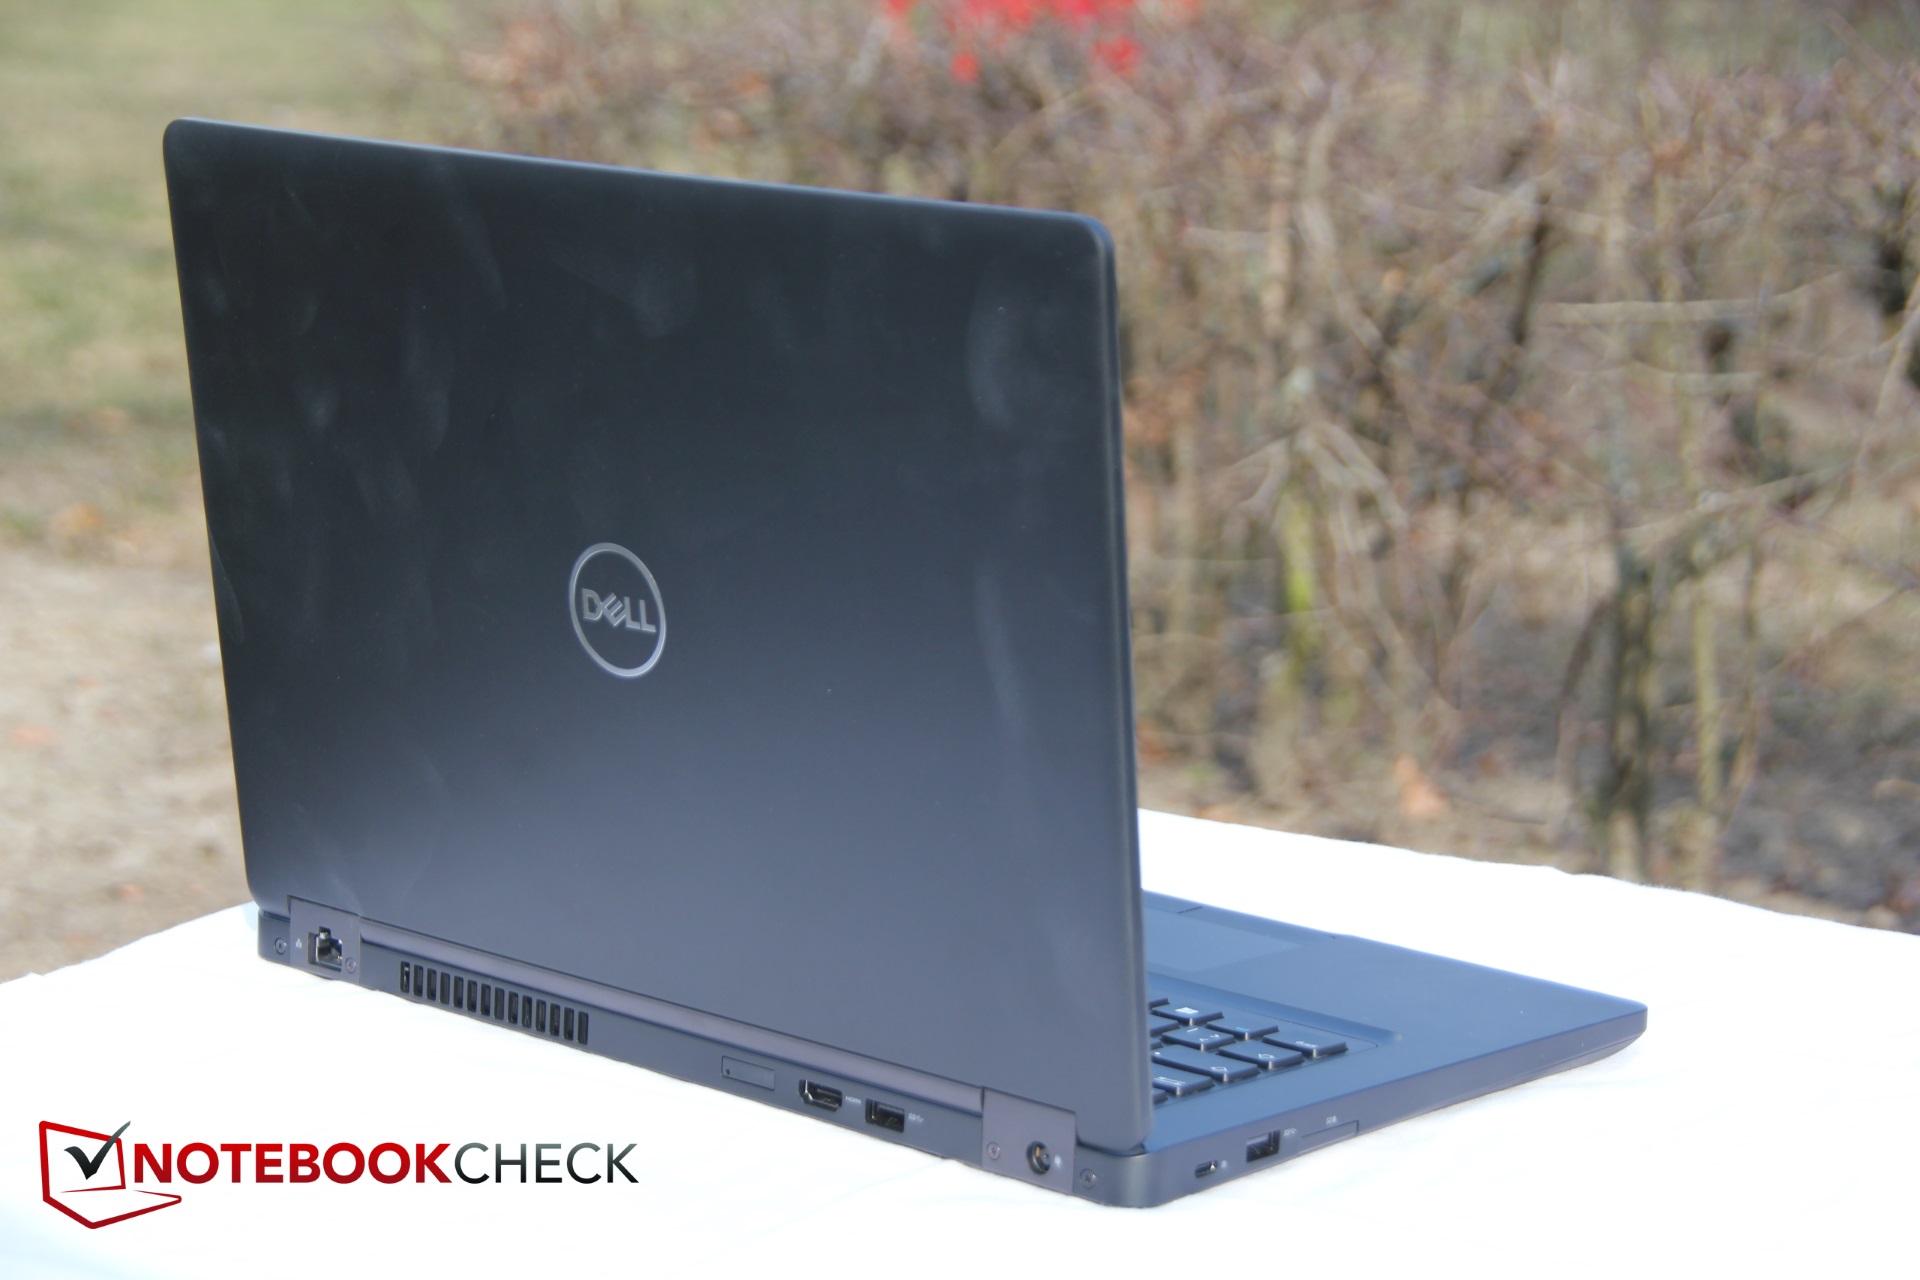
Connectivity- Standard VGA, optional Thunderbolt
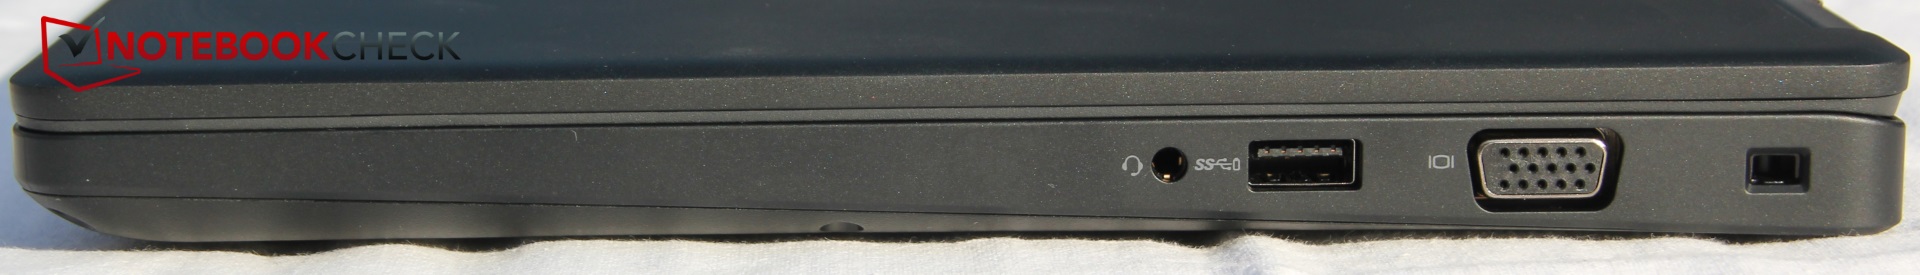
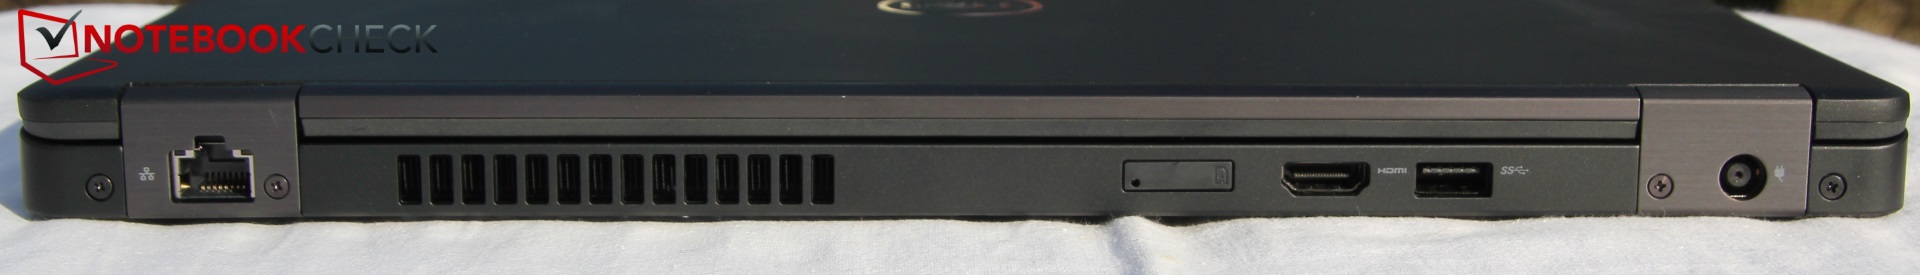
The connectivity is similar to that of the previous model. There is still a VGA port on the right, as well as an HDMI connector on the back. While this layout was criticized in previous reviews, it remains a matter of taste and one could argue that it is advantageous to have the more commonly used HDMI port at back, away from mouse inputs.
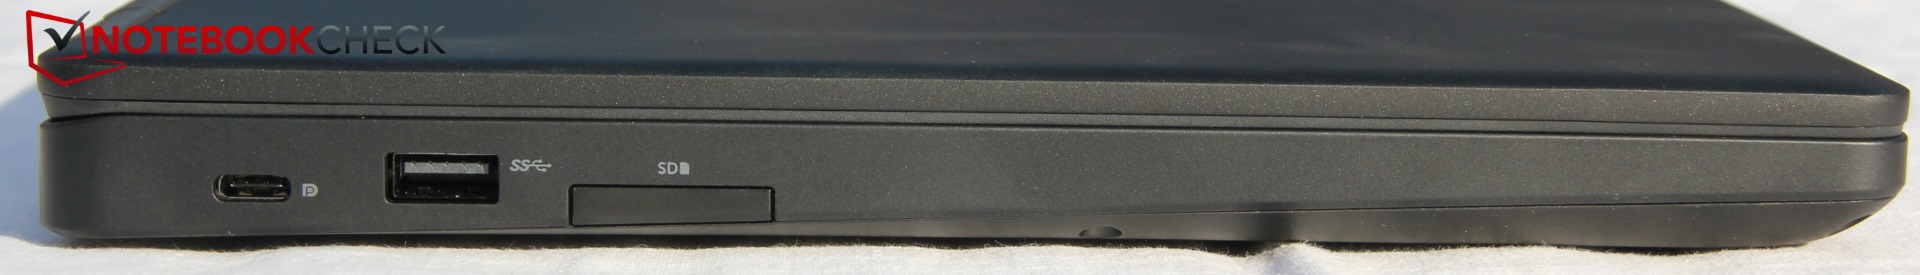
On the left, you will find a USB Type-C port with support for DisplayPort, but our configuration lacks a Thunderbolt 3, the latter being optional.
Aside from that, connectivity is good, but not great. Going for USB 3.0 instead of 2.0 is an admirable choice in our view, the headphone combo-jack being the standard in the business world. Notable is the external SIM slot on the back for a micro-SIM. All in all, connectivity is good, having ports at the back has advantages and disadvantages.
SD card reader - High speeds
The previous generation already included a great SD card reader giving excellent results in our testing. The new version can improve on that, showing an increase in our "JPG copy test" using a Toshiba Exceria Pro SDXC 64 GB UHS-II reference SD card, by 27%. In this respect, the 5490 is twice as fast as any competitor.
A reading test with AS SSD shows even more dramatic results. However, the predecessor somehow managed a 21% better result. Otherwise, the SD card reader is great and far superior to anyone else's offering.
| SD Card Reader | |
| average JPG Copy Test (av. of 3 runs) | |
| Dell Latitude 5490-TD70X (Toshiba Exceria Pro SDXC 64 GB UHS-II) | |
| Dell Latitude 5480 (Toshiba Exceria Pro SDXC 64 GB UHS-II) | |
| Acer TravelMate P648-G2-M-73T0 (Toshiba Exceria Pro SDXC 64 GB UHS-II) | |
| Lenovo ThinkPad T470-20HD002HGE (Toshiba Exceria Pro SDXC 64 GB UHS-II) | |
| HP EliteBook 840 G4-Z2V49ET ABD (Toshiba Exceria Pro SDXC 64 GB UHS-II) | |
| Fujitsu LifeBook U747 (Toshiba Exceria Pro SDXC 64 GB UHS-II) | |
| Average of class Office (22.4 - 198.5, n=31, last 2 years) | |
| maximum AS SSD Seq Read Test (1GB) | |
| Dell Latitude 5480 (Toshiba Exceria Pro SDXC 64 GB UHS-II) | |
| Dell Latitude 5490-TD70X (Toshiba Exceria Pro SDXC 64 GB UHS-II) | |
| Lenovo ThinkPad T470-20HD002HGE (Toshiba Exceria Pro SDXC 64 GB UHS-II) | |
| Acer TravelMate P648-G2-M-73T0 (Toshiba Exceria Pro SDXC 64 GB UHS-II) | |
| HP EliteBook 840 G4-Z2V49ET ABD (Toshiba Exceria Pro SDXC 64 GB UHS-II) | |
| Fujitsu LifeBook U747 (Toshiba Exceria Pro SDXC 64 GB UHS-II) | |
| Average of class Office (25 - 249, n=27, last 2 years) | |
Communication - Optional LTE
While the predecessor contained a Qualcomm based wireless module, this has now been changed to an Intel Tri-band adapter. This shows a great improvement in signal strength and puts it on the same level as other offerings.
Reception quality, however, is poor and the new Dell managed only to get the second worst place. The Acer is about 13% faster in this respect.
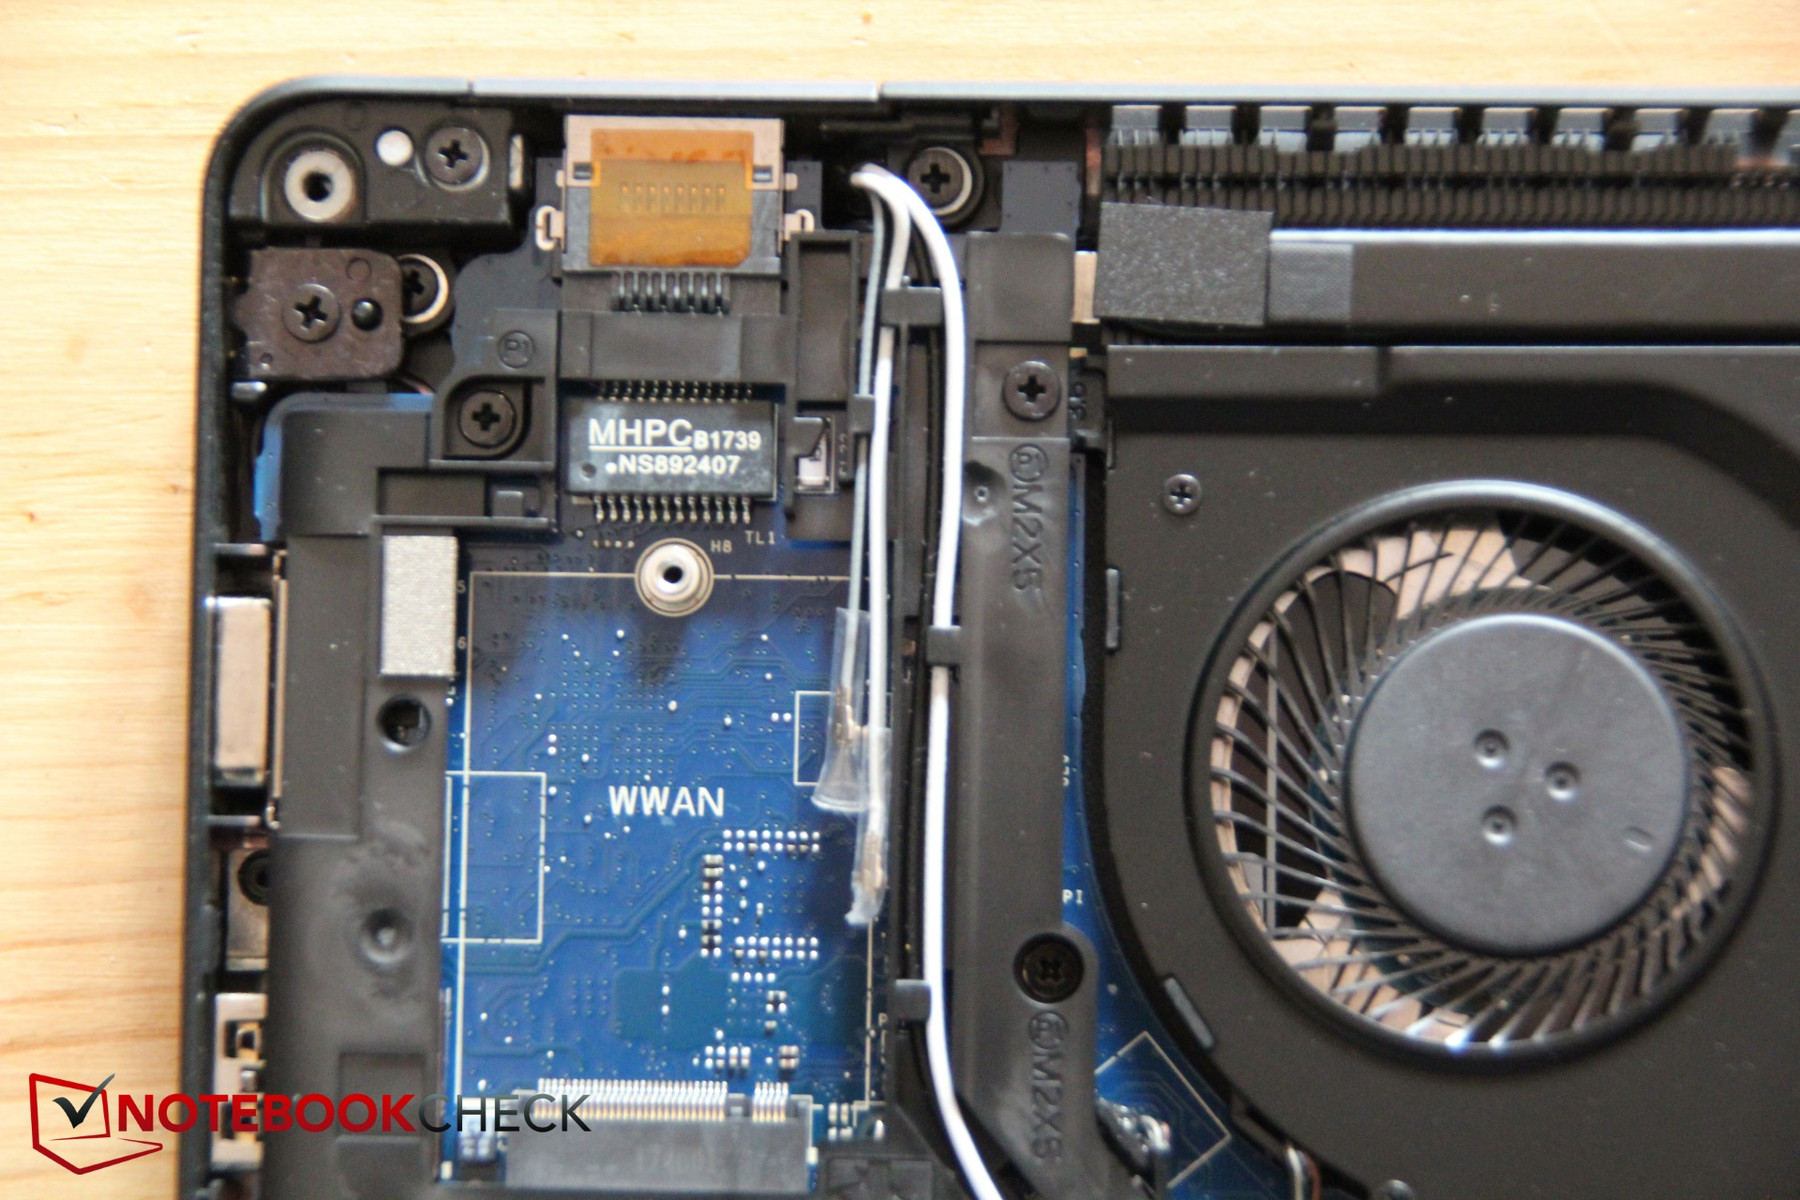
Alternatively, you may use a SIM card to access the internet. However, despite the fact that a SIM slot can be found on our device, there is no integrated WWAN module. This means that if you want to use this feature, you will first have to buy and install a WWAN module. Fortunately, antennas are preinstalled.
We still tried putting a Micro-SIM card into the slot. However, we were not able to take it out again, as the inside of the SIM tray broke. This, despite using the official SIM removing tool is unacceptable.
Security - A lot of options
Dell has focused on the security aspects of the Latitude 5490. Unfortunately, most components are only available as options. Thus, our test device does not contain a FIPS 201 smart card reader, or a contactless Smart Card Reader NFC with Control Vault 2 FIPS 140-2 Level 3 Certification. The optional fingerprint sensor was also not included, making the device not Windows Hello compatible. This can be different depending on the configuration.
TPM 2.0 is on-board, but feels at this point almost like a standard feature. Still, if you are interested in any of these functions, you get a great number of options for multi-factor authentication.
A Noble Wedge Lock Slot is a standard alternative to the commonly used Kensington Lock, as to prevent physical theft of the device. Included also is a package of Dell security software for encrypting files among other things.
Accessories - Dell is a cheapskate
Dell sells a lot of accessories on their website, for example, the Dell Business Dock, which is powered via USB Type-C, delivers power to the notebook and adds ports for connectivity. Adding to that, there are multiple other docks, some based on Thunderbolt 3, none of which are device specific and quite expensive starting at 236.75 Euros (~$295). Not many accessories are included with the notebook, only a quick start guide is packaged with the device.
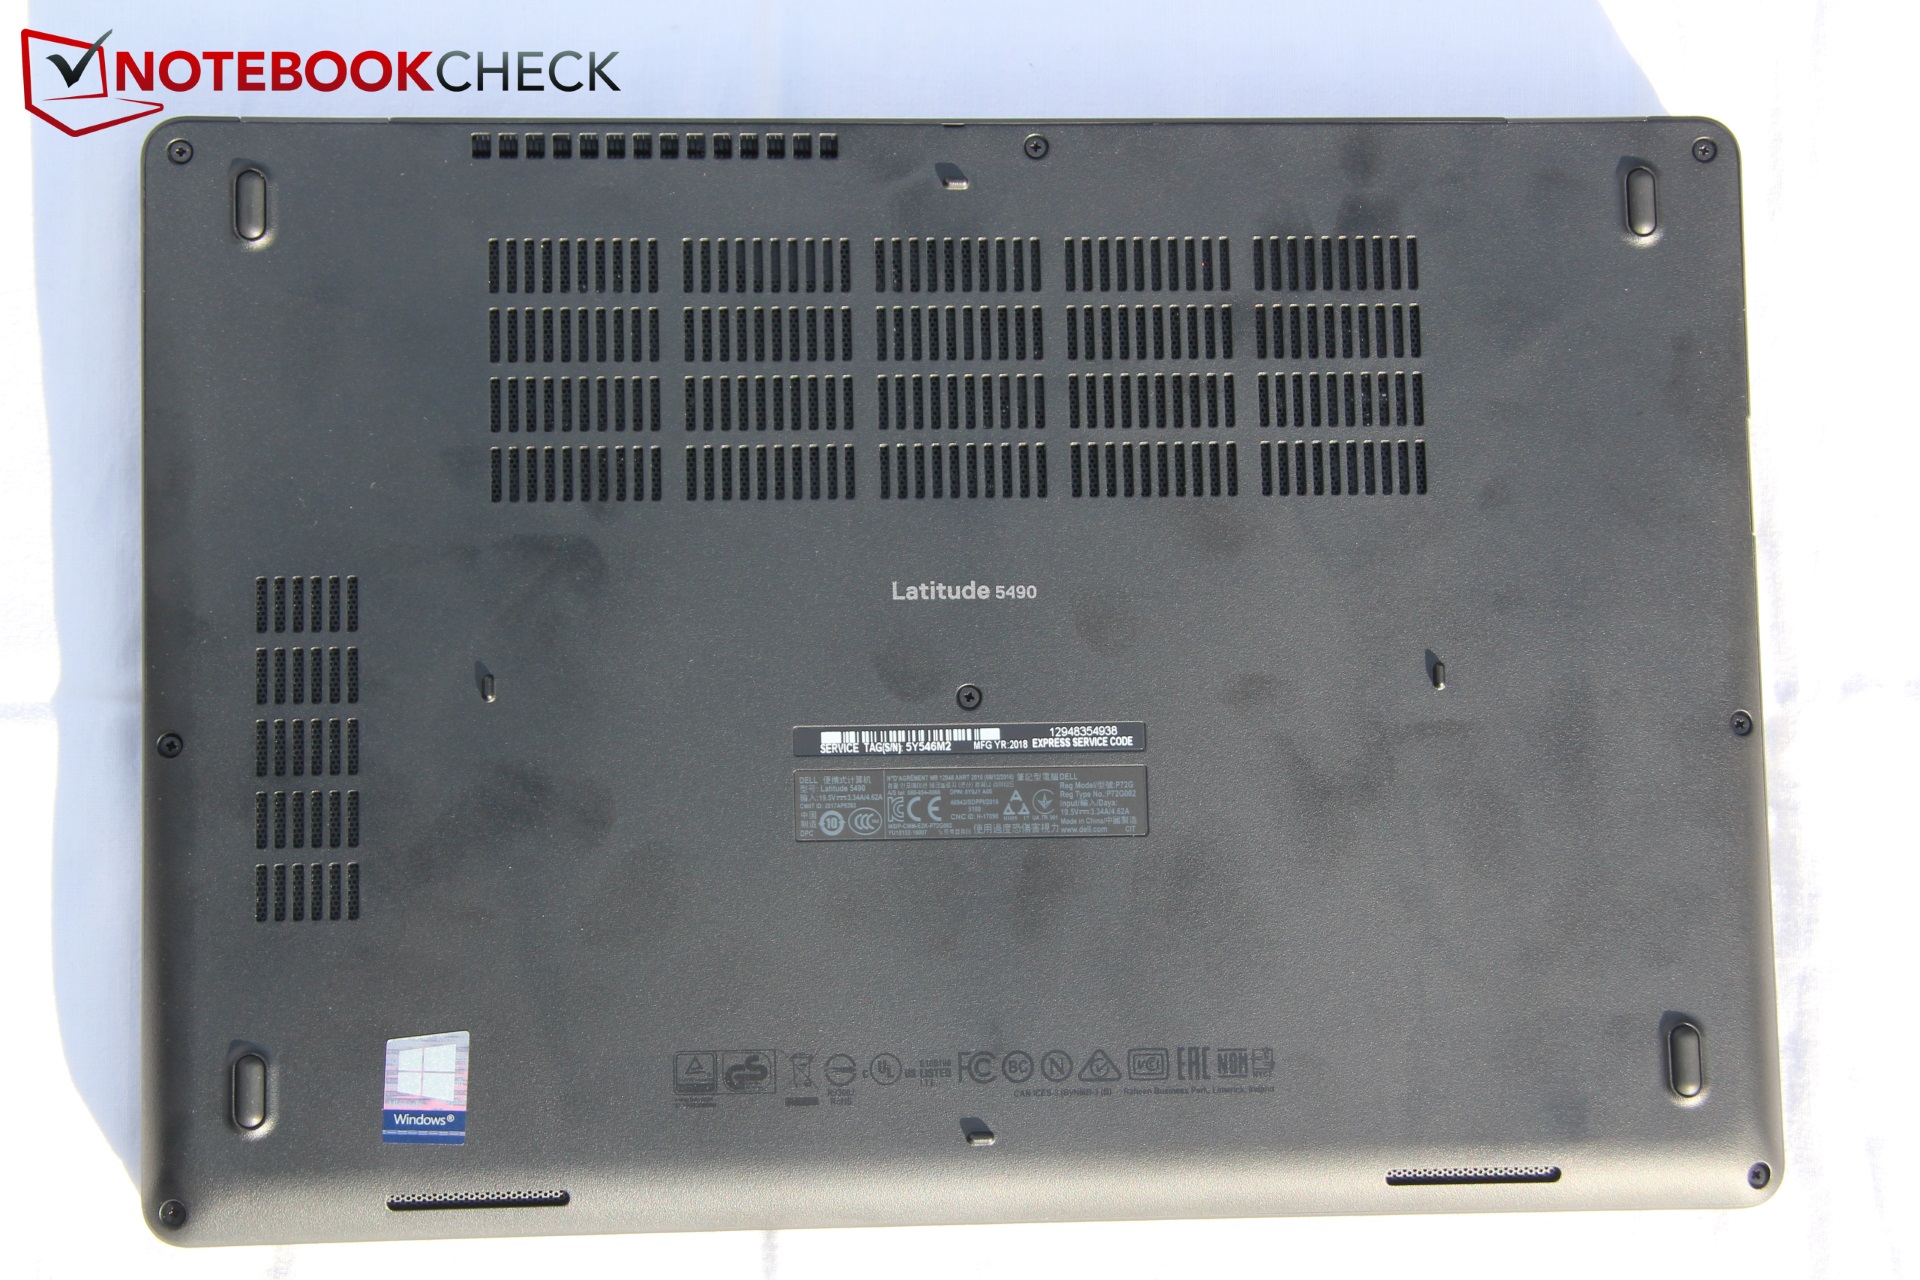
Maintenance - Removable base plate
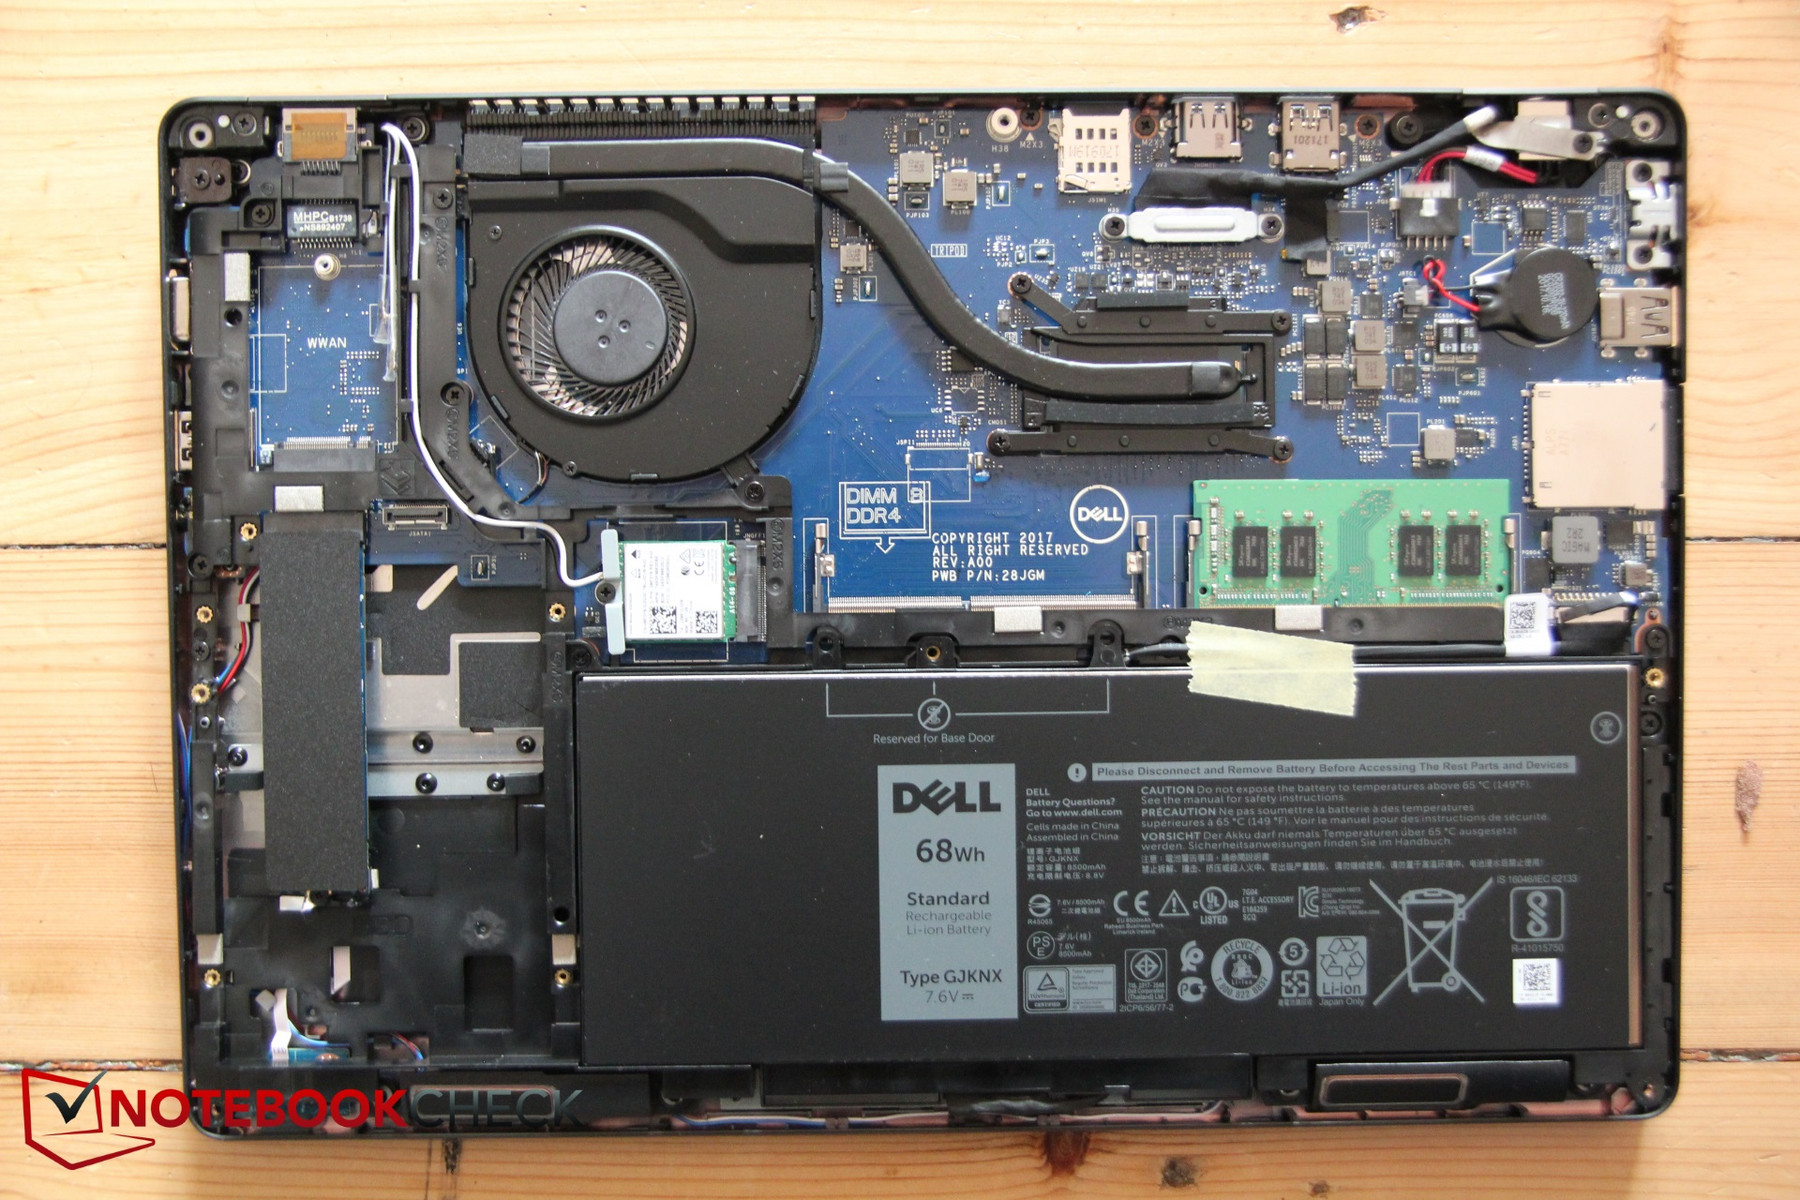
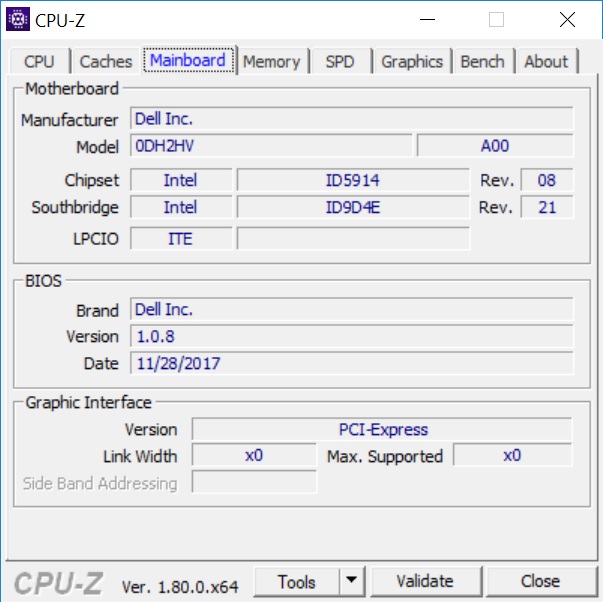
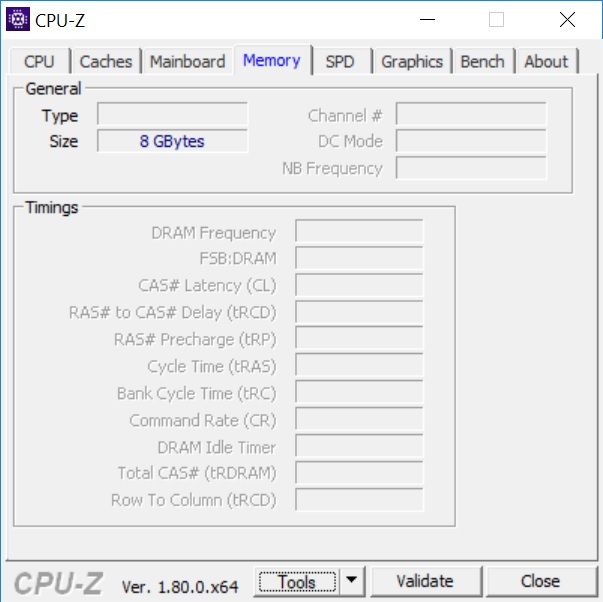
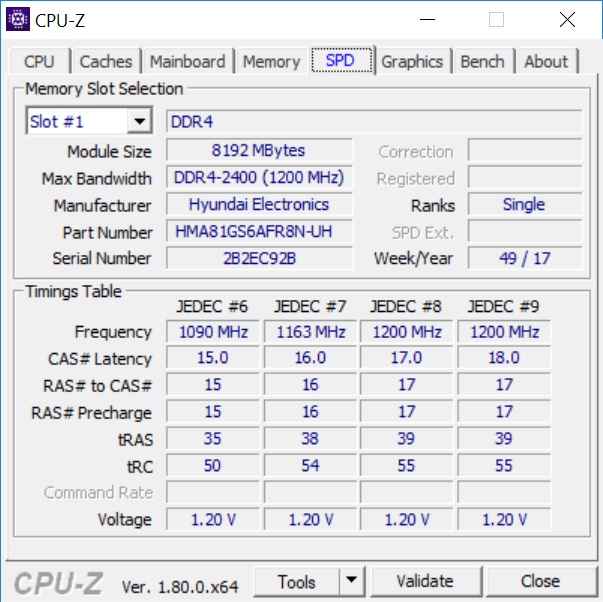
This is another area where the 5490 stays true to its predecessor, it does not offer a maintenance hatch. The base plate is easy to remove though. Only eight screws need to be removed to take off the base plate of the chassis. Positive: The eight screws are fixed in such a way as to not fall out after being loosened. Afterwards, you get access to the battery, drive, RAM, fans and (for us at least) the unoccupied WWAN slot. As only a single 8 GB memory stick is used, an upgrade via the second RAM slot is easy.
Warranty - Brief, optionally longer
Cyberport offers the device with only one year of warranty, including limited on-site service. Dell offers an up to five years longer warranty on their website for those willing to pay. Please see our Guarantees, Return Policies and Warranties FAQ for country-specific information.
Webcam - Usable
Because of Teleconferences and meetings via Skype, webcams are more in demand than ever, especially in the business sector. Despite that, most manufacturers do not focus on webcam quality. The Latitude 5490 is, unfortunately, no exception to this rule. Colors are decent, but details are washed out, leading to a blurry image.
Input devices - Solid performance
Keyboard
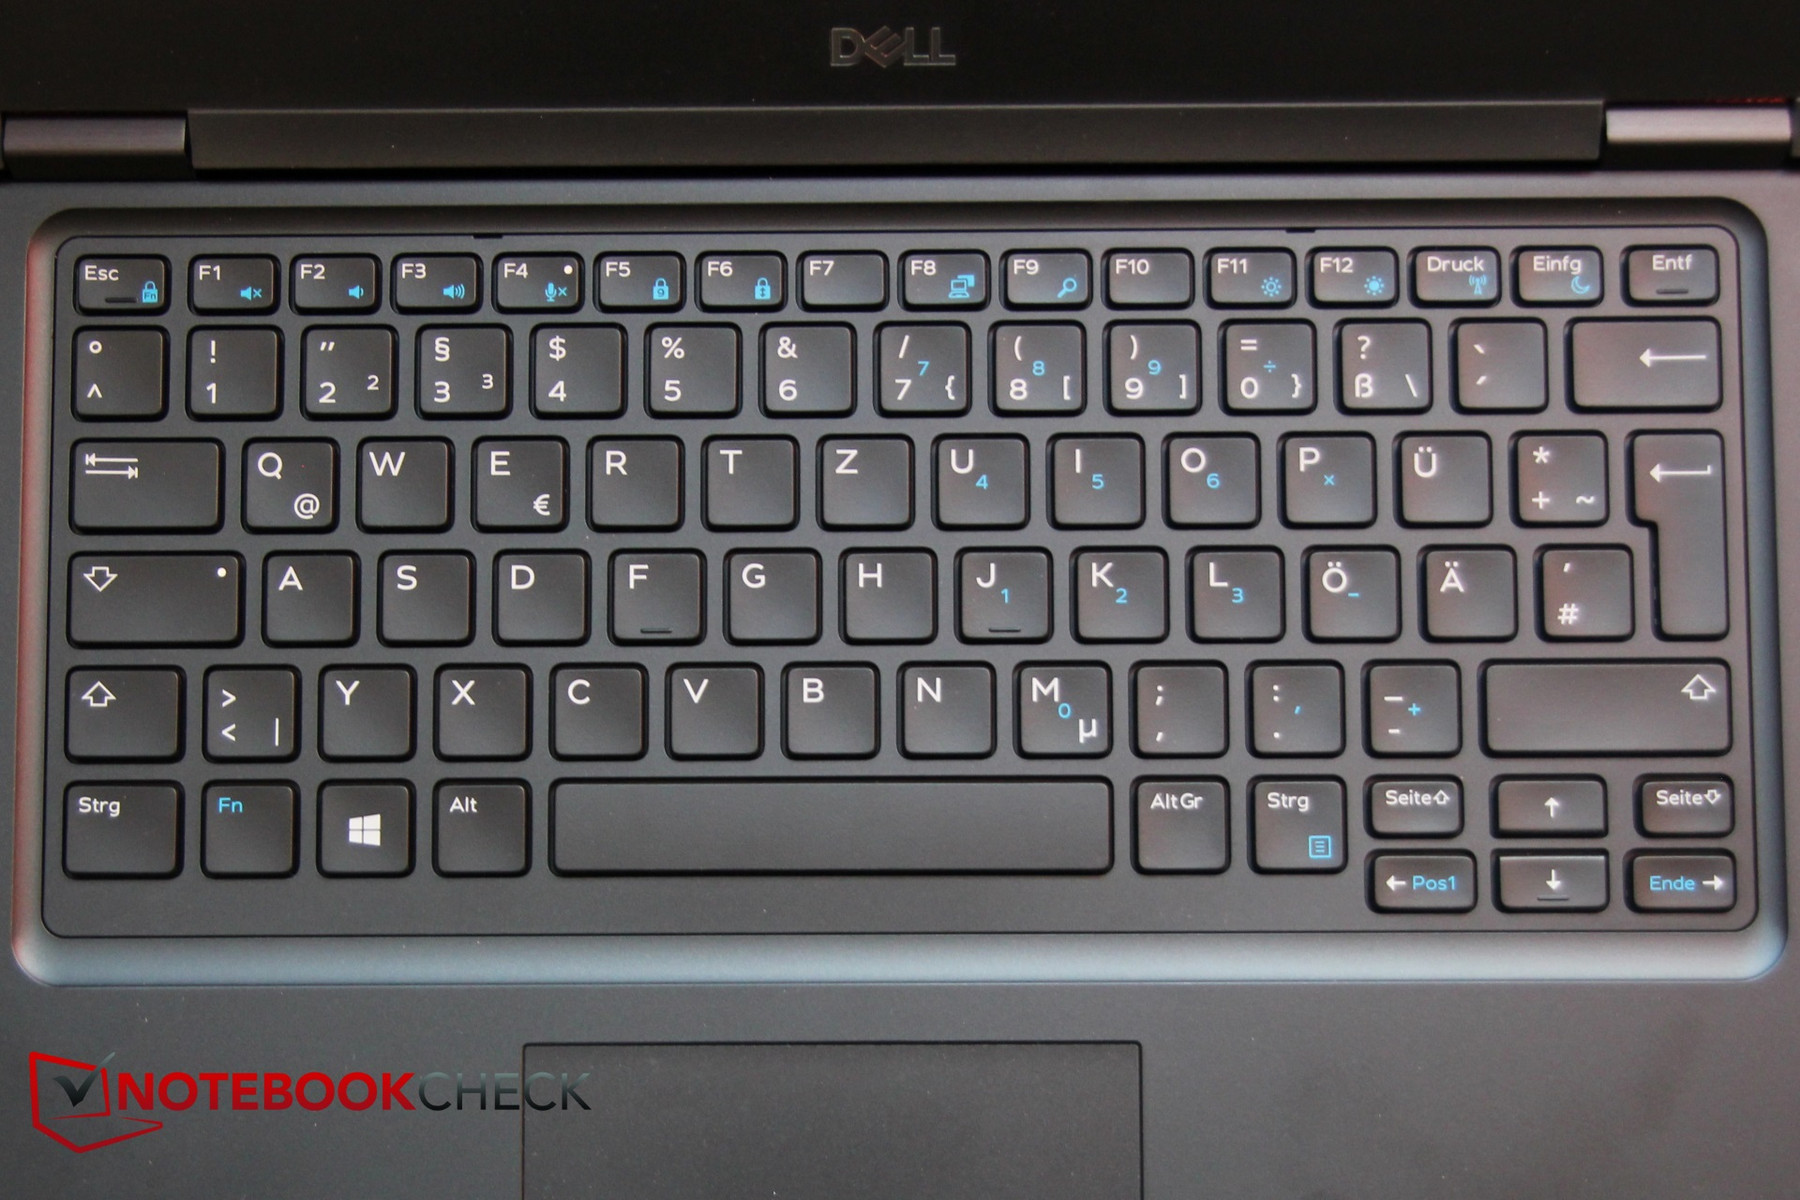
While the keys are small at 14mm (~.55 in), they are far apart and have good travel considering its class. The base appears sturdier than the one in the previous generation, even the center bends only slightly. The pressure point is soft but allows for quick and smooth writing. The small Enter key may require some getting used to. Typing is not too loud, although the space bar could be quieter, even though it is not distracting. The "quasi number pad" via Fn key is a very useful feature that is sadly still not standard on most laptops.
The backlighting for the keyboard is also optional, which is not to be found on our test device.
Touchpad
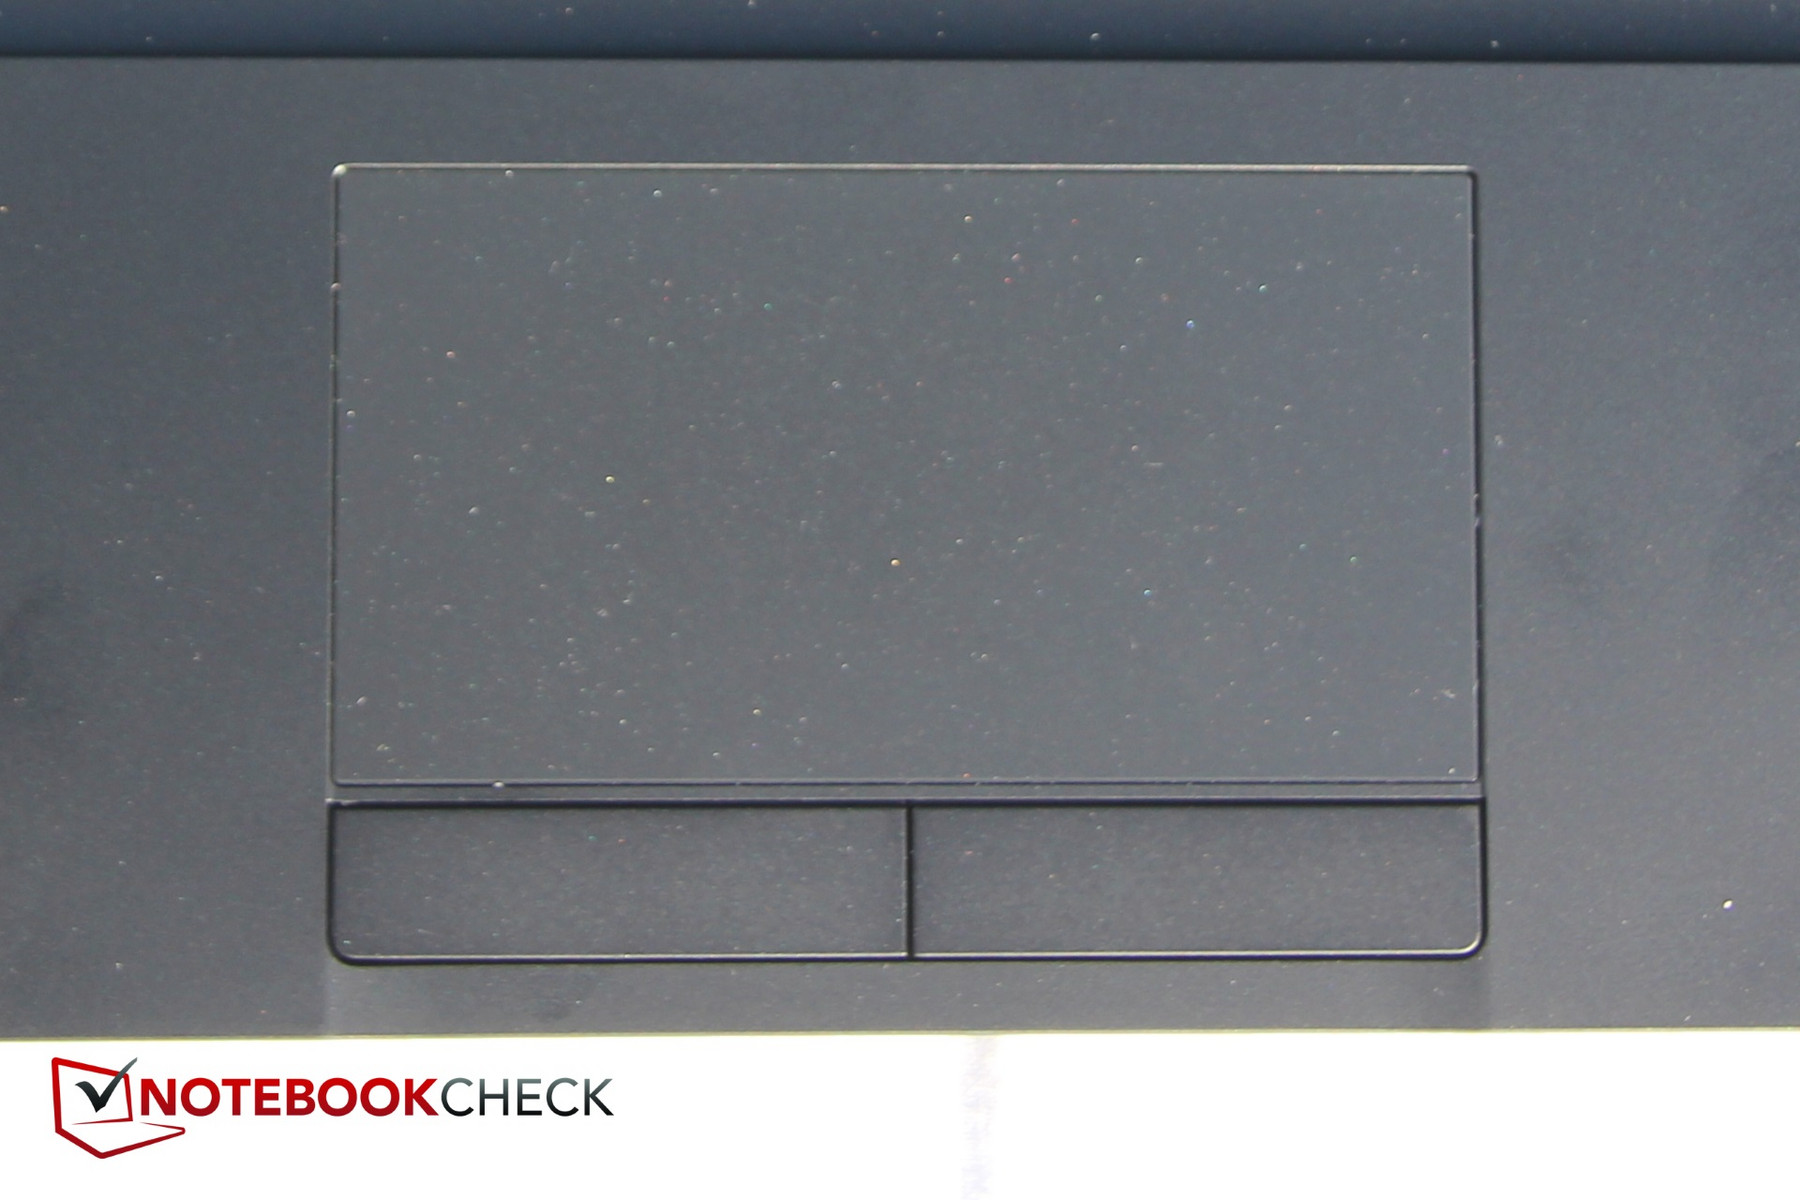
The touchpad was a pleasant surprise during our testing. The surface allows easy navigation, and gesture control worked flawlessly with up to four fingers. The dedicated keys make a muted clicking sound and offer long travel without feeling "spongy".
The Track- or PointStick offered in last year’s model is missing in our configuration, but can be found in other model variants. The Dell website, however, does not specify which models contain a TrackStick.
Display - Replaced, yet not improved


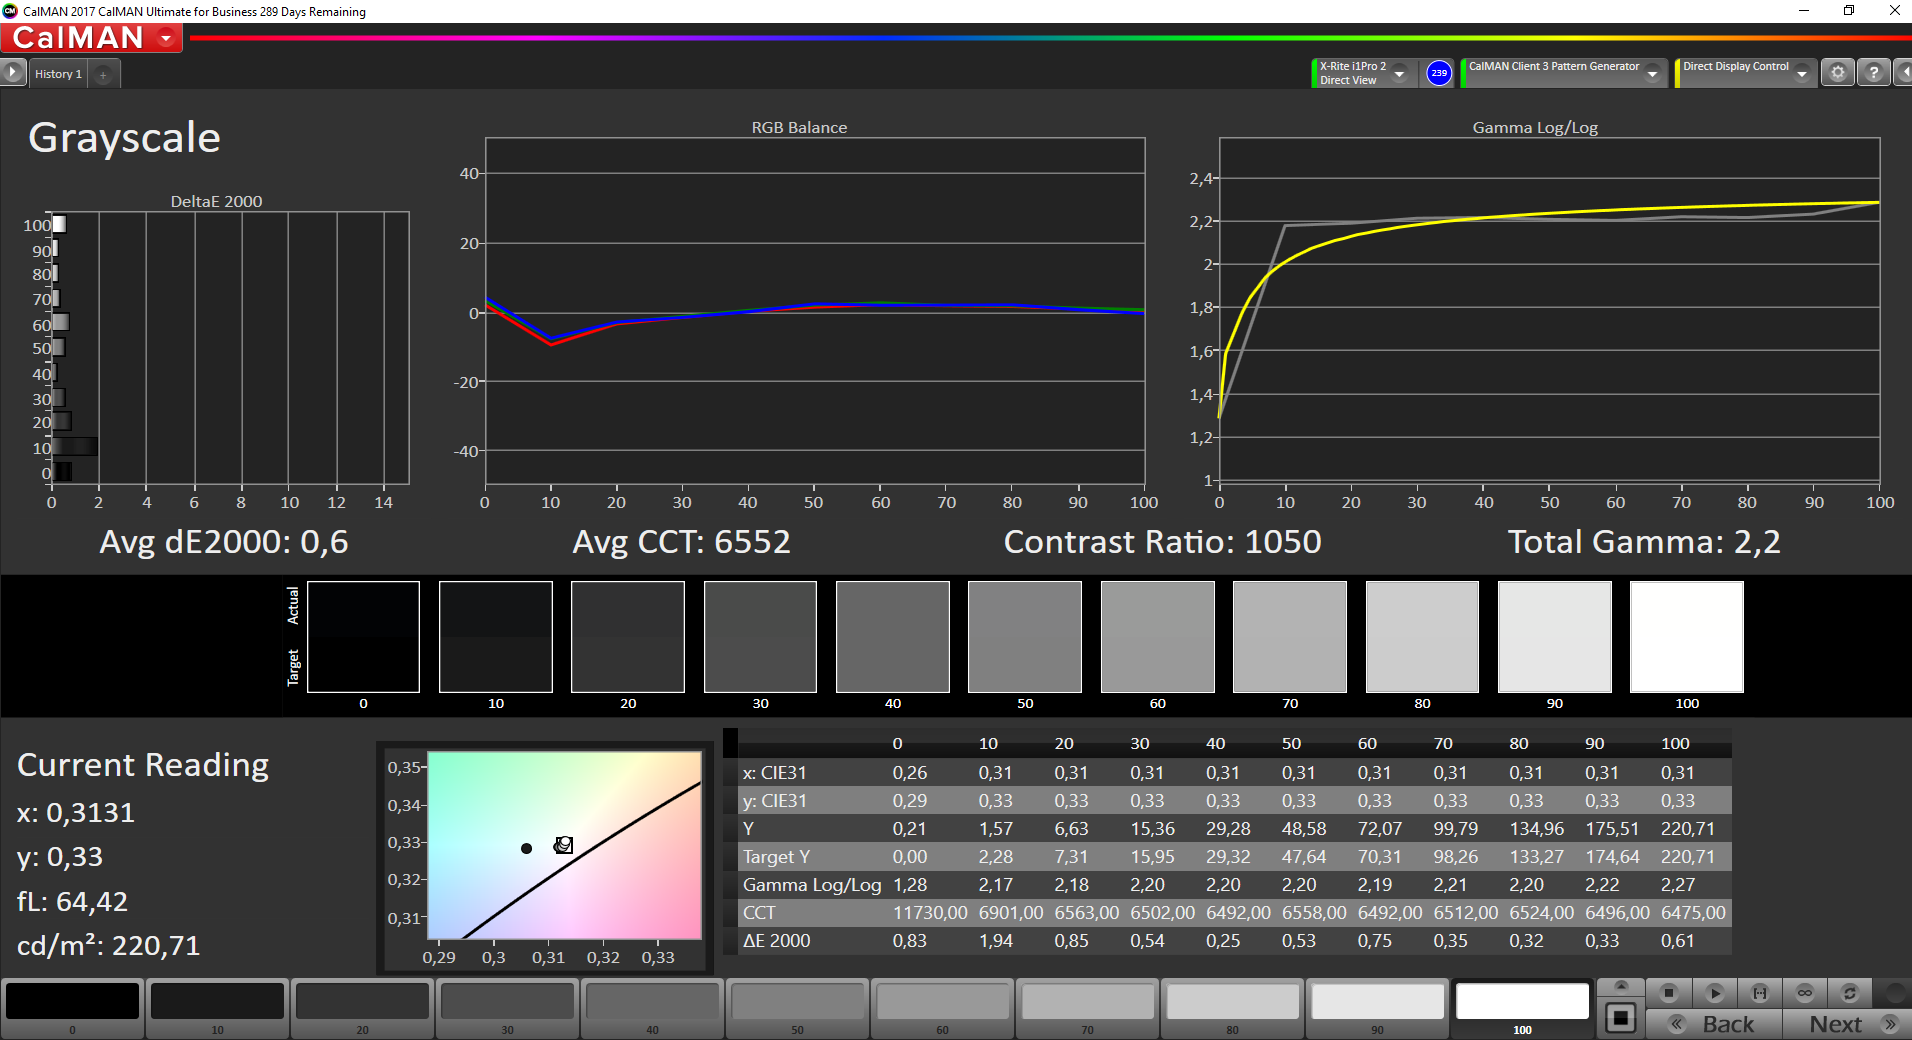
One of our main complaints of the predecessor was the display, based on a Philips panel, which we deemed not bright enough. With the current generation, Dell has changed the screen to an IPS model by AU Optronics. Sadly, this has not solved the issue: Instead of the previous 205 cd/m² the screen now reaches 211 cd/m², an almost imperceivable improvement. Furthermore, the distribution of brightness has worsened by 2%. Why Dell continues to fail in this discipline is beyond us.
In direct comparison, every competitor manages better results: While the Acer can at best be called acceptable, the models from Lenovo, Fujitsu and HP manage more than 300 cd/m² each. The new panel does not appear to bring any improvement in this respect.
On top of that, screen bleeding was noticeable at the edges, though not too distracting during use.
| |||||||||||||||||||||||||
Brightness Distribution: 88 %
Center on Battery: 223 cd/m²
Contrast: 1195:1 (Black: 0.19 cd/m²)
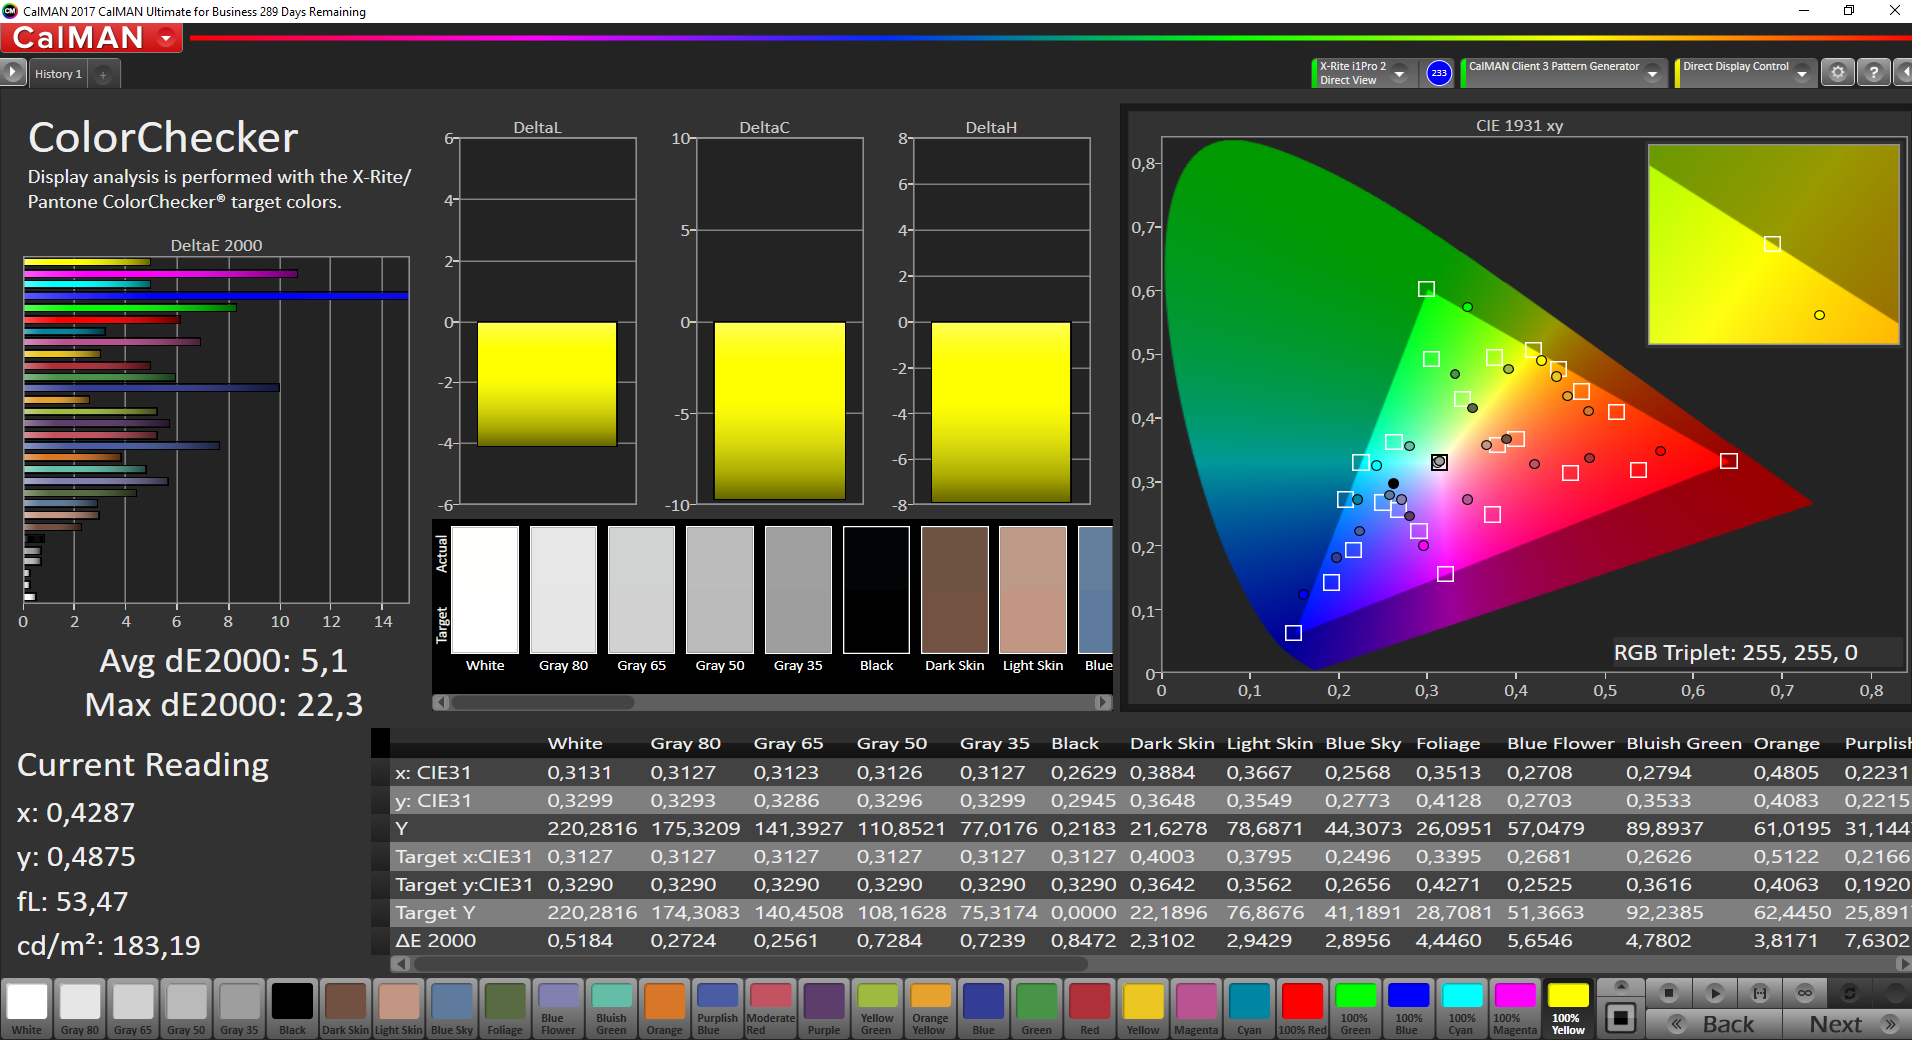
ΔE ColorChecker Calman: 5.6 | ∀{0.5-29.43 Ø4.79}
ΔE Greyscale Calman: 2.4 | ∀{0.09-98 Ø5}
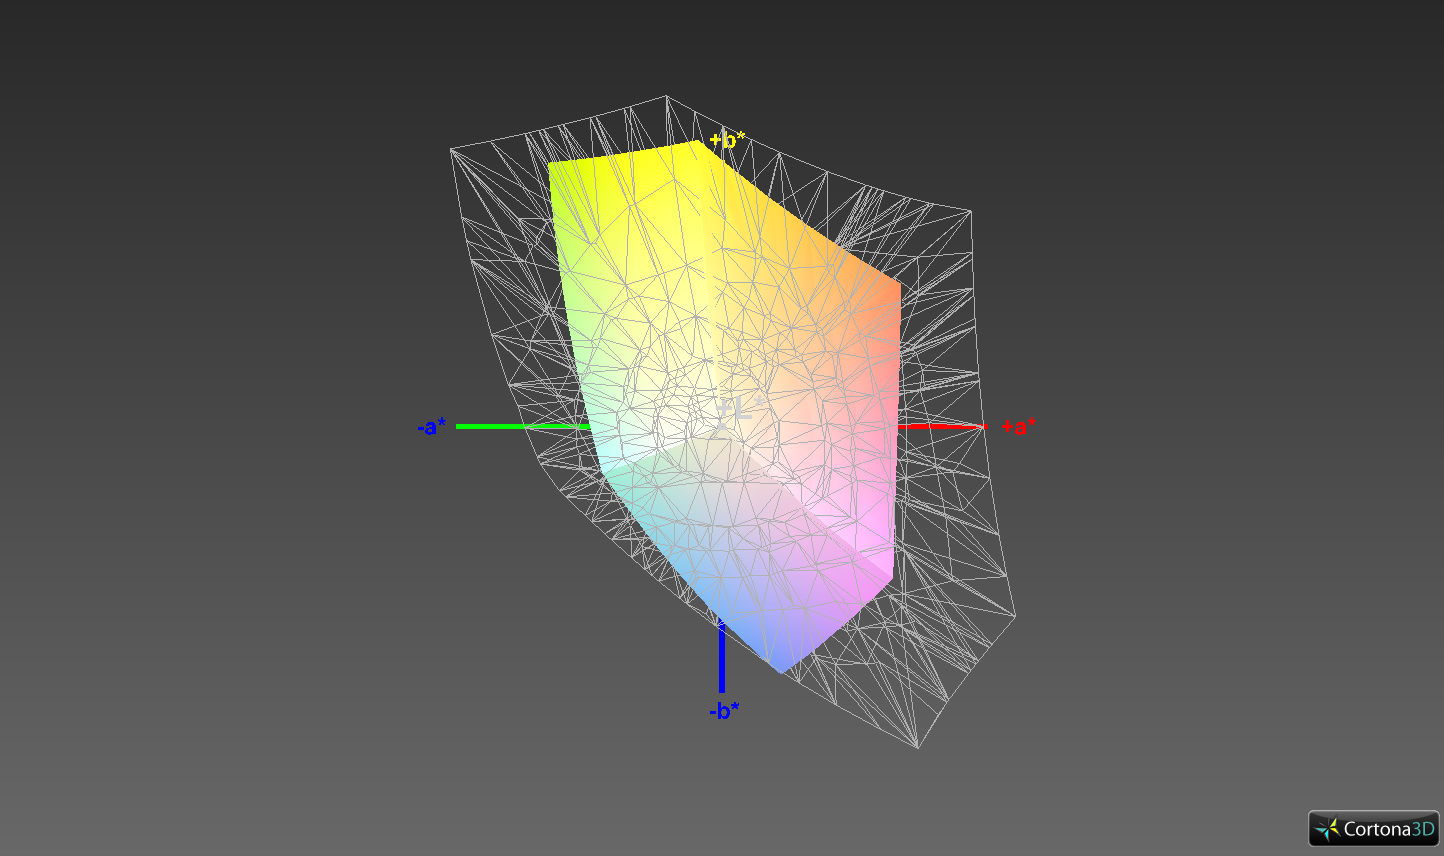
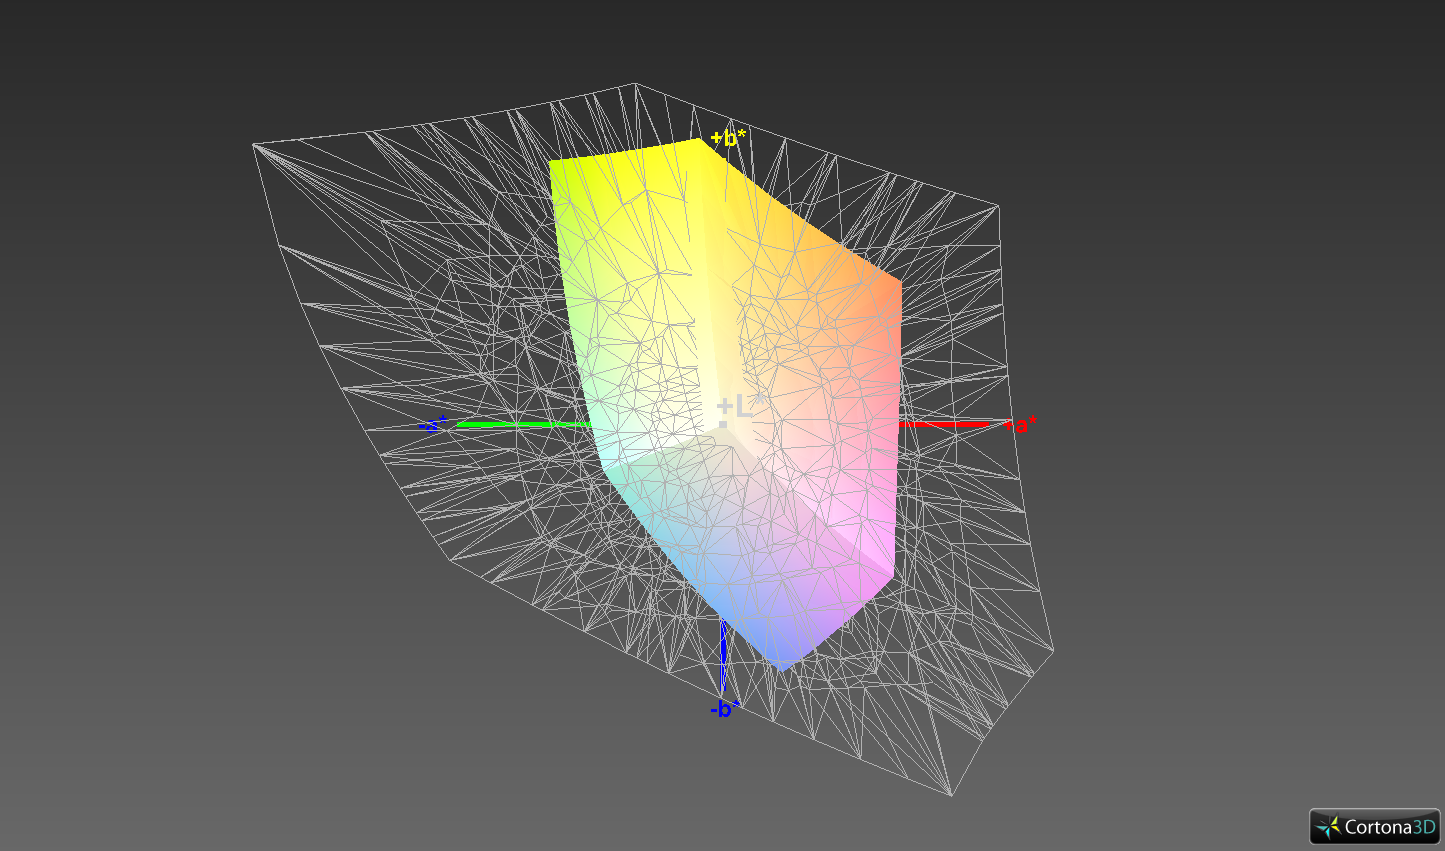
54.4% sRGB (Argyll 1.6.3 3D)
34.5% AdobeRGB 1998 (Argyll 1.6.3 3D)
37.48% AdobeRGB 1998 (Argyll 3D)
54.6% sRGB (Argyll 3D)
36.28% Display P3 (Argyll 3D)
Gamma: 2.44
CCT: 6506 K
| Dell Latitude 5490-TD70X AU Optronics AUO263D, , 1920x1080, 14" | Dell Latitude 5480 LG Philips LGD0553, , 1920x1080, 14" | HP EliteBook 840 G4-Z2V49ET ABD AUO123D, , 1920x1080, 14" | Acer TravelMate P648-G2-M-73T0 1920x1080, 14" | Lenovo ThinkPad T470-20HD002HGE N140HCA-EAB, , 1920x1080, 14" | Fujitsu LifeBook U747 LG LP140WF3, , 1920x1080, 14" | |
|---|---|---|---|---|---|---|
| Display | 12% | 52% | 76% | 14% | 67% | |
| Display P3 Coverage (%) | 36.28 | 40.62 12% | 55.8 54% | 67.2 85% | 41.6 15% | 66.1 82% |
| sRGB Coverage (%) | 54.6 | 61.2 12% | 80.7 48% | 90.8 66% | 61.9 13% | 84.8 55% |
| AdobeRGB 1998 Coverage (%) | 37.48 | 41.96 12% | 57.7 54% | 66.4 77% | 43.06 15% | 62 65% |
| Response Times | 23% | 22% | 20% | 1% | 25% | |
| Response Time Grey 50% / Grey 80% * (ms) | 46.9 ? | 32.8 ? 30% | 39 ? 17% | 38 ? 19% | 41.6 ? 11% | 36 ? 23% |
| Response Time Black / White * (ms) | 31.2 ? | 26.4 ? 15% | 23 ? 26% | 25 ? 20% | 34 ? -9% | 23.2 ? 26% |
| PWM Frequency (Hz) | ||||||
| Screen | -3% | -60% | 14% | -9% | 10% | |
| Brightness middle (cd/m²) | 227 | 215.9 -5% | 346 52% | 275 21% | 306 35% | 291 28% |
| Brightness (cd/m²) | 211 | 205 -3% | 317 50% | 253 20% | 287 36% | 296 40% |
| Brightness Distribution (%) | 88 | 90 2% | 86 -2% | 85 -3% | 88 0% | 84 -5% |
| Black Level * (cd/m²) | 0.19 | 0.22 -16% | 0.86 -353% | 0.25 -32% | 0.3 -58% | 0.32 -68% |
| Contrast (:1) | 1195 | 981 -18% | 402 -66% | 1100 -8% | 1020 -15% | 909 -24% |
| Colorchecker dE 2000 * | 5.6 | 5.1 9% | 8.64 -54% | 3.49 38% | 6.2 -11% | 4.3 23% |
| Colorchecker dE 2000 max. * | 22.4 | 15.6 30% | 13.58 39% | 6.77 70% | 13.6 39% | 7.5 67% |
| Greyscale dE 2000 * | 2.4 | 4 -67% | 11.24 -368% | 4.91 -105% | 5.8 -142% | 4.3 -79% |
| Gamma | 2.44 90% | 2.41 91% | 2.62 84% | 2.39 92% | 2.04 108% | 2.31 95% |
| CCT | 6506 100% | 6856 95% | 12530 52% | 6271 104% | 6277 104% | 6529 100% |
| Color Space (Percent of AdobeRGB 1998) (%) | 34.5 | 41.96 22% | 52 51% | 59 71% | 39.62 15% | 55.46 61% |
| Color Space (Percent of sRGB) (%) | 54.4 | 61.15 12% | 80 47% | 91 67% | 61.44 13% | 84.77 56% |
| Total Average (Program / Settings) | 11% /
3% | 5% /
-27% | 37% /
27% | 2% /
-3% | 34% /
23% |
* ... smaller is better
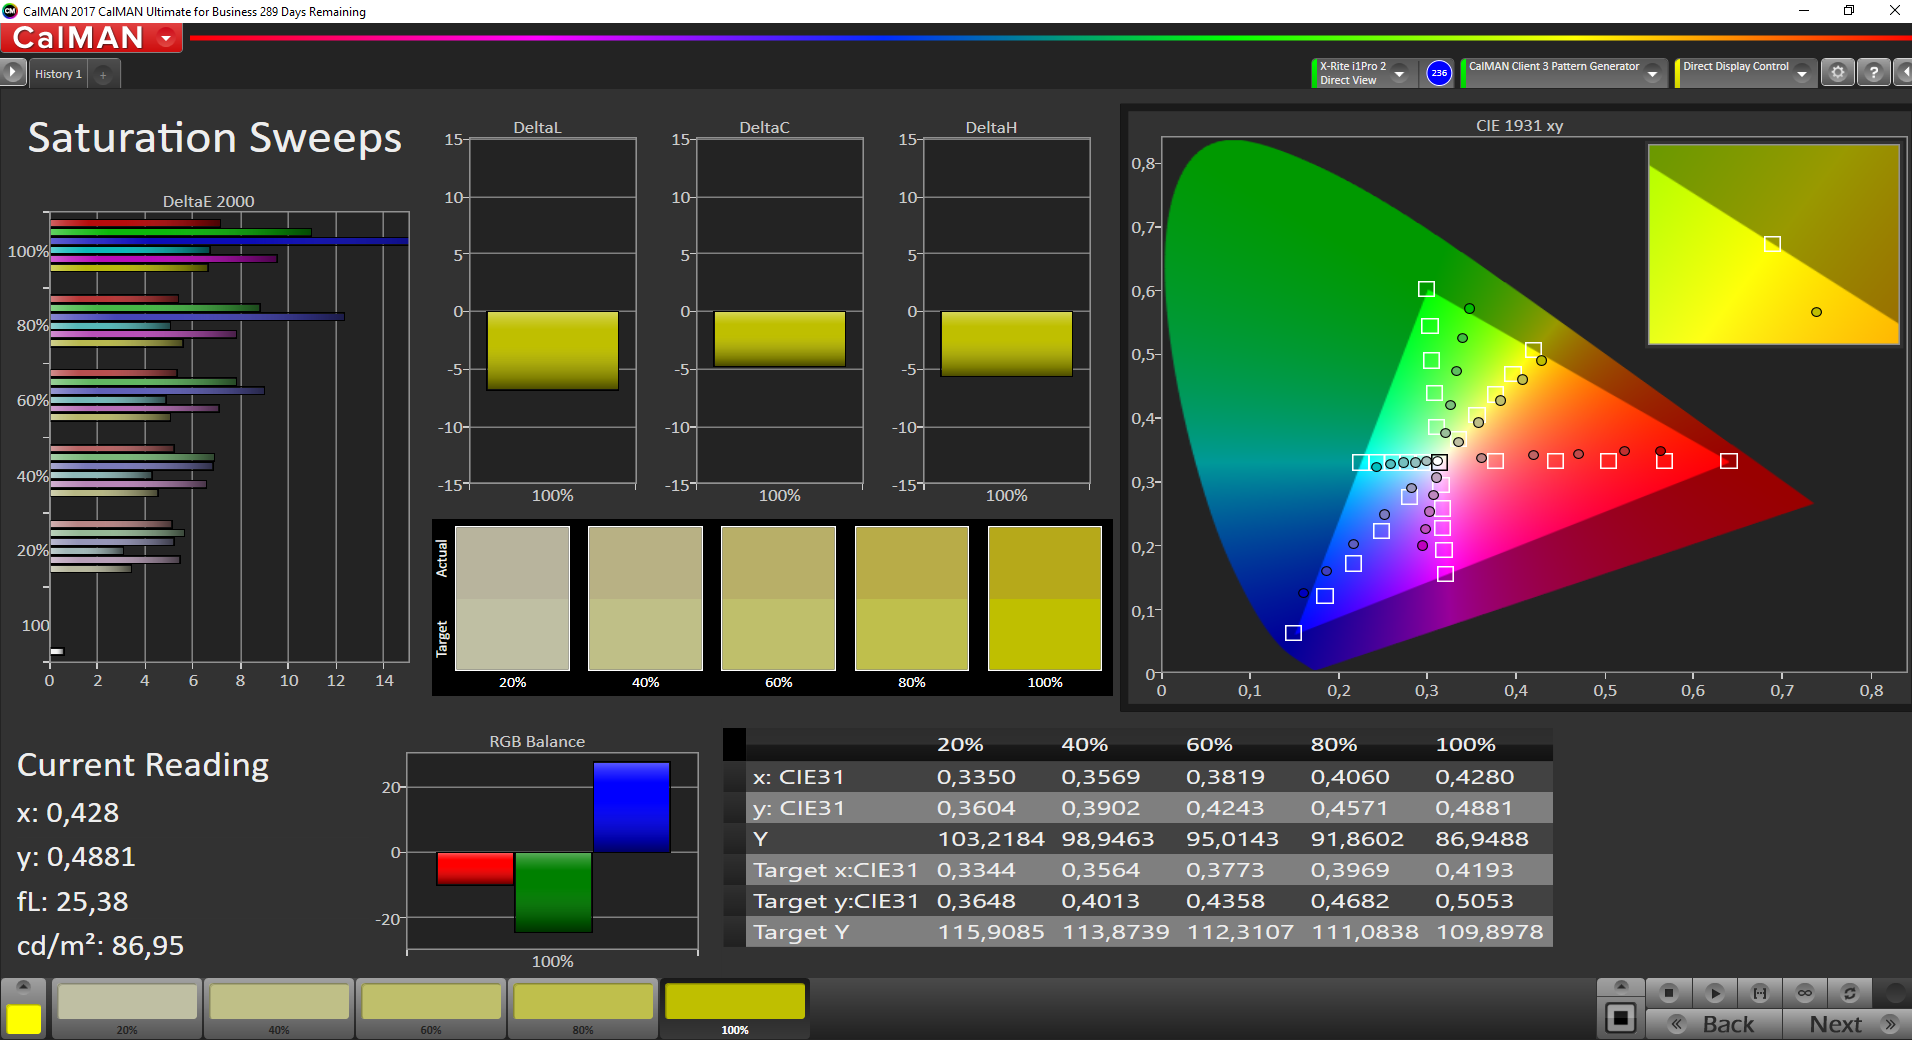
However, the contrast and black level have improved slightly. The by 16-18% improved results in this area actually put it on top compared to the other alternatives. The bright display that HP offers on their notebook, for example, is abysmal in either category and competitors are much better in these aspects. These results can at least partly excuse the low brightness. Grayscale results are equally great; the new panel succeeds in this area as well.
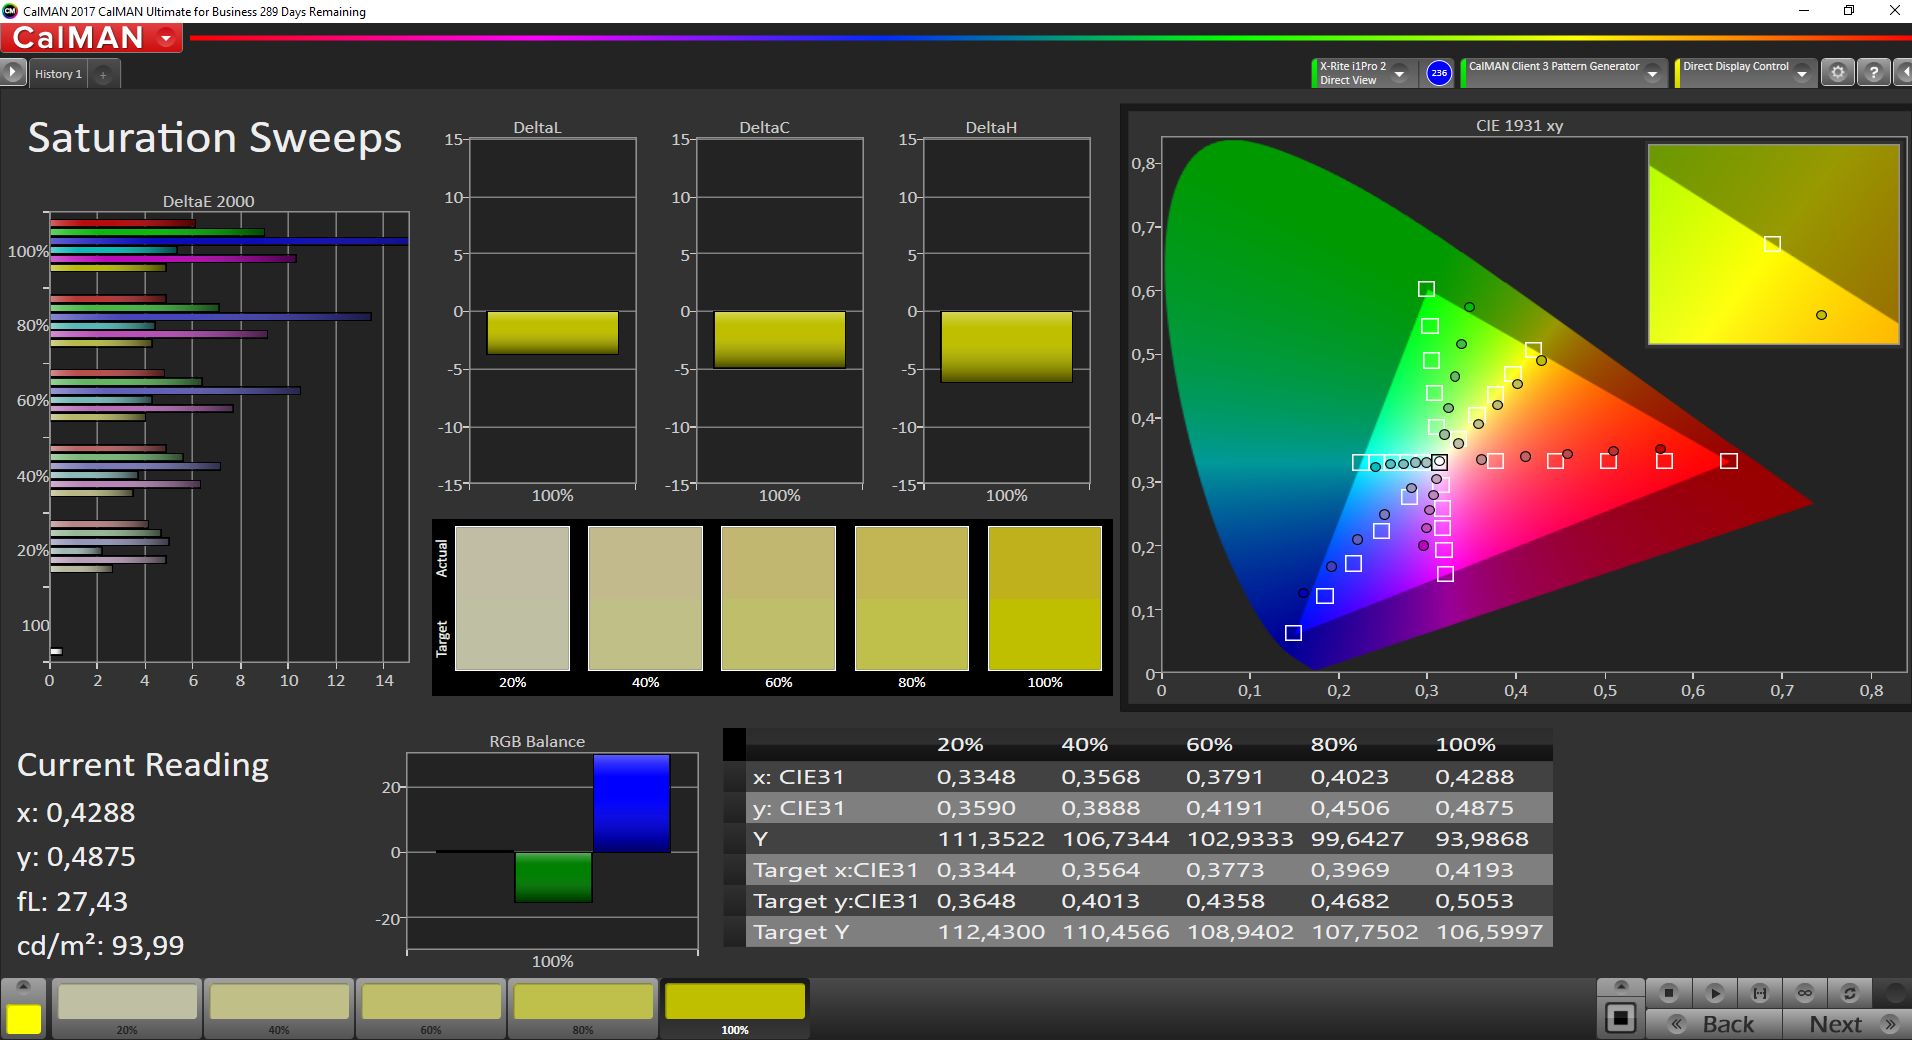
In some respects, unfortunately, the display has actually worsened compared to its predecessor: Color deviations are significantly worse. Equally, the panel’s reaction time is abysmal. Adding to that, the color range has decreased as well. 54.4% sRGB and 34.5% AdobeRGB are not good results, designating the Latitude to the last place.
In conclusion, this new display is one of the weak points present in the Latitude 5490, despite the fact that Dell has actually changed the panel across generations. Our main gripe with the predecessor, i.e. the brightness, is unchanged. While contrast and black levels have improved, color deviation, reaction time and color range have worsened significantly.


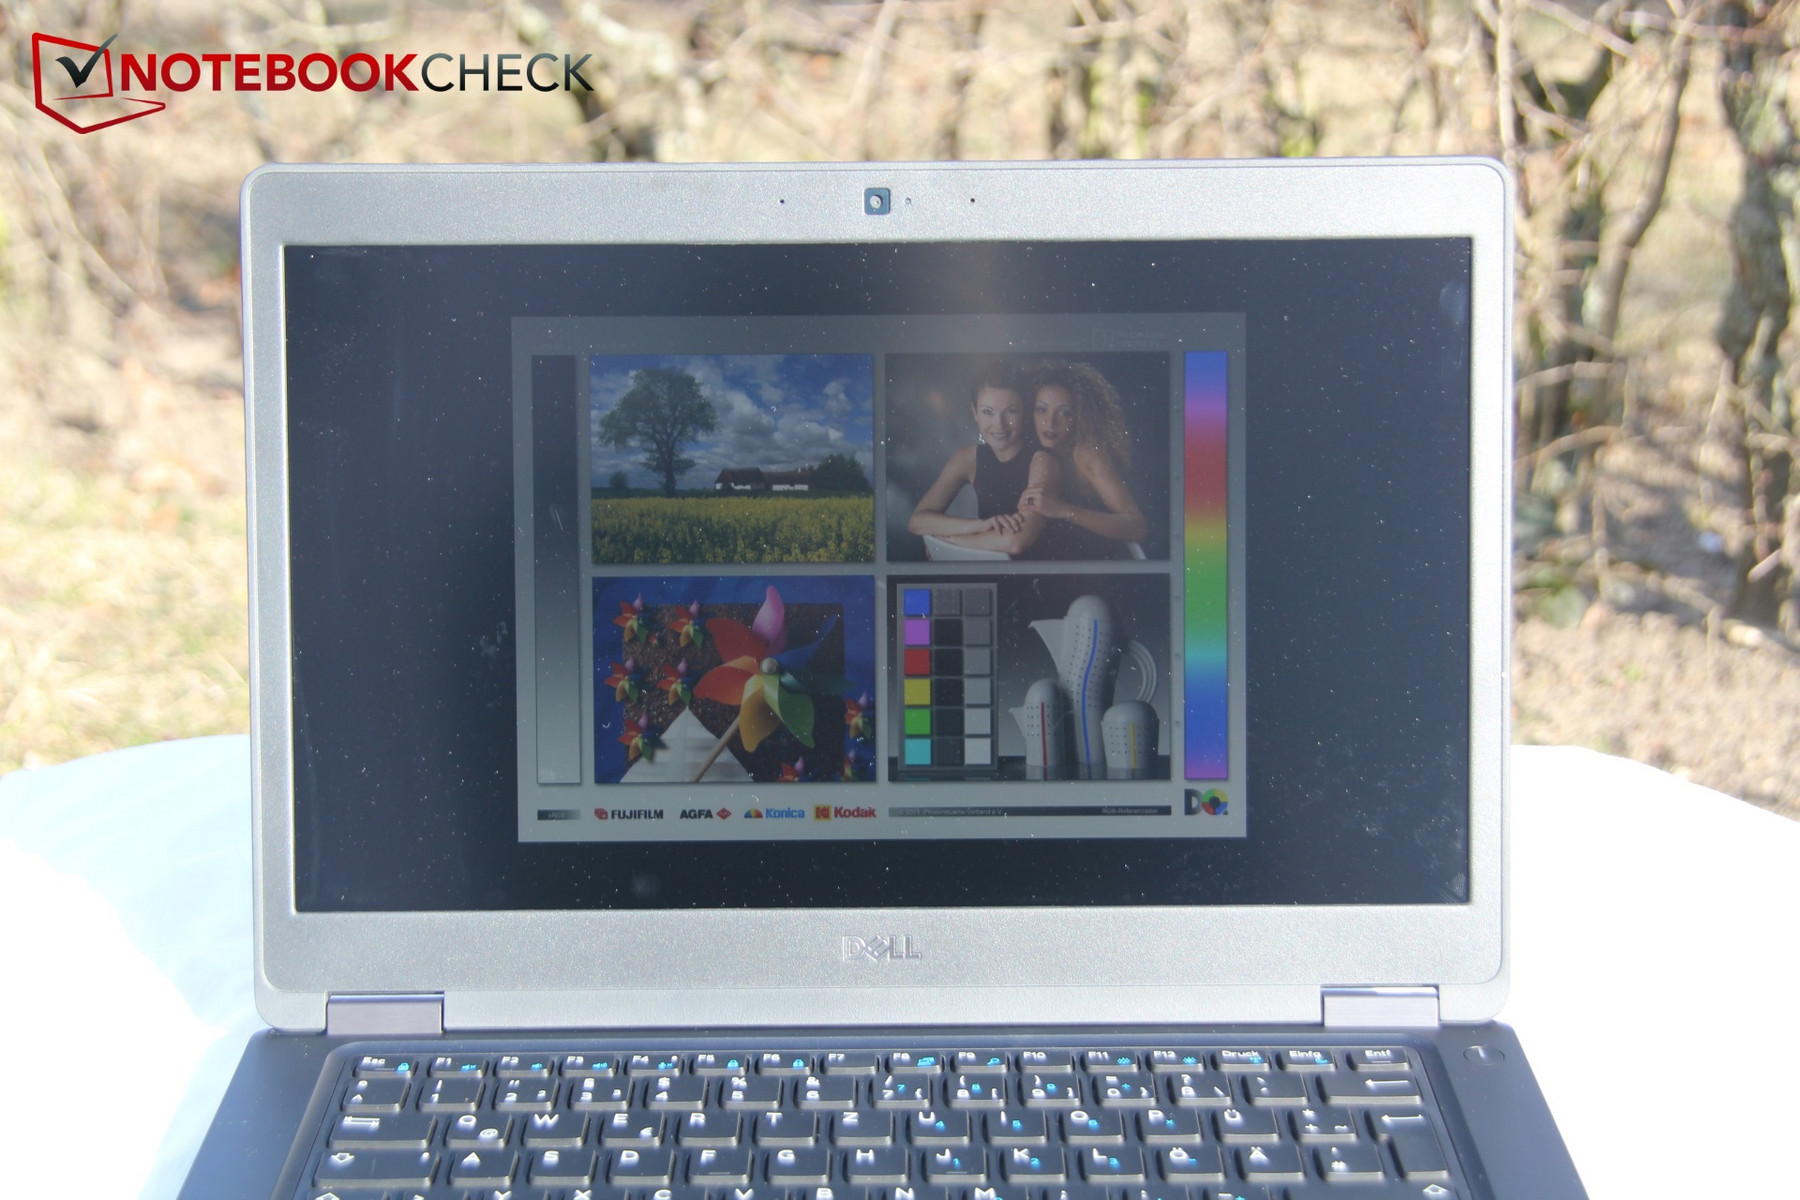
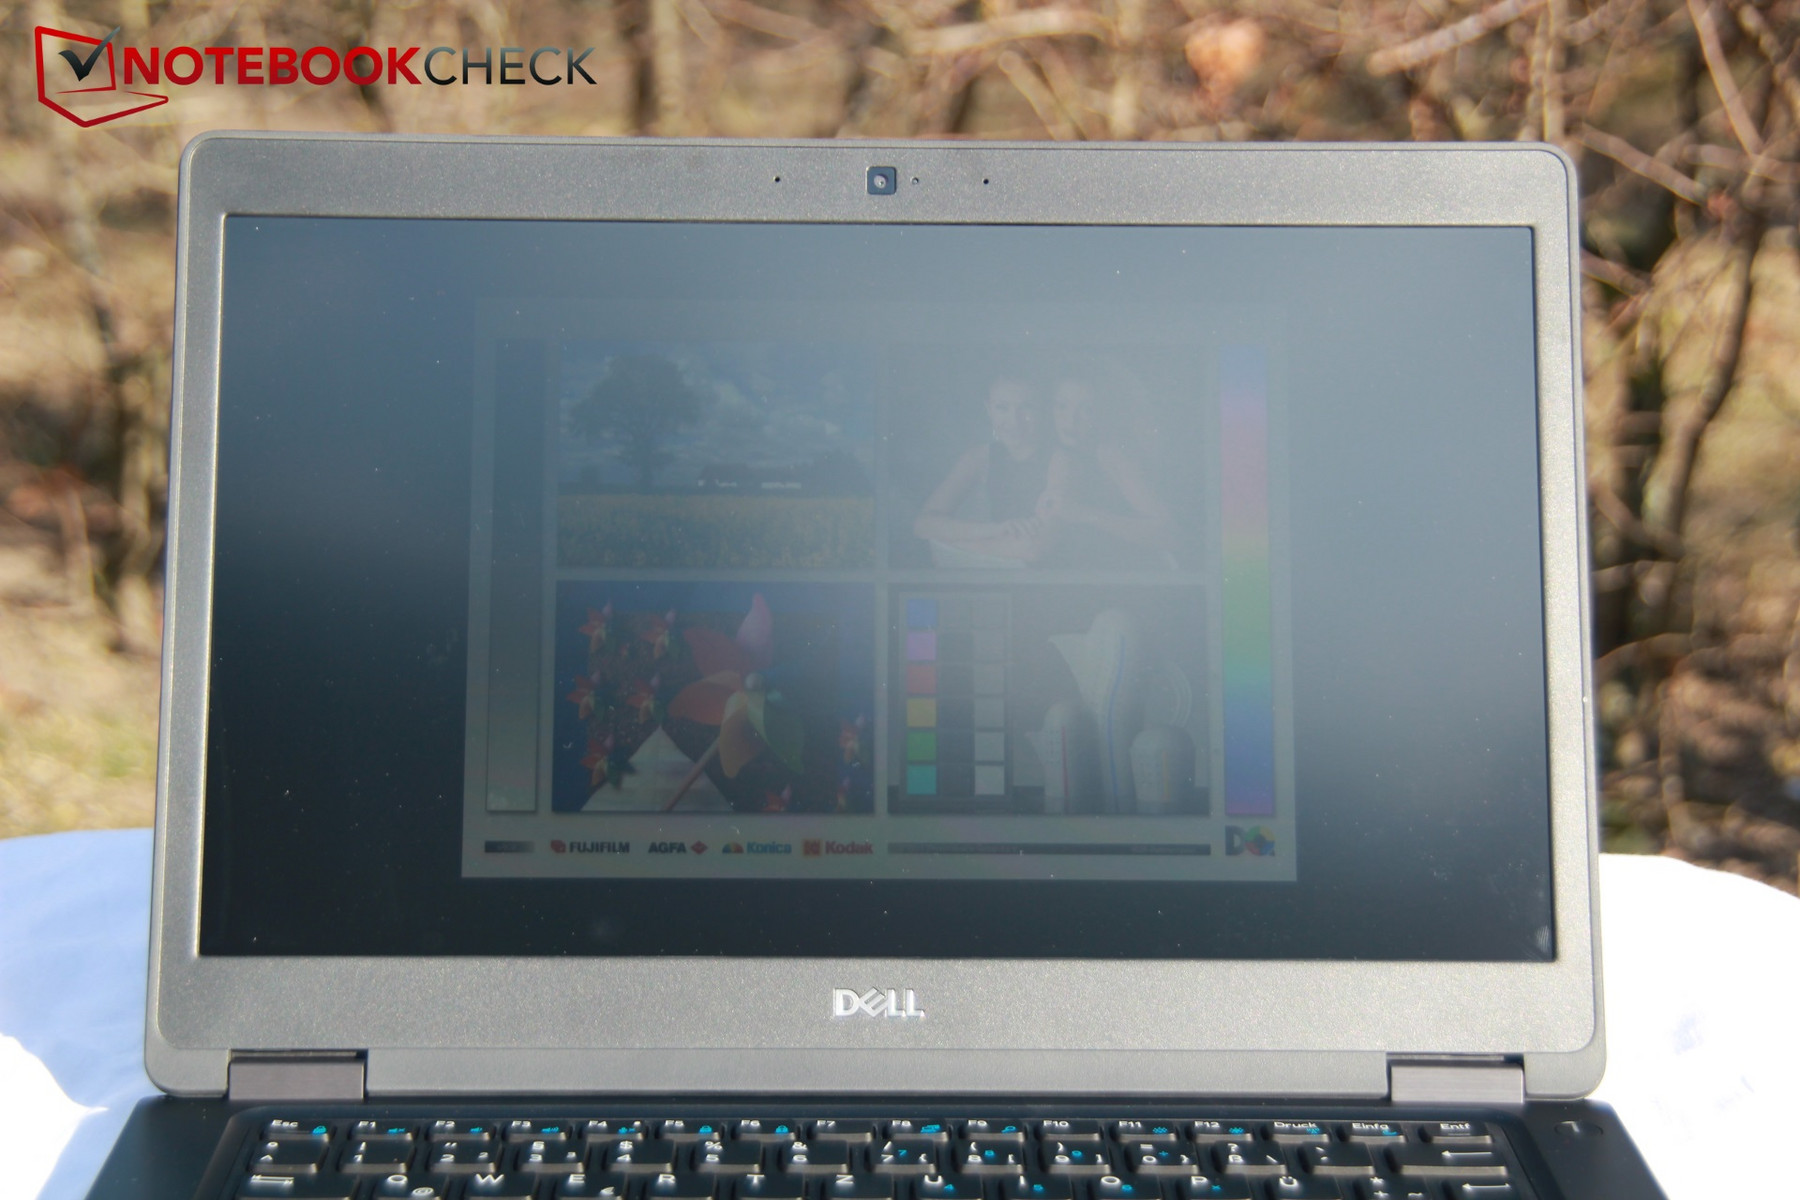
Good brightness, high contrast levels, and a matte surface are required when using a notebook outside. Especially in the first aspect, the Latitude 5490 fails. And, while the good contrast and black levels can compensate this slightly, it is not enough. Other devices are better suited for use under sunlight. If you want to get work done using the Dell, you may want to find a shaded spot.
All in all, it saddens us to see that, while Dell have put a lot of effort into mobile use cases with a long battery life, the display hampers that effort.
Display Response Times
| ↔ Response Time Black to White | ||
|---|---|---|
| 31.2 ms ... rise ↗ and fall ↘ combined | ↗ 18 ms rise | 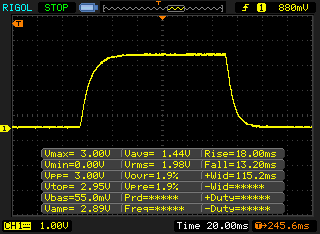 |
| ↘ 13.2 ms fall | ||
| The screen shows slow response rates in our tests and will be unsatisfactory for gamers. In comparison, all tested devices range from 0.1 (minimum) to 240 (maximum) ms. » 84 % of all devices are better. This means that the measured response time is worse than the average of all tested devices (20.3 ms). | ||
| ↔ Response Time 50% Grey to 80% Grey | ||
| 46.9 ms ... rise ↗ and fall ↘ combined | ↗ 23.6 ms rise | 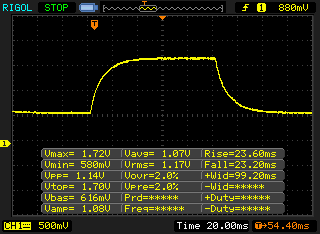 |
| ↘ 23.3 ms fall | ||
| The screen shows slow response rates in our tests and will be unsatisfactory for gamers. In comparison, all tested devices range from 0.165 (minimum) to 636 (maximum) ms. » 80 % of all devices are better. This means that the measured response time is worse than the average of all tested devices (31.7 ms). | ||
Screen Flickering / PWM (Pulse-Width Modulation)
| Screen flickering / PWM not detected |  | ||
In comparison: 53 % of all tested devices do not use PWM to dim the display. If PWM was detected, an average of 8152 (minimum: 5 - maximum: 343500) Hz was measured. | |||
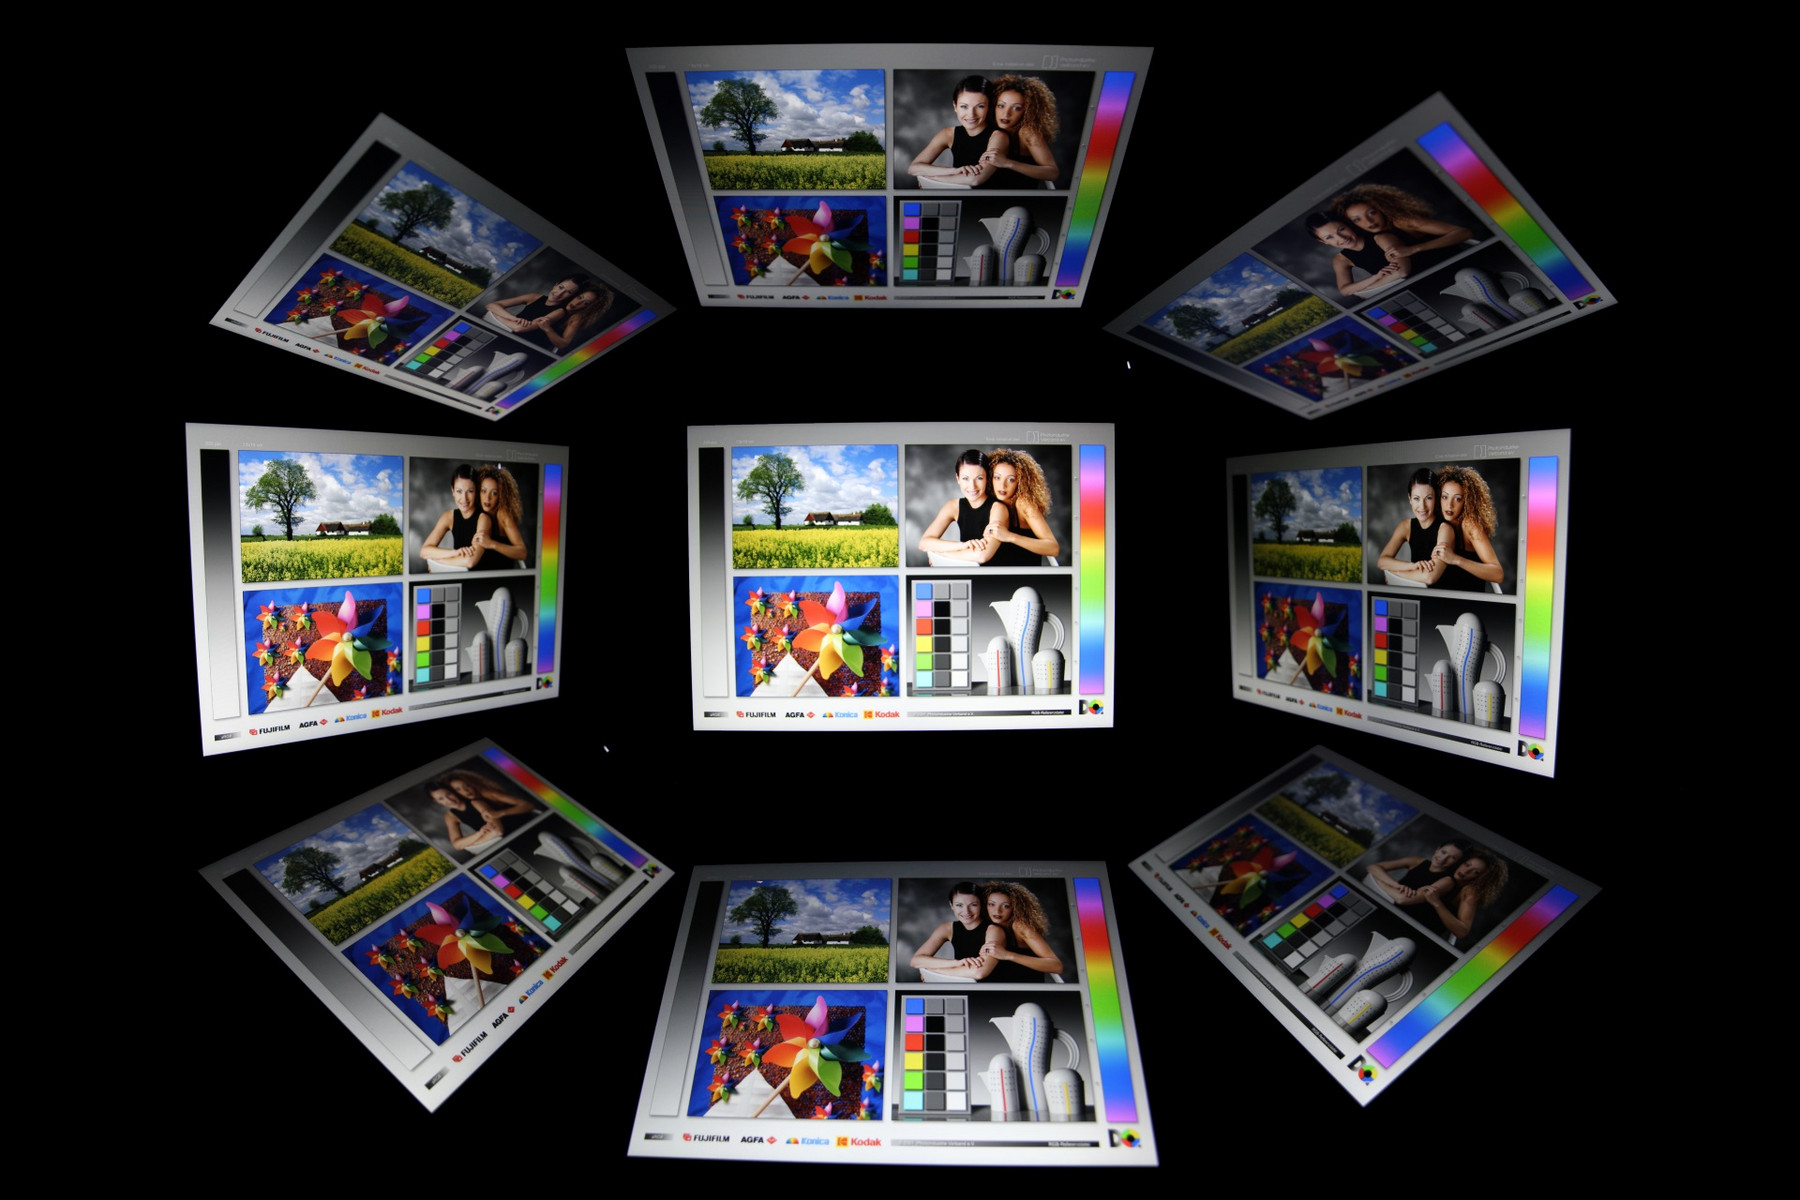
As is typical for IPS panels, the viewing angles are good. Slight discoloration is noticeable when viewing the display from the side. Furthermore, brightness deteriorates even more when looking at the display from some angles. Thus, viewing the screen from the optimal angle is important to make the most of the limited, available, brightness.
Performance
Looking at the specifications, Dell does have a good office notebook on offer. The processor found in the predecessor has been replaced by a newer, slightly faster model while retaining efficiency. The integrated GPU is practically unchanged from the last generation. The 8 GB of memory is enough for most use scenarios and an SSD is used for storage. On paper, these components should result in good performance, ideal for a business laptop.
We do have to mention at this point that a lot of mentioned components are actually optional. It should thus be noted that both higher and lower performance variants are available. The base model is equipped with a slightly slower i5-8250U, as well as a mechanical hard disk. There is also a model with only 4 GB of RAM is on offer. This means that our results may deviate from those you could experience, depending on the configuration.
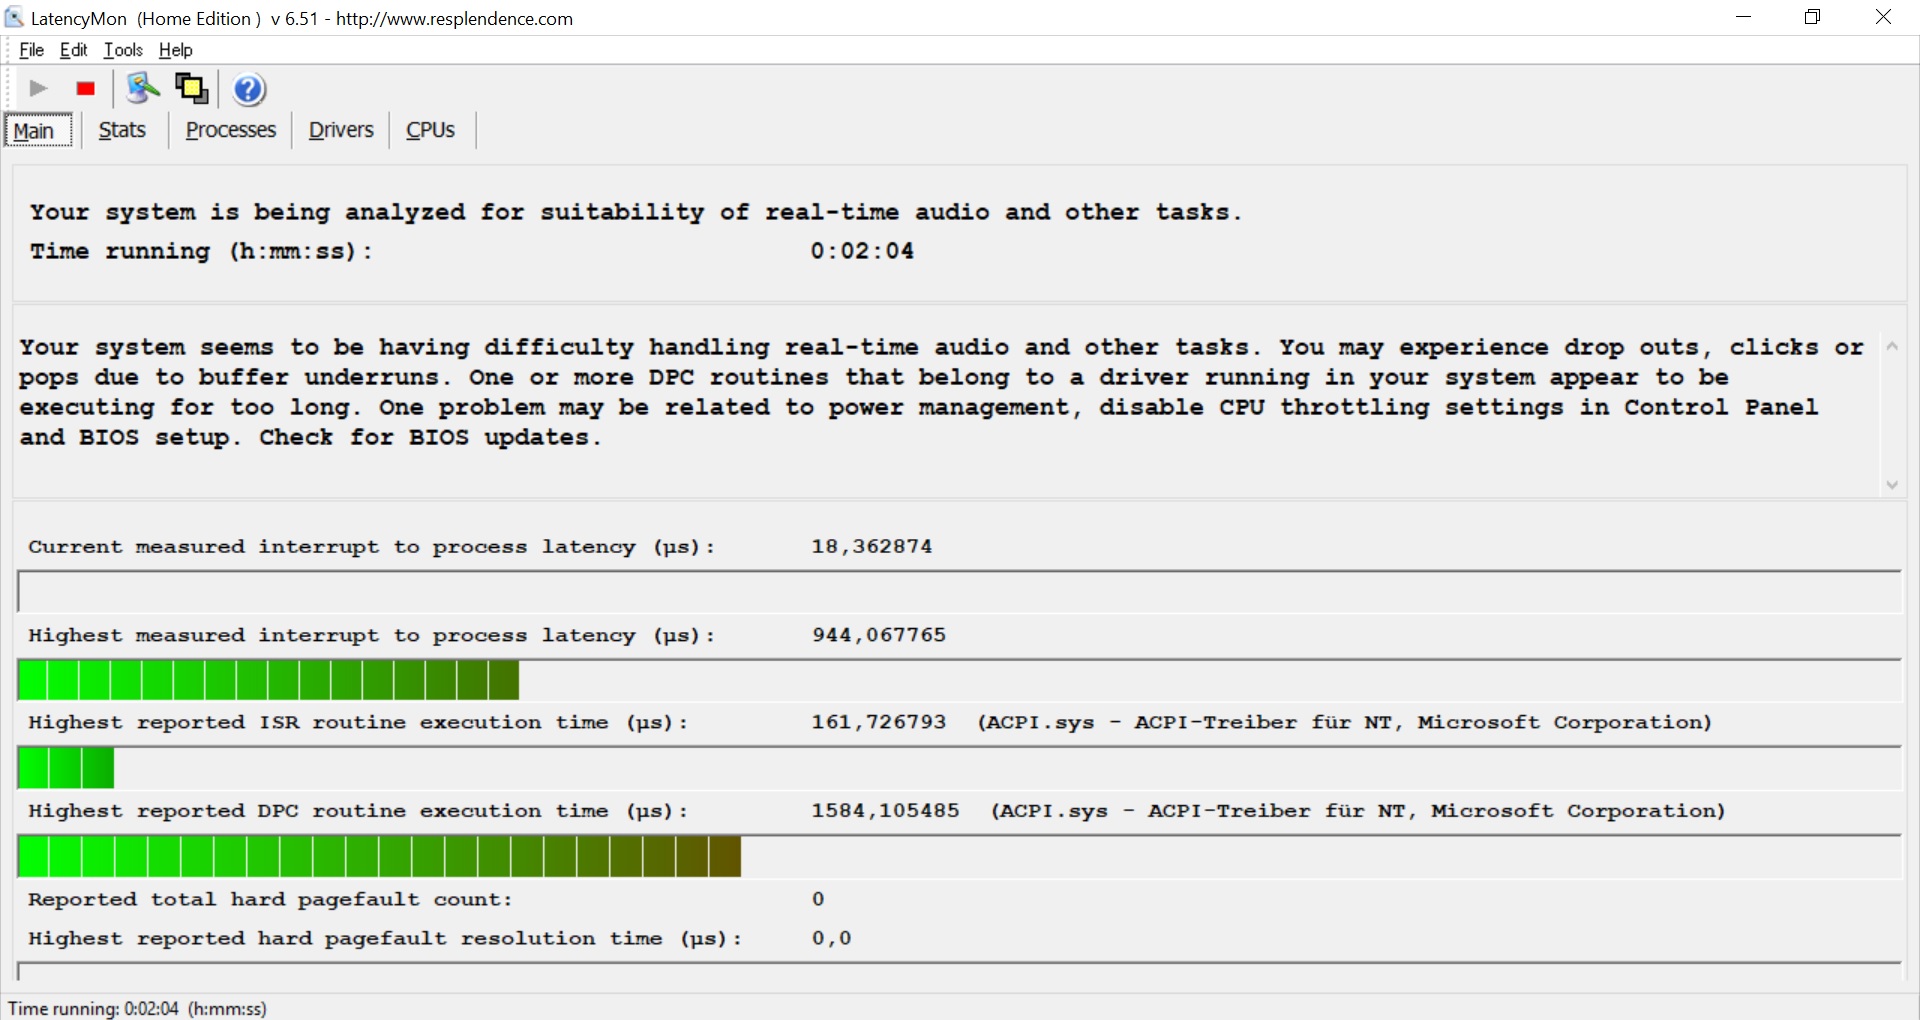
Unfortunately, we did notice latency when testing the hardware. LatencyMon tool assesses that the notebook may have difficulties processing audio files in real time. This may lead to dropouts and buffer underruns. The culprit for this is probably an excessively long DPC routine employed by a driver. Our device used the latest software updates available and therefore, Dell has to make improvements in this area. Deactivating the wireless module did not resolve the issues either.


Processor
The CPU in our device is an Intel Core i5-8350U. It is very efficient and should be suited for most business tasks, being part of the Kaby-Lake refresh and offering four cores with hyperthreading. The Latitude 5480 contained an i7-7600U, having only two hyperthreaded cores. This enables the new processor to tackle twice the threads at the same time. However, clock speeds have been decreased (3.6 GHz vs 3.9 GHz) slightly as a trade-off.
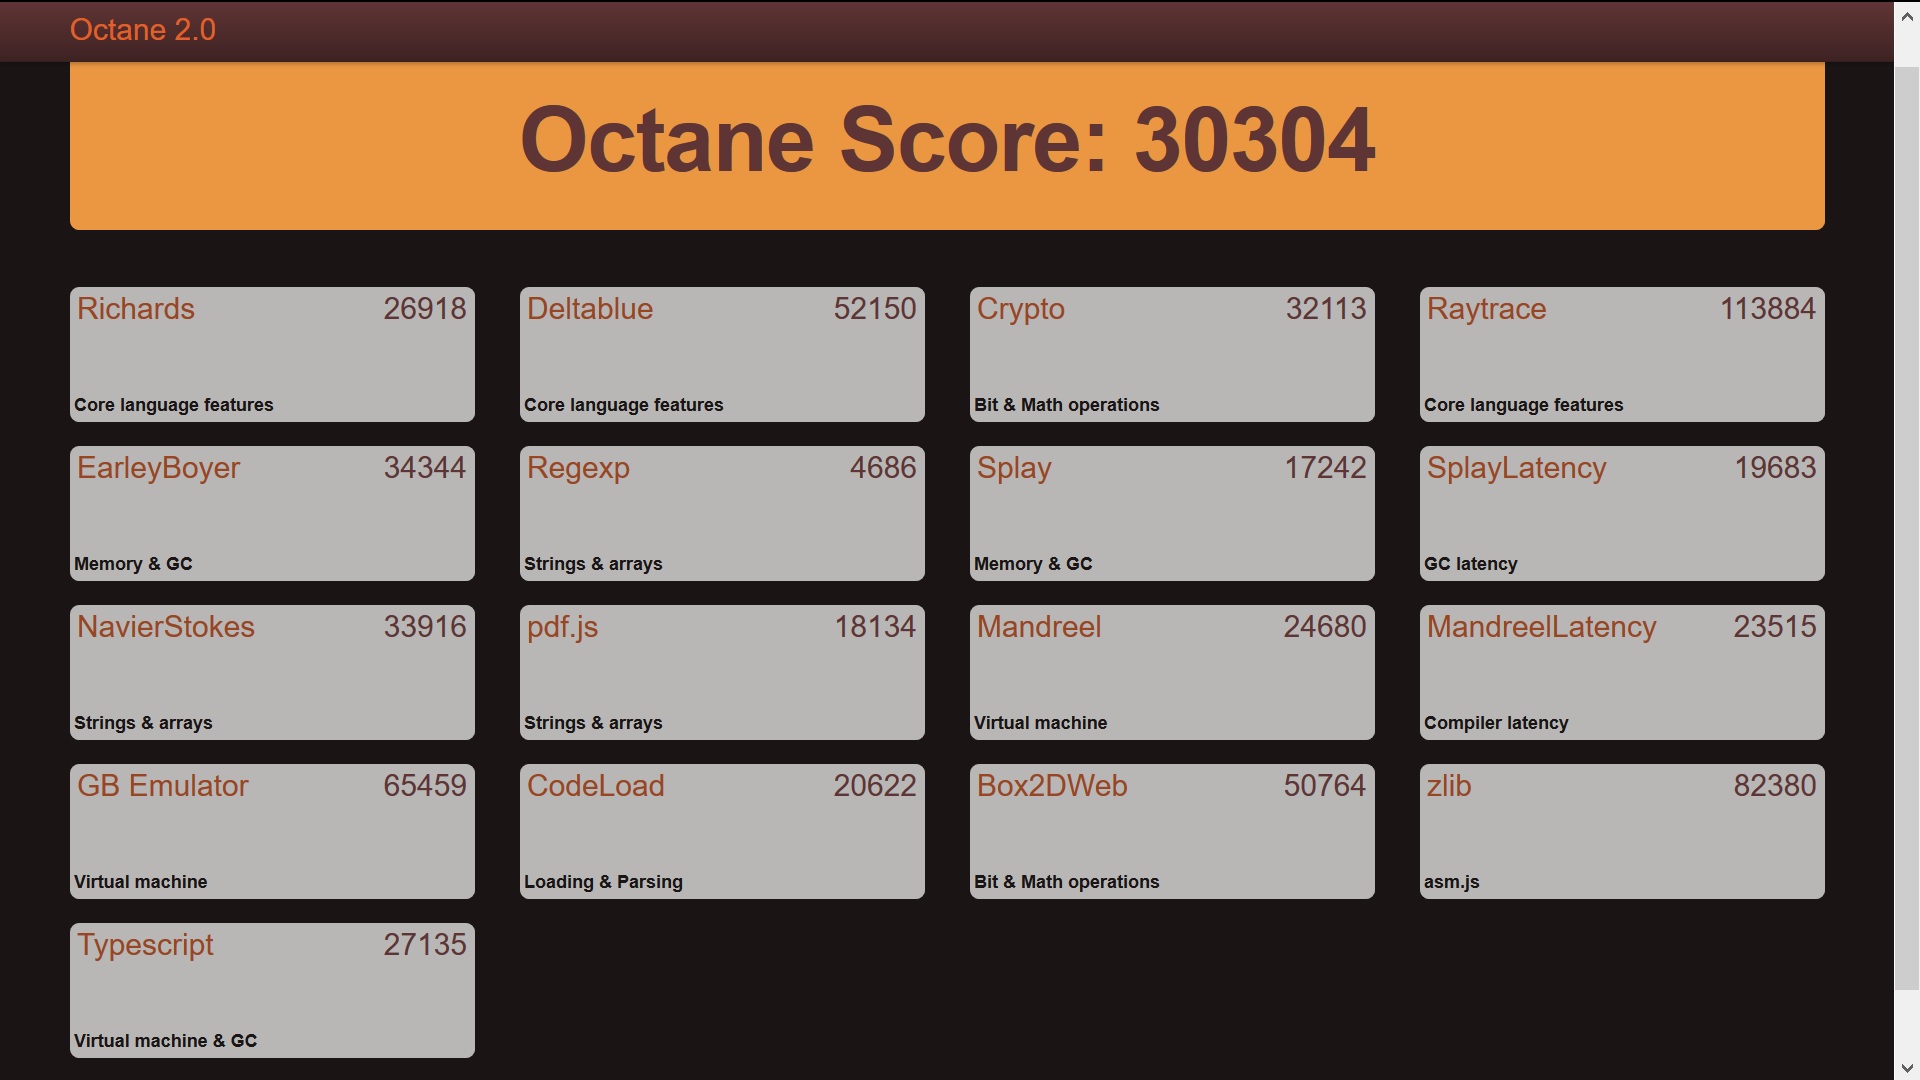
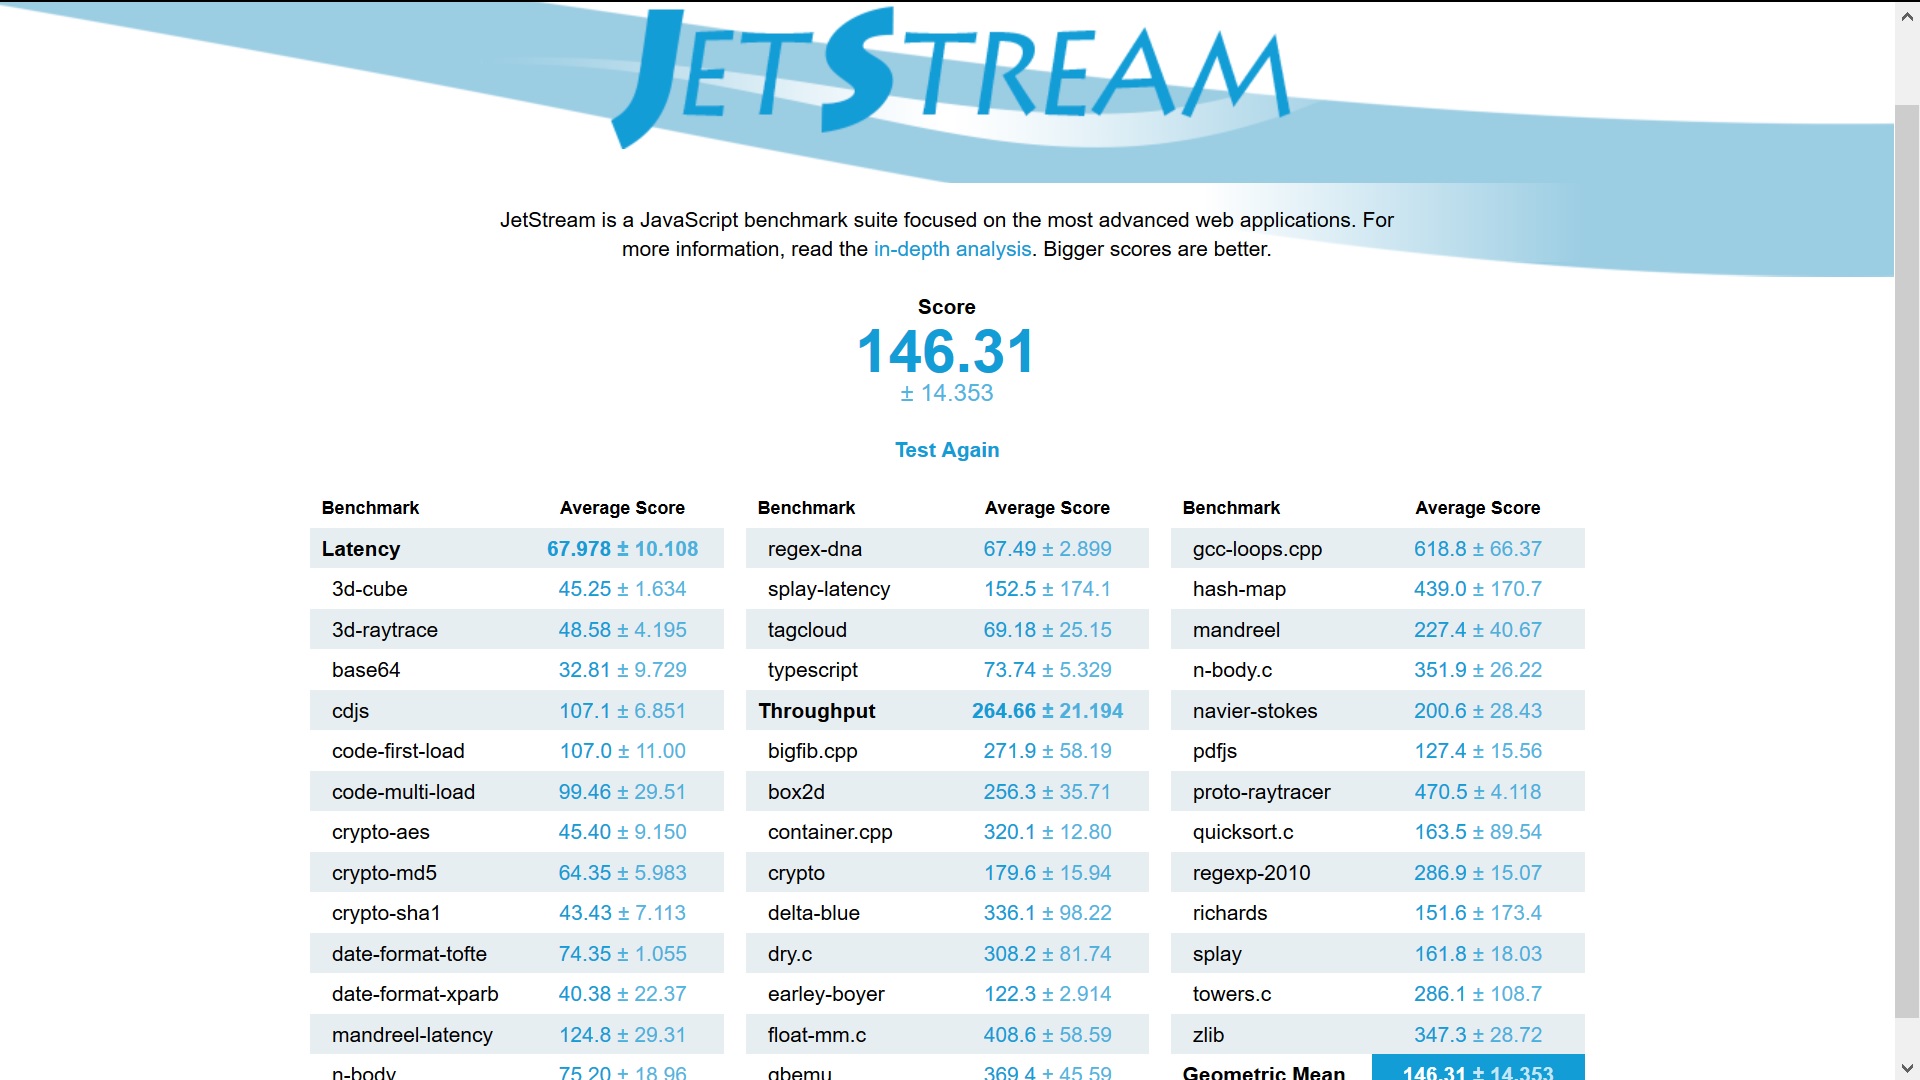
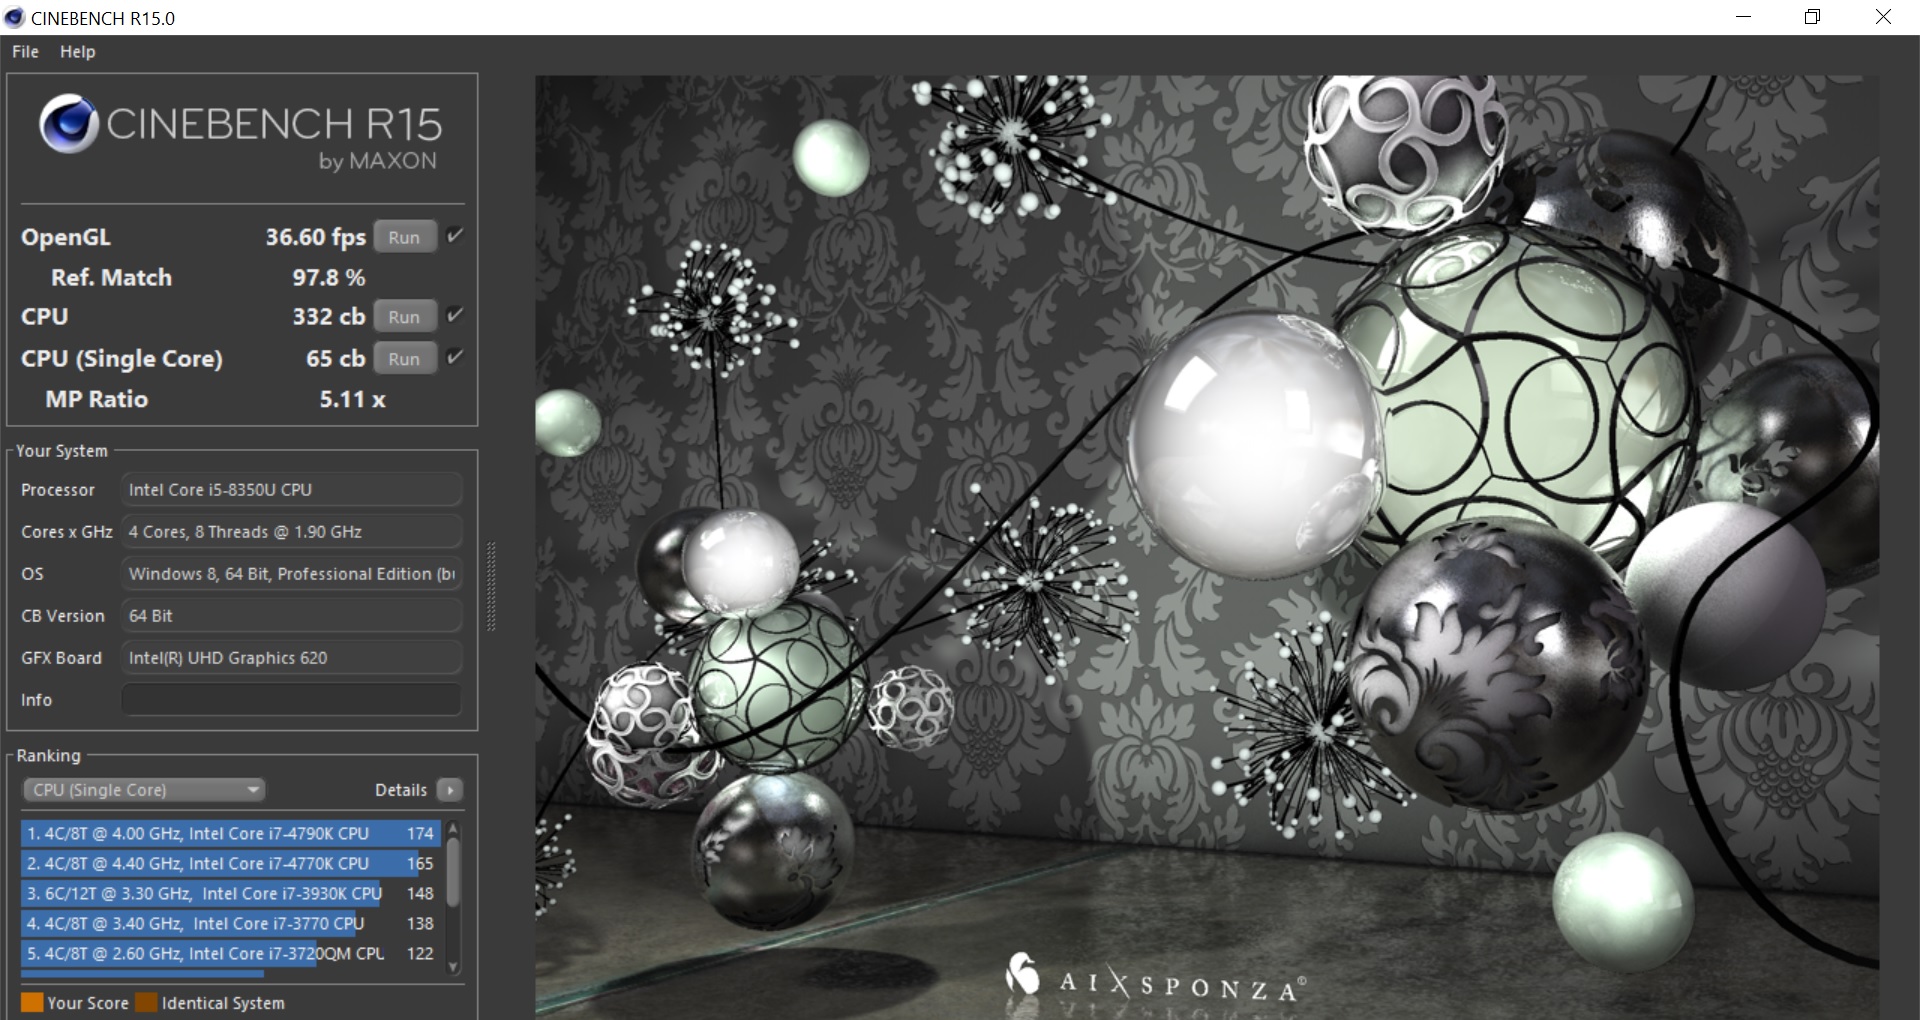
Looking at our Cinebench graph below, one can see that performance decreases quite sharply after the first run, decreasing continuously the longer the benchmark continues. The system is being throttled, the potential turbo is used less and less. One reason for this is that the power limit only permits maximum turbo for 28 seconds before restricting energy consumption to 25 W, limiting the processor to a theoretical 2.8-2.9 GHz. The difference is however not as problematic as the graph may make it appear, the notebook only loses about 6% in performance.
When relying on the battery, this difference widens of course. Once the 5490 gets unplugged, our multicore results decreased by about 45% and the single core results by 55%. Massive throttling is the case.
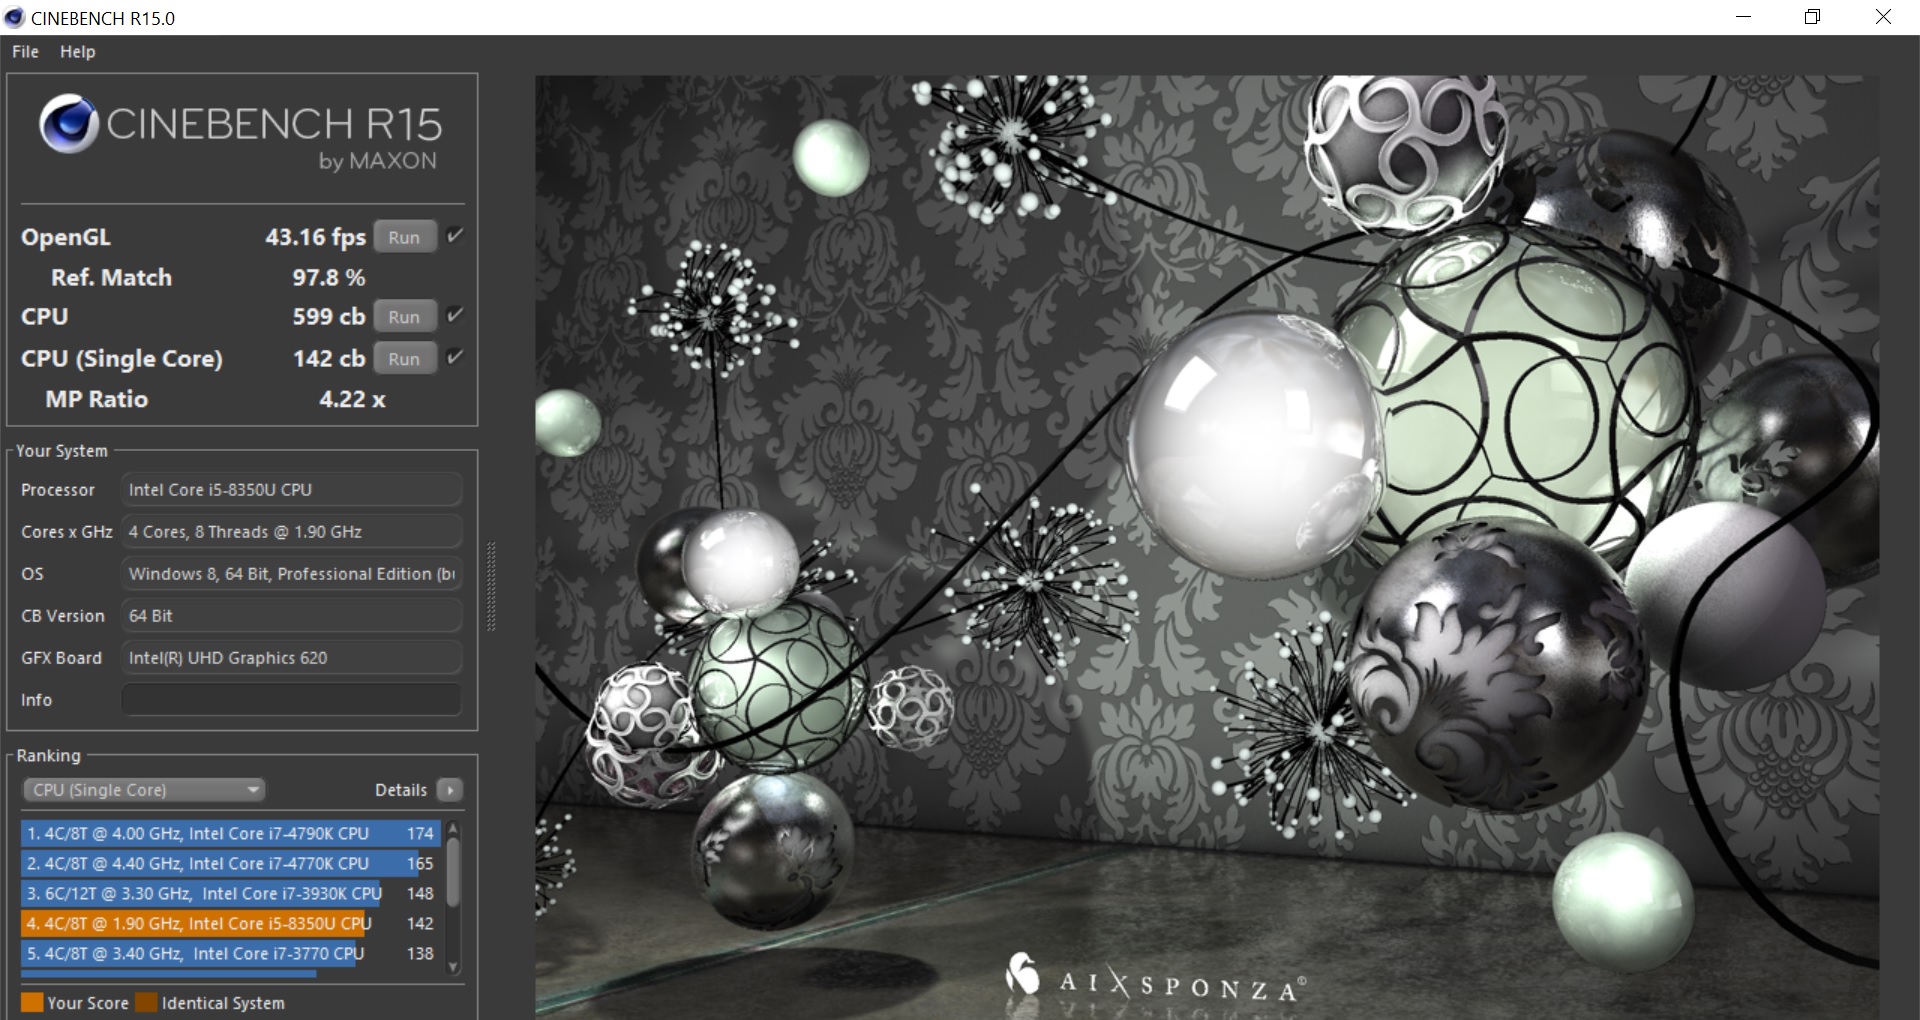
When compared to rivals, the performance is what one would expect. In single core testing, even its predecessor gets better results, thanks to its higher clock speed. The 5490 however, manages second place with the Acer in this category. Multi-core testing puts the 5490 right on top, the previous generation, as well as rivals, follow with 41-46% worse results. It can be concluded that overall, the performance is on a good level. Looking at the results from the older Cinebench R11.5, we get a similar picture: If the result is heavily linked to frequency, the predecessor edges out by a 15% lead, if multi-core performance is the focus, the 5490 manages to stay 46-50% ahead of the competition.
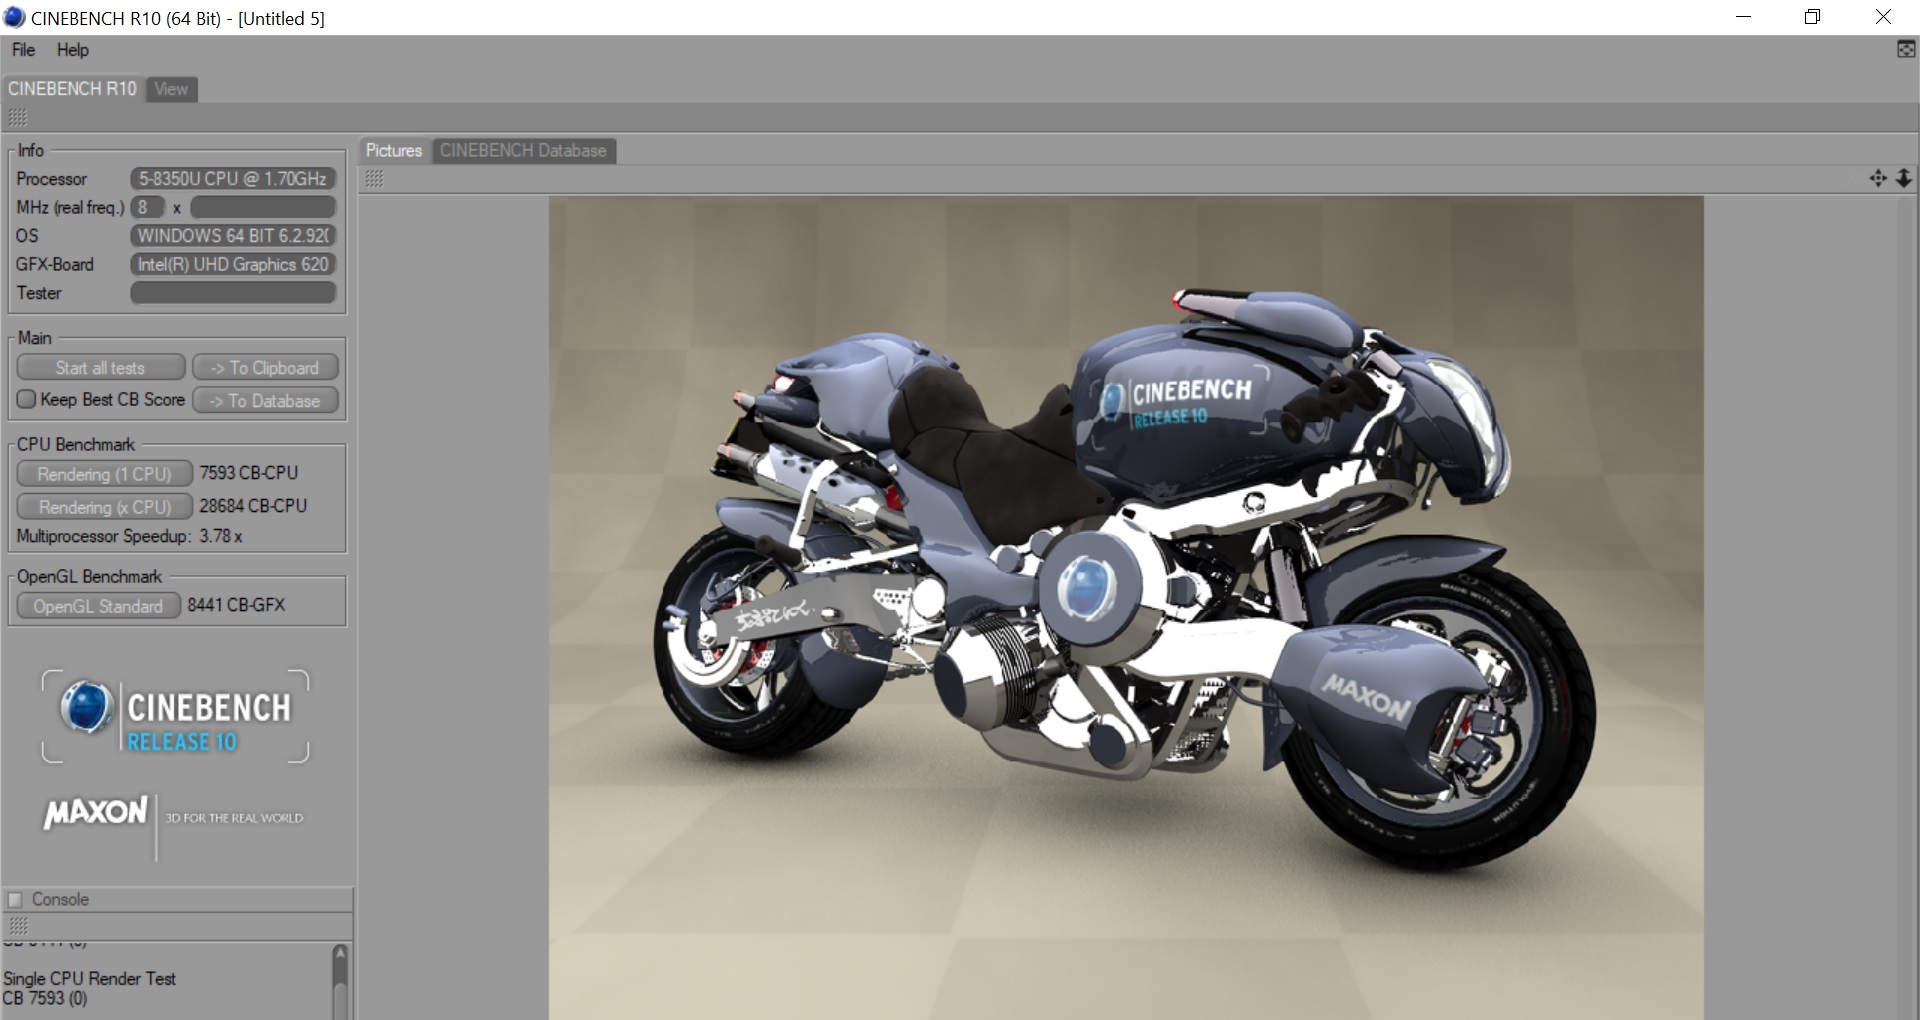

| Cinebench R10 | |
| Rendering Single CPUs 64Bit | |
| Average of class Office (8648 - 15443, n=7, last 2 years) | |
| Dell Latitude 5490-TD70X | |
| Average Intel Core i5-8350U (n=1) | |
| Rendering Multiple CPUs 64Bit | |
| Average of class Office (40726 - 76704, n=7, last 2 years) | |
| Dell Latitude 5490-TD70X | |
| Average Intel Core i5-8350U (n=1) | |
System Performance
To assess system performance, we look at PCMark 8's home and work-score. The Latitude 5490 does get respectable results in both, but the predecessor achieved better results. Either the higher processor frequency or other factors such as the employed SSD lead to the new Latitude managing only second place.
The Latitude is equipped to handle day to day usage, office software and web browsing are fluent and do not suffer from delays.
| PCMark 8 Home Score Accelerated v2 | 3695 points | |
| PCMark 8 Work Score Accelerated v2 | 4774 points | |
Help | ||
Storage
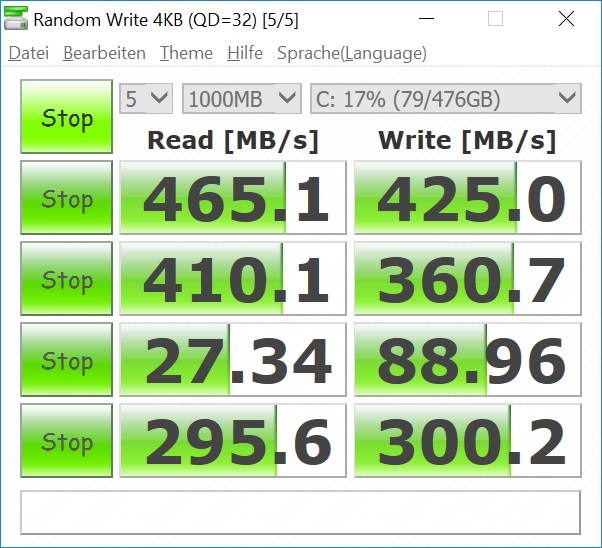
In terms of storage, the notebook is equipped with a 512 GB SSD from Toshiba. Both Windows 10 and a few Dell specific programs come preinstalled, leading to 450 GB of usable disk space.
The M.2-2280 SSD is connected via SATA-III, leading to comparatively low transfer speeds. The SSDs found in the offerings by HP and Lenovo are connected via NVMe, leading to much better performance, the Latitude is only average. Equally average was the SSD found in the previous generation and the Acer while the Fujitsu is just marginally faster. The performance differences compared to the almost twice as fast offerings from HP and Lenovo are noticeable during benchmarking. However, during normal usage, this should not be noticeable unless one often transfers a large amount of data. Additional information may be found in our HDD/SSD-Benchmark table.
As the predecessor does not indeed utilize a vastly superior SSD, the worse result in PCMark 8 is not likely to be connected to this.
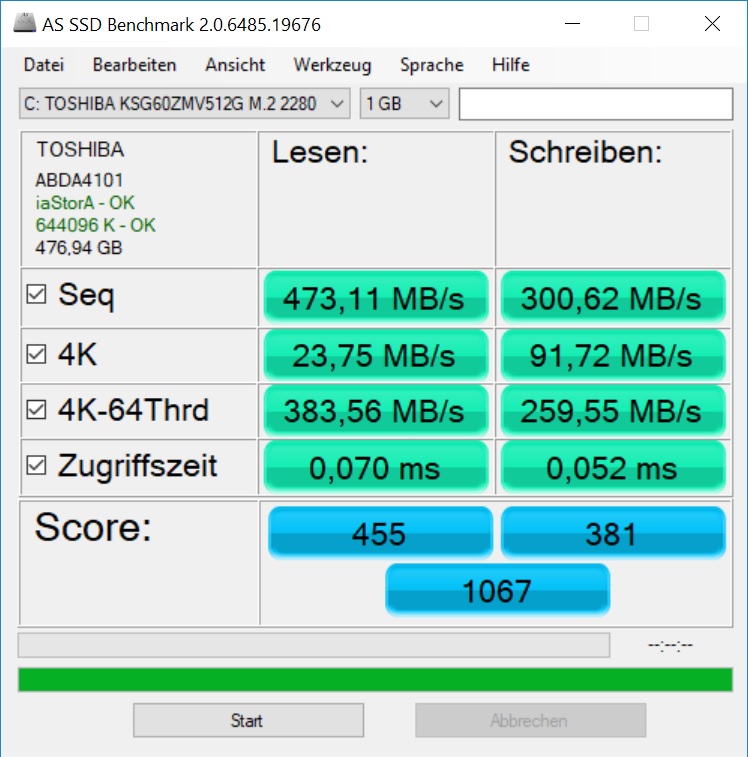

| Dell Latitude 5490-TD70X Toshiba KSG60ZMV512G | Dell Latitude 5480 Toshiba SG5 256GB THNSNK256GVN8 | HP EliteBook 840 G4-Z2V49ET ABD Samsung PM961 MZVLW256HEHP | Acer TravelMate P648-G2-M-73T0 SK Hynix HFS256G39TND-N210A | Lenovo ThinkPad T470-20HD002HGE Samsung PM961 NVMe MZVLW512HMJP | Fujitsu LifeBook U747 Samsung MZYTY256HDHP | |
|---|---|---|---|---|---|---|
| CrystalDiskMark 3.0 | -6% | 131% | 1% | 100% | 6% | |
| Read Seq (MB/s) | 465.1 | 469.4 1% | 1819 291% | 518 11% | 1155 148% | 504 8% |
| Write Seq (MB/s) | 425 | 264.8 -38% | 1263 197% | 267.2 -37% | 1076 153% | 497.8 17% |
| Read 512 (MB/s) | 410.1 | 408.1 0% | 922 125% | 562 37% | 811 98% | 396.7 -3% |
| Write 512 (MB/s) | 360.7 | 265.5 -26% | 804 123% | 263.5 -27% | 862 139% | 283.4 -21% |
| Read 4k (MB/s) | 27.34 | 24.66 -10% | 61.4 125% | 32.88 20% | 55.5 103% | 35.73 31% |
| Write 4k (MB/s) | 89 | 114.8 29% | 157.1 77% | 85.6 -4% | 134.6 51% | 87.8 -1% |
| Read 4k QD32 (MB/s) | 295.6 | 380.3 29% | 513 74% | 351.3 19% | 496.2 68% | 399.1 35% |
| Write 4k QD32 (MB/s) | 300.2 | 207.2 -31% | 410.2 37% | 265.2 -12% | 425.4 42% | 249.7 -17% |

GPU
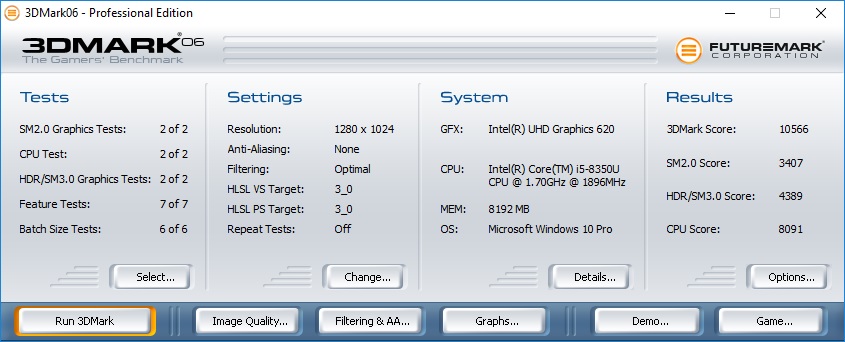
Our configuration of the Latitude 5490 does not come with a dedicated GPU. An optional GeForce 930MX is available, however. Graphically intensive tasks are handled by an Intel UHD Graphics 620 in our test model. This integrated graphics unit is at best suited for light gaming at lower resolutions, though this is not really a use case for the Latitude 5490 anyway. The unit should suffice for occasional rendering or other graphics focused workloads.
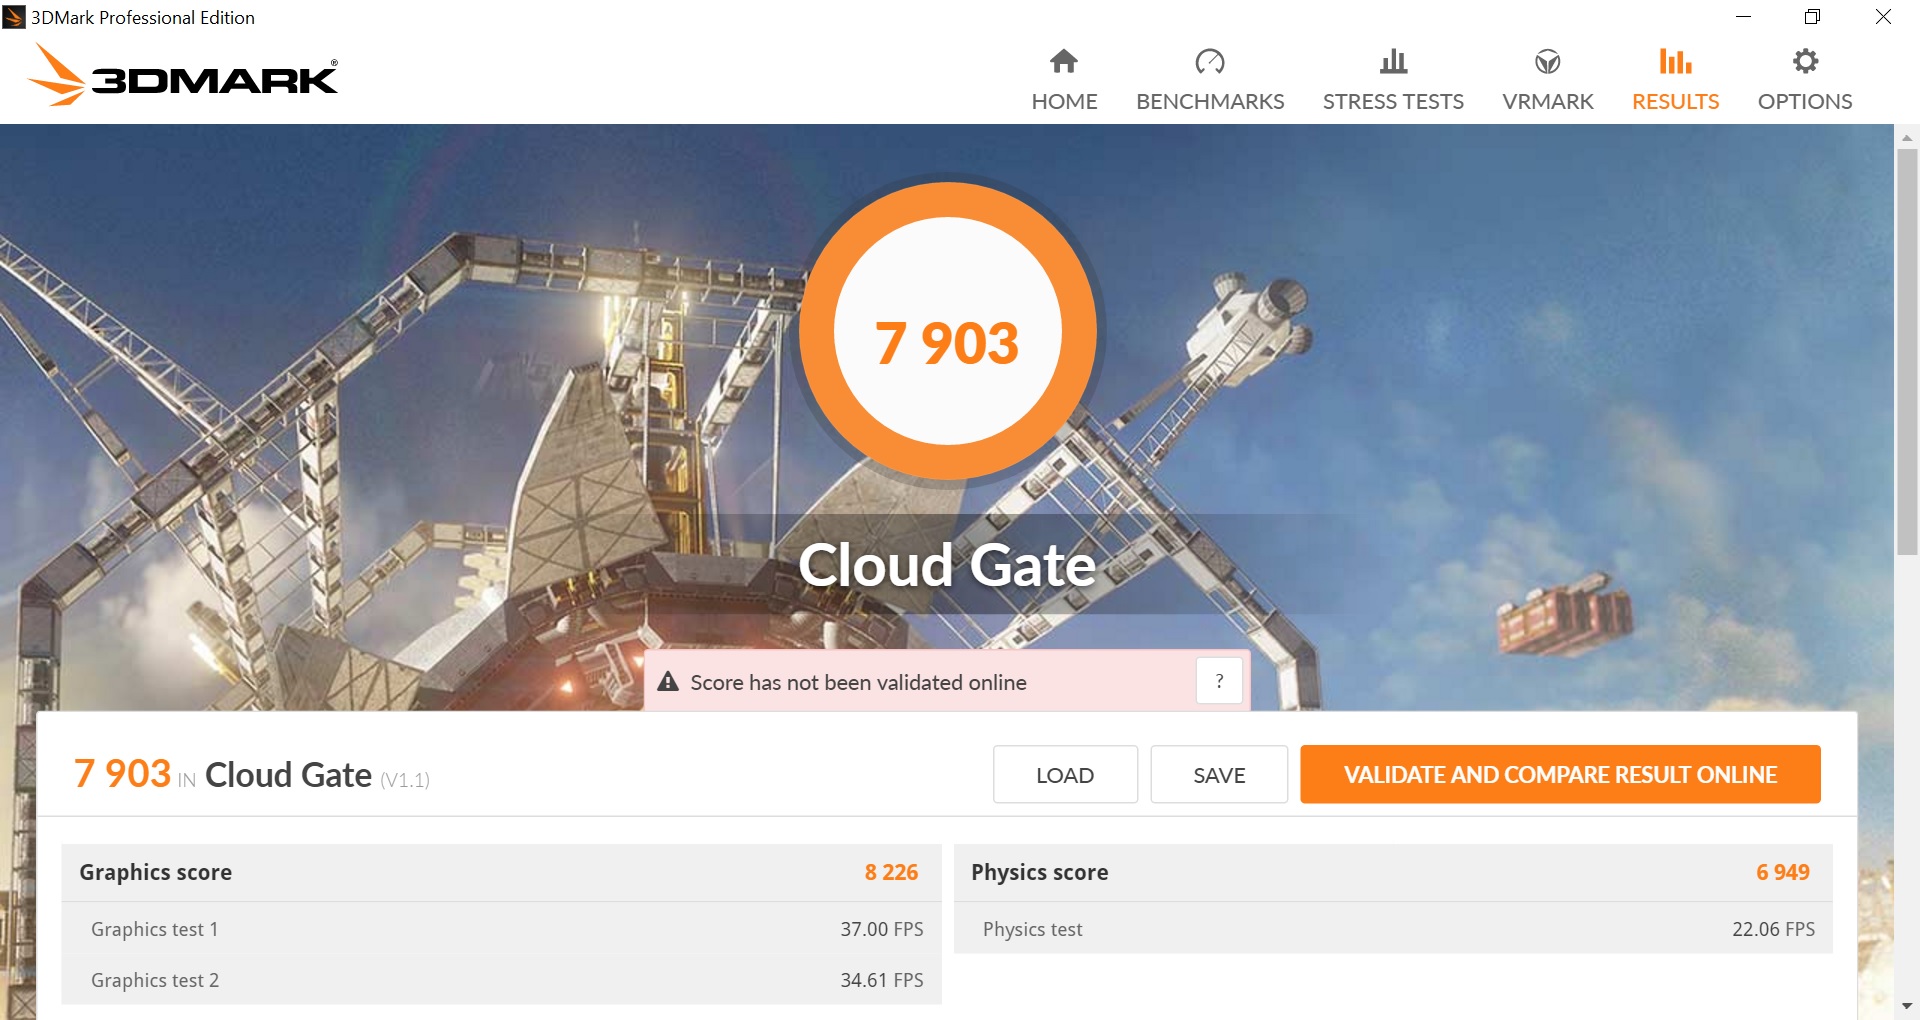
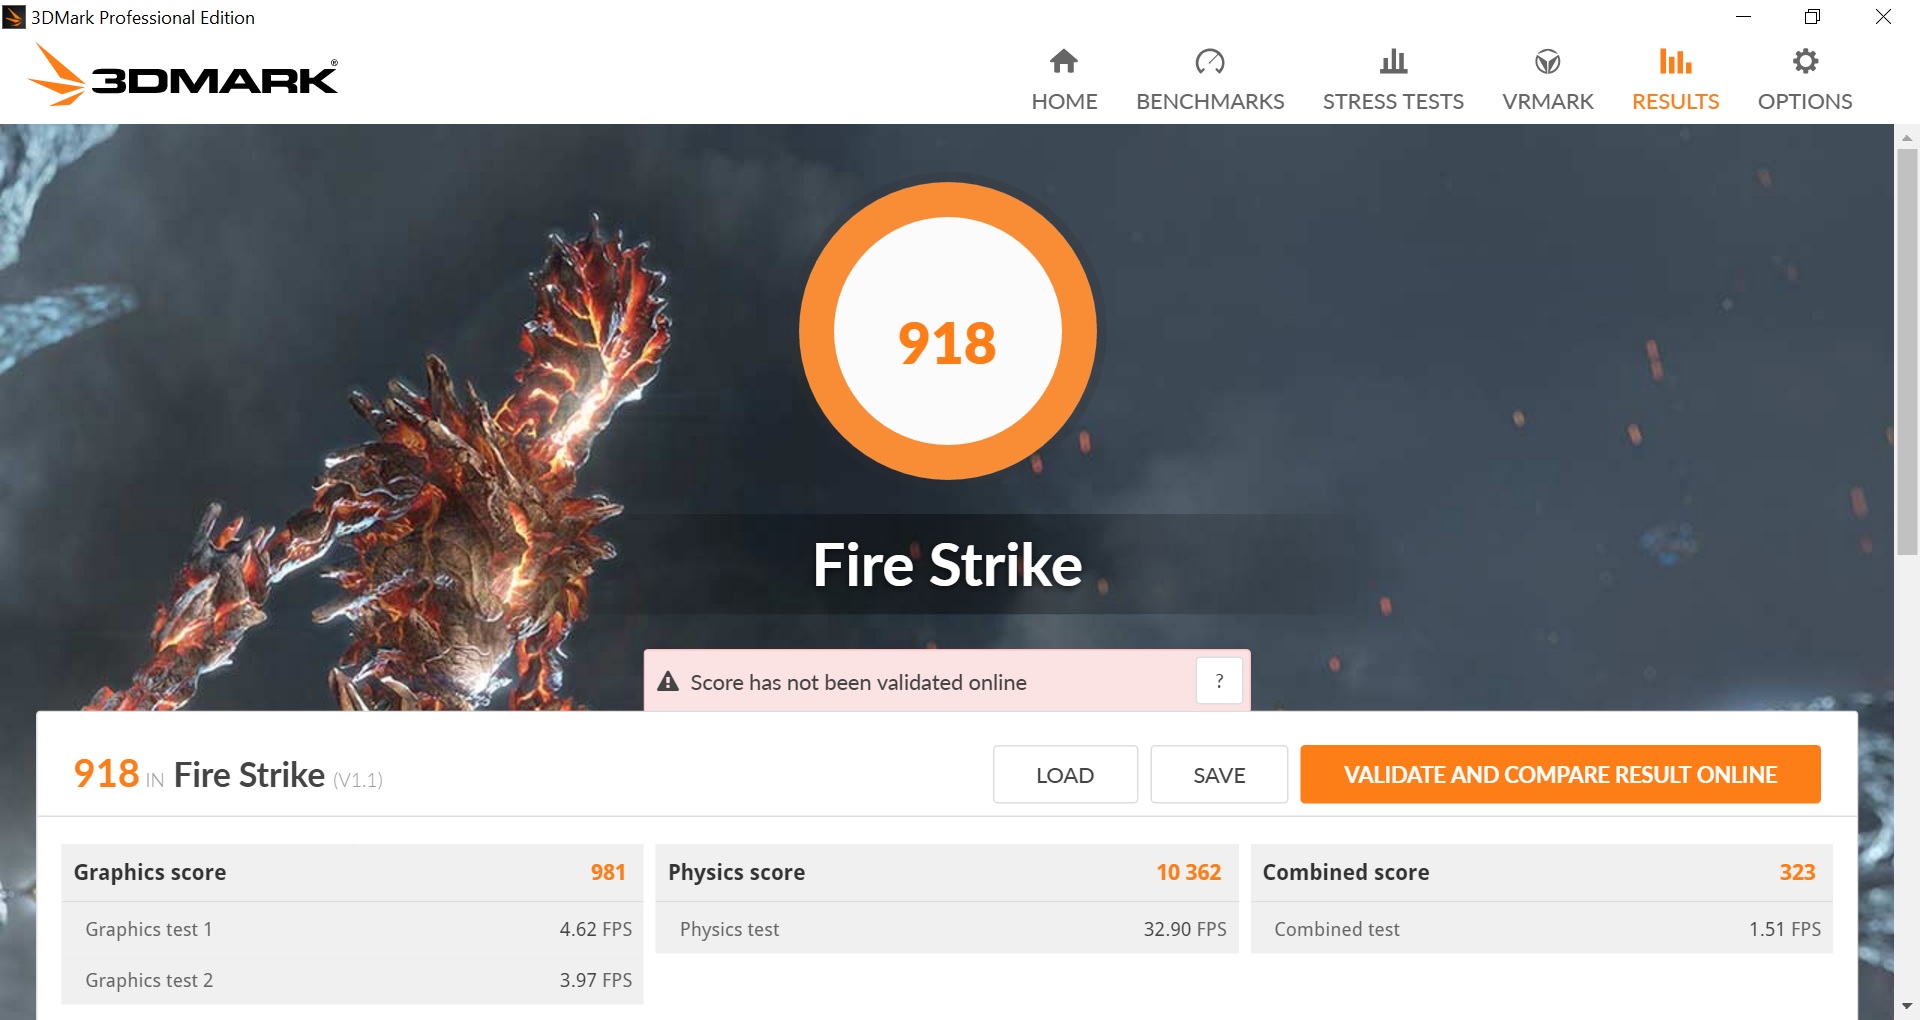
During testing with 3DMark 2011 and 2013, the Latitude 5490 achieved admirable results, although it is beaten in all areas by the "old" Latitude 5480. All other notebooks in our line up are beaten by 4-6%. The minimally higher results of the predecessor may be linked to its dual-channel memory configuration. Utilizing the second RAM slot should improve GPU performance slightly in the 5490.
When relying on the battery, GPU benchmark results are reduced by about 10%.
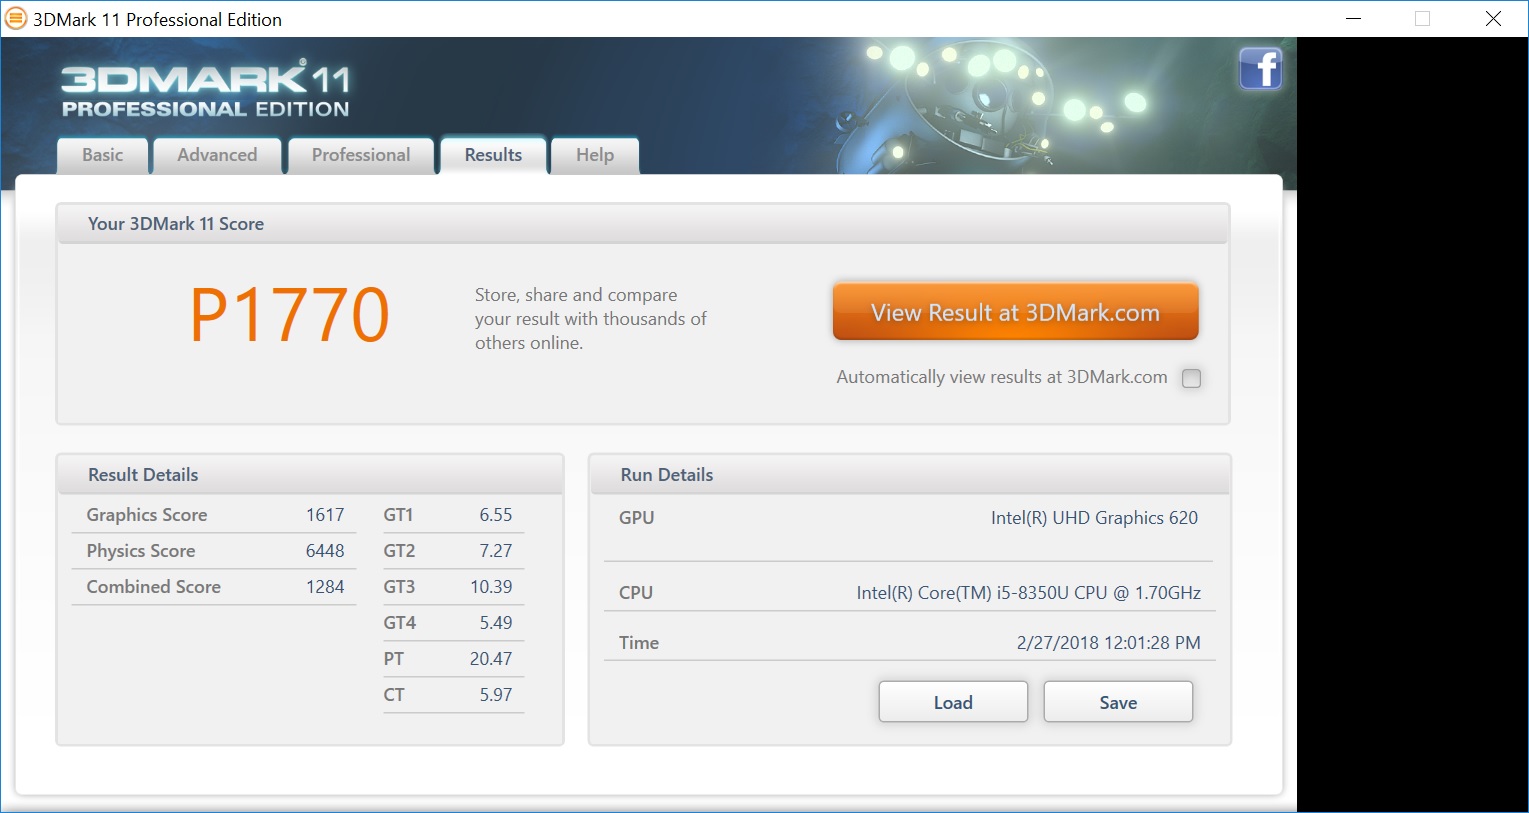
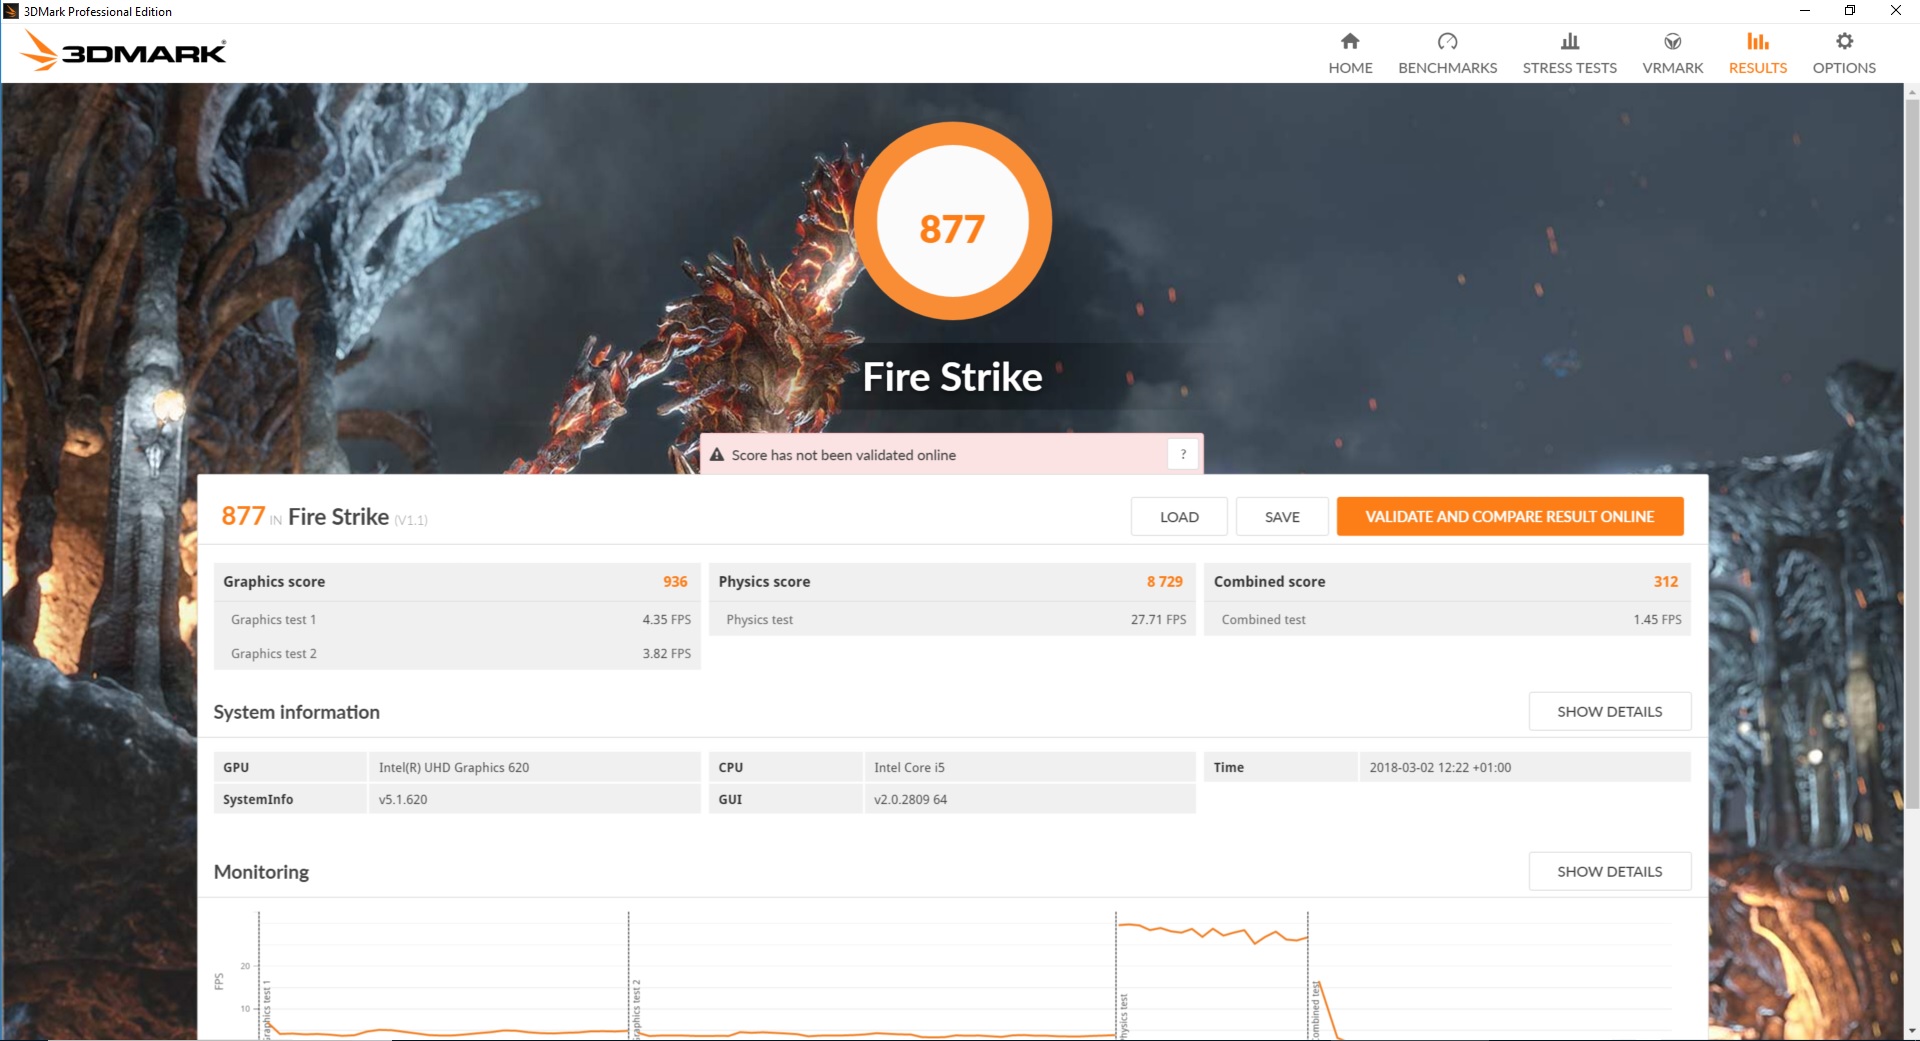
| 3DMark 11 Performance | 1770 points | |
| 3DMark Cloud Gate Standard Score | 7903 points | |
| 3DMark Fire Strike Score | 918 points | |
Help | ||
Gaming Performance
Gaming is usually not something business notebooks focus on and with no dedicated GPU, the 5490 is at best capable of light gaming with low settings and resolution. In "Rise of the Tomb Raider" for example, it manages only 18 FPS, even on the lowest settings.
"The Witcher 3" shows similar results. With 15 FPS on the lowest possible settings, it is unplayable.
The less demanding "Rocket League" is a slightly different story. A quick session in between work is possible, though only when dialling down the settings. At Full HD however, the game again becomes unplayable, even when reducing the settings as far as possible.
| low | med. | high | ultra | |
|---|---|---|---|---|
| The Witcher 3 (2015) | 14.61 | 9.63 | ||
| Rise of the Tomb Raider (2016) | 18.68 | 11.1 | 5.5 | |
| Rocket League (2017) | 57.4 | 21.47 | 15.01 |
An in-depth comparison with the alternatives seems not to be necessary, as none of them offer significant graphical performance. Differences are insignificant and most games are hardly, if at all, playable.
"Rise of the Tomb Raider" gives the Latitude a one frame (as in 1) lead over the Lenovo, Acer, and Fujitsu on the lowest settings. Bumping the settings up to medium, the Lenovo managed a slight lead. Due to the pointlessness of the exercise, we did not try the game on higher settings.
In "The Witcher 3", the Dell edges out a 10-13% lead over the offerings from Lenovo and HP. The game is, however, in an unplayable state on all devices.
We concluded that gaming without a dedicated GPU is rarely, if at all possible in current times. This should however not be of grave concern on a business laptop. Adding to that, casual gamers with low expectations may not find the limited performance too troublesome.
| Rise of the Tomb Raider | |
| 1024x768 Lowest Preset | |
| Average Intel UHD Graphics 620 (10.4 - 110.7, n=82) | |
| Dell Latitude 5490-TD70X | |
| Lenovo ThinkPad T470-20HD002HGE | |
| Acer TravelMate P648-G2-M-73T0 | |
| Fujitsu LifeBook U747 | |
| 1366x768 Medium Preset AF:2x | |
| Average Intel UHD Graphics 620 (6.5 - 49.3, n=62) | |
| Lenovo ThinkPad T470-20HD002HGE | |
| Dell Latitude 5490-TD70X | |
| Acer TravelMate P648-G2-M-73T0 | |
| 1920x1080 High Preset AA:FX AF:4x | |
| Average Intel UHD Graphics 620 (4.9 - 32, n=42) | |
| Dell Latitude 5490-TD70X | |
| Acer TravelMate P648-G2-M-73T0 | |
| Rocket League | |
| 1280x720 Performance | |
| Average Intel UHD Graphics 620 (20.1 - 95, n=26) | |
| Dell Latitude 5490-TD70X | |
| 1920x1080 Performance | |
| Average Intel UHD Graphics 620 (17.1 - 78.4, n=13) | |
| Dell Latitude 5490-TD70X | |
| 1920x1080 Quality AA:Medium FX | |
| Average Intel UHD Graphics 620 (13.1 - 43, n=24) | |
| Dell Latitude 5490-TD70X | |
| 1920x1080 High Quality AA:High FX | |
| Average Intel UHD Graphics 620 (13.2 - 24.7, n=21) | |
| Dell Latitude 5490-TD70X | |
| The Witcher 3 | |
| 1024x768 Low Graphics & Postprocessing | |
| Average of class Office (16 - 177, n=20, last 2 years) | |
| Average Intel UHD Graphics 620 (8.8 - 50.9, n=64) | |
| Dell Latitude 5490-TD70X | |
| Lenovo ThinkPad T470-20HD002HGE | |
| HP EliteBook 840 G4-Z2V49ET ABD | |
| 1366x768 Medium Graphics & Postprocessing | |
| Average of class Office (12 - 106.3, n=20, last 2 years) | |
| Average Intel UHD Graphics 620 (8 - 27.9, n=29) | |
| Dell Latitude 5490-TD70X | |
Emissions
System noise
The Latitude 5490 remains basically silent while idling, the fans rarely spin up. This changes, however, when under load. The device is not excessively loud under moderate load, although slightly noisier than the other competitors. Under full load, however, the fans spin up quite drastically, making the 5490 the loudest device in our comparison. Still, compared to its predecessor, which became eerily loud under full load, there have been significant improvements. The fans remain at high speed for quite a long time after closing a performance demanding application.
Aside from that, we did not notice any other noises emitted from the device. The sound emitted by the fan, however, can be quite taxing for some. During normal office operation, however, the fans rarely spin up.
| Dell Latitude 5490-TD70X UHD Graphics 620, i5-8350U, Toshiba KSG60ZMV512G | Dell Latitude 5480 HD Graphics 620, i7-7600U, Toshiba SG5 256GB THNSNK256GVN8 | HP EliteBook 840 G4-Z2V49ET ABD HD Graphics 620, i5-7200U, Samsung PM961 MZVLW256HEHP | Acer TravelMate P648-G2-M-73T0 HD Graphics 620, i7-7500U, SK Hynix HFS256G39TND-N210A | Lenovo ThinkPad T470-20HD002HGE HD Graphics 620, i5-7200U, Samsung PM961 NVMe MZVLW512HMJP | Fujitsu LifeBook U747 HD Graphics 620, i5-7200U, Samsung MZYTY256HDHP | |
|---|---|---|---|---|---|---|
| Noise | -7% | 0% | 1% | 7% | 8% | |
| off / environment * (dB) | 28.8 | 31 -8% | 30.6 -6% | 28 3% | 28.2 2% | |
| Idle Minimum * (dB) | 28.8 | 29.6 -3% | 31 -8% | 30.6 -6% | 28 3% | 28.2 2% |
| Idle Average * (dB) | 28.8 | 29.6 -3% | 31 -8% | 30.6 -6% | 28 3% | 28.2 2% |
| Idle Maximum * (dB) | 30.9 | 29.6 4% | 31 -0% | 31 -0% | 29.4 5% | 28.2 9% |
| Load Average * (dB) | 35.6 | 42 -18% | 33.5 6% | 34.5 3% | 31.4 12% | 31.2 12% |
| Load Maximum * (dB) | 41.4 | 47.1 -14% | 33.7 19% | 32.4 22% | 34.6 16% | 33 20% |
* ... smaller is better
Noise level
| Idle |
| 28.8 / 28.8 / 30.9 dB(A) |
| Load |
| 35.6 / 41.4 dB(A) |
 | ||
30 dB silent 40 dB(A) audible 50 dB(A) loud |
||
min: | ||
Temperature
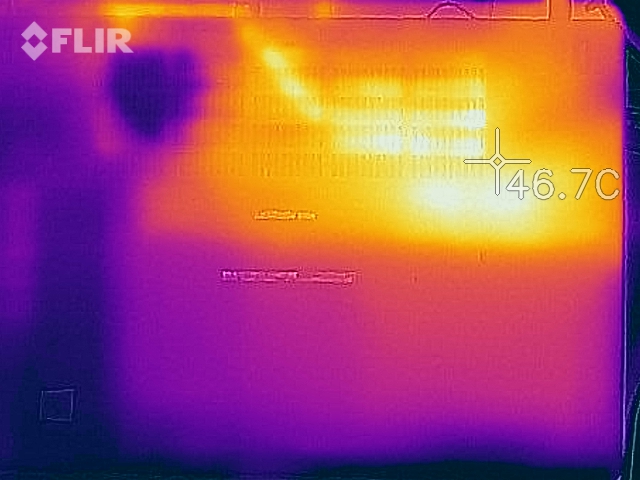
Despite the fact that the fans are rarely employed while idling, the temperature of the device never exceeds 25 °C (77 °F). As mentioned, the fans spin up significantly under load which, looking at the surface temperature seems necessary. While the top of the chassis stays relatively cool, the bottom heats up to 45 °C (113 °F). This makes using it on one’s lap rather difficult. Under load, the Latitude should preferably be placed on a table anyway, as the fans suck in air from below.
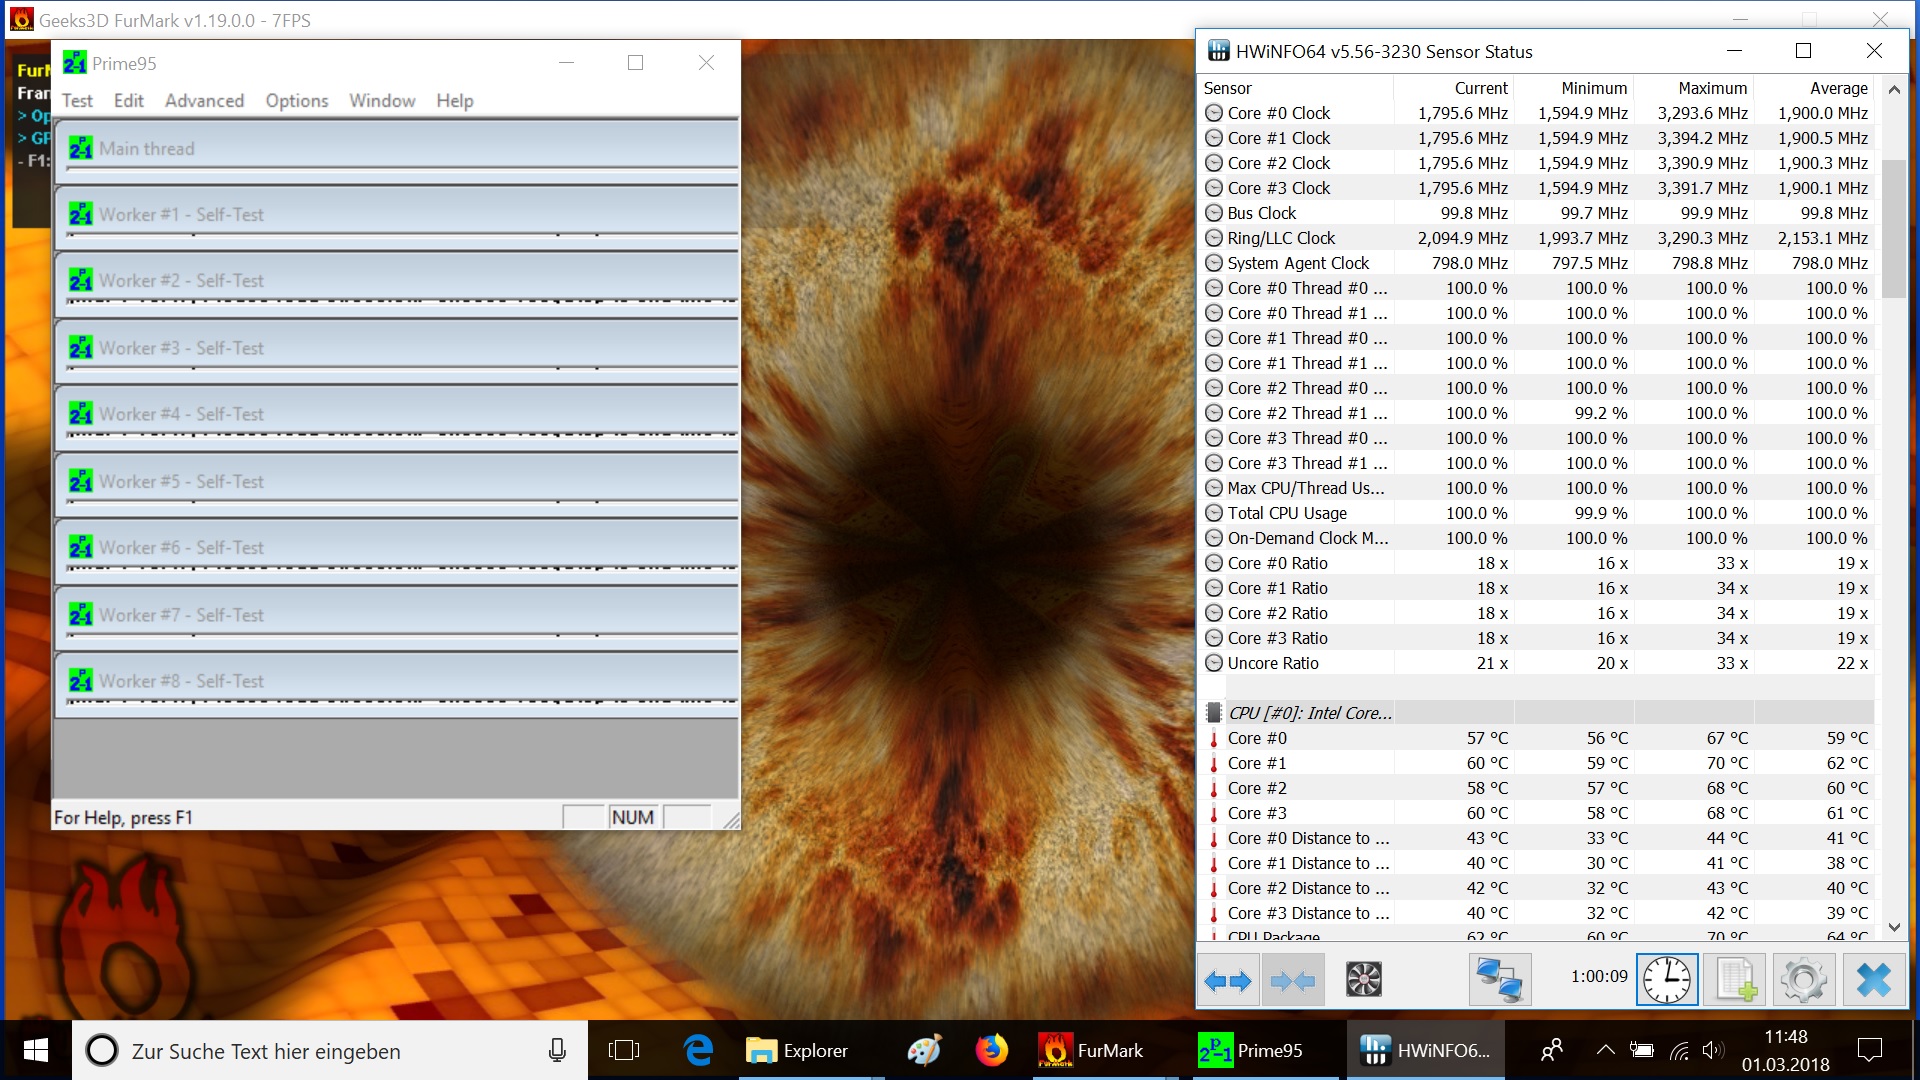
Using the worst-case scenario of Prime95 combine with FurMark across one hour, we can witness the maximum of temperature and throttling. The core temperature settles down at around 60 °C (~15.6 °F) after an hour of testing, showing good cooling performance. For this, however, performance is sacrificed as the frequency drops to about 1.8 GHz of a theoretical maximum 3.6 GHz. Fortunately, such a scenario is rarely the case, during real-world use throttling should be limited.
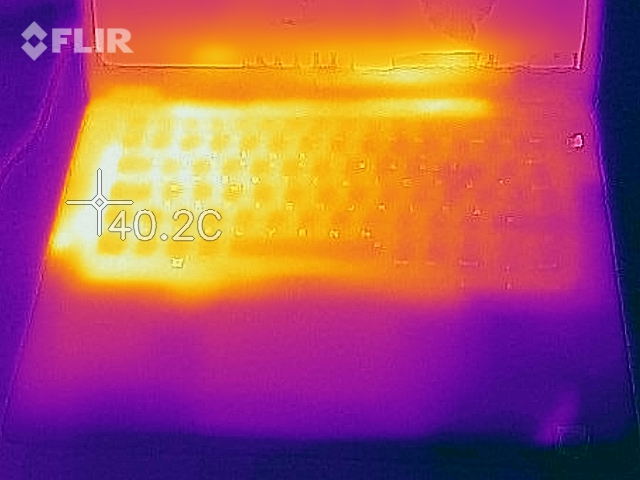
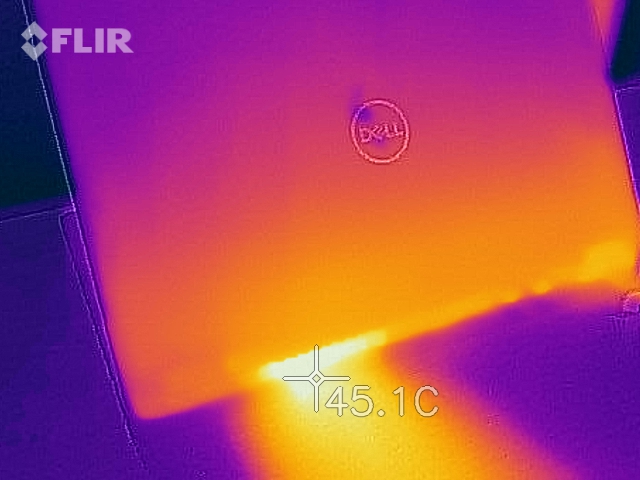
(+) The maximum temperature on the upper side is 38.3 °C / 101 F, compared to the average of 34.3 °C / 94 F, ranging from 21.2 to 62.5 °C for the class Office.
(±) The bottom heats up to a maximum of 44.7 °C / 112 F, compared to the average of 36.8 °C / 98 F
(+) In idle usage, the average temperature for the upper side is 22.9 °C / 73 F, compared to the device average of 29.5 °C / 85 F.
(+) The palmrests and touchpad are cooler than skin temperature with a maximum of 31.2 °C / 88.2 F and are therefore cool to the touch.
(-) The average temperature of the palmrest area of similar devices was 27.6 °C / 81.7 F (-3.6 °C / -6.5 F).
Speakers
When comparing them with the offerings of other manufacturers, the speakers of the Dell are not that bad. Considering the laptop's size and the fact that most notebook speakers are not that great, to begin with, the ones found in the 5490 are actually very good. The high volume, as well as linear and balanced mids and highs are the reason for this.
Naturally, bass output is not exceptional, leading to, in combination with the high volume, rather "tinny" sound. Thus we would recommend the use of headphones or external speakers. A combo jack is available for this case, however, there is no separate microphone input.
Dell Latitude 5490-TD70X audio analysis
(+) | speakers can play relatively loud (89.7 dB)
Bass 100 - 315 Hz
(-) | nearly no bass - on average 20% lower than median
(+) | bass is linear (6.7% delta to prev. frequency)
Mids 400 - 2000 Hz
(+) | balanced mids - only 4.1% away from median
(+) | mids are linear (5.4% delta to prev. frequency)
Highs 2 - 16 kHz
(+) | balanced highs - only 4.2% away from median
(+) | highs are linear (5.8% delta to prev. frequency)
Overall 100 - 16.000 Hz
(±) | linearity of overall sound is average (15.4% difference to median)
Compared to same class
» 14% of all tested devices in this class were better, 4% similar, 82% worse
» The best had a delta of 7%, average was 21%, worst was 53%
Compared to all devices tested
» 22% of all tested devices were better, 4% similar, 74% worse
» The best had a delta of 4%, average was 24%, worst was 134%
Apple MacBook 12 (Early 2016) 1.1 GHz audio analysis
(+) | speakers can play relatively loud (83.6 dB)
Bass 100 - 315 Hz
(±) | reduced bass - on average 11.3% lower than median
(±) | linearity of bass is average (14.2% delta to prev. frequency)
Mids 400 - 2000 Hz
(+) | balanced mids - only 2.4% away from median
(+) | mids are linear (5.5% delta to prev. frequency)
Highs 2 - 16 kHz
(+) | balanced highs - only 2% away from median
(+) | highs are linear (4.5% delta to prev. frequency)
Overall 100 - 16.000 Hz
(+) | overall sound is linear (10.2% difference to median)
Compared to same class
» 7% of all tested devices in this class were better, 2% similar, 91% worse
» The best had a delta of 5%, average was 18%, worst was 53%
Compared to all devices tested
» 4% of all tested devices were better, 1% similar, 94% worse
» The best had a delta of 4%, average was 24%, worst was 134%
Frequency diagram in comparison (checkboxes can be checked and unchecked!)
Energy management
Energy consumption
The Latitude 5490 somehow manages both great and awful energy consumption. When idling, the device uses the least amount of energy, under load the most. The maximum power draw of 67 W is, however, the absolute maximum, achieved for only a few seconds. Afterward, the notebook’s power draw stays at about 43-45 W under high load. At that point the Latitude still consumes more than its competition, although it offers more performance.
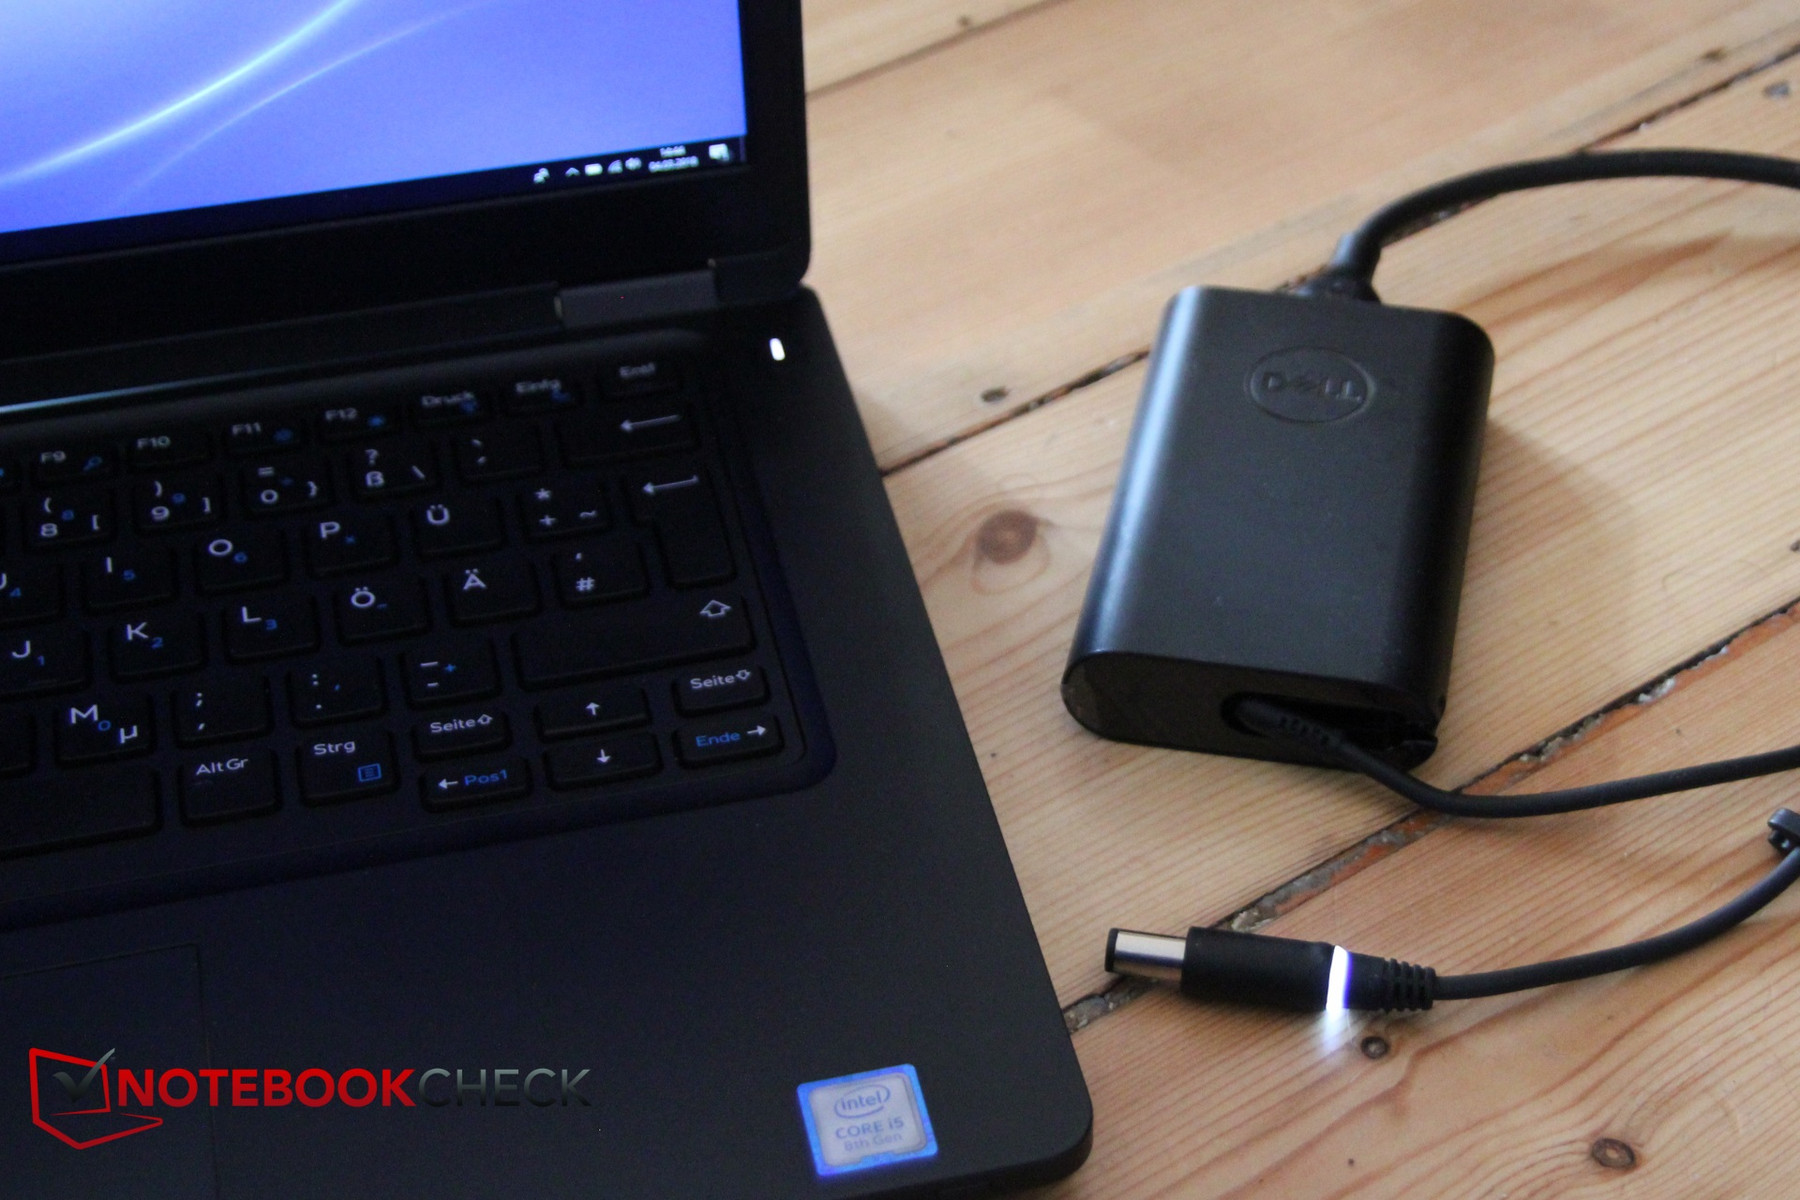
The power supply’s dimensions are pleasantly small and it is able to handle up to 65 W. As 67 W of consumption is reached only briefly and the maximum power draw is usually at around 45 W, there is still enough of a reserve to charge the device under load.
| Off / Standby | |
| Idle | |
| Load |
|
Key:
min: | |
| Dell Latitude 5490-TD70X i5-8350U, UHD Graphics 620, Toshiba KSG60ZMV512G, IPS, 1920x1080, 14" | Dell Latitude 5480 i7-7600U, HD Graphics 620, Toshiba SG5 256GB THNSNK256GVN8, IPS, 1920x1080, 14" | HP EliteBook 840 G4-Z2V49ET ABD i5-7200U, HD Graphics 620, Samsung PM961 MZVLW256HEHP, TN, 1920x1080, 14" | Acer TravelMate P648-G2-M-73T0 i7-7500U, HD Graphics 620, SK Hynix HFS256G39TND-N210A, IPS, 1920x1080, 14" | Lenovo ThinkPad T470-20HD002HGE i5-7200U, HD Graphics 620, Samsung PM961 NVMe MZVLW512HMJP, IPS, 1920x1080, 14" | Fujitsu LifeBook U747 i5-7200U, HD Graphics 620, Samsung MZYTY256HDHP, IPS LED, 1920x1080, 14" | |
|---|---|---|---|---|---|---|
| Power Consumption | -12% | 14% | -16% | 14% | -4% | |
| Idle Minimum * (Watt) | 3.3 | 6.64 -101% | 2.9 12% | 4.8 -45% | 3.21 3% | 4.11 -25% |
| Idle Average * (Watt) | 5.54 | 6.67 -20% | 5.6 -1% | 7.9 -43% | 6.15 -11% | 7.87 -42% |
| Idle Maximum * (Watt) | 6.59 | 7.78 -18% | 8.15 -24% | 10.7 -62% | 6.82 -3% | 8.74 -33% |
| Load Average * (Watt) | 42.4 | 30.83 27% | 30.6 28% | 35 17% | 28.5 33% | 30.2 29% |
| Load Maximum * (Watt) | 67.6 | 31.7 53% | 31 54% | 31.6 53% | 34.5 49% | 32.4 52% |
* ... smaller is better
Battery life
Considering the two-sided energy consumption results, it should not come as a surprise that the battery life is going to depend very much on the use case. To analyze the battery life, we employed the following tests:
Idle/Readers-Test: This test tries to find the absolute highest achievable battery life using BatteryEater. The display brightness is set to minimum, all communication modules are deactivated and the energy profile "Power Saver" is used. In this test, the Dell reached an incredible 26 hours with little to no load; our highest score ever.
Browsing via WLAN: This test is closer to a real-life use case. The profile "Balanced" is used, the brightness is set to about 150 cd/m² and WLAN is enabled. A script is used to access various websites every minute, on occasion YouTube videos are being displayed. In this test, the 5490 reached almost 15 hours, which is very impressive.
Video playback: The profile "Power Saver" is enabled, the brightness is again set to about 150 cd/m² and all communication modules are disabled. An H.264 encoded movie is being displayed continuously. In this test, the Latitude manages 13 hours and 11 minutes, another great result.
Load: We try to establish the minimum battery life under high load. Again, we employ BatteryEater, this time using the "Classic Test". The brightness is set to its maximum, all communication modules are enabled and "High-Performance Mode" is enabled. In this test, the battery of the Dell Latitude 5490 is emptied in 97 minutes. This shows us that, under load, the energy consumption skyrockets.
In conclusion, the battery life of the Latitude in the real world seems very impressive, one of the main strengths of the Latitude. Too much strain should however not be put upon the device if you require a long battery life, as, while the device manages to reach the best results in our comparison when looking at Idle, video playback and browsing, the same cannot be said about our load scenario in which the Latitude falls to the last place.
Dell has integrated their own energy profile, striking a good balance between performance and battery life as an alternative to the "Balanced" mode. As we mostly test using the "Power Saver" mode, we are however not aware whether the mode Dell provides is very effective.
| Dell Latitude 5490-TD70X i5-8350U, UHD Graphics 620, 68 Wh | Dell Latitude 5480 i7-7600U, HD Graphics 620, 68 Wh | HP EliteBook 840 G4-Z2V49ET ABD i5-7200U, HD Graphics 620, 51 Wh | Acer TravelMate P648-G2-M-73T0 i7-7500U, HD Graphics 620, 54 Wh | Lenovo ThinkPad T470-20HD002HGE i5-7200U, HD Graphics 620, 48 Wh | Fujitsu LifeBook U747 i5-7200U, HD Graphics 620, 50 Wh | Average of class Office | |
|---|---|---|---|---|---|---|---|
| Battery runtime | 23% | 2% | -12% | -20% | -29% | -1% | |
| Reader / Idle (h) | 25.9 | 24.1 -7% | 19.3 -25% | 18.1 -30% | 13 -50% | 22.3 ? -14% | |
| H.264 (h) | 13.2 | 9.9 -25% | 10.4 -21% | 8.2 -38% | 14.9 ? 13% | ||
| WiFi v1.3 (h) | 15 | 16.1 7% | 9.5 -37% | 11.2 -25% | 7.3 -51% | 7.2 -52% | 12.3 ? -18% |
| Load (h) | 1.6 | 2.7 69% | 3.1 94% | 1.9 19% | 1.8 13% | 2 25% | 1.851 ? 16% |
Verdict
Pros
Cons
The Dell Latitude 5490 has a lot of plus points, especially for companies and their employees: During office usage, it is very efficient and, thanks to the mostly fanless operation, very quiet. The input devices are also of a high quality, but the biggest advantage of this notebook is its incredible battery life, allowing day long usage in less demanding tasks. The strong, optional, collection of security features can be an equally good argument for a purchase.
This is why it saddens us so much to see that Dell has not fixed the biggest point of criticizm found in the predecessor, the dark display. While it offers more contrast and better black levels than before, it is still not very bright. Adding to that, it suffers from terrible reaction times and discoloration. Fan noise under load could equally be improved.
The 5490 is clearly aimed predominantly at companies and their employees. One has to however carefully select the countless configurations on offer to get the desired feature set. For less security conscious customers, there are certainly lighter, smaller and under load quieter alternatives on offer, that often can be more affordable as well. Those interested, will get a secure, powerful and enduring business laptop with an unfortunately very dark display.
The 5490 is slightly slimmer than its predecessor, but the Kaby-Lake refresh only rarely results in improved real-world performance. In a lot of applications, the 5480 is actually slightly faster. Perhaps taking a look at the predecessor could thus be worthwhile, although it should be noted that the 5480 is even louder under load.
Dell Latitude 5490-TD70X
- 03/04/2018 v6 (old)
Christian Hintze
More articles related to this device
Dell Latitude 5490-TD70X (Latitude 14 5400 Series)Related Articles

Price comparison
