Dell Latitude 13 7380 (i7-7600U, FHD) Laptop Review

The latest revisions in Dell’s Latitude 7000 series have indicated a confident migration toward consumer-grade luxuries while still maintaining the critical sensibilities of a business machine. We have therefore witnessed shrinking bezels, sharper aesthetics, and even lighter weight—fortunately, at little cost elsewhere apart from the still-occasionally-lamented loss of proprietary dedicated docking ports.
However, up until now, Dell has only offered two sizes to choose from in their highest-end Latitude series: a 12.5-inch and a 14-inch screen model. The 13.3-inch model which was introduced in 2016 (the Latitude 13 7370) was really a wholly different sort of product, thanks to its incorporation of Core m CPUs and a passive cooling design—decisions which also, of course, negatively affected performance when pitted against similarly-sized actively-cooled competitors, such as the Lenovo ThinkPad X1 Carbon, HP EliteBook 840 G4, and Toshiba Portege X30-D.
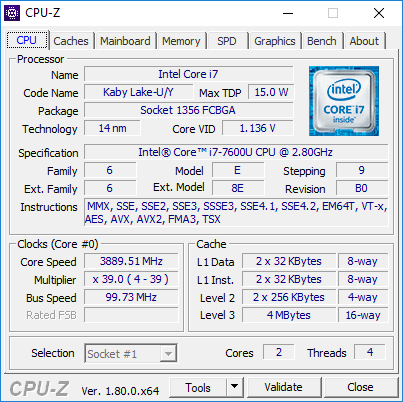
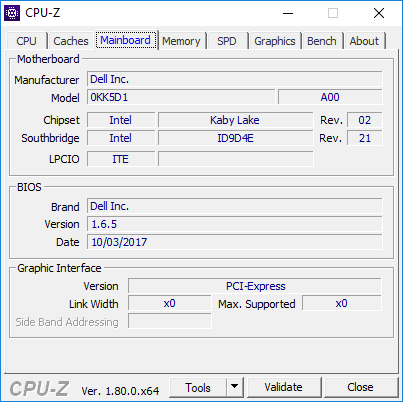
Those who were discouraged by these sacrifices will be pleased to know, then, that the Latitude 7380 represents a retreat from this approach back into full-blown 15 W TDP Core i CPU territory (along with active cooling). The design is heavily reminiscent of the 12.5-inch and 14-inch models, both of which borrow their philosophy—central hinge, narrow bezel, and (to some extent) styling—from the Dell XPS flagships. Our $2,178 review unit packs an Intel Core i7-7600U CPU, 16 GB RAM, and 256 GB NVMe SSD. Is it the happy medium we’ve been waiting for?
Case
As we mentioned above, the Latitude 13 7380 (like its 12.5-inch and 14-inch brethren) borrows much of its design from the Dell XPS line—in this case, the XPS 13, which features bezels of comparable size and the same central hinge into which the cooling fan exhausts. The size is actually no larger (and the weight no heavier) than the Latitude 7280, which of course begs the question of whether or not the 12.5-inch model will be discontinued to be replaced by the 7380 instead (seems logical). The ThinkPad X1 Carbon and Toshiba Portege X30-D remain lighter overall, but both of them are also slightly larger, so it’s down to a matter of preference (and, in the X1 Carbon’s case, a slightly larger display).
Sturdiness is very good as expected, quite similar overall to that of the XPS 13. The Latitude 7380’s magnesium alloy casing is primarily to thank for this, and the two large rubber feet which horizontally line the underside of the base unit provide decisive stability while resting on a flat surface. Heavy pressure in the center of the base unit does provoke a minor bit of flex, and the display lid is more susceptible to torsion than is the XPS 13’s aluminum variant—though no distortions are present on the screen during this stress. Neither of these shortfalls will likely amount to much during real-world use, but between the XPS and the Latitude, the award for overall case stability still probably goes to the XPS.


Meanwhile, the single central hinge firmly supports the display without any semblance of vibration noticeable even in transit—but as a consequence, the machine cannot be unfolded without two hands. Meticulous material transitions and precisely-rounded edges, as with our 7470 review unit, create quite the impression overall. Our only criticism remains the proclivity of the soft-touch paint finish to pick up and hang onto fingerprints, skin oils, and fine dust.
Connectivity
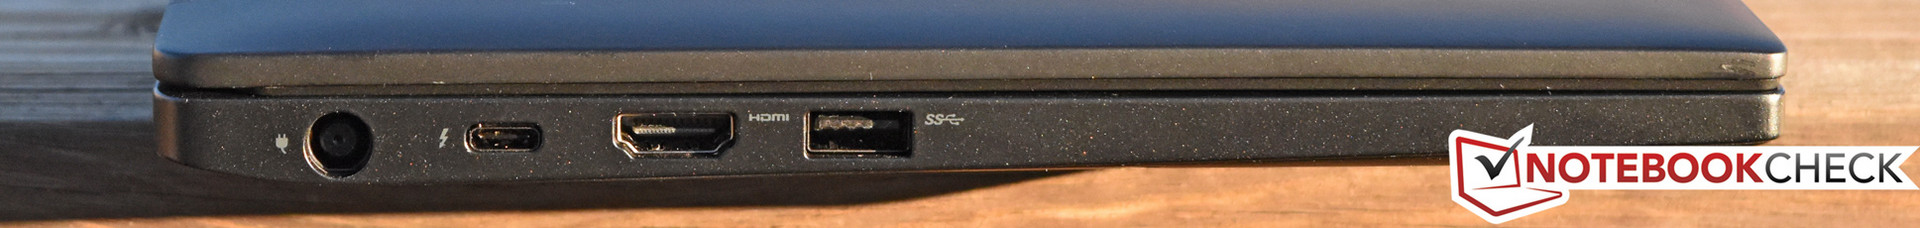
Another area in which the 7380 has elected to retreat to more familiar business notebook conventions is that of connectivity. Whereas the Latitude 13 7370 provided just one full-sized USB 3.0 port, the 7380 bumps this number up to two. The 7370 did previously provide two additional highly versatile Thunderbolt/USB 3.1 Gen 2 ports, but one of these two ports also doubled as the charging port—and adapters were an implied requirement. The 7380 scales this back to just one Thunderbolt port, but it also restores the conventional charging port, leaving the total number of functional USB ports (even while charging) at 3.
Elsewhere, the Micro-HDMI port has also grown into a full-sized one, and the Ethernet port makes a welcomed return. The ports are conveniently arranged on the left and right sides of the machine, spaced appropriately.


SD Card Reader
Although it’s merely Micro-SD, the Latitude 7380’s integrated card reader provides good performance in context with its peers, resting near the top of our charts.
| SD Card Reader | |
| average JPG Copy Test (av. of 3 runs) | |
| Dell Latitude 13 7380 | |
| HP EliteBook 840 G4-Z2V49ET ABD | |
| Lenovo ThinkPad X1 Carbon 2017-20HR0021GE | |
| Toshiba Portege X30-D (PT274U-01N001) | |
| Lenovo ThinkPad 13-20J2S00G00 | |
| maximum AS SSD Seq Read Test (1GB) | |
| Toshiba Portege X30-D (PT274U-01N001) | |
| Dell Latitude 13 7380 | |
| Lenovo ThinkPad X1 Carbon 2017-20HR0021GE | |
| HP EliteBook 840 G4-Z2V49ET ABD | |
| Lenovo ThinkPad 13-20J2S00G00 | |
Communication

An Intel Dual Band Wireless-AC 8265 adapter oversees WLAN connectivity in our Latitude review unit, and as usual, performance is very good (this adapter also includes Bluetooth 4.2 functionality). Business professionals will also cheer the resurrection of the previously-mentioned Ethernet port, whose presence is made possible by a spring-loaded flap. Those same professionals will also appreciate the preservation of the webcam’s natural location above the screen (unlike the XPS 13, where it occupies a space in the lower-left corner, thereby making videoconferencing a bit awkward).
Accessories
A standard 65 W Dell AC Adapter is included with the Latitude 7380, weighing 294 g. No other accessories are included.
Maintenance
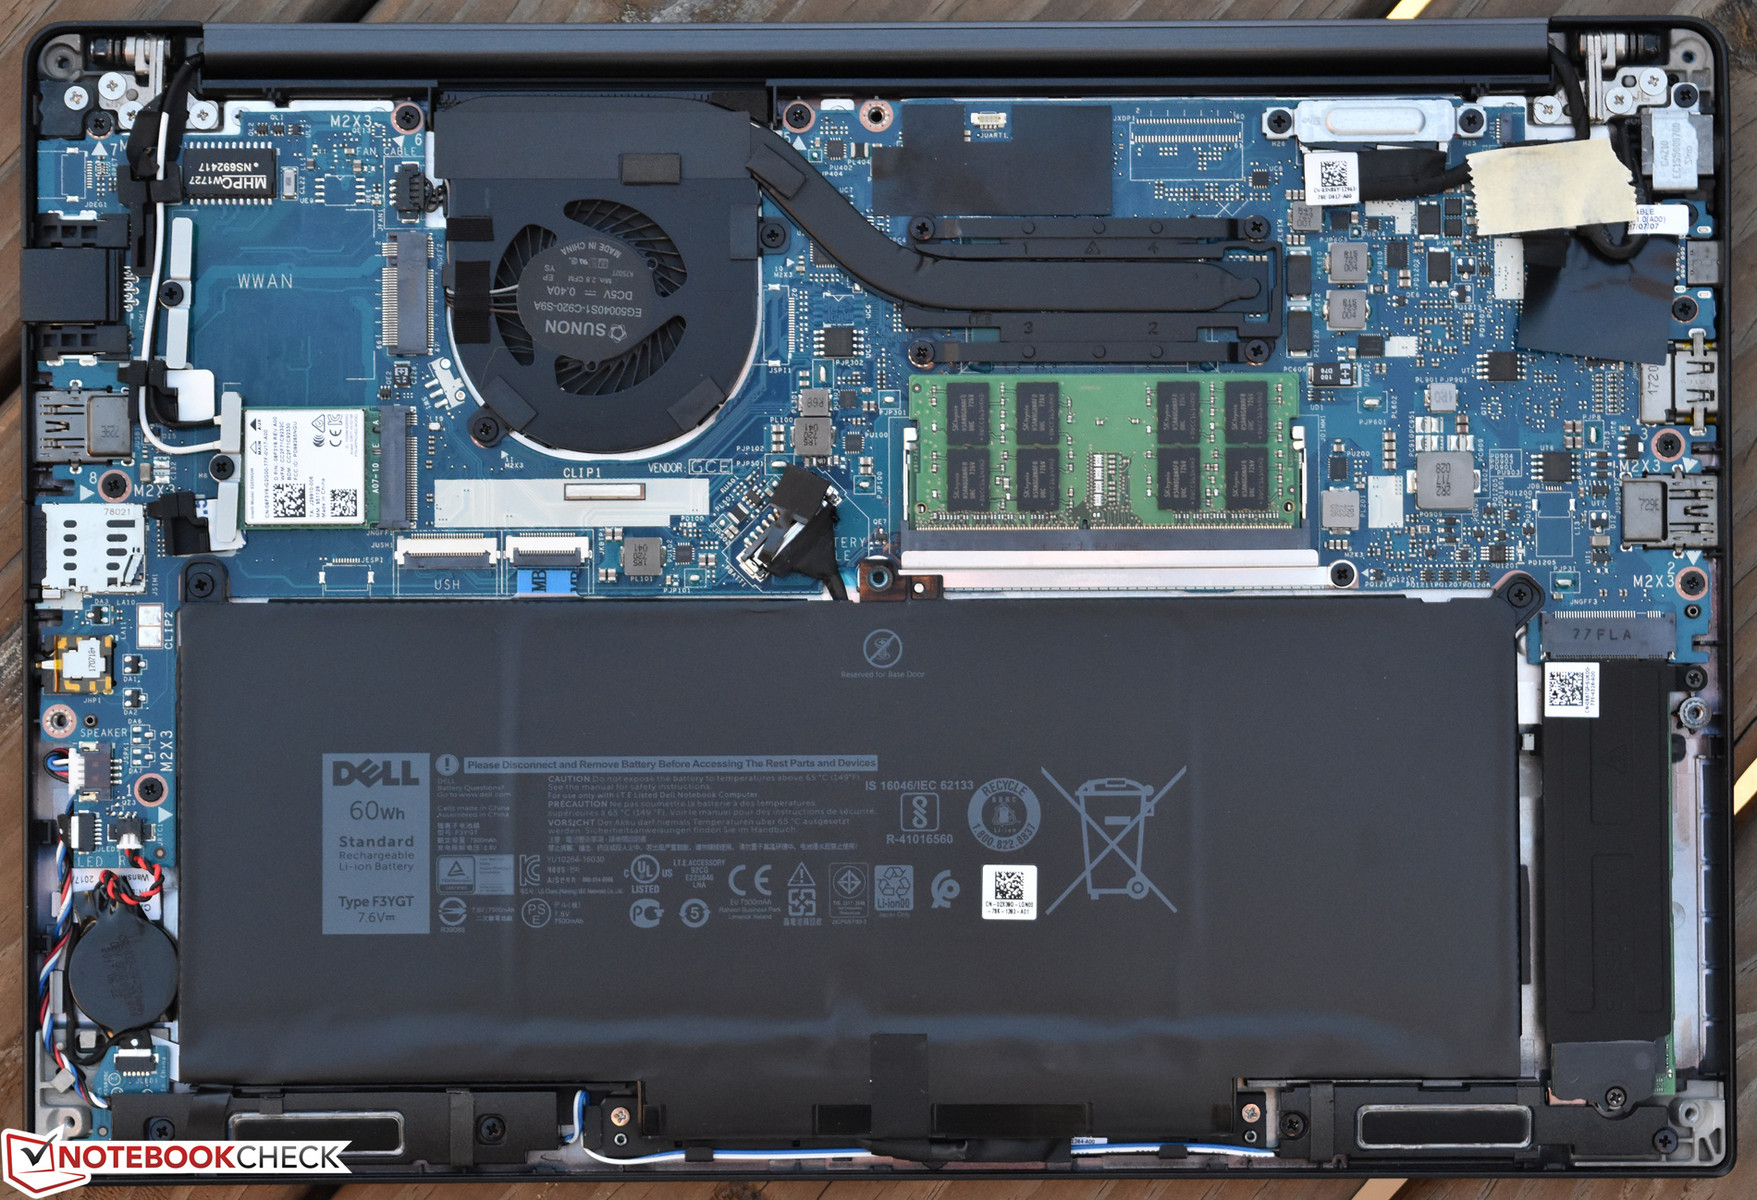
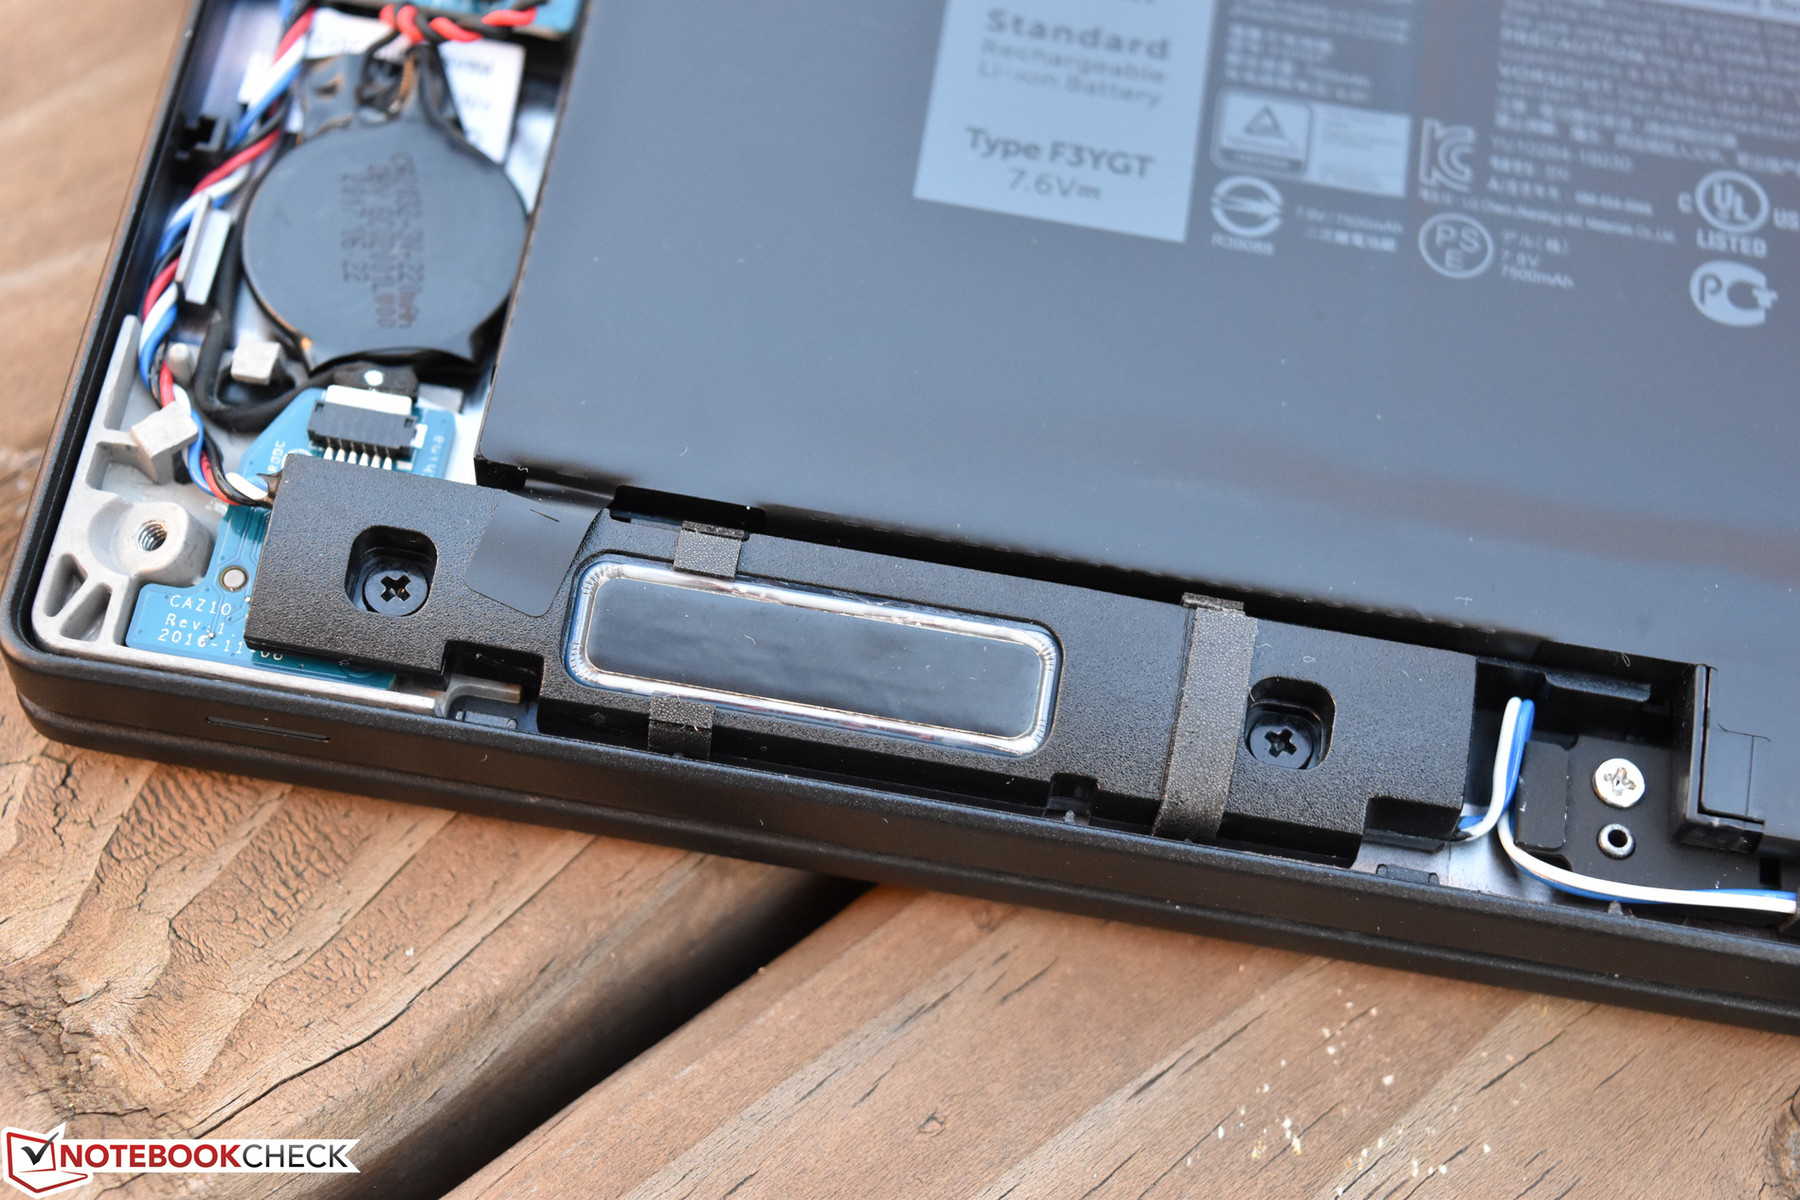
The rear panel of the Latitude 7380 is relatively easy to remove; it’s secured with eight Phillips-head screws and a couple of clips near the top. Beneath it, the usual smorgasbord of replaceable parts exists, including the internal battery, both sticks of RAM, the M.2 (NVMe in this case, covered by a heat spreader) SSD, WLAN adapter, CMOS battery, speakers, and finally, the heatsink/fan. There’s also a spot for a WWAN adapter, though the machine was not prewired for it. The only primary component which remains harder than we’d like to replace is the keyboard—for which the entire mainboard must first be removed.
Warranty
The Latitude 7380 ships with the same 3-year, on-site (after remote diagnosis) warranty as the rest of Dell's Latitude 7000 series machines.
Please see our Guarantees, Return Policies and Warranties FAQ for country-specific information.
Input Devices
Keyboard
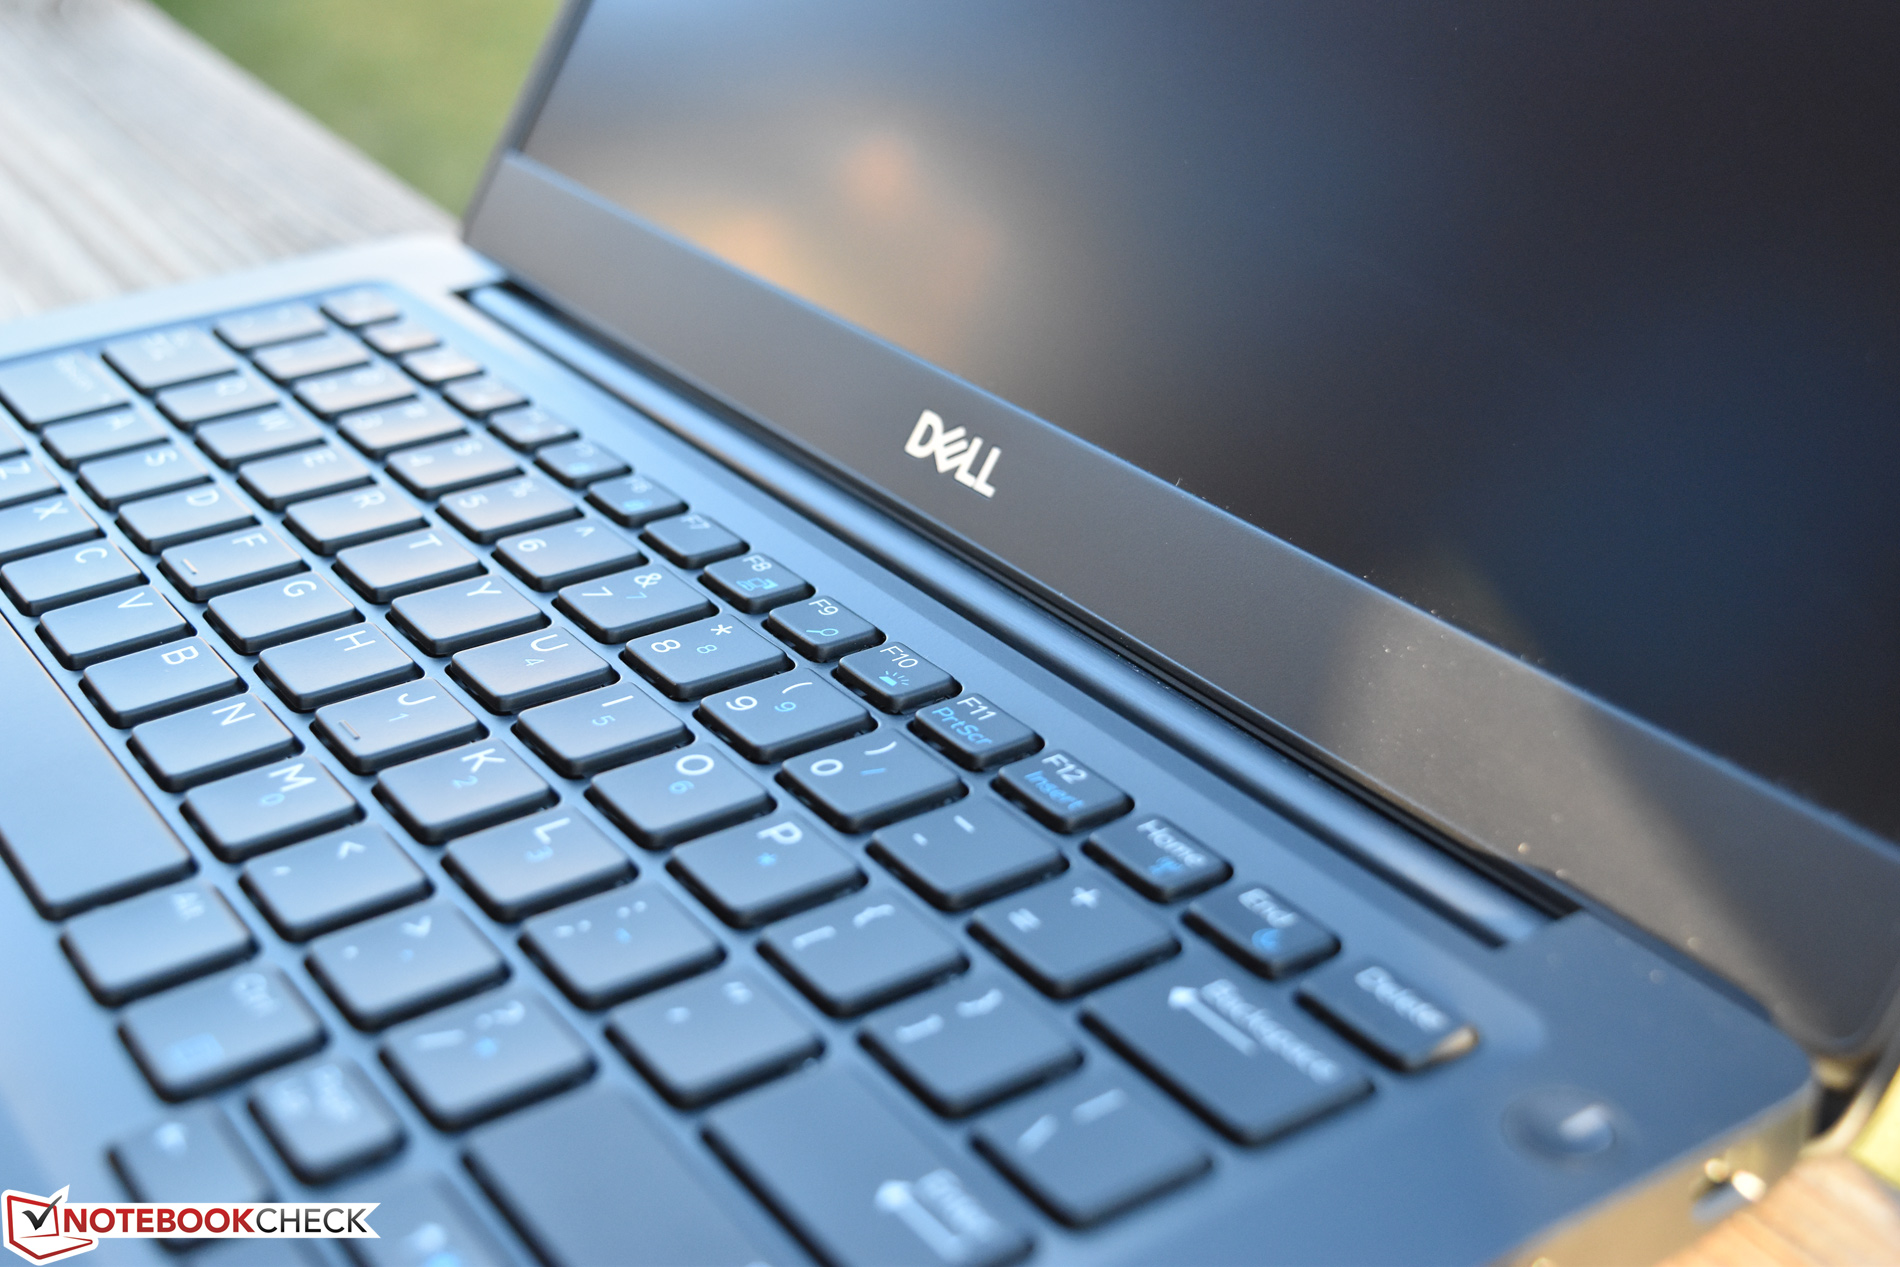
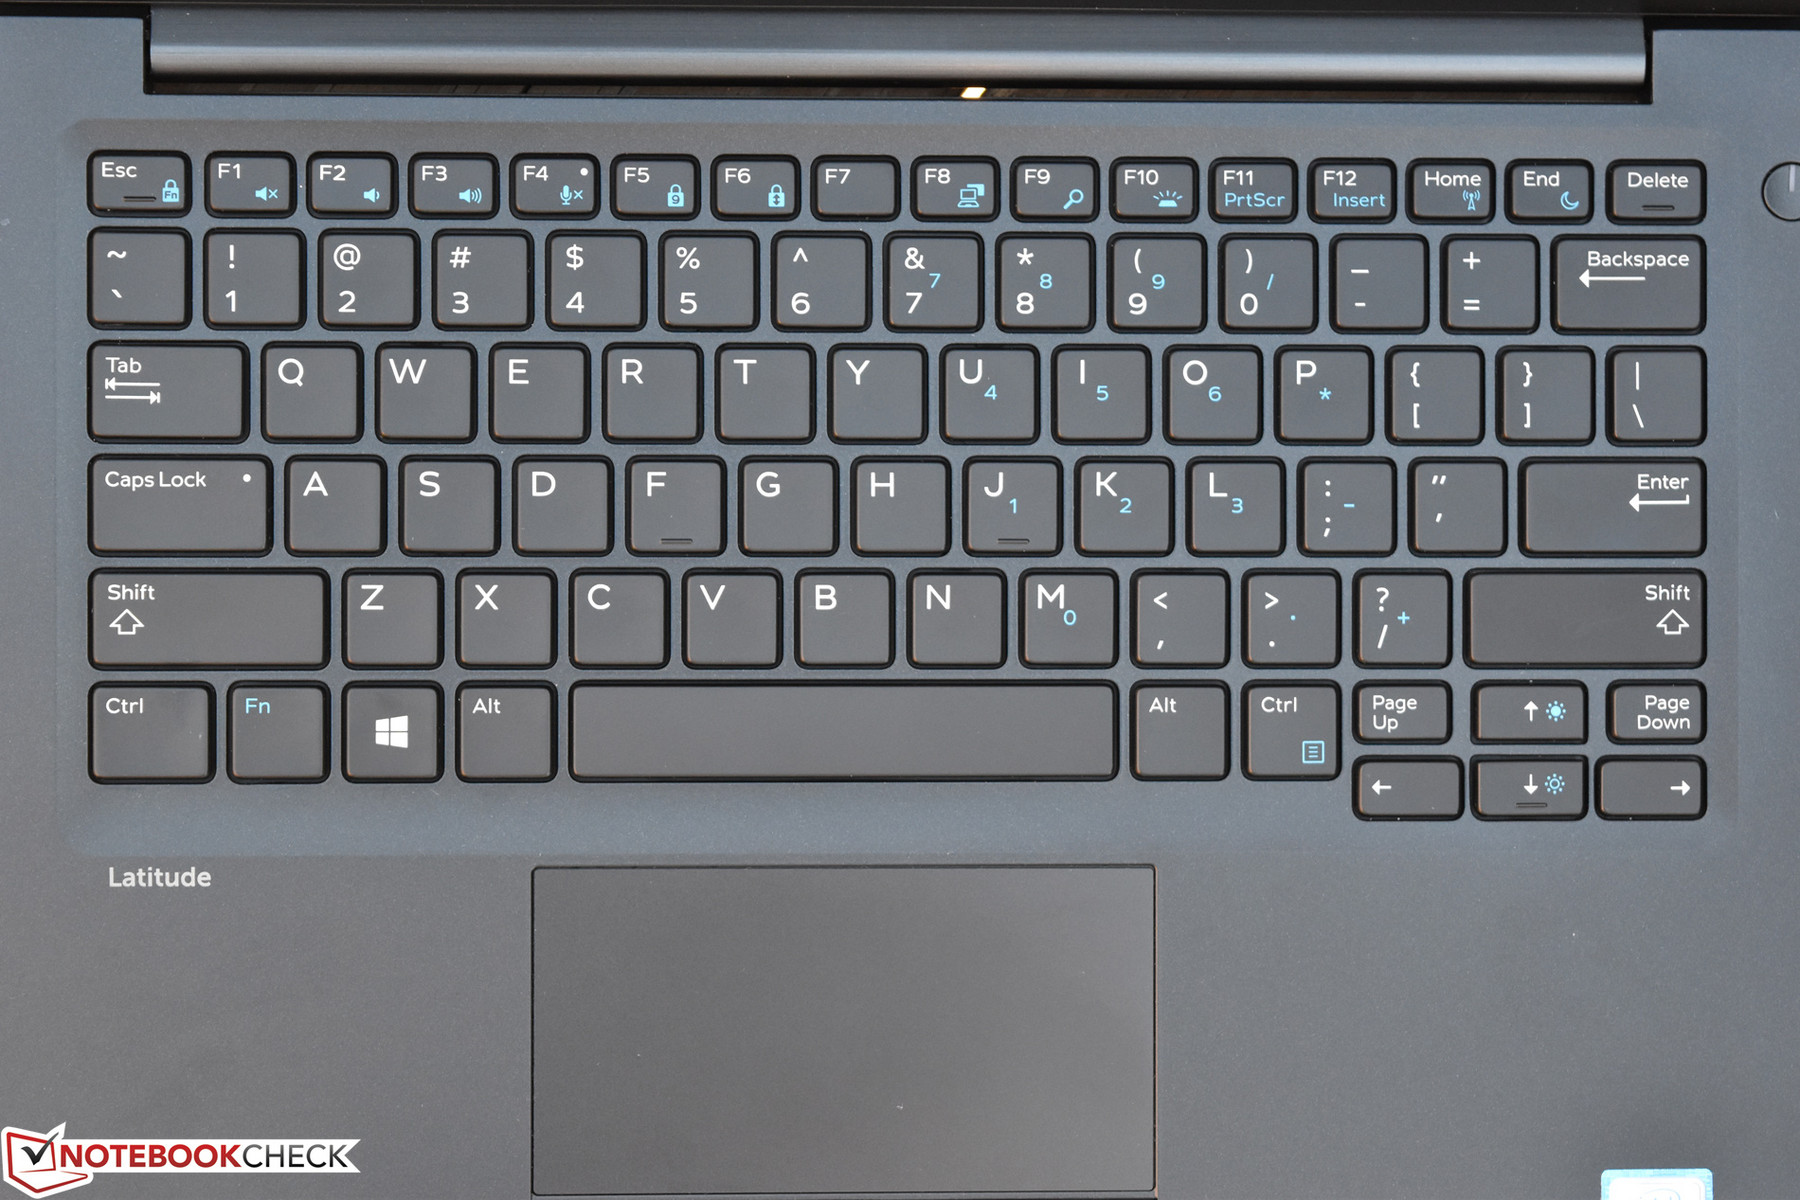
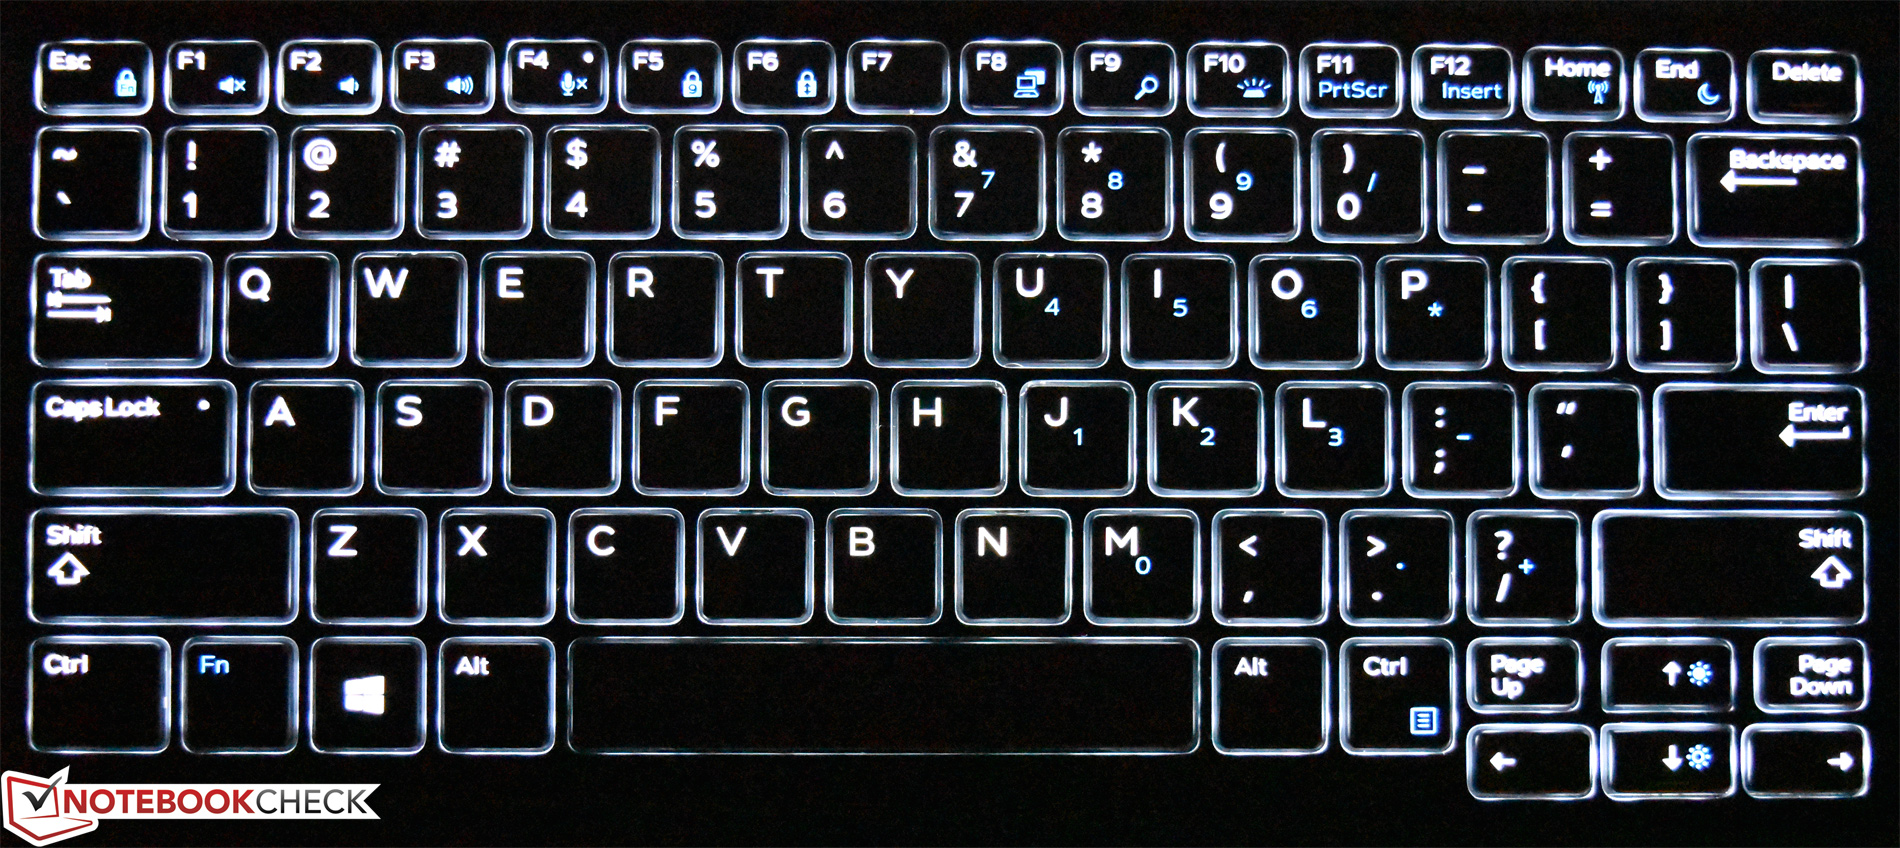
Speaking of the keyboard, the Latitude 7380 leverages what appears to be the same keyboard as the 7280. This is a different version from the (14-inch model) 7480 keyboard, which features longer key travel and a slightly higher actuation force. However, feedback remains excellent, and typing is quiet on the tightly-affixed keys. Spacing and layout is also great, with the only footnote being the small and slightly awkward arrow keys and Page Up/Page Down keys adjacent to them. This is undoubtedly one of the best keyboards on a laptop of this size, rivaling industry leaders such as Lenovo’s AccuType keyboards. The keys are also backlit, with two brightness options in addition to off; backlighting is even and attractive.
Touchpad
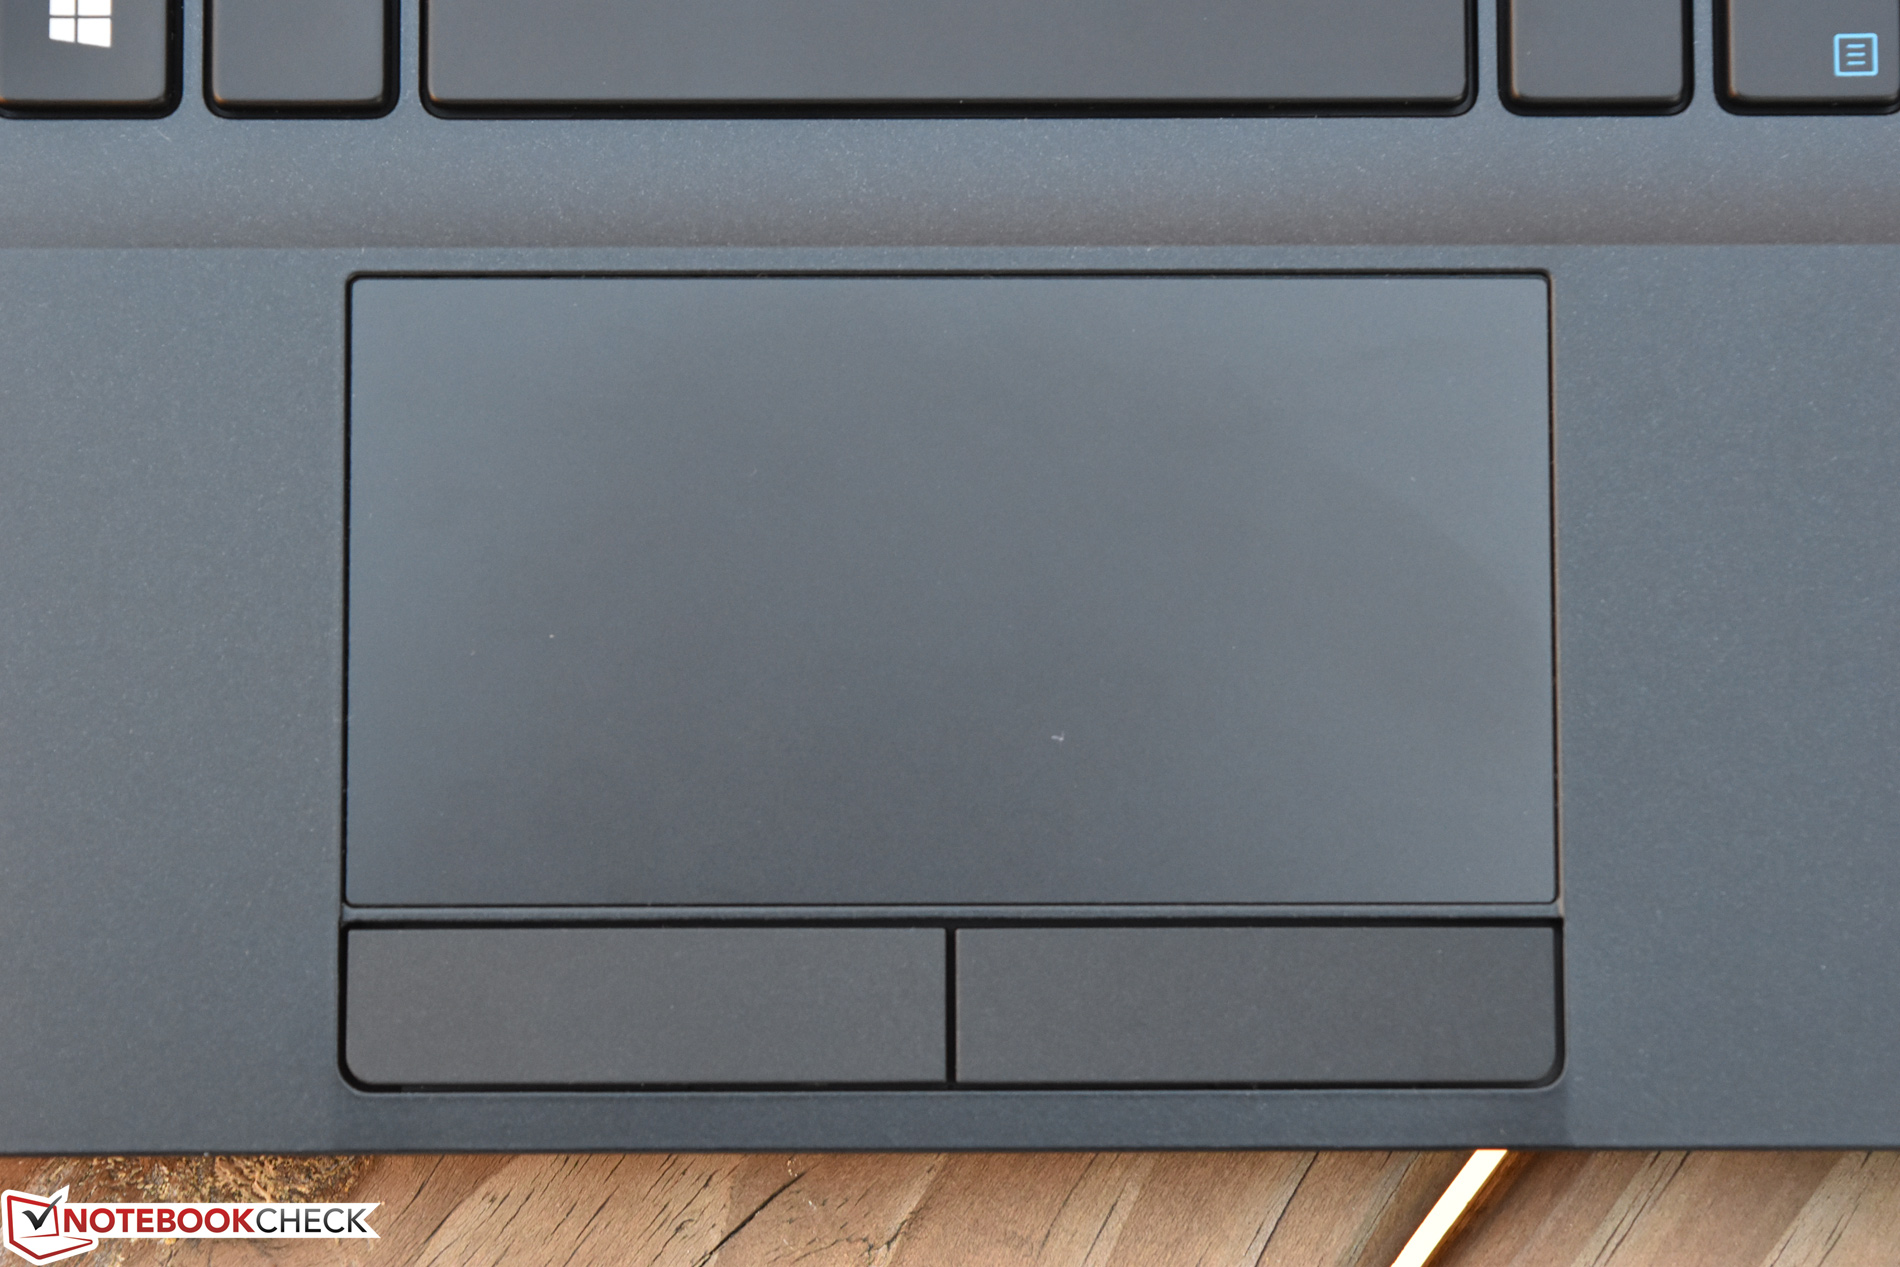
The touchpad also remains the same coming from the 7280, and as before, its spacious design and comfortable, quiet physical buttons are strongly appreciated. Driver support from manufacturer Alps Electric seems to have improved pointer and gesture function as well, as—apart from a slight detectable input lag—gestures such as two-finger scrolling and zoom seem to function more quickly and seamlessly than they did back in March when we reviewed the 7280. We still prefer the finish and Microsoft Precision Touchpad classification of the Dell XPS 13 and Lenovo ThinkPad X1 Carbon, but this is certainly not a bad touchpad by any judgment.

Display
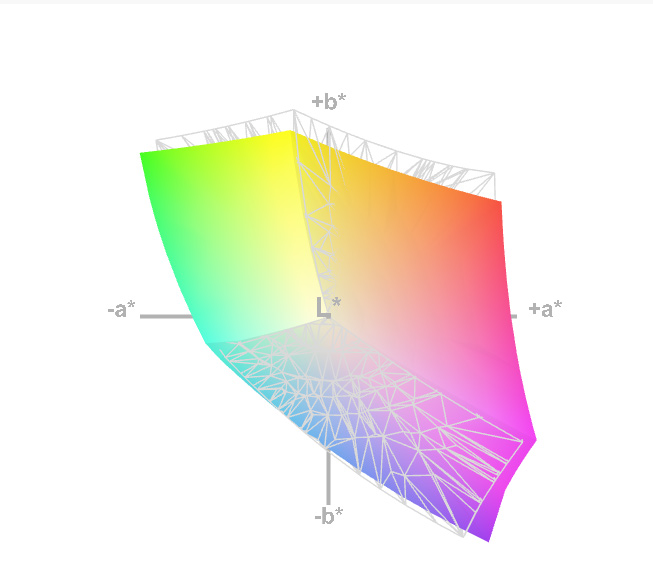
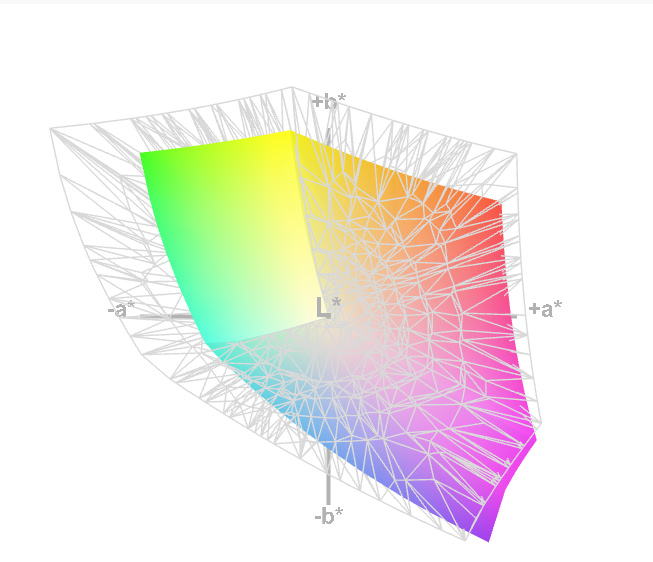
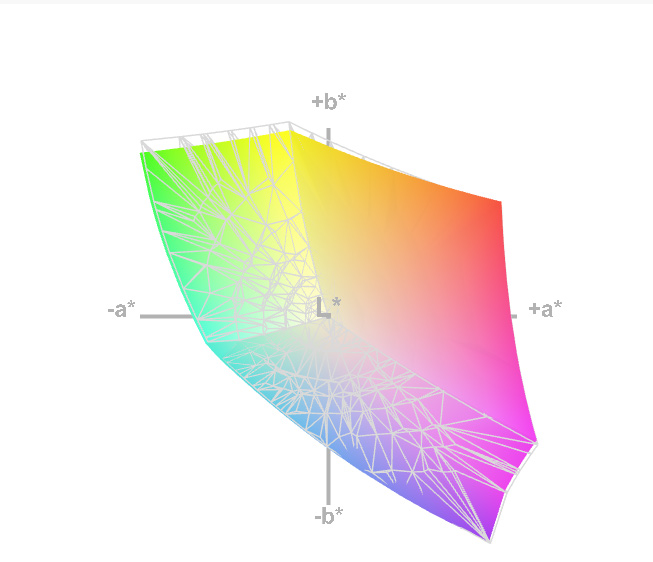
The Latitude 7380 can be configured with two different IPS “WVA” 13.3-inch panels, both with a 1920x1080 resolution: an “anti-glare” touchscreen, and a conventional non-touch anti-glare display. Our review unit came supplied with the non-touch model, so we’re unable to verify the extent to which the touch model is actually “anti-glare”—but that’s how it’s listed in the specifications provided by the manufacturer. Regardless, our unit subjectively managed good brightness and contrast levels, and colors appeared sufficiently vivid for a machine of its class.
Many consumers will be pleased to know that, unlike the XPS 13, the Latitude 7380 does not employ the use of CABC (Content-Adaptive Backlight Control). Instead, it leverages Intel's DPST (Display Power Saving Technology), which can be easily disabled via the Intel HD Graphics control panel.

| |||||||||||||||||||||||||
Brightness Distribution: 87 %
Center on Battery: 317 cd/m²
Contrast: 1057:1 (Black: 0.3 cd/m²)
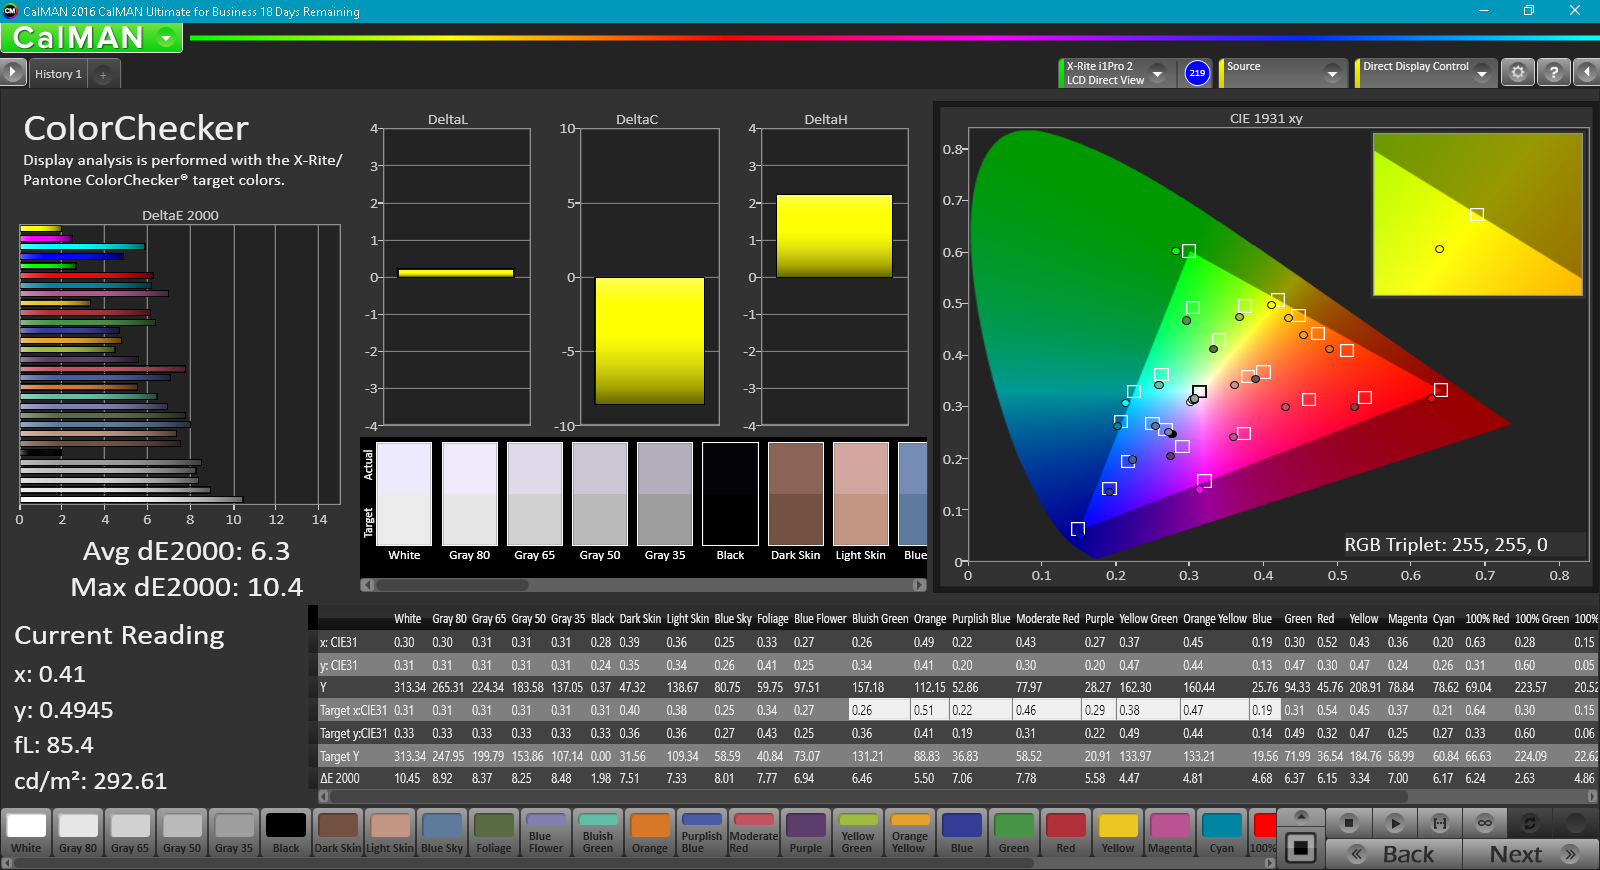
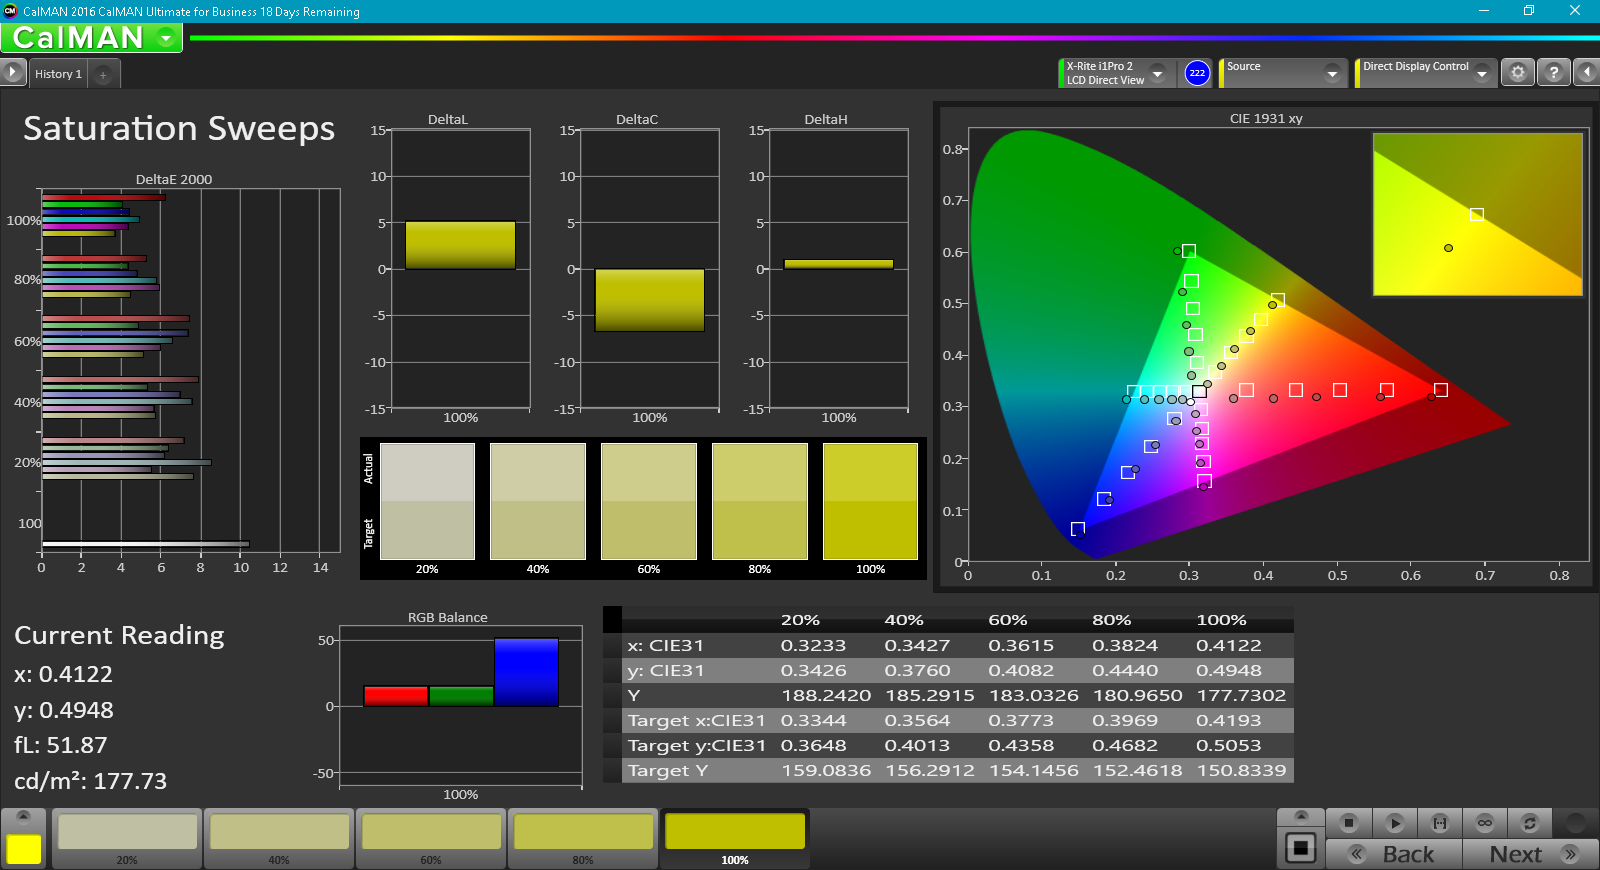
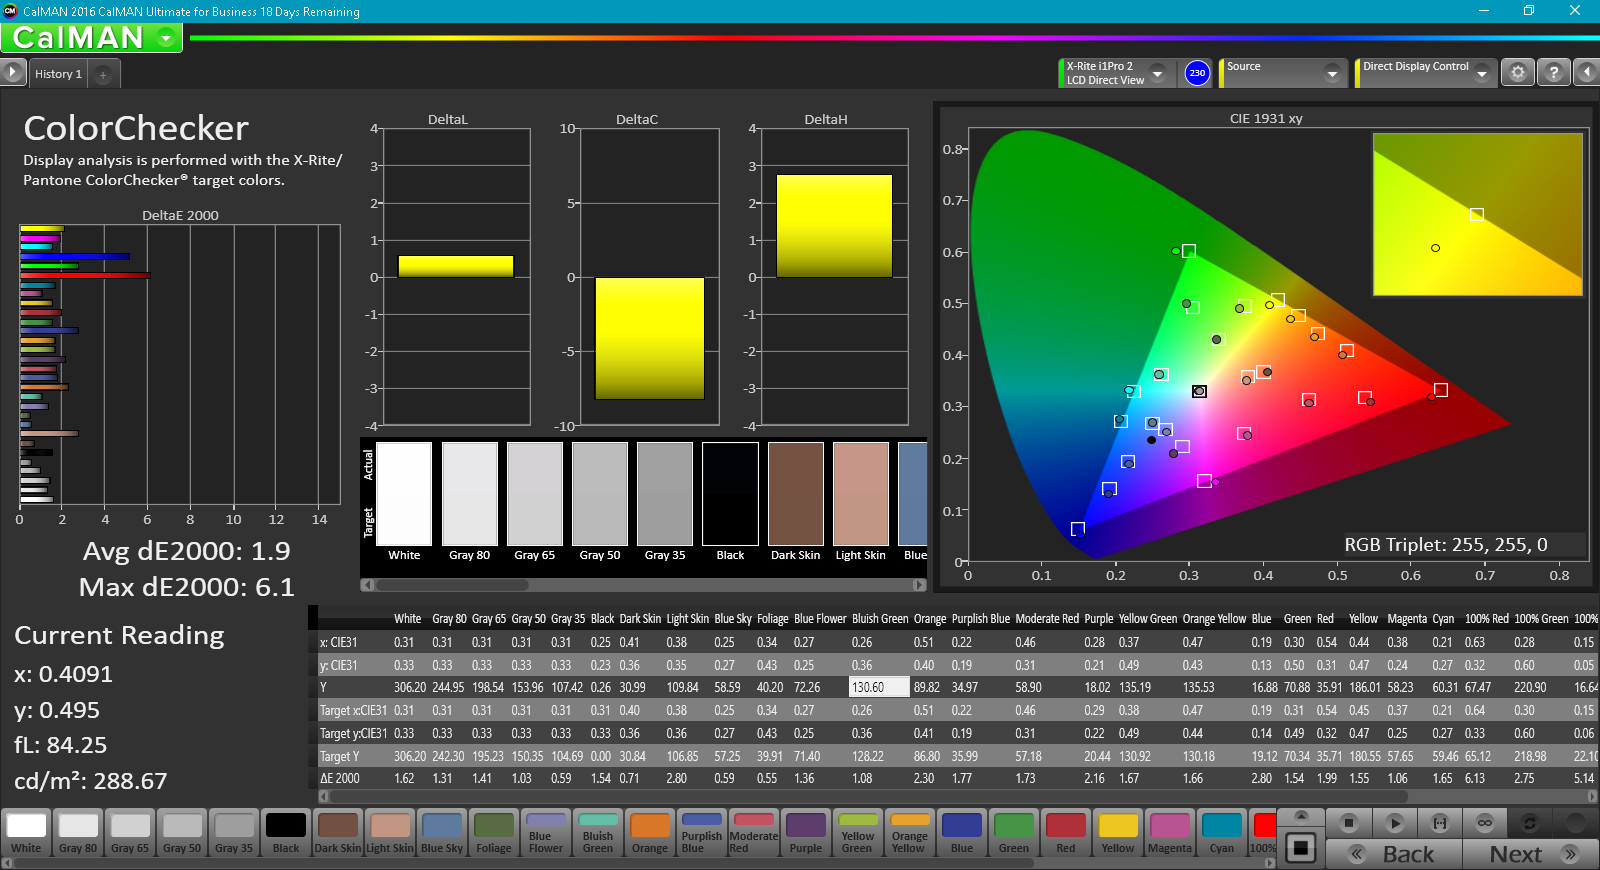
ΔE ColorChecker Calman: 6.3 | ∀{0.5-29.43 Ø4.77}
ΔE Greyscale Calman: 7.8 | ∀{0.09-98 Ø5}
92% sRGB (Argyll 1.6.3 3D)
61% AdobeRGB 1998 (Argyll 1.6.3 3D)
65.8% AdobeRGB 1998 (Argyll 3D)
91.8% sRGB (Argyll 3D)
65.5% Display P3 (Argyll 3D)
Gamma: 1.81
CCT: 7120 K
| Dell Latitude 13 7380 LGD0589, IPS, 13.3", 1920x1080 | Toshiba Portege X30-D (PT274U-01N001) Toshiba TOS508F, IPS, 13.3", 1920x1080 | Lenovo ThinkPad 13-20J2S00G00 LP133WF2-SPL78, IPS, LED, 13.3", 1920x1080 | Lenovo ThinkPad X1 Carbon 2017-20HR0021GE B140HAN03_1, IPS, 14", 1920x1080 | HP EliteBook 840 G4-Z2V49ET ABD AUO123D, TN, 14", 1920x1080 | |
|---|---|---|---|---|---|
| Display | 1% | -37% | -5% | -13% | |
| Display P3 Coverage (%) | 65.5 | 66.4 1% | 40.16 -39% | 61.6 -6% | 55.8 -15% |
| sRGB Coverage (%) | 91.8 | 93.5 2% | 60 -35% | 87.6 -5% | 80.7 -12% |
| AdobeRGB 1998 Coverage (%) | 65.8 | 66.6 1% | 41.54 -37% | 62.6 -5% | 57.7 -12% |
| Response Times | -4% | -7% | -22% | 4% | |
| Response Time Grey 50% / Grey 80% * (ms) | 34 ? | 36.8 ? -8% | 43.6 ? -28% | 48 ? -41% | 39 ? -15% |
| Response Time Black / White * (ms) | 29.6 ? | 29.6 ? -0% | 25.2 ? 15% | 30.4 ? -3% | 23 ? 22% |
| PWM Frequency (Hz) | 30860 ? | ||||
| Screen | 20% | -7% | 19% | -37% | |
| Brightness middle (cd/m²) | 317 | 332.6 5% | 306 -3% | 278 -12% | 346 9% |
| Brightness (cd/m²) | 295 | 323 9% | 307 4% | 271 -8% | 317 7% |
| Brightness Distribution (%) | 87 | 86 -1% | 89 2% | 91 5% | 86 -1% |
| Black Level * (cd/m²) | 0.3 | 0.28 7% | 0.36 -20% | 0.16 47% | 0.86 -187% |
| Contrast (:1) | 1057 | 1188 12% | 850 -20% | 1738 64% | 402 -62% |
| Colorchecker dE 2000 * | 6.3 | 2.6 59% | 5.1 19% | 4.5 29% | 8.64 -37% |
| Colorchecker dE 2000 max. * | 10.4 | 6.7 36% | 13.3 -28% | 8.4 19% | 13.58 -31% |
| Greyscale dE 2000 * | 7.8 | 2.5 68% | 3.9 50% | 3.2 59% | 11.24 -44% |
| Gamma | 1.81 122% | 2.12 104% | 2.17 101% | 2.02 109% | 2.62 84% |
| CCT | 7120 91% | 6720 97% | 6829 95% | 7042 92% | 12530 52% |
| Color Space (Percent of AdobeRGB 1998) (%) | 61 | 62 2% | 38.24 -37% | 57 -7% | 52 -15% |
| Color Space (Percent of sRGB) (%) | 92 | 94 2% | 59.75 -35% | 87.5 -5% | 80 -13% |
| Total Average (Program / Settings) | 6% /
13% | -17% /
-13% | -3% /
9% | -15% /
-27% |
* ... smaller is better
We measured an average brightness of 295 cd/m² and a brightness distribution of 87%, both of which are good results. Contrast came in at a very good 1057:1 on the heels of a black level reading of 0.3 cd/m².
The display manages 92% color coverage of the sRGB spectrum and 61% of AdobeRGB. These are solid results for a business machine—better than most competitors, in fact.
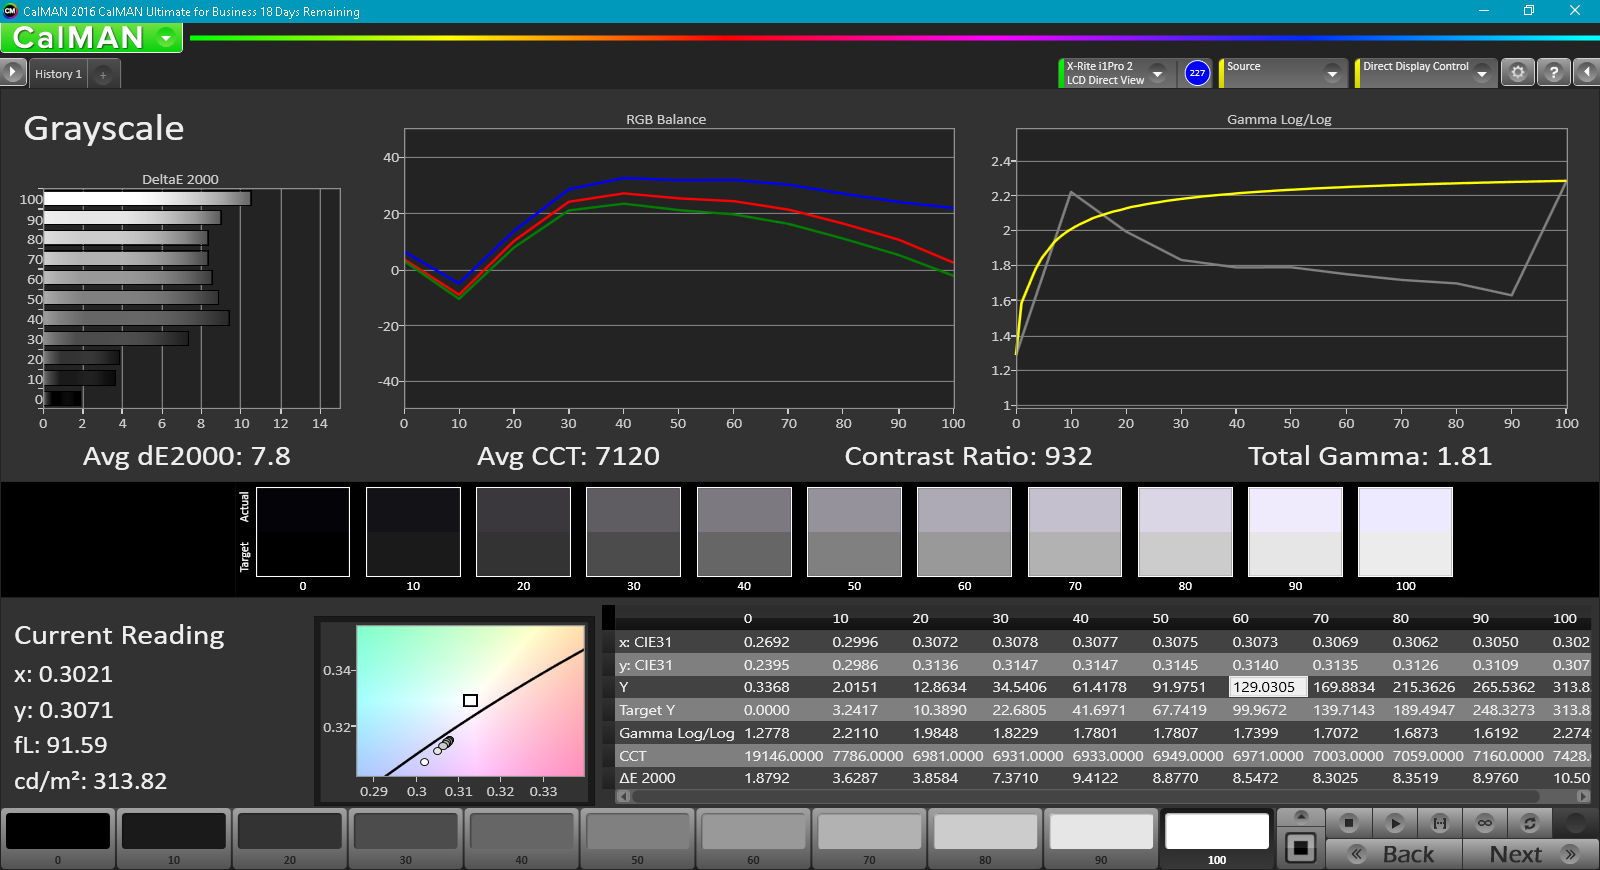
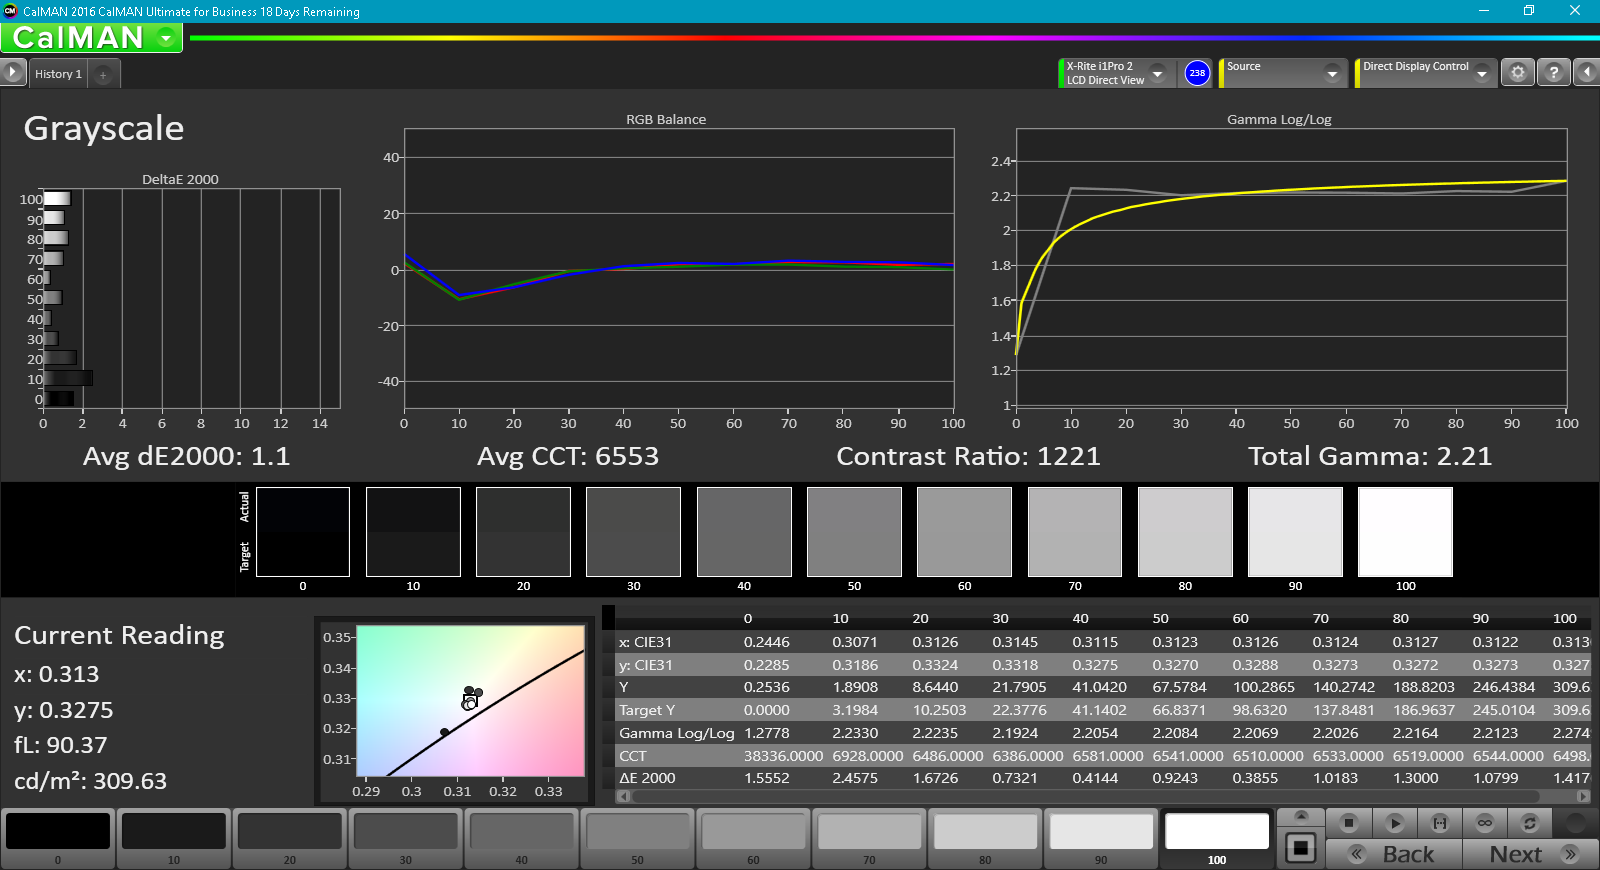
CalMAN measurements reveal much potential for display color calibration for those who would benefit from it. Out of the box, the panel is quite inaccurate, with ColorChecker and Greyscale DeltaE values of 6.3 and 7.8, respectively (ideal: 0), and a Total Gamma reading of 1.81 (ideal: 2.2). The CCT average is also slightly on the cooler side at 7120K (ideal: 6500K). Post-calibration, these values are vastly improved to 1.9 / 1.1 for ColorChecker / Greyscale DeltaE and 2.21 / 6553K for Total Gamma / CCT Average—that’s about as close to ideal as one could hope for from a business machine.

Display Response Times
| ↔ Response Time Black to White | ||
|---|---|---|
| 29.6 ms ... rise ↗ and fall ↘ combined | ↗ 17.2 ms rise | 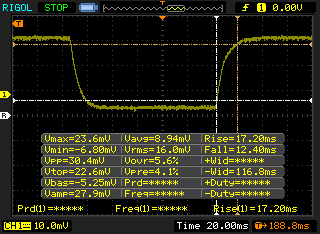 |
| ↘ 12.4 ms fall | ||
| The screen shows relatively slow response rates in our tests and may be too slow for gamers. In comparison, all tested devices range from 0.1 (minimum) to 240 (maximum) ms. » 78 % of all devices are better. This means that the measured response time is worse than the average of all tested devices (20.2 ms). | ||
| ↔ Response Time 50% Grey to 80% Grey | ||
| 34 ms ... rise ↗ and fall ↘ combined | ↗ 17.2 ms rise | 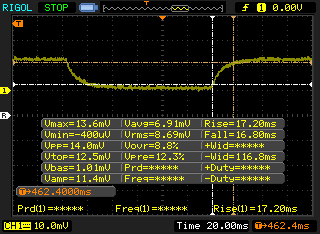 |
| ↘ 16.8 ms fall | ||
| The screen shows slow response rates in our tests and will be unsatisfactory for gamers. In comparison, all tested devices range from 0.165 (minimum) to 636 (maximum) ms. » 46 % of all devices are better. This means that the measured response time is similar to the average of all tested devices (31.5 ms). | ||
Screen Flickering / PWM (Pulse-Width Modulation)
| Screen flickering / PWM not detected |  | ||
In comparison: 53 % of all tested devices do not use PWM to dim the display. If PWM was detected, an average of 8070 (minimum: 5 - maximum: 343500) Hz was measured. | |||
We measured no PWM from the panel, but response times are a bit on the slow side.
Thanks to its good brightness and strong contrast, the display provides a comfortable picture outdoors in all but the brightest of environments. Viewing angles are, as promised, excellent.


Performance
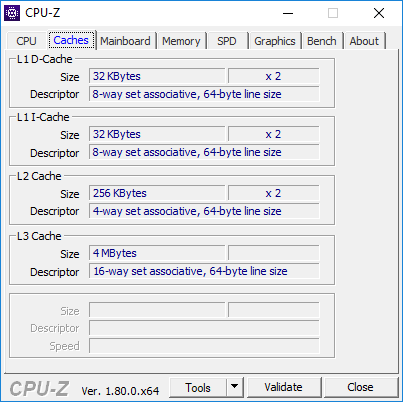
Unlike the previous-generation Latitude 7370, the 7380 ditches the low-powered Core m-style CPUs and steps directly into the 15 W TDP Core i3/i5/i7 options of the other two 7000 series notebooks. All storage options are solid-state—so general performance ought to be very good even with the most basic of options. However, only a single RAM slot is supported (up to 16 GB DDR4 single-channel), so that's a limitation when compared to many competitors.
Performance on battery power was not any different by our measurements than that while plugged in; we recorded a second score of 1744 in 3DMark 11 while unplugged, which is nearly identical to the score we received initially (1762). Lastly, LatencyMon did report some occasional issues with DPC latencies, and these were unaffected by the state of wireless radios in the machine.


Processor
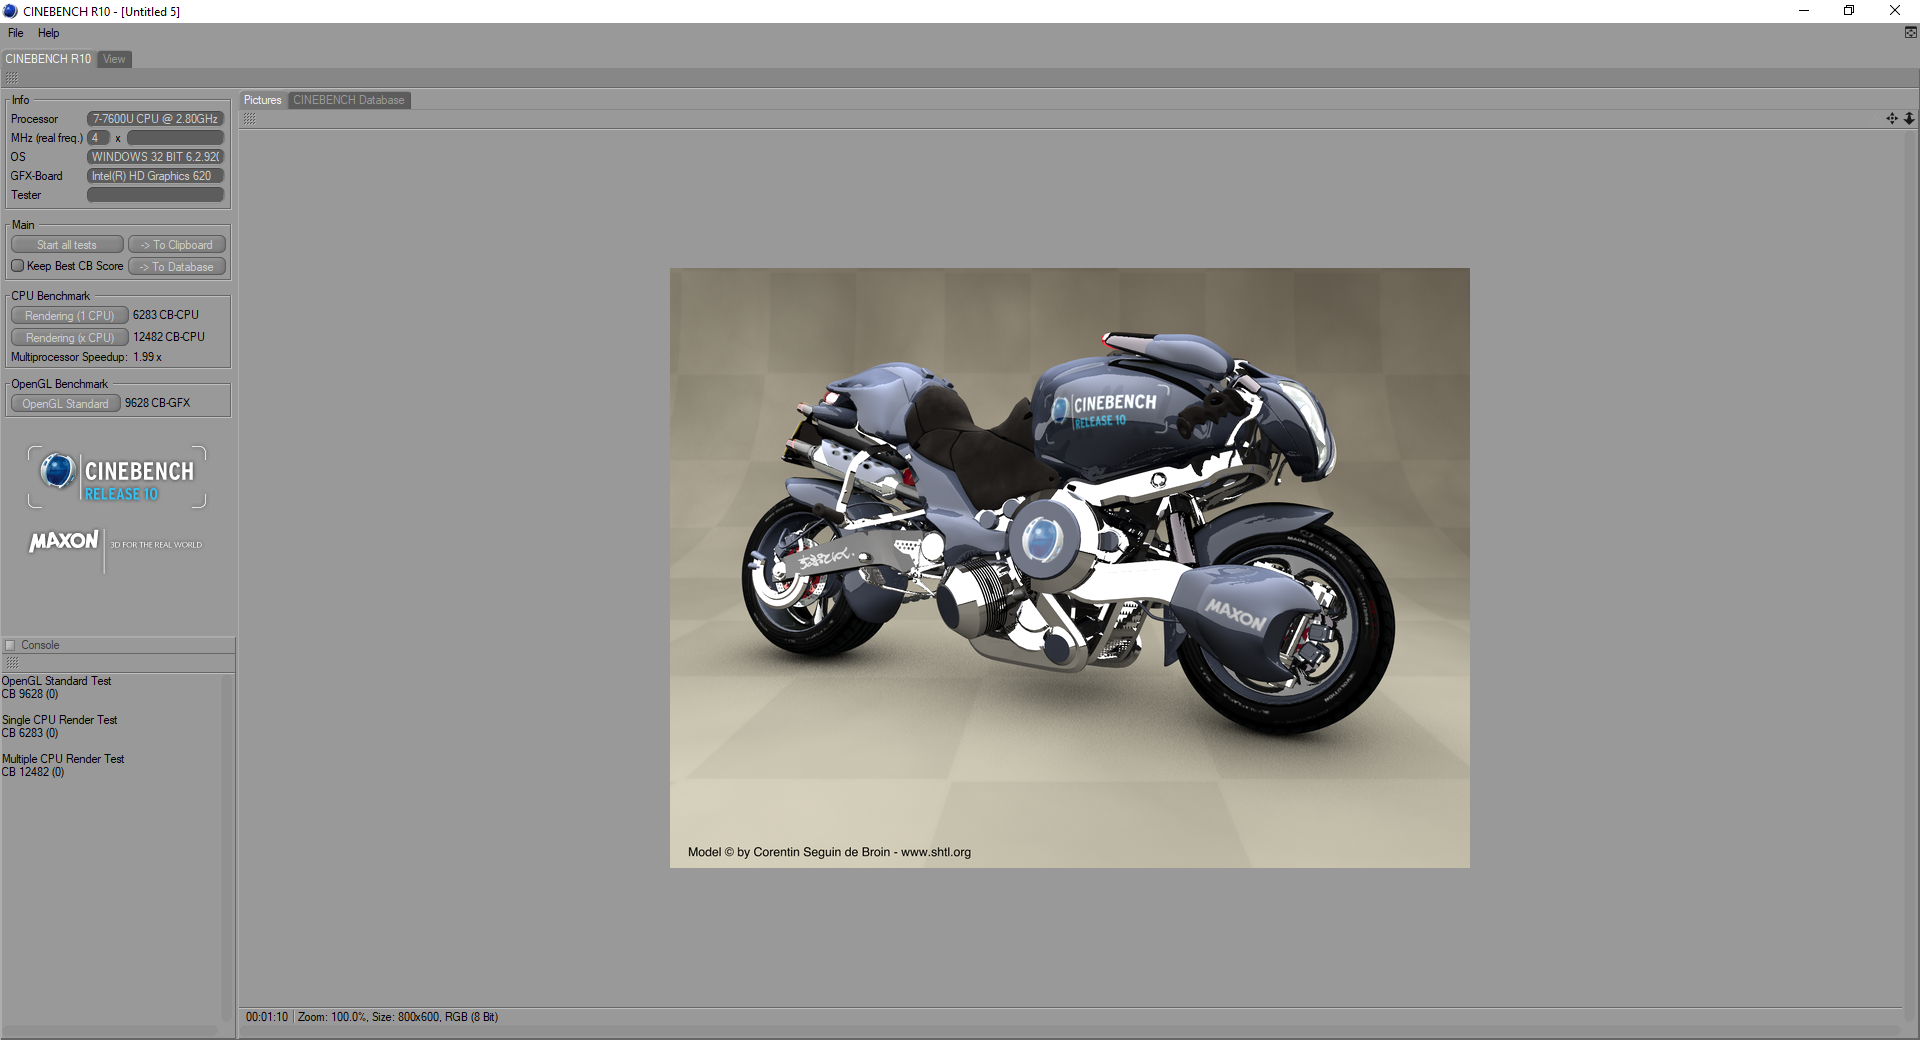
Processors ranging from 6th-generation Intel Core i3 up to 7th-generation Intel Core i7 are available for configuration. Our review unit was equipped with a Core i7-7600U, which matches the Toshiba Portege X30-D for the highest-end CPU in our review field. The Core i7-7600U is a popular choice in modern notebooks, featuring two cores and clocked at 2.8 – 3.9 GHz; that makes it the fastest 7th-generation dual-core CPU currently available (all CPU options for the 7380 are dual-core; no 8th-generation processors are configurable).
In terms of processor performance, the Dell Latitude 7380 is the fastest machine in our current lineup, though it’s really closer to the upper-middle of the pack when all benchmarks to date for this CPU are taken into account. The Latitude demolishes all other competitors in today’s comparison field in single-core performance thanks to its very high 3.9 GHz turbo clock rate, and in multi-core performance, it’s still at the top of the list (though by a smaller margin).
Sustained performance is actually very good apart from an early drop (by around 10%) for a couple of minutes. In our Cinebench R15 loop test, we saw an initial (highest) score of 359 before the frequency began dropping to 324/325 a couple of runs later. After this initial hiccup, however, it’s right back into the 345 – 349 range, which is very close to the original high score (within 3%). This is a very good result for a small notebook.


| wPrime 2.10 - 1024m | |
| Dell Latitude 13 7370 | |
| Toshiba Portege X30-D (PT274U-01N001) | |
| Dell Latitude 13 7380 | |
* ... smaller is better
System Performance
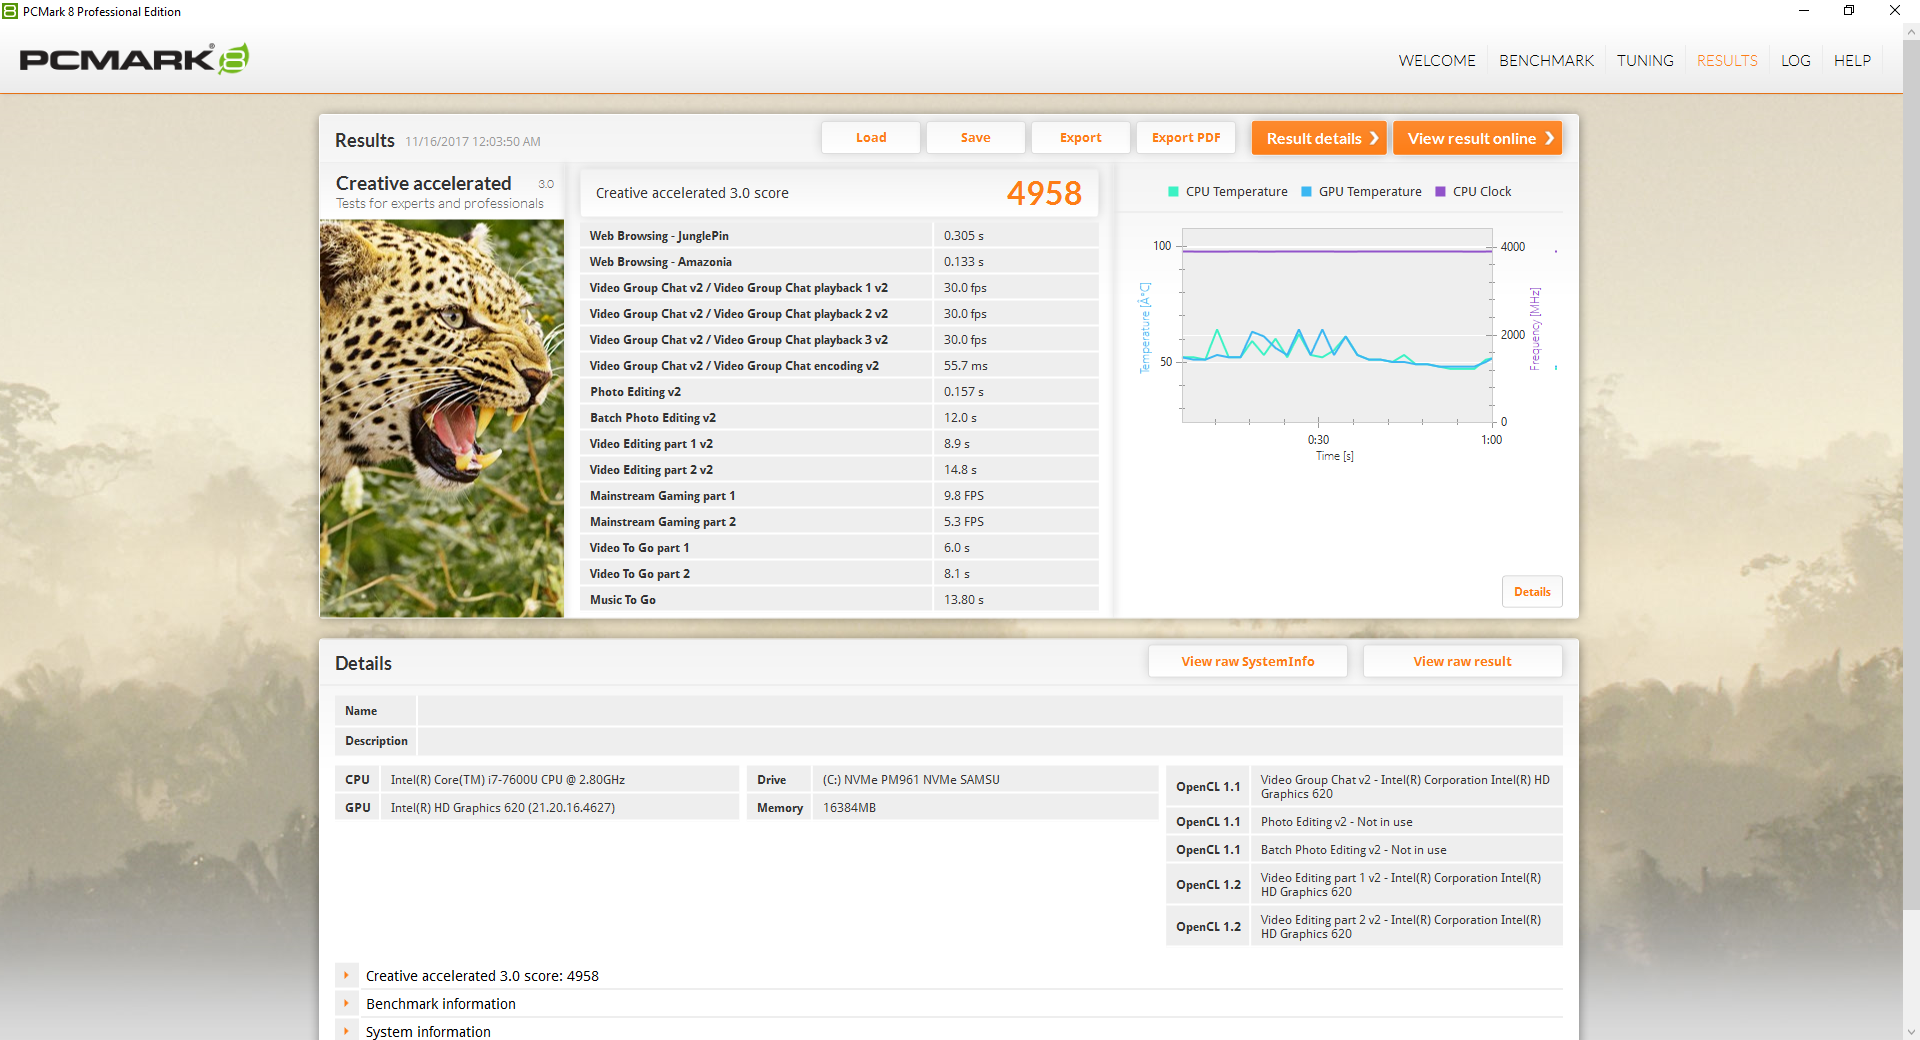
Our general system performance results tell a similar story to those of our Processor benchmarks. The Latitude 7380 once again manages top spot in all PCMark 8 and 10 benchmarks, with a very good PCMark 10 score of 3711 points accompanying great PCMark 8 results, including a Work Score of 5060 points. Of course, CPU speed is a factor here, but it’s the combination with the very fast Samsung NVMe SSD which really makes the difference. We’ll cover that in our next section.

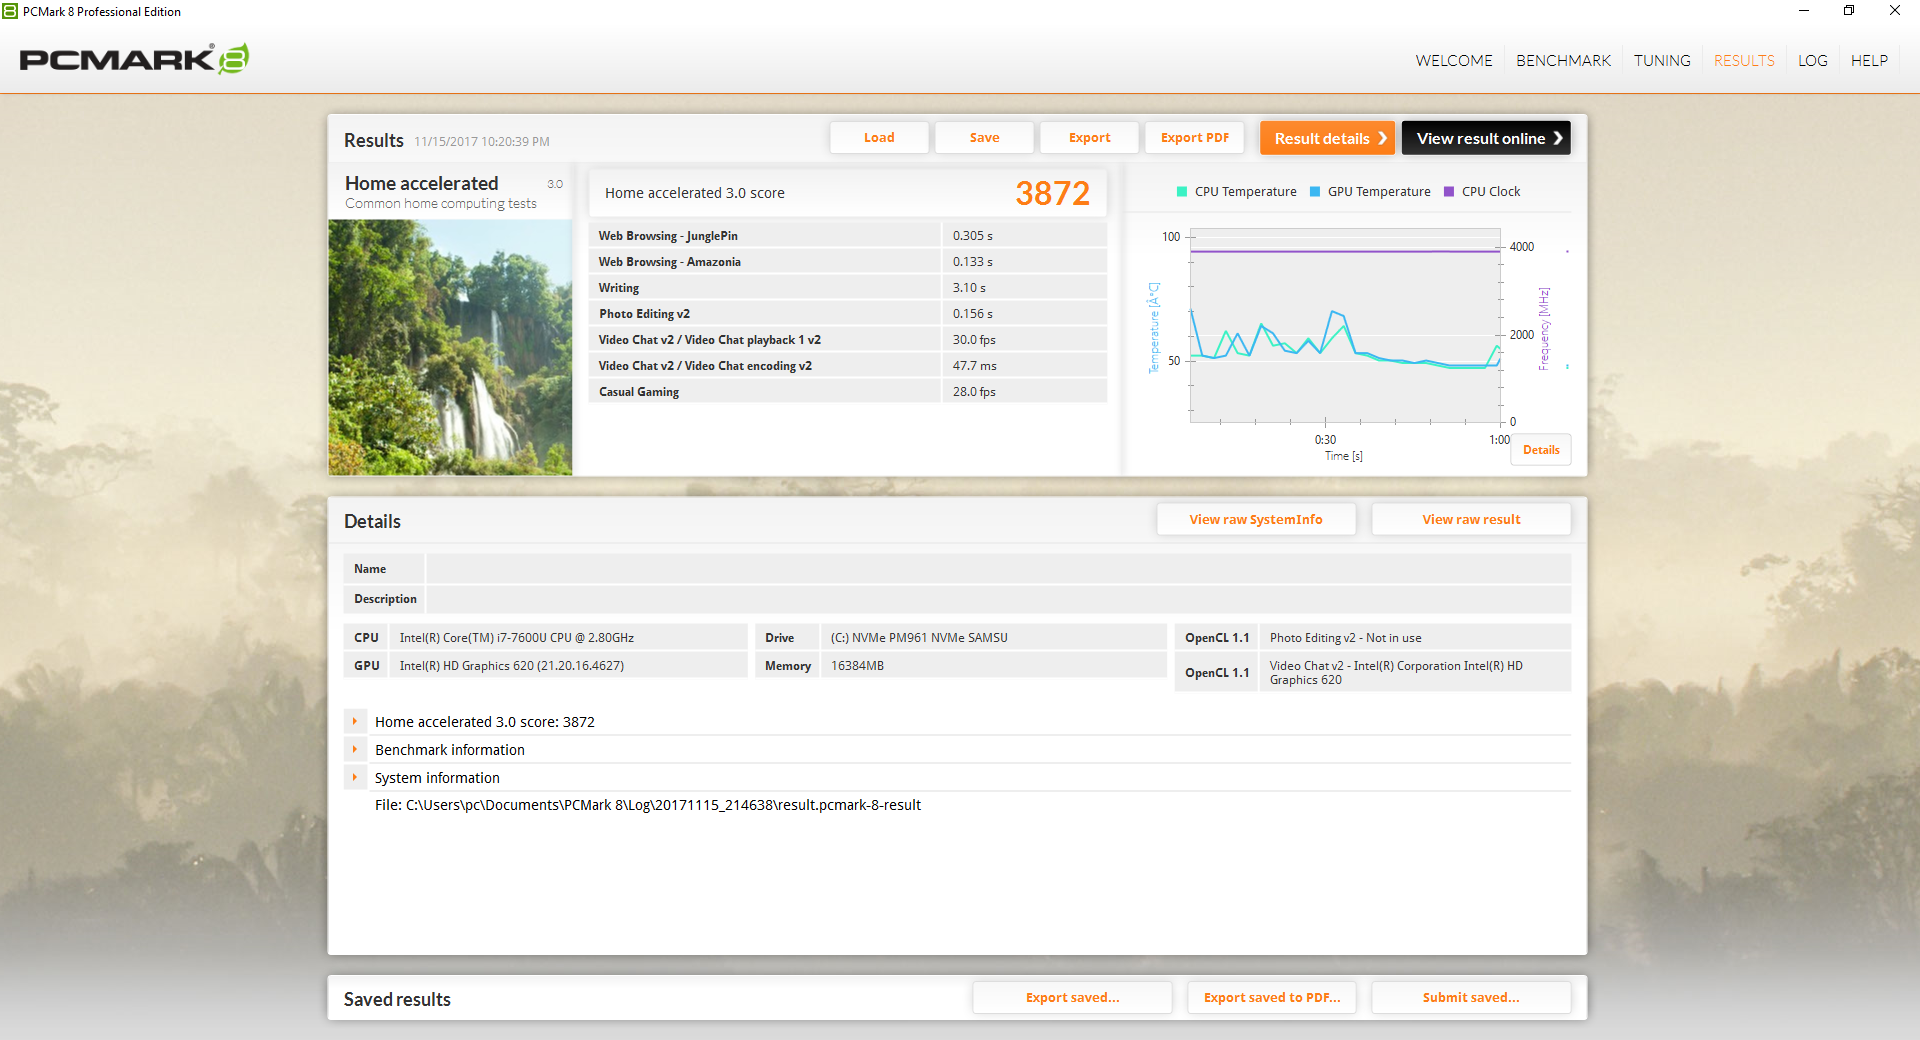

| PCMark 8 Home Score Accelerated v2 | 3872 points | |
| PCMark 8 Creative Score Accelerated v2 | 4958 points | |
| PCMark 8 Work Score Accelerated v2 | 5060 points | |
| PCMark 10 Score | 3711 points | |
Help | ||
Storage Devices
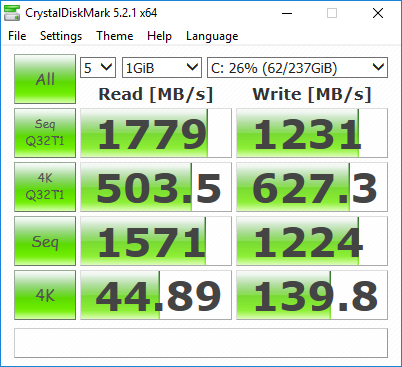
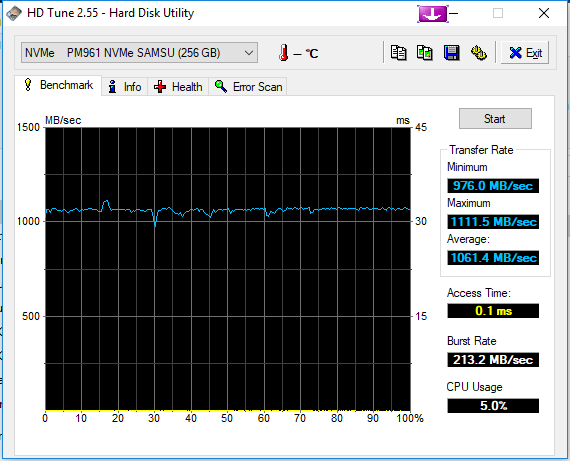
The Samsung PM961 NVMe SSD is essentially the OEM client version of the 960 EVO, and consequently, it is among the fastest NVMe SSDs currently widely available. With a total score of 4063 in AS SSD (2251 / 690 in read / write, respectively), as well as sequential read speeds (reported by CrystalDiskMark 5.2) of 1571 / 1224 MB/s read/write, this drive maxes out the potential of the 7380’s PCIe 2x interface (according to Dell, for PCIe 4x functionality, you’d need to step back to a Latitude 5000 series with an H-series quad-core CPU instead). Despite the fact that performance could be even better under 4 lanes, the Latitude 7380 still compares favorably with the rest of today’s competitors, beating them in most storage benchmarks (the Toshiba may have been hobbled by driver issues given its 4K Write score, so take those results with a grain of salt—but suffice it to say that it, the Latitude, and the EliteBook 840 G4 are all very fast performers).


| Dell Latitude 13 7380 Samsung PM961 MZVLW256HEHP | Toshiba Portege X30-D (PT274U-01N001) Samsung PM961 MZVLW256HEHP | Lenovo ThinkPad 13-20J2S00G00 Toshiba NVMe THNSF5512GPUK | Lenovo ThinkPad X1 Carbon 2017-20HR0021GE Toshiba THNSF5256GPUK | HP EliteBook 840 G4-Z2V49ET ABD Samsung PM961 MZVLW256HEHP | |
|---|---|---|---|---|---|
| AS SSD | -676% | -35% | -48% | -3% | |
| Copy Game MB/s (MB/s) | 664 | 447.8 -33% | 229 -66% | 355.1 -47% | |
| Copy Program MB/s (MB/s) | 451 | 316.3 -30% | 172.4 -62% | 269.7 -40% | |
| Copy ISO MB/s (MB/s) | 1250 | 382.9 -69% | 623 -50% | 735 -41% | |
| Score Total (Points) | 4063 | 2687 -34% | 1256 -69% | 1398 -66% | 3006 -26% |
| Score Write (Points) | 690 | 162 -77% | 557 -19% | 337 -51% | 767 11% |
| Score Read (Points) | 2251 | 1723 -23% | 481 -79% | 726 -68% | 1524 -32% |
| Access Time Write * (ms) | 0.028 | 2.01 -7079% | 0.033 -18% | 0.034 -21% | 0.027 4% |
| Access Time Read * (ms) | 0.045 | 0.05 -11% | 0.076 -69% | 0.102 -127% | 0.044 2% |
| 4K-64 Write (MB/s) | 484.5 | 125.8 -74% | 361.5 -25% | 149.6 -69% | 510 5% |
| 4K-64 Read (MB/s) | 2072 | 1483 -28% | 264.7 -87% | 526 -75% | 1215 -41% |
| 4K Write (MB/s) | 125.1 | 1.2 -99% | 101.9 -19% | 109.4 -13% | 140.2 12% |
| 4K Read (MB/s) | 45.59 | 42.8 -6% | 38.7 -15% | 34.34 -25% | 49.21 8% |
| Seq Write (MB/s) | 805 | 352.7 -56% | 935 16% | 775 -4% | 1167 45% |
| Seq Read (MB/s) | 1330 | 1972 48% | 1775 33% | 1649 24% | 2603 96% |
* ... smaller is better

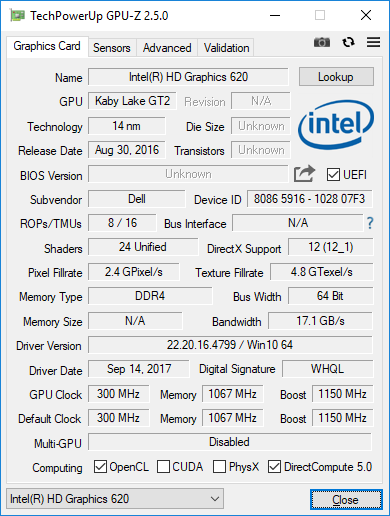
GPU Performance
The integrated Intel HD Graphics 620 GPU accompanies the Core i7-7600U in the Latitude 7380, and in our benchmarks, results are good overall for its size and class. The 7380 comes in near the top of most of our benchmarks, with the Lenovo ThinkPad X1 Carbon beating it by around 12% in both 3DMark Fire Strike and 3DMark 11 (in spite of its slower i5-7200U CPU). The reasons for the performance discrepancy likely lie with thermal management and/or firmware-level limitations, but we’ll examine those in the next section.
The Latitude 7380 is not a gaming machine, and as such, only older games should be attempted (at low settings to boot).


| 3DMark | |
| 1280x720 Cloud Gate Standard Graphics | |
| Dell Latitude 13 7380 | |
| Lenovo ThinkPad X1 Carbon 2017-20HR0021GE | |
| Toshiba Portege X30-D (PT274U-01N001) | |
| HP EliteBook 840 G4-Z2V49ET ABD | |
| Dell Latitude 13 7370 | |
| 1920x1080 Fire Strike Graphics | |
| Lenovo ThinkPad X1 Carbon 2017-20HR0021GE | |
| Dell Latitude 13 7380 | |
| Toshiba Portege X30-D (PT274U-01N001) | |
| HP EliteBook 840 G4-Z2V49ET ABD | |
| Dell Latitude 13 7370 | |
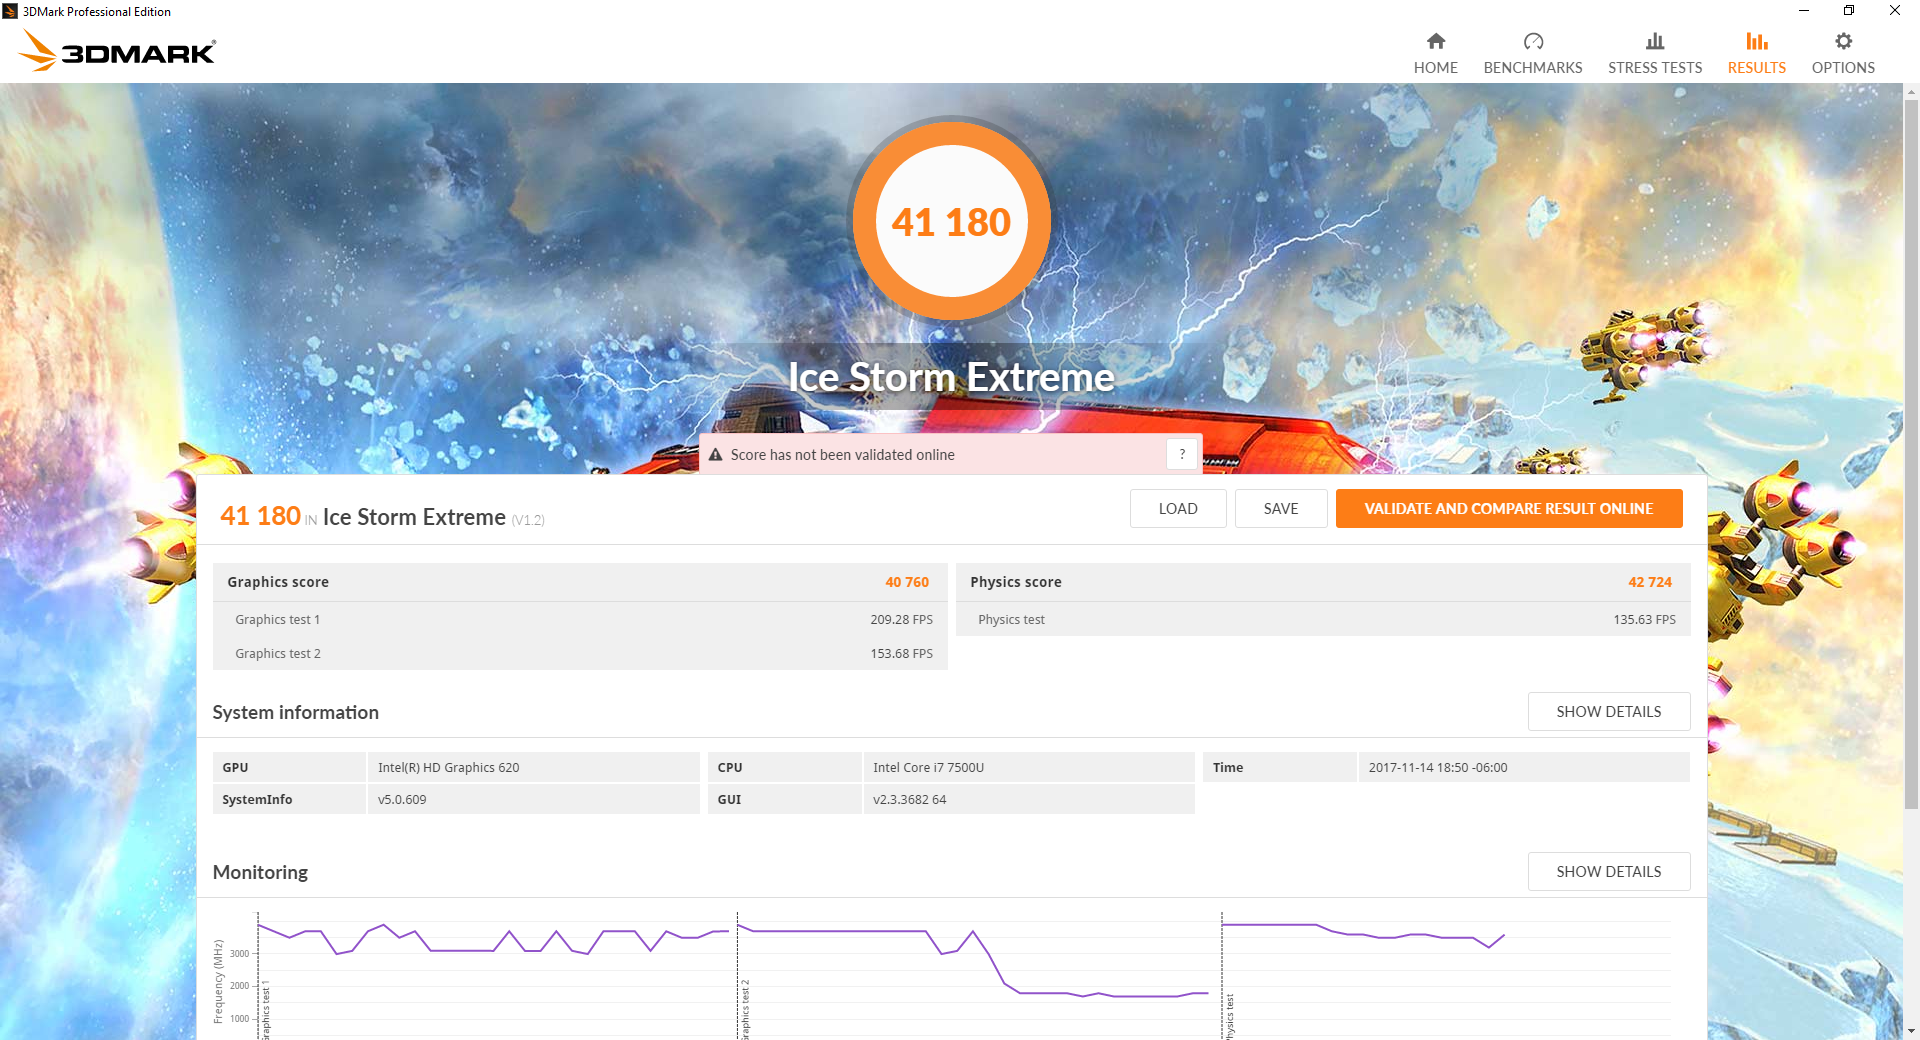
| 1920x1080 Ice Storm Extreme Graphics | |
| Lenovo ThinkPad X1 Carbon 2017-20HR0021GE | |
| Dell Latitude 13 7380 | |
| Toshiba Portege X30-D (PT274U-01N001) | |
| Dell Latitude 13 7370 | |
| 3DMark 06 Standard Score | 8937 points | |
| 3DMark 11 Performance | 1762 points | |
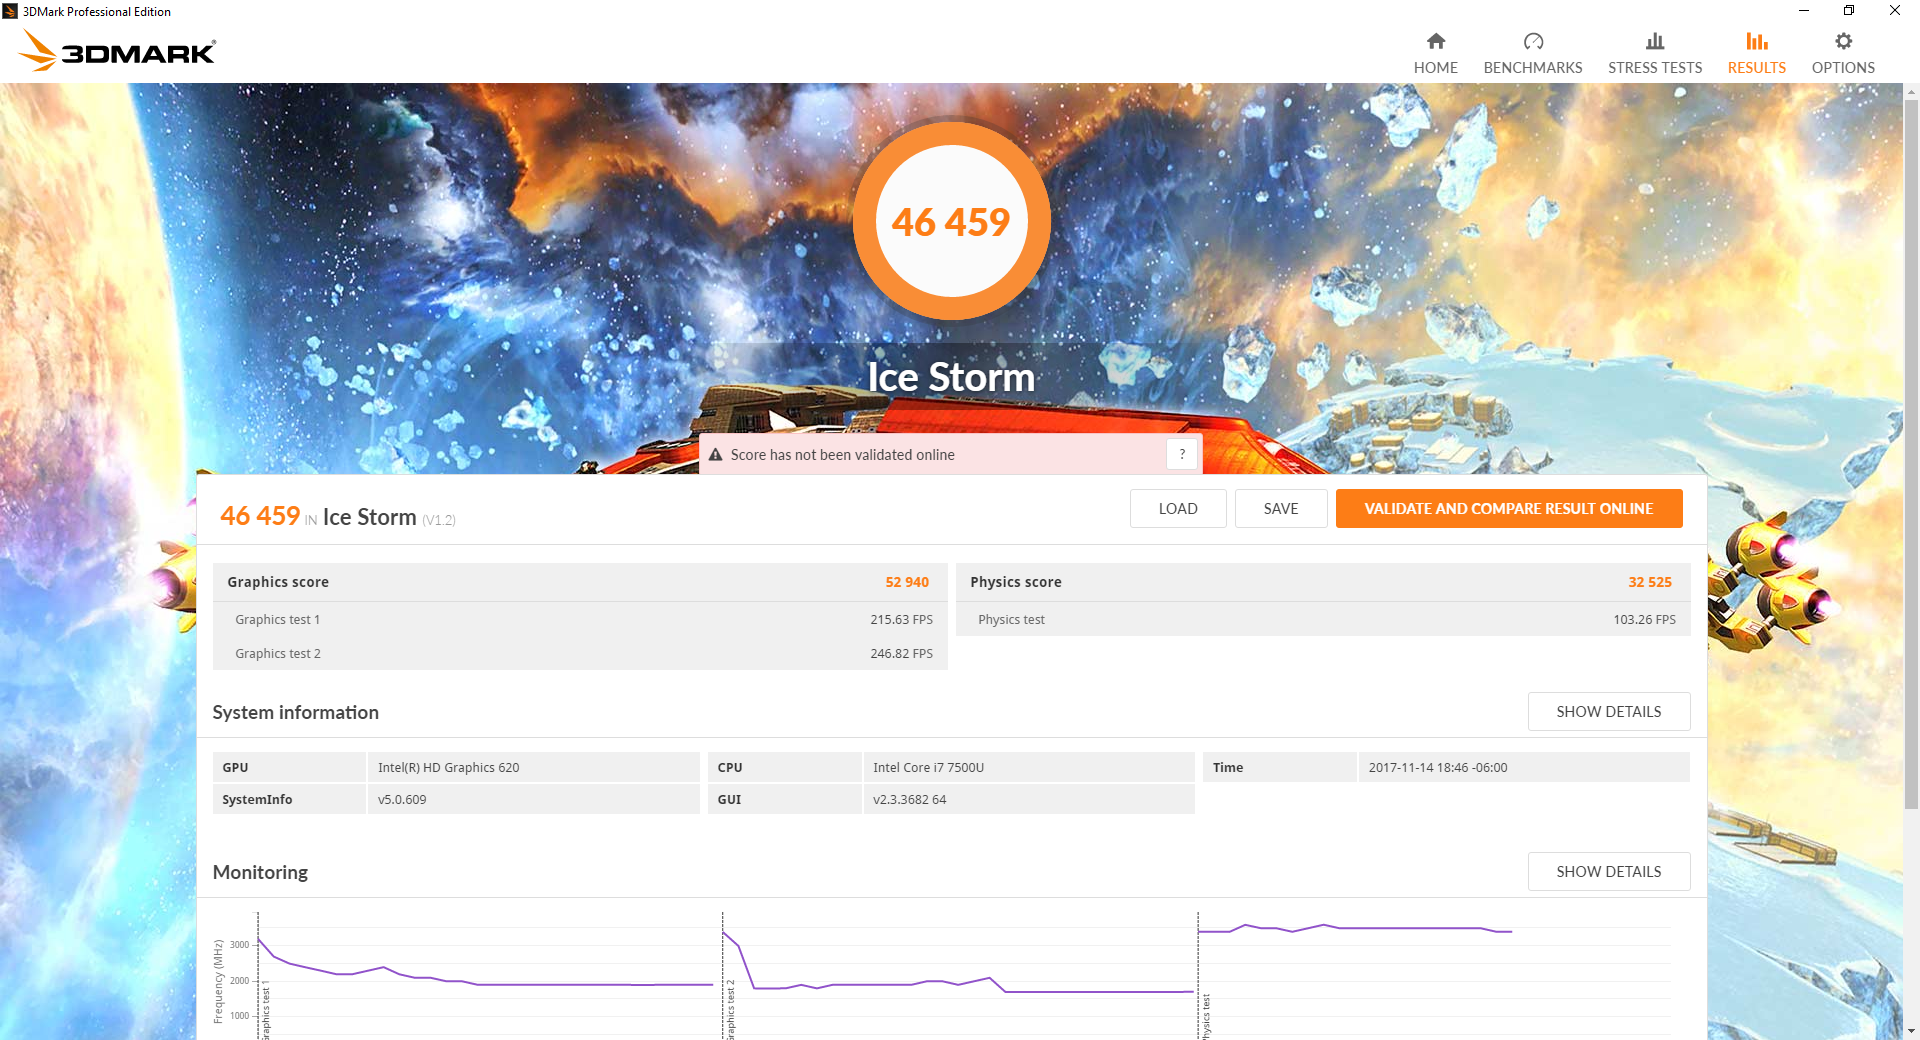
| 3DMark Ice Storm Standard Score | 46459 points | |
| 3DMark Cloud Gate Standard Score | 6363 points | |
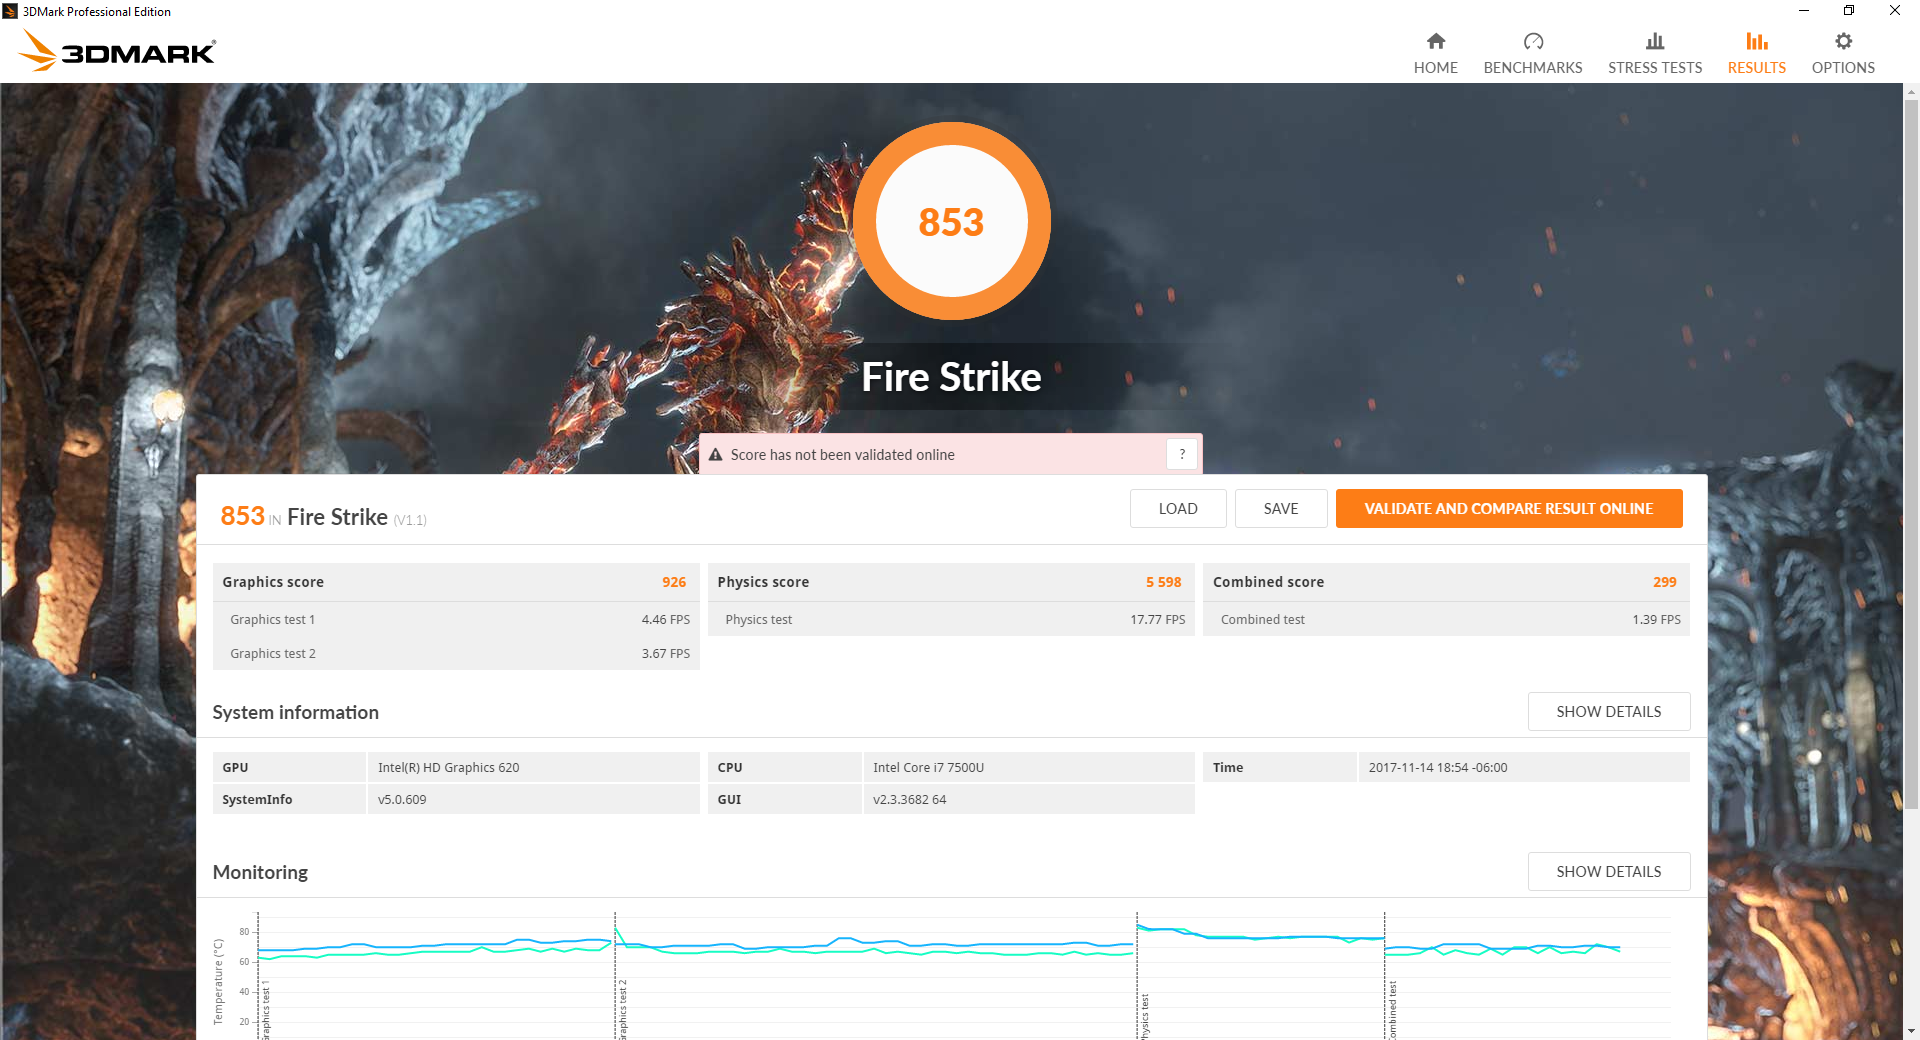
| 3DMark Fire Strike Score | 853 points | |
| 3DMark Fire Strike Extreme Score | 388 points | |
Help | ||
| low | med. | high | ultra | |
|---|---|---|---|---|
| BioShock Infinite (2013) | 44 | 27 | 22 | 7 |
Stress Test
Our CPU stress test helps explain the behavior we saw earlier in the Cinebench R15 multi-CPU loop test: While CPU initially achieves a full turbo clock rate of 3.9 GHz, it soon (15 seconds or so) later retreats to between 3.3 and 3.4 GHz after core temperatures reach 90 °C. Temperatures remain stable thereafter at between 74 °C and 76 °C. GPU stress sees clock rates near 1150 MHz (with occasional dips to 900 MHz) for the first minute or so of operation; soon after that, the frequency stabilizes at around 1100 MHz with spikes up to 1150 MHz. Temperatures once again are around the 74 °C mark.
Combined stress provokes CPU frequencies of 1.7 GHz paired with 1000 MHz for the GPU. The former is absolutely throttling, since the base frequency for the Core i7-7600U is 2.8 GHz—but the GPU is still well above its base clock rate of 300 MHz.


| CPU Clock (GHz) | GPU Clock (MHz) | Average CPU Temperature (°C) | Average GPU Temperature (°C) | |
| Prime95 Stress | 3.4 | - | 75 | - |
| FurMark Stress | - | 1100 | - | 74 |
| Prime95 + FurMark Stress | 1.7 | 1000 | 74 | 74 |
Emissions
System Noise
Many recent Dell laptops have struggled with electronic noise (commonly referred to as coil whine), and the 7380 is also susceptible to this flaw. It’s not terribly noticeable in most cases (it’s far better than some other recent models), but the 7380’s noise manifests as a sort of static buzz. It seems to be persistent whether the machine is plugged in or running on battery power.
Fortunately, apart from this drawback, the Latitude 7380 is otherwise a very quiet device. The fan doesn’t even run while idling, and even under load, the maximum noise level is still just 7.4 dB(A) above ambient levels at 35.4 dB(A). Load averages are even more reasonable; we measured a remarkably quiet 30.6 dB(A).
Noise level
| Idle |
| 28 / 28 / 29.6 dB(A) |
| Load |
| 30.6 / 35.4 dB(A) |
 | ||
30 dB silent 40 dB(A) audible 50 dB(A) loud |
||
min: | ||

| Dell Latitude 13 7380 HD Graphics 620, i7-7600U, Samsung PM961 MZVLW256HEHP | Toshiba Portege X30-D (PT274U-01N001) HD Graphics 620, i7-7600U, Samsung PM961 MZVLW256HEHP | Lenovo ThinkPad 13-20J2S00G00 HD Graphics 620, i7-7500U, Toshiba NVMe THNSF5512GPUK | Lenovo ThinkPad X1 Carbon 2017-20HR0021GE HD Graphics 620, i5-7200U, Toshiba THNSF5256GPUK | HP EliteBook 840 G4-Z2V49ET ABD HD Graphics 620, i5-7200U, Samsung PM961 MZVLW256HEHP | |
|---|---|---|---|---|---|
| Noise | -2% | -1% | -7% | -7% | |
| off / environment * (dB) | 28 | 28.4 -1% | 29.1 -4% | 29.6 -6% | 31 -11% |
| Idle Minimum * (dB) | 28 | 28.4 -1% | 29.1 -4% | 29.6 -6% | 31 -11% |
| Idle Average * (dB) | 28 | 28.4 -1% | 29.1 -4% | 29.6 -6% | 31 -11% |
| Idle Maximum * (dB) | 29.6 | 28.4 4% | 29.1 2% | 32.2 -9% | 31 -5% |
| Load Average * (dB) | 30.6 | 33.2 -8% | 31.9 -4% | 34.2 -12% | 33.5 -9% |
| Load Maximum * (dB) | 35.4 | 37.9 -7% | 31.9 10% | 36.1 -2% | 33.7 5% |
* ... smaller is better
Temperature
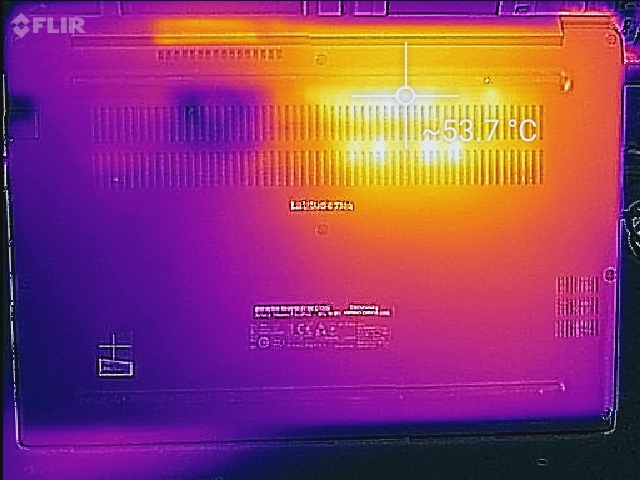
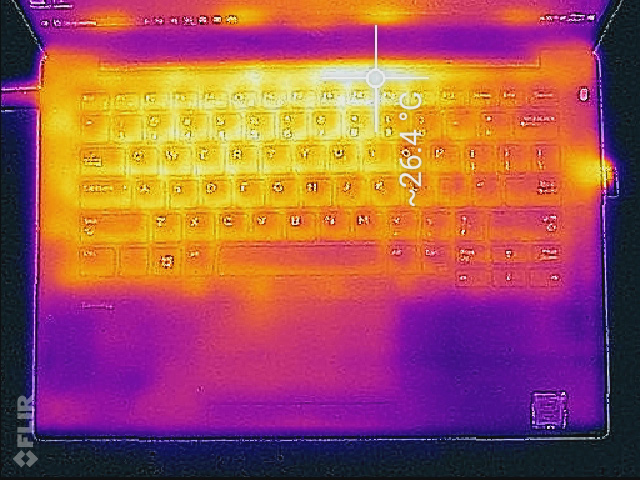
Despite the low fan noise levels, temperatures remain very good overall. Like the other Latitude 7000 series machines, heat exhausts both downward (behind the rear rubber foot) as well as into the hinge cavity, which is helpful in case one of the two openings happens to be obstructed. Under load, we recorded averages of 33 °C / 35.9 °C on top/bottom respectively, both very manageable values. Hot spots in the mid-40s C are the highest recorded numbers, located in the top-middle and top-right quadrants of the machine’s underside near the exhaust vent. Idle temperatures, meanwhile, were only in the mid-20s C, just 4 to 6 degrees above room temperatures.
These results are better than either ThinkPad in our comparison field—these devices struggle with comparatively more heat in the palm rest/keyboard areas—but the HP EliteBook 840 G4 is best of all here, with temperatures only around 10 to 11 degrees above ambient values even while under load. Still, the 7380 performs admirably for its size and speed.
(±) The maximum temperature on the upper side is 41 °C / 106 F, compared to the average of 34.3 °C / 94 F, ranging from 21.2 to 62.5 °C for the class Office.
(-) The bottom heats up to a maximum of 45.6 °C / 114 F, compared to the average of 36.8 °C / 98 F
(+) In idle usage, the average temperature for the upper side is 24.2 °C / 76 F, compared to the device average of 29.5 °C / 85 F.
(+) The palmrests and touchpad are cooler than skin temperature with a maximum of 28.6 °C / 83.5 F and are therefore cool to the touch.
(±) The average temperature of the palmrest area of similar devices was 27.5 °C / 81.5 F (-1.1 °C / -2 F).


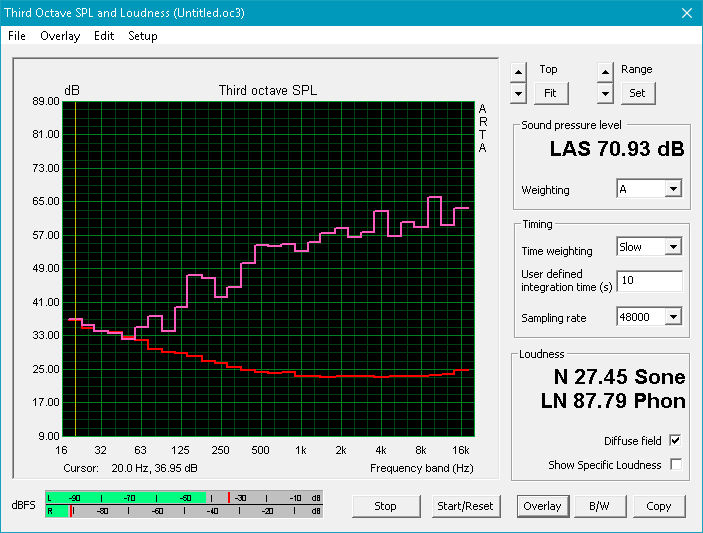
Speakers
The Latitude 7380’s speakers manage enough for basic business use, but they are hardly ideal for multimedia consumption such as music playback. Volume levels are fairly low at 70.93 dB—not as low as the EliteBook 840 (66 dB), but the sound also isn’t as linear that that of the latter. Meanwhile, naturally, bass is almost nonexistent. No post-processing software was included on our review unit.
Dell Latitude 13 7380 audio analysis
(-) | not very loud speakers (70.9 dB)
Bass 100 - 315 Hz
(±) | reduced bass - on average 12.8% lower than median
(±) | linearity of bass is average (12.8% delta to prev. frequency)
Mids 400 - 2000 Hz
(+) | balanced mids - only 1.9% away from median
(±) | linearity of mids is average (7.2% delta to prev. frequency)
Highs 2 - 16 kHz
(+) | balanced highs - only 4.5% away from median
(±) | linearity of highs is average (12.1% delta to prev. frequency)
Overall 100 - 16.000 Hz
(±) | linearity of overall sound is average (22.8% difference to median)
Compared to same class
» 62% of all tested devices in this class were better, 8% similar, 30% worse
» The best had a delta of 7%, average was 21%, worst was 53%
Compared to all devices tested
» 67% of all tested devices were better, 6% similar, 28% worse
» The best had a delta of 4%, average was 24%, worst was 134%
HP EliteBook 840 G4-Z2V49ET ABD audio analysis
(-) | not very loud speakers (66 dB)
Bass 100 - 315 Hz
(±) | reduced bass - on average 14.6% lower than median
(±) | linearity of bass is average (7.8% delta to prev. frequency)
Mids 400 - 2000 Hz
(+) | balanced mids - only 0.7% away from median
(+) | mids are linear (3.4% delta to prev. frequency)
Highs 2 - 16 kHz
(+) | balanced highs - only 3.9% away from median
(+) | highs are linear (5.4% delta to prev. frequency)
Overall 100 - 16.000 Hz
(±) | linearity of overall sound is average (16.2% difference to median)
Compared to same class
» 18% of all tested devices in this class were better, 6% similar, 76% worse
» The best had a delta of 7%, average was 21%, worst was 53%
Compared to all devices tested
» 25% of all tested devices were better, 5% similar, 69% worse
» The best had a delta of 4%, average was 24%, worst was 134%
Frequency Comparison (Checkbox selectable!)
Graph 1: Pink Noise 100% Vol.; Graph 2: Audio off
Energy Management
Power Consumption
The Dell Latitude 7380 proves to be quite an efficient machine, with idle averages of just 5.5 W (max: 6.1 W) and a load average of only 29.5 W. Those idle values are significantly below that of the Toshiba Portege—which features the same CPU and SSD, as well as a similar display—though load averages and maximums were marginally higher. The rest of the competitors are higher across the board. The included 65 W power adapter easily supplies the requisite power even under heavy load.
| Off / Standby | |
| Idle | |
| Load |
|
Key:
min: | |
| Dell Latitude 13 7380 i7-7600U, HD Graphics 620, Samsung PM961 MZVLW256HEHP, IPS, 1920x1080, 13.3" | Toshiba Portege X30-D (PT274U-01N001) i7-7600U, HD Graphics 620, Samsung PM961 MZVLW256HEHP, IPS, 1920x1080, 13.3" | Lenovo ThinkPad 13-20J2S00G00 i7-7500U, HD Graphics 620, Toshiba NVMe THNSF5512GPUK, IPS, LED, 1920x1080, 13.3" | Lenovo ThinkPad X1 Carbon 2017-20HR0021GE i5-7200U, HD Graphics 620, Toshiba THNSF5256GPUK, IPS, 1920x1080, 14" | HP EliteBook 840 G4-Z2V49ET ABD i5-7200U, HD Graphics 620, Samsung PM961 MZVLW256HEHP, TN, 1920x1080, 14" | |
|---|---|---|---|---|---|
| Power Consumption | -17% | -6% | -27% | -6% | |
| Idle Minimum * (Watt) | 3.2 | 4.6 -44% | 3.16 1% | 3.8 -19% | 2.9 9% |
| Idle Average * (Watt) | 5.5 | 7.6 -38% | 5.9 -7% | 7.1 -29% | 5.6 -2% |
| Idle Maximum * (Watt) | 6.1 | 8.2 -34% | 6.5 -7% | 8.3 -36% | 8.15 -34% |
| Load Average * (Watt) | 29.5 | 23.8 19% | 30.6 -4% | 34.2 -16% | 30.6 -4% |
| Load Maximum * (Watt) | 32 | 28 12% | 35.8 -12% | 43.3 -35% | 31 3% |
* ... smaller is better
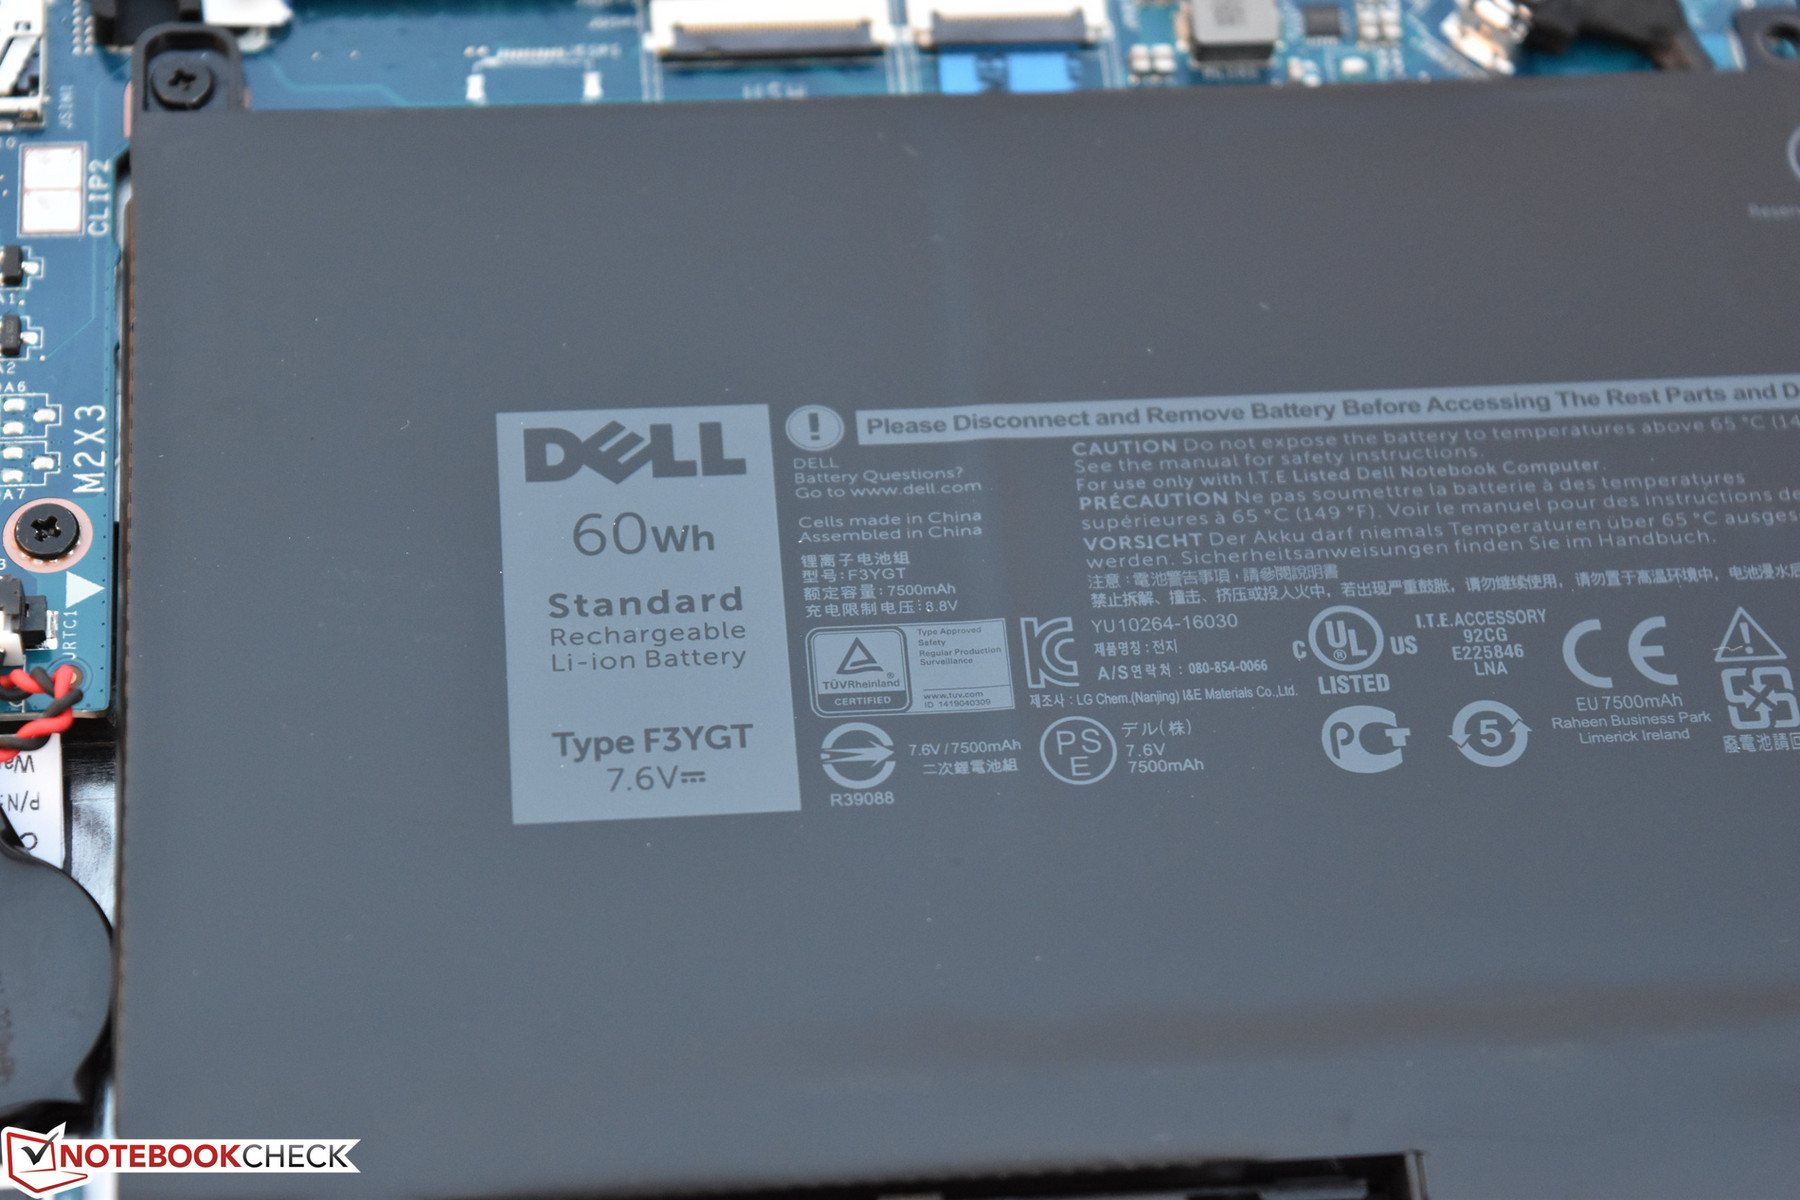
Battery Life
Taken in conjunction with its frugal power consumption, the Latitude 13 7380’s massive 60 Wh (7500 mAh) battery presages terrific battery life. Indeed, the device lasted some 10 hours and 30 minutes during our wi-fi surfing benchmark, as well as a stunning 26 hours and 34 minutes in our Battery Eater Readers’ (minimum load) test. Both of these results are miles ahead of the competition, with only the ThinkPad X1 Carbon and HP EliteBook 840 coming anywhere close to the web-surfing result (with 9:07 and 9:31, respectively).
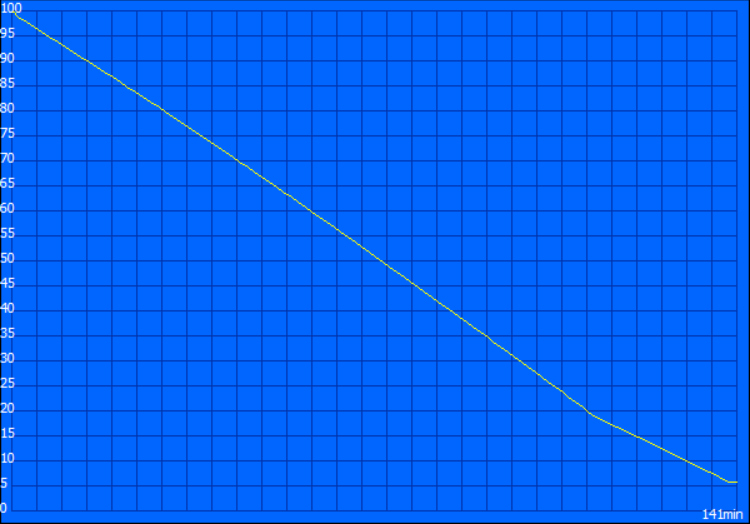
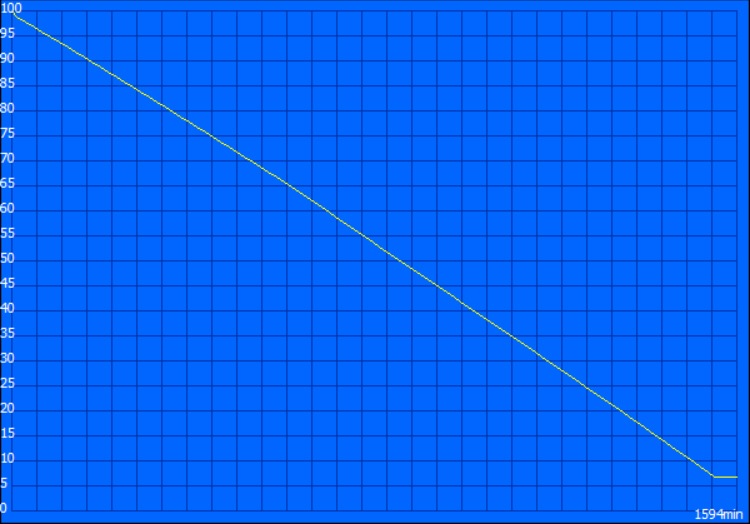
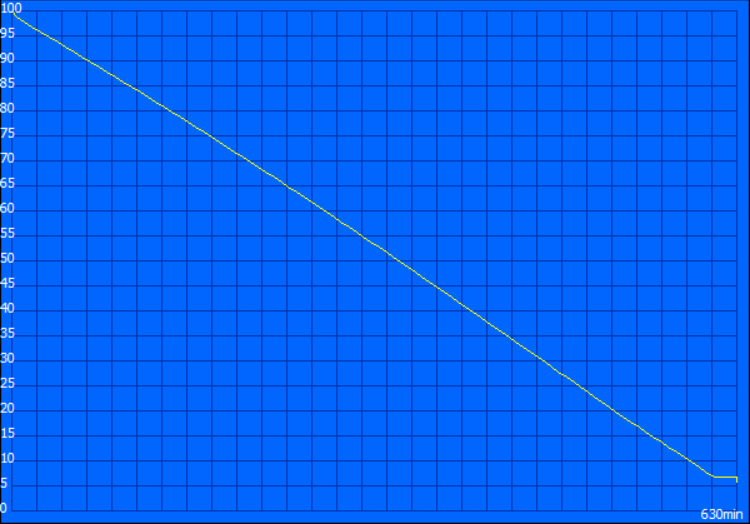
| Dell Latitude 13 7380 i7-7600U, HD Graphics 620, 60 Wh | Toshiba Portege X30-D (PT274U-01N001) i7-7600U, HD Graphics 620, 48 Wh | Lenovo ThinkPad 13-20J2S00G00 i7-7500U, HD Graphics 620, 42 Wh | Lenovo ThinkPad X1 Carbon 2017-20HR0021GE i5-7200U, HD Graphics 620, 57 Wh | HP EliteBook 840 G4-Z2V49ET ABD i5-7200U, HD Graphics 620, 51 Wh | Dell Latitude 13 7370 6Y57, HD Graphics 515, 34 Wh | |
|---|---|---|---|---|---|---|
| Battery runtime | -31% | -37% | -26% | -3% | -28% | |
| Reader / Idle (h) | 26.6 | 15 -44% | 15.1 -43% | 13.7 -48% | 19.3 -27% | 9.8 -63% |
| WiFi v1.3 (h) | 10.5 | 7.2 -31% | 7.9 -25% | 9.1 -13% | 9.5 -10% | 6.1 -42% |
| Load (h) | 2.4 | 2 -17% | 1.4 -42% | 2 -17% | 3.1 29% | 2.9 21% |
Pros
Cons
Verdict

Dell’s Latitude 7380 splits the difference in screen size between their existing Latitude 7000 series flagships, the 7280 and 7480—but in many ways, it’s less of a compromise and more of an intra-generational evolution. Taking a page out of the XPS 13’s book, the 7380 crams a 13.3-inch display into the footprint (and, for the most part, the entire body) of the existing 12.5-inch 7280—thus, in many ways, replacing it. Best of all, there truly are no major negatives to this approach: case stability is still very good overall, and although the display lid can’t quite match the rigidity of the XPS 13’s aluminum frame, the magnesium construction of the Latitude’s is by no means fragile.
Dell’s Latitude 7380 splits the difference in screen size—but in many ways, it’s less of a compromise and more of an intra-generational evolution. It starts with the foundation laid by the consumer-grade XPS 13, yet it provides all of the business sensibilities implied by the Latitude brand.
We also were pleased with the 7380’s excellent system performance and mostly consistent CPU speeds under load; taken alongside the low surface temperatures and largely unobtrusive fan noise, the results are impressive for a machine of this size. Even more impressive were our battery tests, where we managed over ten hours of web surfing on a single charge. To top it all off, the 1080p IPS display is also above average—though it does require professional calibration for any degree of color accuracy.
Our only major gripes are the moderately noticeable electronic noise/coil whine, the inaccuracy of the display out of the box, and the aforementioned high price of $2,178. It's also slightly disappointing that only single-channel memory is supported, though the total capacity of 16 GB is plenty for this class of notebook. Worthwhile competitors from other manufacturers include the Lenovo ThinkPad X1 Carbon, HP EliteBook 840 G4, and Toshiba Portege X30-D, some of which are less expensive than the Latitude, but all which are accompanied by their own unique sets of pros and cons.
Why choose the Latitude 7380 when Dell already produces such an excellent (and similar) high-end ultraportable notebook in its XPS 13? Mostly due to the business sensibilities which are implied by the Latitude brand. Apart from its trademark subtle, matte black styling, the 7380 provides a superior keyboard, a touchpad with separate physical buttons, an Ethernet port, a longer warranty, and far more flexible maintenance options. It costs quite a bit more than the XPS as well, but it’s a small price to pay if it gets the job done.
Dell Latitude 13 7380
- 12/06/2017 v6 (old)
Steve Schardein
Price comparison
