Notebookcheck Logo

Intel Core i7-1060G7 vs Apple A13 Bionic vs Intel Core i3-1000NG4

Intel Core i7-1060G7

► remove from comparison Intel i7-1060G7

The Intel Core i7-1060G7 is a power efficient quad-core SoC for laptops and Ultrabooks based on the Ice -Lake-Y generation that was announced in Mai 2019 (Computex). It integrates four Sunnycove processor cores (8 threads thanks to HyperThreading) clocked at 1 (base) - 3.8 (single core Turbo) GHz. All four cores can turbo up to 3.4 GHz using Turbo Boost. According to Intel the Sunnycove cores achieve 18% more IPCs (Instructions per Clock).

Combined with the two additional cores, the previous Y-series dual core processors (Amber Lake-Y) should be always slower. Short burst performance should be excellent, long workloads will depend on the TDP settings and cooling solution in the laptop / tablet.´

The biggest improvement for Ice-Lake is the integrated Gen 11 graphics card called Iris Plus Graphics. The Core i7-1060G7 integrates the biggest G7 variant with 64 CUs clocked at 300 - 1100 MHz. The Iris Plus G7 should be twice as fast as the predecessors and best the AMD Vega 10 GPU in current Ryzen APUs. However, in the Y-series the gaming performance will be again depending on the cooling solution and may degrade clearly over time (compared to the Core i7-1065G7 with 15 - 25 Watt e.g.).

Other improvements for Ice Lake are the AI hardware acceleration and the partial integration of Thunderbolt and Wifi 6 in the chip. The integrated DDR4 memory controller supports modules with up to 3200 MHz (and LPDDDR4 3733).

The Core i7-1060G7 is produced in the new 10nm process at Intel (2nd generation) that should offer a comparable performance to the 7nm process at TSMC. The TDP is specified at 9 Watts and therefore the CPU can be used in thin and light laptops. Intel offers a configurable TDP of up to 12 Watts for the partners resulting in significant performance differences (due to longer periods of Turbo Boost).

Apple A13 Bionic

► remove from comparison Apple A13 Bionic

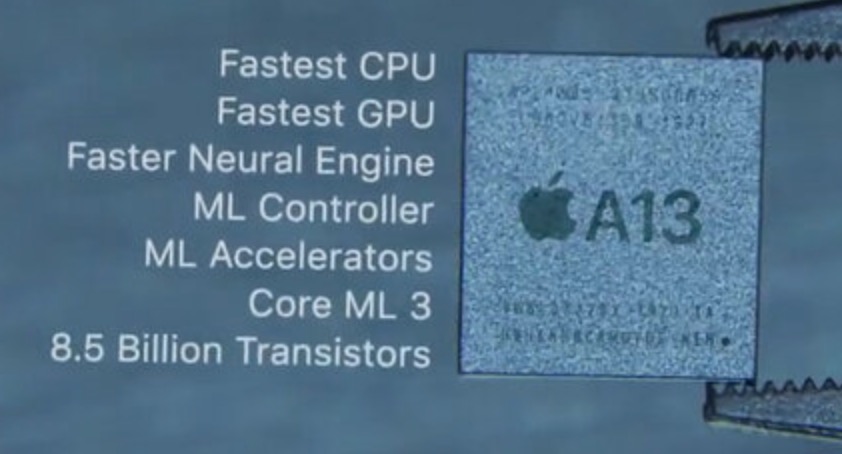
The Apple A13 Bionic is a System on a Chip (SoC) from Apple that is found in the iPhone 11 series. It was announced late 2019 and offers 6 cores divided in 2 performance cores and four power efficiency cores. Compared to the previous A12 Bionic, the A13 should offer a 20% improved CPU performance at 40% lower power (according to Apple).

With 8.5 billion transistors, the A13 Bionic is a big chip especially compared to the Snapdragon 835 (3 Billion) or a Skylake desktop quad-core Soc (1.75 Billion).

Intel Core i3-1000NG4

► remove from comparison Intel i3-1000NG4

The Intel Core i3-1000NG4 is a power efficient dual-core SoC for laptops and Ultrabooks based on the Ice -Lake-Y generation that was announced in Mai 2019 (Computex). It integrates two Sunnycove processor cores (4 threads thanks to HyperThreading) clocked at 1.1 (base) - 3.2 GHz (single and dual core Turbo). According to Intel the Sunnycove cores achieve 18% more IPCs (Instructions per Clock) and therefore the CPU performance should be similar to the higher clocked Amber-Lake-Y CPUs like the Core i5-8200Y (1.3 - 3.9 GHz).

Compared to the normal Core i3-1000G4, the i3-1000NG4 offers a smaller package size (22 x 16.5 versus 26.5 x 18.5 mm).

The biggest improvement for Ice-Lake is the integrated Gen 11 graphics card called Iris Plus Graphics. The Core i7-1030G4 integrates the smaller G4 variant with 48 of the 64 CUs clocked at 300 - 900 MHz.  However, in the Y-series the gaming performance will be again depending on the cooling solution and may degrade clearly over time (compared to the Core i5-1035G4 with 15 - 25 Watt e.g.). The faster graphics card is also the main difference to the similar named Core i3-1000G1.

Other improvements for Ice Lake are the AI hardware acceleration and the partial integration of Thunderbolt and Wifi 6 in the chip. The integrated DDR4 memory controller supports modules with up to 3200 MHz (and LPDDDR4 3733).

The Core i3-1000NG4 is produced in the new 10nm process at Intel that should offer a comparable performance to the 7nm process at TSMC. The TDP is specified at 9 Watts and therefore the CPU can be used in thin and light laptops with either a passive or an active cooling system.

ModelIntel Core i7-1060G7Apple A13 BionicIntel Core i3-1000NG4
SeriesIntel Ice LakeApple Apple A-SeriesIntel Ice Lake
CodenameIce Lake YLightning and ThunderIce Lake Y
Series: Ice Lake Ice Lake Y
Intel Core i7-1060NG71.2 - 3.8 GHz4 / 8 cores8 MB L3
Intel Core i7-1060G7 « 1 - 3.8 GHz4 / 8 cores8 MB L3
Intel Core i5-1030NG71.1 - 3.5 GHz4 / 8 cores6 MB L3
Intel Core i3-1000NG41.1 - 3.2 GHz2 / 4 cores4 MB L3
Intel Core i7-1060NG71.2 - 3.8 GHz4 / 8 cores8 MB L3
Intel Core i7-1060G71 - 3.8 GHz4 / 8 cores8 MB L3
Intel Core i5-1030NG71.1 - 3.5 GHz4 / 8 cores6 MB L3
Intel Core i3-1000NG4 « 1.1 - 3.2 GHz2 / 4 cores4 MB L3
Clock1000 - 3800 MHz <=2660 MHz1100 - 3200 MHz
L1 Cache192 KB832 KB96 KB
L2 Cache2 MB12 MB1 MB
L3 Cache8 MB4 MB
Cores / Threads4 / 86 / 62 / 4
TDP9 Watt9 Watt
Technology10 nm7 nm10 nm
FeaturesAVX512, DL Boost, Turbo Boost 2.0ARMv8 Instruction SetAVX512, DL Boost, Turbo Boost 2.0
iGPUIntel Iris Plus Graphics G7 (Ice Lake 64 EU) (300 - 1100 MHz)Apple A13 Bionic GPUIntel Iris Plus Graphics G4 (Ice Lake 48 EU) (300 - 900 MHz)
Architecturex86ARMx86
Announced
Transistors6900 Million

Benchmarks

Performance Rating - CB R15 + R20 + 7-Zip + X265 + Blender + 3DM11 CPU - i3-1000NG4
24.2 pt (34%)
Cinebench R20 - Cinebench R20 CPU (Single Core)
348 Points (39%)
Cinebench R20 - Cinebench R20 CPU (Multi Core)
587 Points (1%)
Cinebench R15 - Cinebench R15 CPU Multi 64 Bit
333 Points (2%)
Cinebench R15 - Cinebench R15 CPU Single 64 Bit
141 Points (42%)
Cinebench R11.5 - Cinebench R11.5 CPU Multi 64 Bit
2.7 Points (4%)
Cinebench R11.5 - Cinebench R11.5 CPU Single 64 Bit
1.5 Points (37%)
Cinebench R10 - Cinebench R10 Rend. Single (32bit)
5771 Points (35%)
Cinebench R10 - Cinebench R10 Rend. Multi (32bit)
9257 Points (7%)
wPrime 2.10 - wPrime 2.0 1024m *
691 s (8%)
wPrime 2.10 - wPrime 2.0 32m *
16.2 s (3%)
WinRAR - WinRAR 4.0
2468 Points (4%)
7-Zip 18.03 - 7-Zip 18.03 Multli Thread 4 runs
7921 MIPS (5%)
7-Zip 18.03 - 7-Zip 18.03 Single Thread 4 runs
3438 MIPS (41%)
HWBOT x265 Benchmark v2.2 - HWBOT x265 4k Preset
2.2 fps (4%)
Blender - Blender 2.79 BMW27 CPU *
1814 Seconds (13%)
R Benchmark 2.5 - R Benchmark 2.5 *
0.9 sec (20%)
3DMark 06 - CPU - 3DMark 06 - CPU
3151 Points (7%)
Super Pi mod 1.5 XS 1M - Super Pi mod 1.5 XS 1M *
10.6 s (2%)
Super Pi mod 1.5 XS 2M - Super Pi mod 1.5 XS 2M *
23.5 s (1%)
Super Pi Mod 1.5 XS 32M - Super Pi mod 1.5 XS 32M *
550 s (2%)
3DMark Vantage - 3DM Vant. Perf. CPU no Physx
8621 Points (8%)
3DMark 11 - 3DM11 Performance Physics
3375 Points (9%)
3DMark - 3DMark Ice Storm Unlimited Physics
min: 33851     avg: 33885     median: 33881 (29%)     max: 33925 Points
3DMark - 3DMark Fire Strike Standard Physics
3009 Points (5%)
3DMark - 3DMark Sling Shot Extreme (ES 3.1) Unlimited Physics
min: 2078     avg: 2803     median: 2958 (35%)     max: 3219 Points
3DMark - 3DMark Sling Shot (ES 3.0) Unlimited Physics
min: 3411     avg: 3780     median: 3877 (44%)     max: 4052 Points
Geekbench 5.5 - Geekbench 5.1 - 5.4 64 Bit Single-Core
1167 Points (49%)
min: 1326     avg: 1333     median: 1332 (56%)     max: 1342 Points
Geekbench 5.5 - Geekbench 5.1 - 5.4 64 Bit Multi-Core
2322 Points (4%)
min: 3235     avg: 3381     median: 3378.5 (6%)     max: 3531 Points
Geekbench 5.0 - Geekbench 5.0 64 Bit Single-Core
min: 1343     avg: 1343     median: 1343 (6%)     max: 1344 Points
Geekbench 5.0 - Geekbench 5.0 64 Bit Multi-Core
min: 3242     avg: 3427     median: 3463 (11%)     max: 3575 Points
Geekbench 4.4 - Geekbench 4.1 - 4.4 64 Bit Single-Core
4748 Points (47%)
Geekbench 4.4 - Geekbench 4.1 - 4.4 64 Bit Multi-Core
9090 Points (10%)
Mozilla Kraken 1.1 - Kraken 1.1 Total Score *
min: 545     avg: 562     median: 571 (1%)     max: 573 ms
Octane V2 - Octane V2 Total Score
min: 47288     avg: 48727     median: 48991 (44%)     max: 49388 Points
39043 Points (35%)
WebXPRT 3 - WebXPRT 3 Score
min: 146     avg: 179.2     median: 183 (38%)     max: 202 Points
162 Points (34%)
AnTuTu v7 - AnTuTu v7 MEM
min: 10494     avg: 12510     median: 12592 (39%)     max: 14443 Points
AnTuTu v7 - AnTuTu v7 UX
min: 77118     avg: 77810     median: 78032 (96%)     max: 78279 Points
AnTuTu v7 - AnTuTu v7 GPU
min: 218738     avg: 219891     median: 218937 (68%)     max: 221998 Points
AnTuTu v7 - AnTuTu v7 CPU
min: 147281     avg: 149542     median: 148191 (91%)     max: 153154 Points
AnTuTu v7 - AnTuTu v7 Total Score
min: 456891     avg: 459752     median: 459850 (81%)     max: 462516 Points
AnTuTu v8 - AnTuTu v8 UX
min: 64361     avg: 75201     median: 78294 (65%)     max: 82947 Points
AnTuTu v8 - AnTuTu v8 MEM
min: 67691     avg: 75819     median: 74262 (60%)     max: 85504 Points
AnTuTu v8 - AnTuTu v8 GPU
min: 190559     avg: 203672     median: 209164 (38%)     max: 211292 Points
AnTuTu v8 - AnTuTu v8 CPU
min: 149088     avg: 156731     median: 152919 (55%)     max: 168185 Points
AnTuTu v8 - AnTuTu v8 Total Score
min: 489463     avg: 511422     median: 510245 (49%)     max: 534558 Points
Antutu v9 - AnTuTu v9 Total Score
622382 Points (38%)
Antutu v9 - AnTuTu v9 CPU
147649 Points (40%)
PassMark PerformanceTest Mobile V1 - PerformanceTest Mobile V1 CPU Tests
min: 650706     avg: 678820     median: 683897 (90%)     max: 701856 Points
CrossMark - CrossMark Overall
min: 776     avg: 835     median: 849 (33%)     max: 864 Points
Power Consumption - Geekbench 5.5 Power Consumption 150cd *
7 Watt (3%)
Power Consumption - Idle Power Consumption 150cd 1min *
2.9 Watt (3%)

Average Benchmarks Intel Core i7-1060G7 → 100% n=2

Average Benchmarks Apple A13 Bionic → 130% n=2

Average Benchmarks Intel Core i3-1000NG4 → 91% n=2

- Range of benchmark values for this graphics card
- Average benchmark values for this graphics card
* Smaller numbers mean a higher performance
1 This benchmark is not used for the average calculation

v1.26
log 03. 08:37:46

#0 checking url part for id 11446 +0s ... 0s

#1 checking url part for id 11496 +0s ... 0s

#2 checking url part for id 11942 +0s ... 0s

#3 not redirecting to Ajax server +0s ... 0s

#4 did not recreate cache, as it is less than 5 days old! Created at Sat, 01 Jun 2024 05:37:57 +0200 +0.001s ... 0.001s

#5 composed specs +0.043s ... 0.044s

#6 did output specs +0s ... 0.044s

#7 getting avg benchmarks for device 11446 +0.002s ... 0.046s

#8 got single benchmarks 11446 +0.006s ... 0.052s

#9 getting avg benchmarks for device 11496 +0.003s ... 0.055s

#10 got single benchmarks 11496 +0.013s ... 0.068s

#11 getting avg benchmarks for device 11942 +0.016s ... 0.083s

#12 got single benchmarks 11942 +0.007s ... 0.09s

#13 got avg benchmarks for devices +0s ... 0.09s

#14 min, max, avg, median took s +0.166s ... 0.256s

#15 return log +0s ... 0.256s

Please share our article, every link counts!
> Expert Reviews and News on Laptops, Smartphones and Tech Innovations > Benchmarks / Tech > Processor Comparison - Head 2 Head
Redaktion, 2017-09- 8 (Update: 2023-07- 1)