|
|
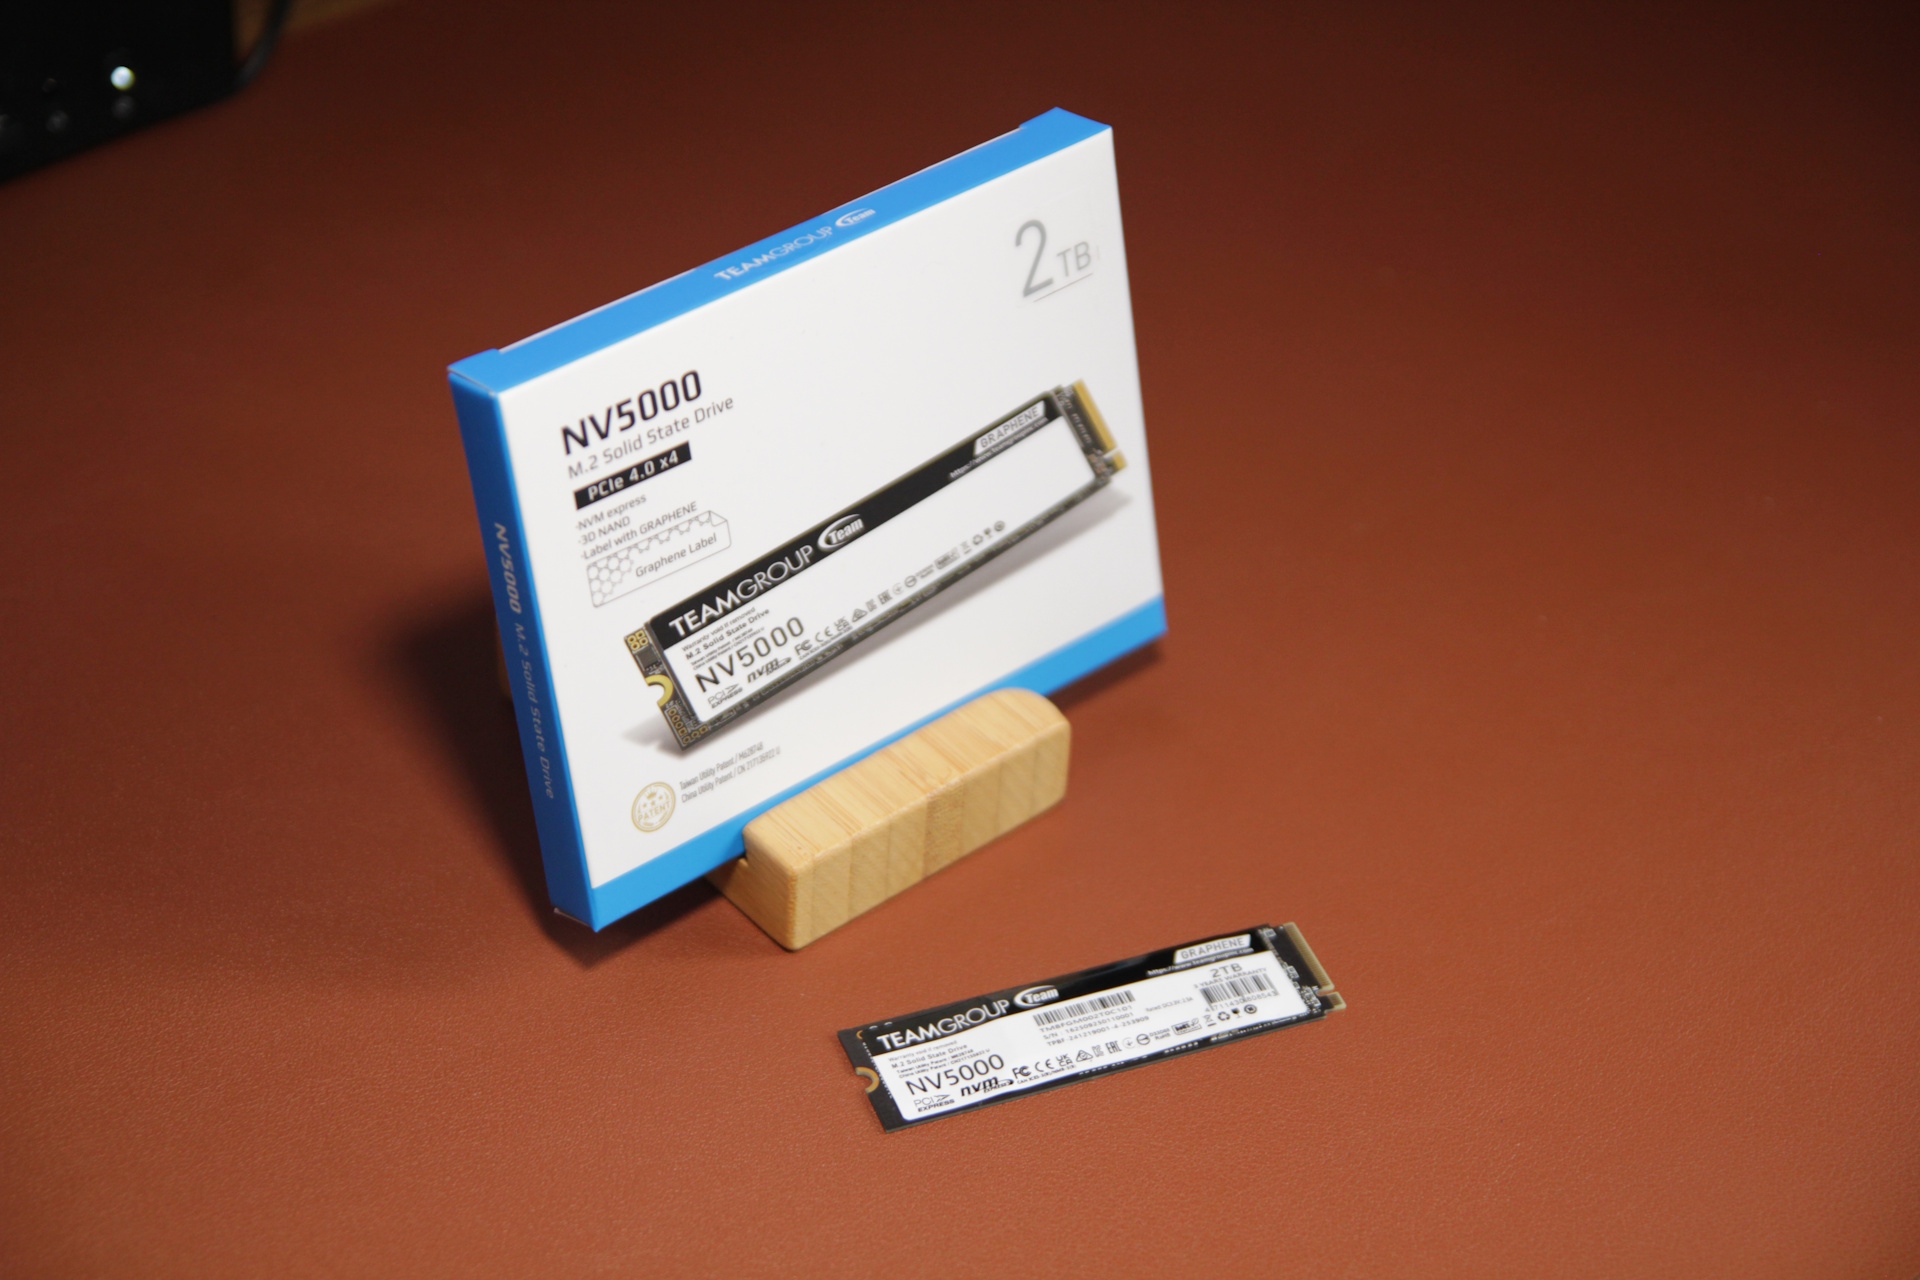
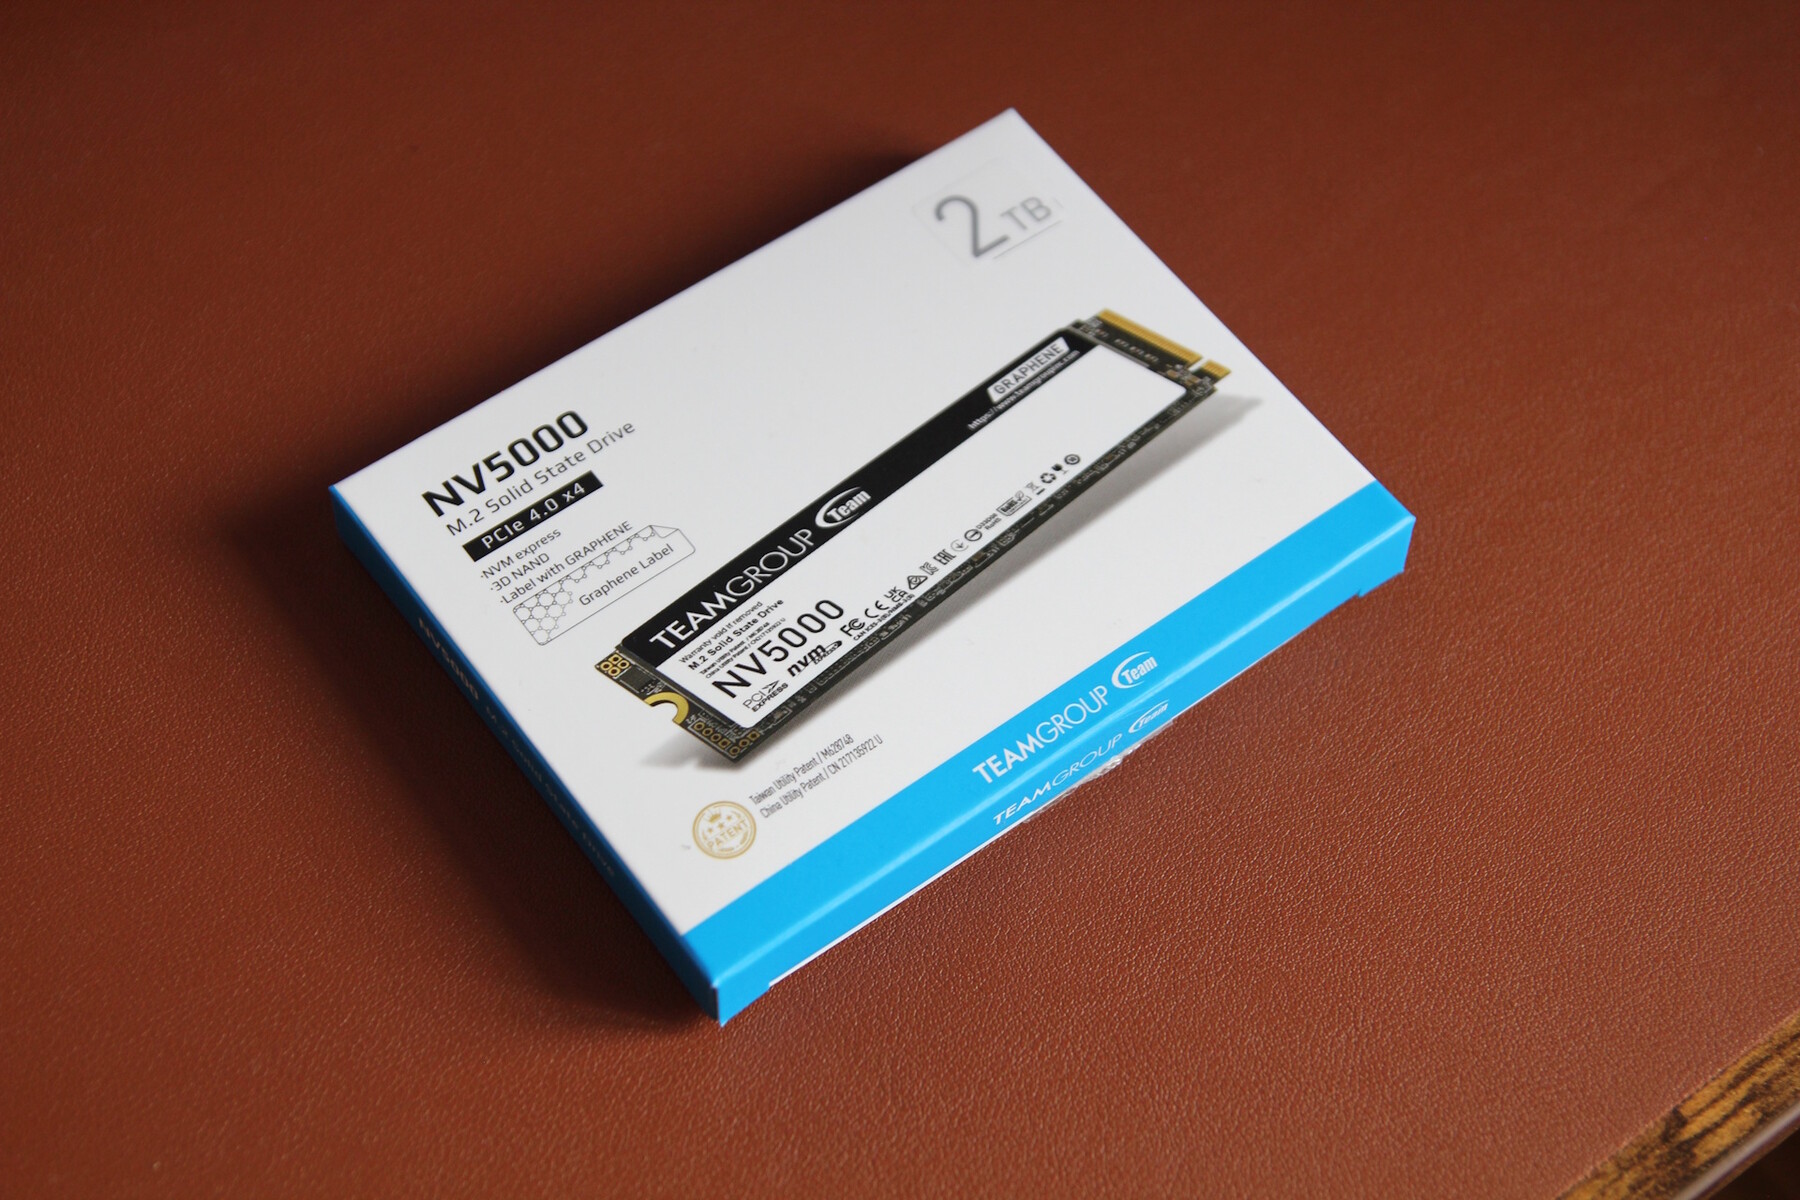
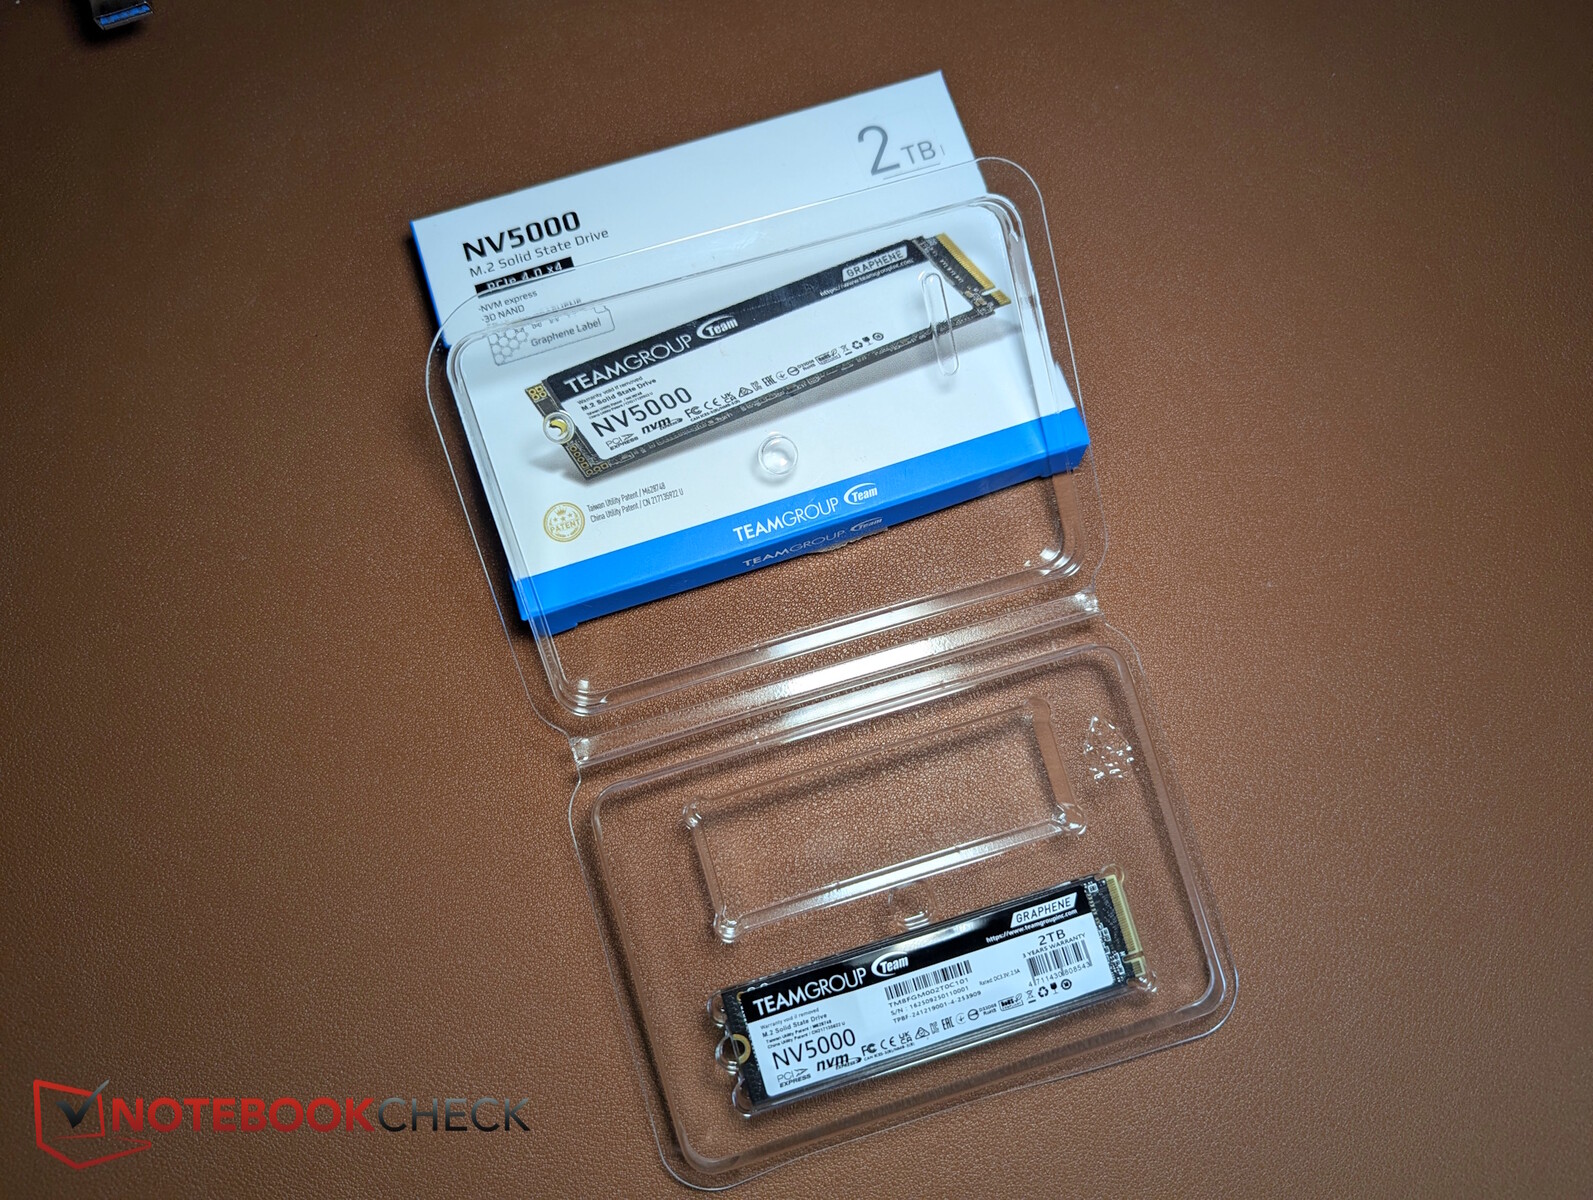
Framework Laptop 13.5
Western Digital WD_BLACK SN850 WDS100T1X0E |
4346 (4237.84min - 4346.35max) MB/s +43% |
Lenovo Legion 5 15AHP G10
SK hynix PVC10 HFS001TEM4X182N |
4177 (4138.62min - 4177.35max) MB/s +38% |
HP Omen 17z-db100
TeamGroup T-Force G50 TM8FFE004T |
3481 (3436.86min - 3481.23max) MB/s +15% |
Asus ROG Strix G18 2025 G814
Micron 2500 1TB MTFDKBA1T0QGN |
3201 (3172.94min - 3201.4max) MB/s +5% |
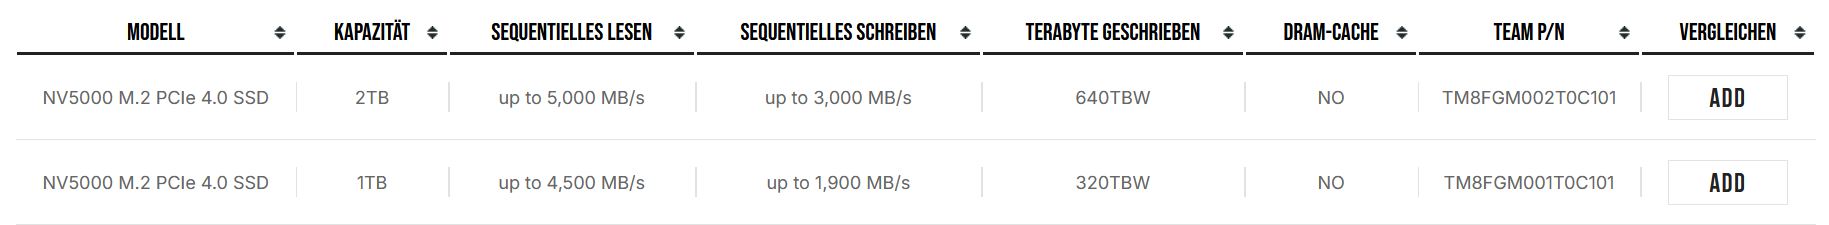
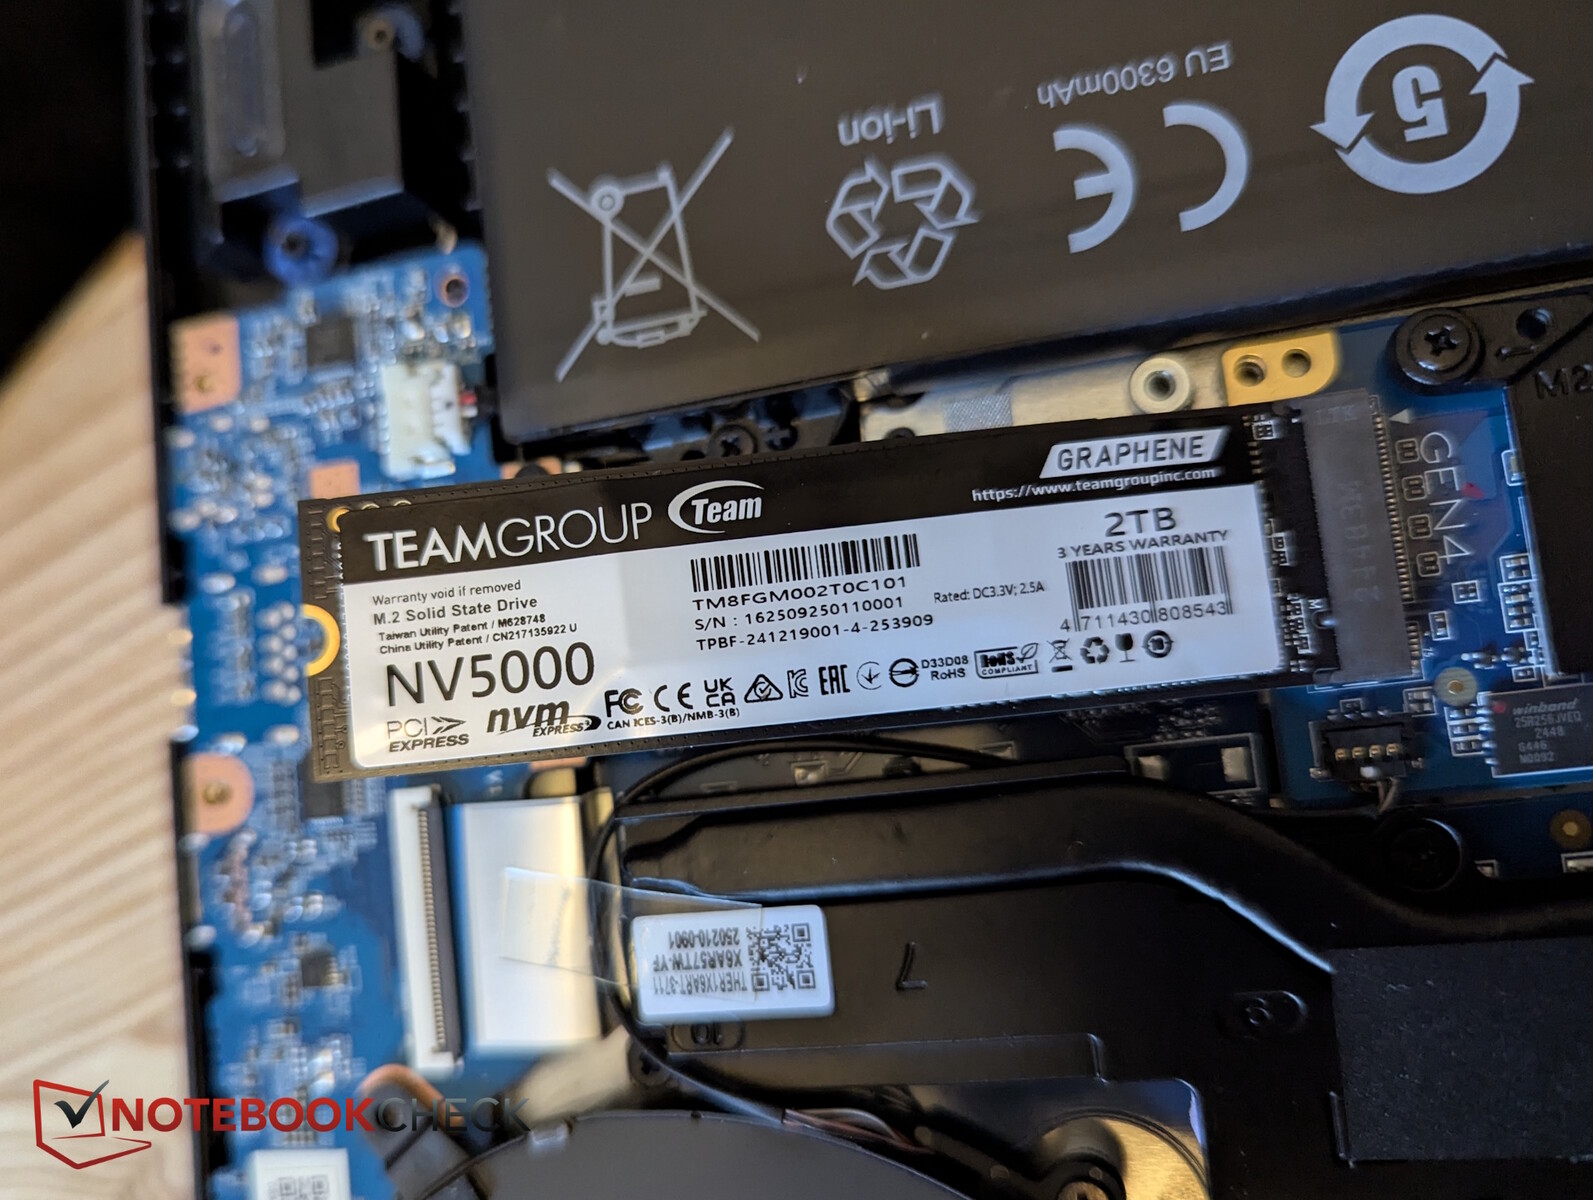
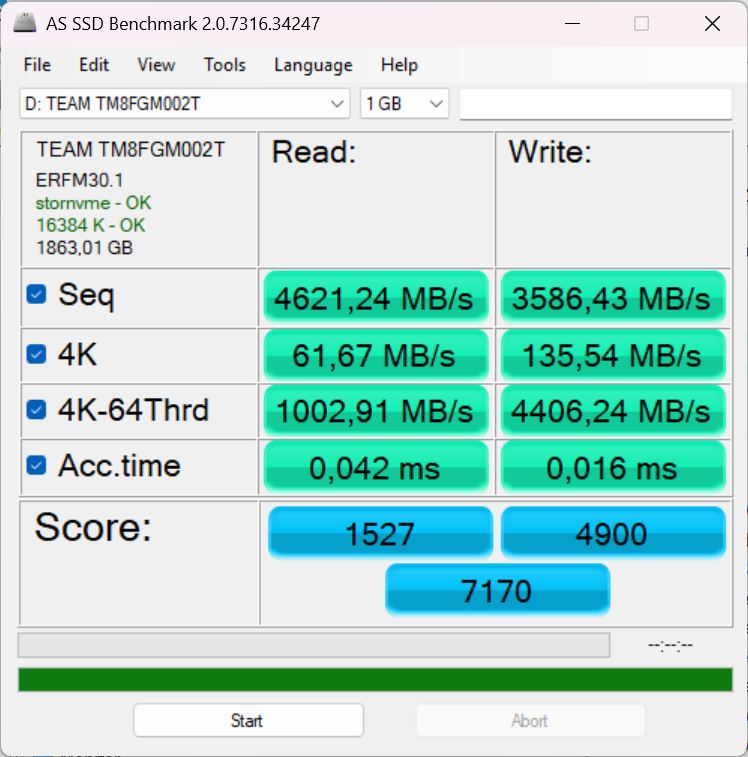
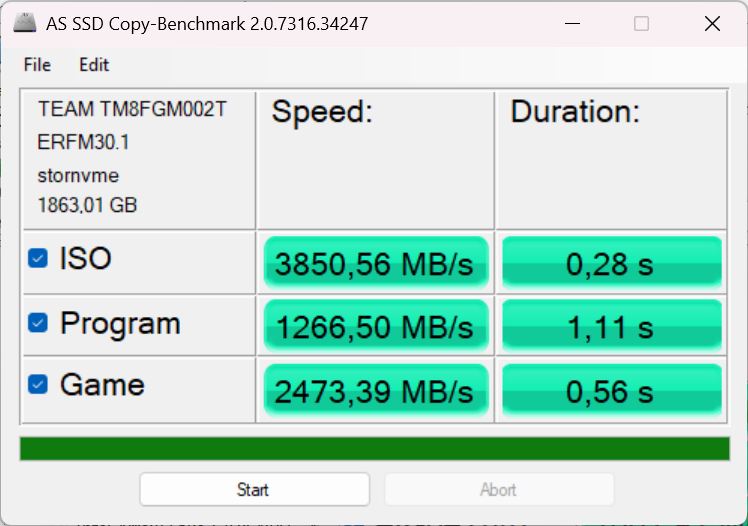
TeamGroup NV5000
|
3035 (2975.02min - 3034.78max) MB/s |
Lenovo LOQ 17IRX10
WD PC SN7100S SDFPMSL-1T00-1101 |
2591 (2312.31min - 2590.61max) MB/s -15% |
Global Average -3
(113.3 - 9494, n=2122) | |
Average of class
(113.3 - 9494, n=2122) | |
MSI Crosshair 18 HX AI A2XW
Micron 2500 1TB MTFDKBA1T0QGN |
2388 (557.15min - 2387.86max) MB/s -21% |
|
HP Omen 17z-db100
TeamGroup T-Force G50 TM8FFE004T |
5091 (5081.61min - 5091.26max) MB/s +70% |
Framework Laptop 13.5
Western Digital WD_BLACK SN850 WDS100T1X0E |
4947 (4825.12min - 4946.55max) MB/s +65% |
Lenovo Legion 5 15AHP G10
SK hynix PVC10 HFS001TEM4X182N |
4263 (4214.65min - 4263.16max) MB/s +42% |
Lenovo LOQ 17IRX10
WD PC SN7100S SDFPMSL-1T00-1101 |
3904 (3635.41min - 3903.8max) MB/s +30% |
Asus ROG Strix G18 2025 G814
Micron 2500 1TB MTFDKBA1T0QGN |
3784 (3726.22min - 3784.1max) MB/s +26% |
MSI Crosshair 18 HX AI A2XW
Micron 2500 1TB MTFDKBA1T0QGN |
3071 (2466.77min - 3070.8max) MB/s +3% |
TeamGroup NV5000
|
2992 (2837.66min - 2991.89max) MB/s |
Global Average -3
(43 - 10361, n=2122) | |
Average of class
(43 - 10361, n=2122) | |
|
Asus ROG Strix G18 2025 G814
Micron 2500 1TB MTFDKBA1T0QGN |
7237 (5771.57min - 7237.48max) MB/s +21% |
Framework Laptop 13.5
Western Digital WD_BLACK SN850 WDS100T1X0E |
6952 (6547.73min - 6952.06max) MB/s +16% |
Lenovo LOQ 17IRX10
WD PC SN7100S SDFPMSL-1T00-1101 |
6911 (6334.24min - 6910.97max) MB/s +15% |
MSI Crosshair 18 HX AI A2XW
Micron 2500 1TB MTFDKBA1T0QGN |
6833 (5759.01min - 6833.32max) MB/s +14% |
Lenovo Legion 5 15AHP G10
SK hynix PVC10 HFS001TEM4X182N |
6596 (6074.64min - 6596.19max) MB/s +10% |
TeamGroup NV5000
|
5991 (5342.49min - 5991.32max) MB/s |
HP Omen 17z-db100
TeamGroup T-Force G50 TM8FFE004T |
5264 (4763.8min - 5264.02max) MB/s -12% |
Global Average -3
(114.5 - 16102, n=2122) | |
Average of class
(114.5 - 16102, n=2122) | |
|
Lenovo LOQ 17IRX10
WD PC SN7100S SDFPMSL-1T00-1101 |
6485 (5380.03min - 6485.26max) MB/s +16% |
Asus ROG Strix G18 2025 G814
Micron 2500 1TB MTFDKBA1T0QGN |
6010 (5853.57min - 6010.3max) MB/s +7% |
MSI Crosshair 18 HX AI A2XW
Micron 2500 1TB MTFDKBA1T0QGN |
5822 (5624.01min - 5822max) MB/s +4% |
Lenovo Legion 5 15AHP G10
SK hynix PVC10 HFS001TEM4X182N |
5708 (5613.35min - 5708.24max) MB/s +2% |
TeamGroup NV5000
|
5591 (4687.55min - 5591.22max) MB/s |
Framework Laptop 13.5
Western Digital WD_BLACK SN850 WDS100T1X0E |
5160 (5028.55min - 5159.62max) MB/s -8% |
HP Omen 17z-db100
TeamGroup T-Force G50 TM8FFE004T |
5133 (5126.07min - 5132.57max) MB/s -8% |
Global Average -3
(46.7 - 14571, n=2122) | |
Average of class
(46.7 - 14571, n=2122) | |
|
Lenovo LOQ 17IRX10
WD PC SN7100S SDFPMSL-1T00-1101 |
98 (86.41min - 97.97max) MB/s +75% |
Lenovo Legion 5 15AHP G10
SK hynix PVC10 HFS001TEM4X182N |
96.1 (95.58min - 96.05max) MB/s +72% |
Framework Laptop 13.5
Western Digital WD_BLACK SN850 WDS100T1X0E |
88.5 (86.28min - 88.45max) MB/s +58% |
HP Omen 17z-db100
TeamGroup T-Force G50 TM8FFE004T |
79.9 (46.07min - 79.93max) MB/s +43% |
MSI Crosshair 18 HX AI A2XW
Micron 2500 1TB MTFDKBA1T0QGN |
62.8 (61.81min - 62.77max) MB/s +12% |
Asus ROG Strix G18 2025 G814
Micron 2500 1TB MTFDKBA1T0QGN |
61 (60.38min - 61.01max) MB/s +9% |
Global Average -3
(0.67 - 361, n=2122) | |
Average of class
(0.67 - 361, n=2122) | |
TeamGroup NV5000
|
55.9 (55.25min - 55.88max) MB/s |
|
Framework Laptop 13.5
Western Digital WD_BLACK SN850 WDS100T1X0E |
310 (307.53min - 309.65max) MB/s +98% |
Lenovo Legion 5 15AHP G10
SK hynix PVC10 HFS001TEM4X182N |
234 (218.15min - 234.21max) MB/s +50% |
HP Omen 17z-db100
TeamGroup T-Force G50 TM8FFE004T |
214 (200.68min - 214.45max) MB/s +37% |
Lenovo LOQ 17IRX10
WD PC SN7100S SDFPMSL-1T00-1101 |
175.2 (163.65min - 175.2max) MB/s +12% |
Asus ROG Strix G18 2025 G814
Micron 2500 1TB MTFDKBA1T0QGN |
167.6 (165.28min - 167.57max) MB/s +7% |
Global Average -3
(1.23 - 435, n=2121) | |
Average of class
(1.23 - 435, n=2121) | |
MSI Crosshair 18 HX AI A2XW
Micron 2500 1TB MTFDKBA1T0QGN |
157.4 (152.37min - 157.35max) MB/s +1% |
TeamGroup NV5000
|
156.2 (151.4min - 156.2max) MB/s |
|
Lenovo Legion 5 15AHP G10
SK hynix PVC10 HFS001TEM4X182N |
4170 (4166.07min - 4169.94max) MB/s +325% |
HP Omen 17z-db100
TeamGroup T-Force G50 TM8FFE004T |
3153 (1958.47min - 3153.2max) MB/s +221% |
Framework Laptop 13.5
Western Digital WD_BLACK SN850 WDS100T1X0E |
2946 (2796.46min - 2946.05max) MB/s +200% |
Lenovo LOQ 17IRX10
WD PC SN7100S SDFPMSL-1T00-1101 |
2898 (2526.72min - 2897.76max) MB/s +195% |
Global Average -3
(1.03 - 8156, n=2121) | |
Average of class
(1.03 - 8156, n=2121) | |
Asus ROG Strix G18 2025 G814
Micron 2500 1TB MTFDKBA1T0QGN |
1267 (1226.17min - 1266.73max) MB/s +29% |
TeamGroup NV5000
|
982 (930.58min - 982.27max) MB/s |
MSI Crosshair 18 HX AI A2XW
Micron 2500 1TB MTFDKBA1T0QGN |
692 (675.6min - 691.51max) MB/s -30% |
|
Lenovo Legion 5 15AHP G10
SK hynix PVC10 HFS001TEM4X182N |
4946 (4602min - 4946.25max) MB/s +857% |
HP Omen 17z-db100
TeamGroup T-Force G50 TM8FFE004T |
3775 (3689.65min - 3775.01max) MB/s +630% |
Lenovo LOQ 17IRX10
WD PC SN7100S SDFPMSL-1T00-1101 |
3113 (3033.18min - 3112.87max) MB/s +502% |
Framework Laptop 13.5
Western Digital WD_BLACK SN850 WDS100T1X0E |
2253 (1847.93min - 2253.22max) MB/s +336% |
Global Average -3
(1.5 - 6738, n=2121) | |
Average of class
(1.5 - 6738, n=2121) | |
MSI Crosshair 18 HX AI A2XW
Micron 2500 1TB MTFDKBA1T0QGN |
559 (548.85min - 558.58max) MB/s +8% |
Asus ROG Strix G18 2025 G814
Micron 2500 1TB MTFDKBA1T0QGN |
536 (521.73min - 535.9max) MB/s +4% |
TeamGroup NV5000
|
517 (500.76min - 517.09max) MB/s |
|
|
Lenovo Legion 5 15AHP G10
SK hynix PVC10 HFS001TEM4X182N | |
TeamGroup NV5000
| |
Framework Laptop 13.5
Western Digital WD_BLACK SN850 WDS100T1X0E | |
MSI Crosshair 18 HX AI A2XW
Micron 2500 1TB MTFDKBA1T0QGN | |
HP Omen 17z-db100
TeamGroup T-Force G50 TM8FFE004T | |
Asus ROG Strix G18 2025 G814
Micron 2500 1TB MTFDKBA1T0QGN | |
Lenovo LOQ 17IRX10
WD PC SN7100S SDFPMSL-1T00-1101 | |
Global Average -3
(19 - 16295, n=3779) | |
Average of class
(19 - 16295, n=3779) | |
|
Lenovo Legion 5 15AHP G10
SK hynix PVC10 HFS001TEM4X182N | |
Framework Laptop 13.5
Western Digital WD_BLACK SN850 WDS100T1X0E | |
HP Omen 17z-db100
TeamGroup T-Force G50 TM8FFE004T | |
Lenovo LOQ 17IRX10
WD PC SN7100S SDFPMSL-1T00-1101 | |
MSI Crosshair 18 HX AI A2XW
Micron 2500 1TB MTFDKBA1T0QGN | |
Asus ROG Strix G18 2025 G814
Micron 2500 1TB MTFDKBA1T0QGN | |
TeamGroup NV5000
| |
Global Average -3
(6 - 6261, n=3780) | |
Average of class
(6 - 6261, n=3780) | |
|
TeamGroup NV5000
| |
MSI Crosshair 18 HX AI A2XW
Micron 2500 1TB MTFDKBA1T0QGN | |
Asus ROG Strix G18 2025 G814
Micron 2500 1TB MTFDKBA1T0QGN | |
Lenovo Legion 5 15AHP G10
SK hynix PVC10 HFS001TEM4X182N | |
Lenovo LOQ 17IRX10
WD PC SN7100S SDFPMSL-1T00-1101 | |
HP Omen 17z-db100
TeamGroup T-Force G50 TM8FFE004T | |
Framework Laptop 13.5
Western Digital WD_BLACK SN850 WDS100T1X0E | |
Global Average -3
(4 - 7208, n=3780) | |
Average of class
(4 - 7208, n=3780) | |
|
Lenovo Legion 5 15AHP G10
SK hynix PVC10 HFS001TEM4X182N | |
Framework Laptop 13.5
Western Digital WD_BLACK SN850 WDS100T1X0E | |
Lenovo LOQ 17IRX10
WD PC SN7100S SDFPMSL-1T00-1101 | |
Asus ROG Strix G18 2025 G814
Micron 2500 1TB MTFDKBA1T0QGN | |
MSI Crosshair 18 HX AI A2XW
Micron 2500 1TB MTFDKBA1T0QGN | |
TeamGroup NV5000
| |
HP Omen 17z-db100
TeamGroup T-Force G50 TM8FFE004T | |
Global Average -3
(193.2 - 12763, n=3997) | |
Average of class
(193.2 - 12763, n=3997) | |
|
Framework Laptop 13.5
Western Digital WD_BLACK SN850 WDS100T1X0E | |
Lenovo Legion 5 15AHP G10
SK hynix PVC10 HFS001TEM4X182N | |
HP Omen 17z-db100
TeamGroup T-Force G50 TM8FFE004T | |
Asus ROG Strix G18 2025 G814
Micron 2500 1TB MTFDKBA1T0QGN | |
Lenovo LOQ 17IRX10
WD PC SN7100S SDFPMSL-1T00-1101 | |
TeamGroup NV5000
| |
MSI Crosshair 18 HX AI A2XW
Micron 2500 1TB MTFDKBA1T0QGN | |
Global Average -3
(52.2 - 11316, n=4000) | |
Average of class
(52.2 - 11316, n=4000) | |
|
Lenovo Legion 5 15AHP G10
SK hynix PVC10 HFS001TEM4X182N | |
Lenovo LOQ 17IRX10
WD PC SN7100S SDFPMSL-1T00-1101 | |
Framework Laptop 13.5
Western Digital WD_BLACK SN850 WDS100T1X0E | |
HP Omen 17z-db100
TeamGroup T-Force G50 TM8FFE004T | |
MSI Crosshair 18 HX AI A2XW
Micron 2500 1TB MTFDKBA1T0QGN | |
TeamGroup NV5000
| |
Asus ROG Strix G18 2025 G814
Micron 2500 1TB MTFDKBA1T0QGN | |
Global Average -3
(6.08 - 314, n=3989) | |
Average of class
(6.08 - 314, n=3989) | |
|
MSI Crosshair 18 HX AI A2XW
Micron 2500 1TB MTFDKBA1T0QGN | |
Framework Laptop 13.5
Western Digital WD_BLACK SN850 WDS100T1X0E | |
Lenovo LOQ 17IRX10
WD PC SN7100S SDFPMSL-1T00-1101 | |
Asus ROG Strix G18 2025 G814
Micron 2500 1TB MTFDKBA1T0QGN | |
Lenovo Legion 5 15AHP G10
SK hynix PVC10 HFS001TEM4X182N | |
HP Omen 17z-db100
TeamGroup T-Force G50 TM8FFE004T | |
TeamGroup NV5000
| |
Global Average -3
(13.3 - 512, n=3989) | |
Average of class
(13.3 - 512, n=3989) | |
|
Lenovo Legion 5 15AHP G10
SK hynix PVC10 HFS001TEM4X182N | |
Framework Laptop 13.5
Western Digital WD_BLACK SN850 WDS100T1X0E | |
HP Omen 17z-db100
TeamGroup T-Force G50 TM8FFE004T | |
Lenovo LOQ 17IRX10
WD PC SN7100S SDFPMSL-1T00-1101 | |
MSI Crosshair 18 HX AI A2XW
Micron 2500 1TB MTFDKBA1T0QGN | |
TeamGroup NV5000
| |
Asus ROG Strix G18 2025 G814
Micron 2500 1TB MTFDKBA1T0QGN | |
Global Average -3
(13.1 - 5086, n=3988) | |
Average of class
(13.1 - 5086, n=3988) | |
|
TeamGroup NV5000
| |
MSI Crosshair 18 HX AI A2XW
Micron 2500 1TB MTFDKBA1T0QGN | |
Asus ROG Strix G18 2025 G814
Micron 2500 1TB MTFDKBA1T0QGN | |
Lenovo Legion 5 15AHP G10
SK hynix PVC10 HFS001TEM4X182N | |
Lenovo LOQ 17IRX10
WD PC SN7100S SDFPMSL-1T00-1101 | |
HP Omen 17z-db100
TeamGroup T-Force G50 TM8FFE004T | |
Framework Laptop 13.5
Western Digital WD_BLACK SN850 WDS100T1X0E | |
Global Average -3
(13.7 - 5909, n=3986) | |
Average of class
(13.7 - 5909, n=3986) | |
|
Global Average -3
(0.012 - 33, n=3919) | |
Average of class
(0.012 - 33, n=3919) | |
MSI Crosshair 18 HX AI A2XW
Micron 2500 1TB MTFDKBA1T0QGN | |
HP Omen 17z-db100
TeamGroup T-Force G50 TM8FFE004T | |
Lenovo LOQ 17IRX10
WD PC SN7100S SDFPMSL-1T00-1101 | |
TeamGroup NV5000
| |
Lenovo Legion 5 15AHP G10
SK hynix PVC10 HFS001TEM4X182N | |
Framework Laptop 13.5
Western Digital WD_BLACK SN850 WDS100T1X0E | |
Asus ROG Strix G18 2025 G814
Micron 2500 1TB MTFDKBA1T0QGN | |
|
Global Average -3
(0.011 - 60.7, n=3962) | |
Average of class
(0.011 - 60.7, n=3962) | |
HP Omen 17z-db100
TeamGroup T-Force G50 TM8FFE004T | |
MSI Crosshair 18 HX AI A2XW
Micron 2500 1TB MTFDKBA1T0QGN | |
Framework Laptop 13.5
Western Digital WD_BLACK SN850 WDS100T1X0E | |
Lenovo LOQ 17IRX10
WD PC SN7100S SDFPMSL-1T00-1101 | |
Lenovo Legion 5 15AHP G10
SK hynix PVC10 HFS001TEM4X182N | |
Asus ROG Strix G18 2025 G814
Micron 2500 1TB MTFDKBA1T0QGN | |
TeamGroup NV5000
| |
* ... smaller is better