Notebookcheck Logo

Qualcomm Snapdragon X Plus X1P-42-100 vs Intel Core i7-13620H

Qualcomm Snapdragon X Plus X1P-42-100

► remove from comparison Qualcomm SD X Plus X1P-42-100

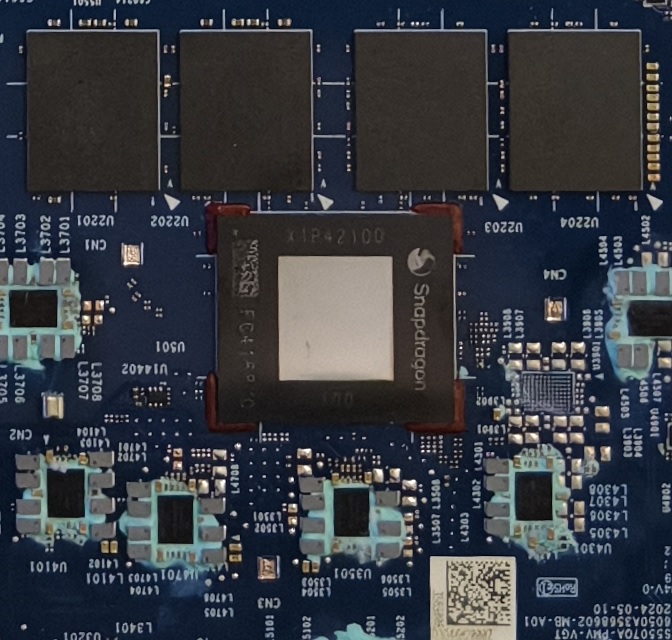
The Snapdragon X Plus 8-core (X1P-42-100) is a relatively affordable ARM architecture processor for use in Windows laptops that was unveiled in Sep 2024. This Qualcomm SoC features 8 Oryon CPU cores running at up to 3.4 GHz, along with the 1.7 TFLOPS X1-45 iGPU and the 45 TOPS Hexagon NPU. The super-fast LPDDR5x-8448 memory controller, USB 4.0 support, TB 4 support and PCIe 4 support are all onboard as well.

Architecture and Features

The Oryon cores (2 clusters of essentially identical cores; 8 threads) are mostly based on Nuvia IP and they reportedly make use of the ARM v8.7 microarchitecture. Much like modern AMD and Intel processors, the Snapdragon chip is compatible with USB 4 and thus with Thunderbolt 4 however it does not appear to support eGPUs as of September 2024.

The X1P-42-100 is based on the smaller die codenamed Purwa, unlike most X Elite and X Plus processors. It is believed to have at least 8 PCIe 4 and 4 PCIe 3 lanes for connecting various kinds of devices. NVMe SSDs are supported with a throughput of up to 7.9 GB/s; furthermore, most laptops built around the chip are expected to have 16 GB of LPDDR5x-8448 RAM. There is also a 45 TOPS NPU present for accelerating AI workloads.

Performance

A lot depends on the power targets of a specific system, just like it is with AMD, Intel and Nvidia products. That being said, the average X1P-42-100 competes with older chips such as the Core i5-1245U when executing multi-threaded x86 code. With apps compiled specifically with Windows on ARM in mind, a Core i7-1360P-like performance level is to be expected which is not bad at all for what is supposed to be a budget CPU.

The 3.4 GHz clock speed is only achievable in single-thread workloads. When under multi-threaded load, the CPU cores will run at no more than 3.2 GHz.

Graphics

The X1-45 used here delivers up to 1.7 TFLOPS of performance. Unlike the much faster 3.8 TFLOPS and 4.6 TFLOPS X1-85 iGPUs, this little guy here has much fewer unified shaders and runs at lower clock speeds, too. Games put it a little behind the GeForce MX350; this kind of performance is sufficient for older games and sub-900p resolutions only.

AVC, HEVC and AV1 video codecs can be both hardware-decoded and hardware-encoded whereas with VP9, only decoding is possible. The highest monitor resolution supported is UHD 2160p.

Power consumption

Expect to see anything between 15 W and 30 W under long-term workloads depending on the system and the power profile chosen. The number includes RAM.

The SoC is built with TSMC's N4P process for better-than-average power efficiency, as of H2 2024.

Intel Core i7-13620H

► remove from comparison Intel i7-13620H

The Intel Core i7-13620H is a high-end mobile CPU for laptops of the Raptor Lake-H series (based on the Alder Lake architecture). It was announced in early 2023 and offers 6 performance cores (P-cores, Golden Cove architecture) and 4 of the 8 efficient cores (E-cores, Gracemont architecture). The P-cores support Hyper-Threading leading to 16 supported threads when combined with the E-cores. The clock rate ranges from 2.4 to 4.9 GHz (single-core boost, all-core boost up to 4.7 GHz) on the performance cluster and 1.8 to 3.6 GHz on the efficient cluster. The performance of the E-cores should be similar to old Skylake cores (compare to the Core i7-6700HQ). All cores can use up to 24 MB L3 cache. Compared to the older i7-12650H, the 13620H offers higher clock speeds.

Performance

Thanks to the improved clock speeds, the i7-13620H should be able to clearly best the old i7-12650H. Still, the faster i7 models of the 13th gen offer more e-Cores and therefore a clearly better multi-threaded performance.

Features

The integrated memory controller supports various memory types up to DDR5-5200 (up from DDR5-4800 of the 12th gen.). The Thread Director (in hardware) can support the operating system to decide which thread to use on the performance or efficient cores for the best performance. For AI tasks, the CPU also integrates GNA 3.0 and DL Boost (via AVX2). Quick Sync in version 8 is the same as in the Rocket Lake CPUs and supports MPEG-2, AVC, VC-1 decode, JPEG, VP8 decode, VP9, HEVC, and AV1 decode in hardware. The CPU now supports PCIe 5.0 x8 for a GPU and two PCIe 4.0 x4 for SSDs.

The integrated graphics card is based on the Xe-architecture and offers 64 of the 96 EUs (Execution Units) clocked at up to 1.5GHz.

Power consumption

The i7-13620H is rated at a TDP of 55W (PL1, 115W PL2) and is manufactured in a further improved 10nm process (Intel 7) that allows the higher clock speeds compared to the 12th gen CPUs.

ModelQualcomm Snapdragon X Plus X1P-42-100Intel Core i7-13620H
CodenameOryonRaptor Lake-H
SeriesQualcomm Snapdragon XIntel Raptor Lake-H
Series: Raptor Lake-H Raptor Lake-H
Qualcomm Snapdragon X Elite X1E-00-1DE compare3.8 - 4.3 GHz12 / 12 cores6 MB L3 Oryon
Qualcomm Snapdragon X Elite X1E-84-100 compare3.8 - 4.2 GHz12 / 12 cores6 MB L3 Oryon
Qualcomm Snapdragon X Elite X1E-80-100 compare - 4 GHz12 / 12 cores6 MB L3 Oryon
Qualcomm Snapdragon X Elite X1E-78-100 compare - 3.4 GHz12 / 12 cores6 MB L3 Oryon
Qualcomm Snapdragon X Plus X1P-64-100 compare - 3.4 GHz10 / 10 cores6 MB L3 Oryon
Qualcomm Snapdragon X Plus X1P-46-100 compare - 4 GHz8 / 8 cores6 MB L3 Oryon
Qualcomm Snapdragon X Plus X1P-42-100 « - 3.4 GHz8 / 8 cores6 MB L3 Oryon
Qualcomm Snapdragon X X1-26-100 compare - 2.98 GHz8 / 8 cores6 MB L3 Oryon
Intel Core i9-13900HK compare1.9 - 5.4 GHz14 / 20 cores24 MB L3
Intel Core i9-13905H compare1.9 - 5.4 GHz14 / 20 cores24 MB L3
Intel Core i9-13900H compare1.9 - 5.4 GHz14 / 20 cores24 MB L3
Intel Core i7-13800H compare1.8 - 5.2 GHz14 / 20 cores24 MB L3
Intel Core i7-13705H compare1.8 - 5 GHz14 / 20 cores24 MB L3
Intel Core i7-13700H compare1.8 - 5 GHz14 / 20 cores24 MB L3
Intel Core i7-13620H « 1.8 - 4.9 GHz10 / 16 cores24 MB L3
Intel Core i5-13600H compare2.1 - 4.8 GHz12 / 16 cores18 MB L3
Intel Core i5-13505H compare1.9 - 4.7 GHz12 / 16 cores18 MB L3
Intel Core i5-13500H compare1.9 - 4.7 GHz12 / 16 cores18 MB L3
Intel Core i5-13420H compare1.5 - 4.6 GHz8 / 12 cores12 MB L3
Clock <=3400 MHz1800 - 4900 MHz
L1 Cache2.3 MB864 KB
L2 Cache12 MB9.5 MB
L3 Cache6 MB24 MB
Cores / Threads8 / 8
8 x 3.4 GHz Qualcomm Oryon
10 / 16
6 x 4.9 GHz Intel Golden Cove P-Core
4 x 3.6 GHz Intel Gracemont E-Core
TDP30 Watt45 Watt
Technology4 nm10 nm
iGPUQualcomm SD X Adreno X1-45 1.7 TFLOPSIntel UHD Graphics 64EUs (Alder Lake 12th Gen) ( - 1500 MHz)
ArchitectureARMx86
Announced
Manufacturerwww.qualcomm.comark.intel.com
max. Temp.100 °C
SocketBGA1700
FeaturesThread Director

Benchmarks

Performance Rating - CB R15 + R20 + 7-Zip + X265 + Blender + 3DM11 CPU - SD X Plus X1P-42-100
30.2 pt (50%)
Restrict / Search: Model: Max. age: years
Performance Rating - CB R15 + R20 + 7-Zip + X265 + Blender + 3DM11 CPU - i7-13620H
38.7 pt (64%)
Restrict / Search: Model: Max. age: years
Cinebench 2024 - Cinebench 2024 CPU Single Core
min: 107     avg: 108.1     median: 108 (61%)     max: 109 Points
110 Points (62%)
691 Points (13%)
Cinebench R23 - Cinebench R23 Multi Core
min: 6062     avg: 7312     median: 7422 (7%)     max: 8284 Points
min: 10819     avg: 14303     median: 15176 (14%)     max: 15496 Points
Cinebench R23 - Cinebench R23 Single Core
min: 1065     avg: 1110     median: 1109 (47%)     max: 1134 Points
min: 1805     avg: 1843     median: 1860 (78%)     max: 1871 Points
Cinebench R20 - Cinebench R20 CPU (Single Core)
min: 406     avg: 419.3     median: 421 (46%)     max: 425 Points
min: 693     avg: 704     median: 700 (76%)     max: 719 Points
Cinebench R20 - Cinebench R20 CPU (Multi Core)
min: 2361     avg: 2787     median: 2801 (7%)     max: 3097 Points
min: 4214     avg: 5426     median: 5626 (14%)     max: 5905 Points
Cinebench R15 - Cinebench R15 CPU Multi 64 Bit
min: 1191     avg: 1427     median: 1419 (9%)     max: 1556 Points
min: 1681     avg: 2239     median: 2349 (15%)     max: 2492 Points
Cinebench R15 - Cinebench R15 CPU Single 64 Bit
min: 206     avg: 210.1     median: 211 (58%)     max: 215 Points
min: 258     avg: 263.4     median: 263 (73%)     max: 269 Points
Cinebench R11.5 - Cinebench R11.5 CPU Multi 64 Bit
27.1 Points (35%)
Cinebench R11.5 - Cinebench R11.5 CPU Single 64 Bit
3.3 Points (78%)
Cinebench R10 - Cinebench R10 Rend. Single (32bit)
10181 Points (62%)
Cinebench R10 - Cinebench R10 Rend. Multi (32bit)
54809 Points (40%)
wPrime 2.10 - wPrime 2.0 1024m *
1021 s (12%)
wPrime 2.10 - wPrime 2.0 32m *
3.1 s (1%)
WinRAR - WinRAR 4.0
8682 Points (14%)
7-Zip 18.03 - 7-Zip 18.03 Multi Thread 4 runs
min: 29238     avg: 31053     median: 30828 (18%)     max: 32811 MIPS
min: 45983     avg: 56733     median: 59430 (34%)     max: 62324 MIPS
7-Zip 18.03 - 7-Zip 18.03 Single Thread 4 runs
min: 4087     avg: 4504     median: 4561 (54%)     max: 4675 MIPS
min: 5742     avg: 5994     median: 5915 (70%)     max: 6326 MIPS
X264 HD Benchmark 4.0 - x264 Pass 2
138.2 fps (46%)
X264 HD Benchmark 4.0 - x264 Pass 1
345.4 fps (80%)
HWBOT x265 Benchmark v2.2 - HWBOT x265 4k Preset
min: 3.16     avg: 4.9     median: 5 (9%)     max: 6.02 fps
min: 12.9     avg: 16.2     median: 16.6 (29%)     max: 17.7 fps
TrueCrypt - TrueCrypt Serpent
1.3 GB/s (38%)
TrueCrypt - TrueCrypt Twofish
2.3 GB/s (40%)
TrueCrypt - TrueCrypt AES
13.8 GB/s (36%)
Blender - Blender 3.3 Classroom CPU *
min: 711     avg: 898     median: 856 (11%)     max: 1226 Seconds
min: 353     avg: 412.6     median: 391 (5%)     max: 506 Seconds
Blender - Blender 2.79 BMW27 CPU *
min: 399     avg: 496.3     median: 466 (3%)     max: 683 Seconds
min: 215     avg: 237.6     median: 223 (2%)     max: 289 Seconds
R Benchmark 2.5 - R Benchmark 2.5 *
min: 0.728     avg: 0.8     median: 0.7 (16%)     max: 0.777 sec
min: 0.4438     avg: 0.4     median: 0.4 (10%)     max: 0.4509 sec
3DMark 06 - CPU - 3DMark 06 - CPU
13632 Points (29%)
Super Pi mod 1.5 XS 1M - Super Pi mod 1.5 XS 1M *
6.7 s (1%)
Super Pi mod 1.5 XS 2M - Super Pi mod 1.5 XS 2M *
15.2 s (1%)
Super Pi Mod 1.5 XS 32M - Super Pi mod 1.5 XS 32M *
380 s (2%)
3DMark Vantage - 3DM Vant. Perf. CPU no Physx
75313 Points (58%)
3DMark 11 - 3DM11 Performance Physics
min: 11743     avg: 12416     median: 12523 (31%)     max: 12625 Points
min: 14557     avg: 19840     median: 20532 (51%)     max: 22258 Points
3DMark - 3DMark Ice Storm Physics
min: 72358     avg: 88076     median: 91770 (75%)     max: 100099 Points
3DMark - 3DMark Ice Storm Extreme Physics
100899 Points (82%)
3DMark - 3DMark Ice Storm Unlimited Physics
98837 Points (82%)
3DMark - 3DMark Cloud Gate Physics
min: 8737     avg: 8919     median: 8996 (23%)     max: 9024 Points
min: 13351     avg: 16640     median: 17885 (45%)     max: 17993 Points
3DMark - 3DMark Fire Strike Standard Physics
min: 13147     avg: 13554     median: 13563 (24%)     max: 13780 Points
min: 19126     avg: 24765     median: 25096 (45%)     max: 27829 Points
3DMark - 3DMark Time Spy CPU
min: 3282     avg: 4225     median: 3306 (14%)     max: 5699 Points
min: 7713     avg: 10347     median: 10616 (45%)     max: 12228 Points
Geekbench 6.4 - Geekbench 6.4 Single-Core
min: 2287     avg: 2384     median: 2393.5 (60%)     max: 2442 Points
min: 2544     avg: 2586     median: 2596.5 (65%)     max: 2605 Points
Geekbench 6.4 - Geekbench 6.4 Multi-Core
min: 10833     avg: 11258     median: 11384 (44%)     max: 11508 Points
min: 9131     avg: 11886     median: 12668 (49%)     max: 13077 Points
Geekbench 5.5 - Geekbench 5.1 - 5.5 64 Bit Single-Core
min: 1486     avg: 1531     median: 1531 (60%)     max: 1576 Points
min: 1793     avg: 1823     median: 1827 (71%)     max: 1865 Points
Geekbench 5.5 - Geekbench 5.1 - 5.5 64 Bit Multi-Core
min: 4457     avg: 5351     median: 5350.5 (10%)     max: 6244 Points
min: 8357     avg: 11000     median: 11430 (20%)     max: 12223 Points
Geekbench 5.0 - Geekbench 5.0 64 Bit Single-Core
1767 Points (8%)
Geekbench 5.0 - Geekbench 5.0 64 Bit Multi-Core
11205 Points (35%)
Geekbench 4.4 - Geekbench 4.1 - 4.4 64 Bit Single-Core
7977 Points (80%)
Geekbench 4.4 - Geekbench 4.1 - 4.4 64 Bit Multi-Core
42882 Points (43%)
Mozilla Kraken 1.1 - Kraken 1.1 Total Score *
min: 407.5     avg: 640     median: 472.1 (1%)     max: 1145 ms
min: 508     avg: 514     median: 511 (1%)     max: 532 ms
Octane V2 - Octane V2 Total Score
min: 78058     avg: 81387     median: 79536 (60%)     max: 88419 Points
WebXPRT 4 - WebXPRT 4 Score
min: 130.3     avg: 251.9     median: 270 (74%)     max: 284 Points
min: 264     avg: 267     median: 267 (73%)     max: 270 Points
WebXPRT 3 - WebXPRT 3 Score
min: 129.9     avg: 356.4     median: 401 (72%)     max: 426 Points
min: 272     avg: 296.8     median: 292 (52%)     max: 319 Points
CrossMark - CrossMark Overall
min: 1061     avg: 1186     median: 1161 (43%)     max: 1463 Points
min: 1493     avg: 1832     median: 1881 (70%)     max: 1986 Points
Power Consumption - Prime95 Power Consumption - external Monitor *
min: 32.2     avg: 43.1     median: 44.3 (8%)     max: 58.5 Watt
min: 61.1     avg: 111     median: 121 (21%)     max: 135 Watt
Power Consumption - Cinebench R15 Multi Power Consumption - external Monitor *
min: 37.5     avg: 50.7     median: 51.8 (9%)     max: 60.1 Watt
min: 124.9     avg: 138.1     median: 128.8 (24%)     max: 170 Watt
Power Consumption - Idle Power Consumption - external Monitor *
min: 2.95     avg: 4.9     median: 4.2 (3%)     max: 9.3 Watt
min: 10.1     avg: 18.3     median: 19.7 (13%)     max: 21.4 Watt
Power Consumption - Idle Power Consumption 150cd 1min *
min: 2.56     avg: 4.5     median: 4.9 (5%)     max: 6.14 Watt
min: 12.6     avg: 16.7     median: 16.3 (18%)     max: 21.7 Watt
Power Consumption - Power Efficiency - Cinebench R15 Multi external Monitor
min: 25.9     avg: 28     median: 27.3 (20%)     max: 31.8 Points per Watt
min: 14.7     avg: 17.5     median: 18 (13%)     max: 19.2 Points per Watt

Average Benchmarks Qualcomm Snapdragon X Plus X1P-42-100 → 100% n=26

Average Benchmarks Intel Core i7-13620H → 166% n=26

- Range of benchmark values for this graphics card
red legend - Average benchmark values for this graphics card
* Smaller numbers mean a higher performance
1 This benchmark is not used for the average calculation

Add one or more devices and compare

In the following list you can select (and also search for) devices that should be added to the comparison. You can select more than one device.

restrict list:
v1.33
log 13. 08:02:32

#0 ran 0s before starting gpusingle class +0s ... 0s

#1 checking url part for id 17591 +0s ... 0s

#2 checking url part for id 14723 +0s ... 0s

#3 redirected to Ajax server, took 1752386552s time from redirect:0 +0s ... 0s

#4 did not recreate cache, as it is less than 5 days old! Created at Sun, 13 Jul 2025 05:20:07 +0200 +0s ... 0s

#5 composed specs +0.007s ... 0.007s

#6 did output specs +0s ... 0.007s

#7 getting avg benchmarks for device 17591 +0.004s ... 0.011s

#8 got single benchmarks 17591 +0.011s ... 0.022s

#9 getting avg benchmarks for device 14723 +0.004s ... 0.027s

#10 got single benchmarks 14723 +0.013s ... 0.04s

#11 got avg benchmarks for devices +0s ... 0.04s

#12 min, max, avg, median took s +0.044s ... 0.084s

#13 return log +0.001s ... 0.084s

Please share our article, every link counts!
Mail Logo
> Expert Reviews and News on Laptops, Smartphones and Tech Innovations > Benchmarks / Tech > Processor Comparison - Head 2 Head
Redaktion, 2017-09- 8 (Update: 2023-07- 1)