

AMD Radeon RX 7900M vs AMD Radeon RX 6550M
AMD Radeon RX 7900M
► remove from comparison
The AMD Radeon RX 7900M is a mobile upper high-end graphics card based on the Navi 31 chip (RDNA 3 architecture) manufactured in 5nm. It features 4,608 cores (72 CUs - compute units) and 16 GB of fast GDDR6 graphics memory connected with a 256 Bit memory bus. The chip also includes 64 MB Infinity Cache. The clock speed of the cores will depend on the laptop according to AMD. The specified game clock speed is 1825 MHz (most likely at 180 W TGP).
AMD compares the performance to the mobile RTX 4080 and shows a number of games where the 7900M is on average 7% faster. Raytracing is supported in hardware, but usually slower than the Nvidia counterpart. Nvidia also has the advantage of DLSS support in selected games.
The Navi 31 chip is manufactured at TSMC in the current 5nm process. The power consumption (TGP) is specified at 160 to 180 Watt (200 Watt including SmartShift from the CPU).
AMD Radeon RX 6550M
► remove from comparison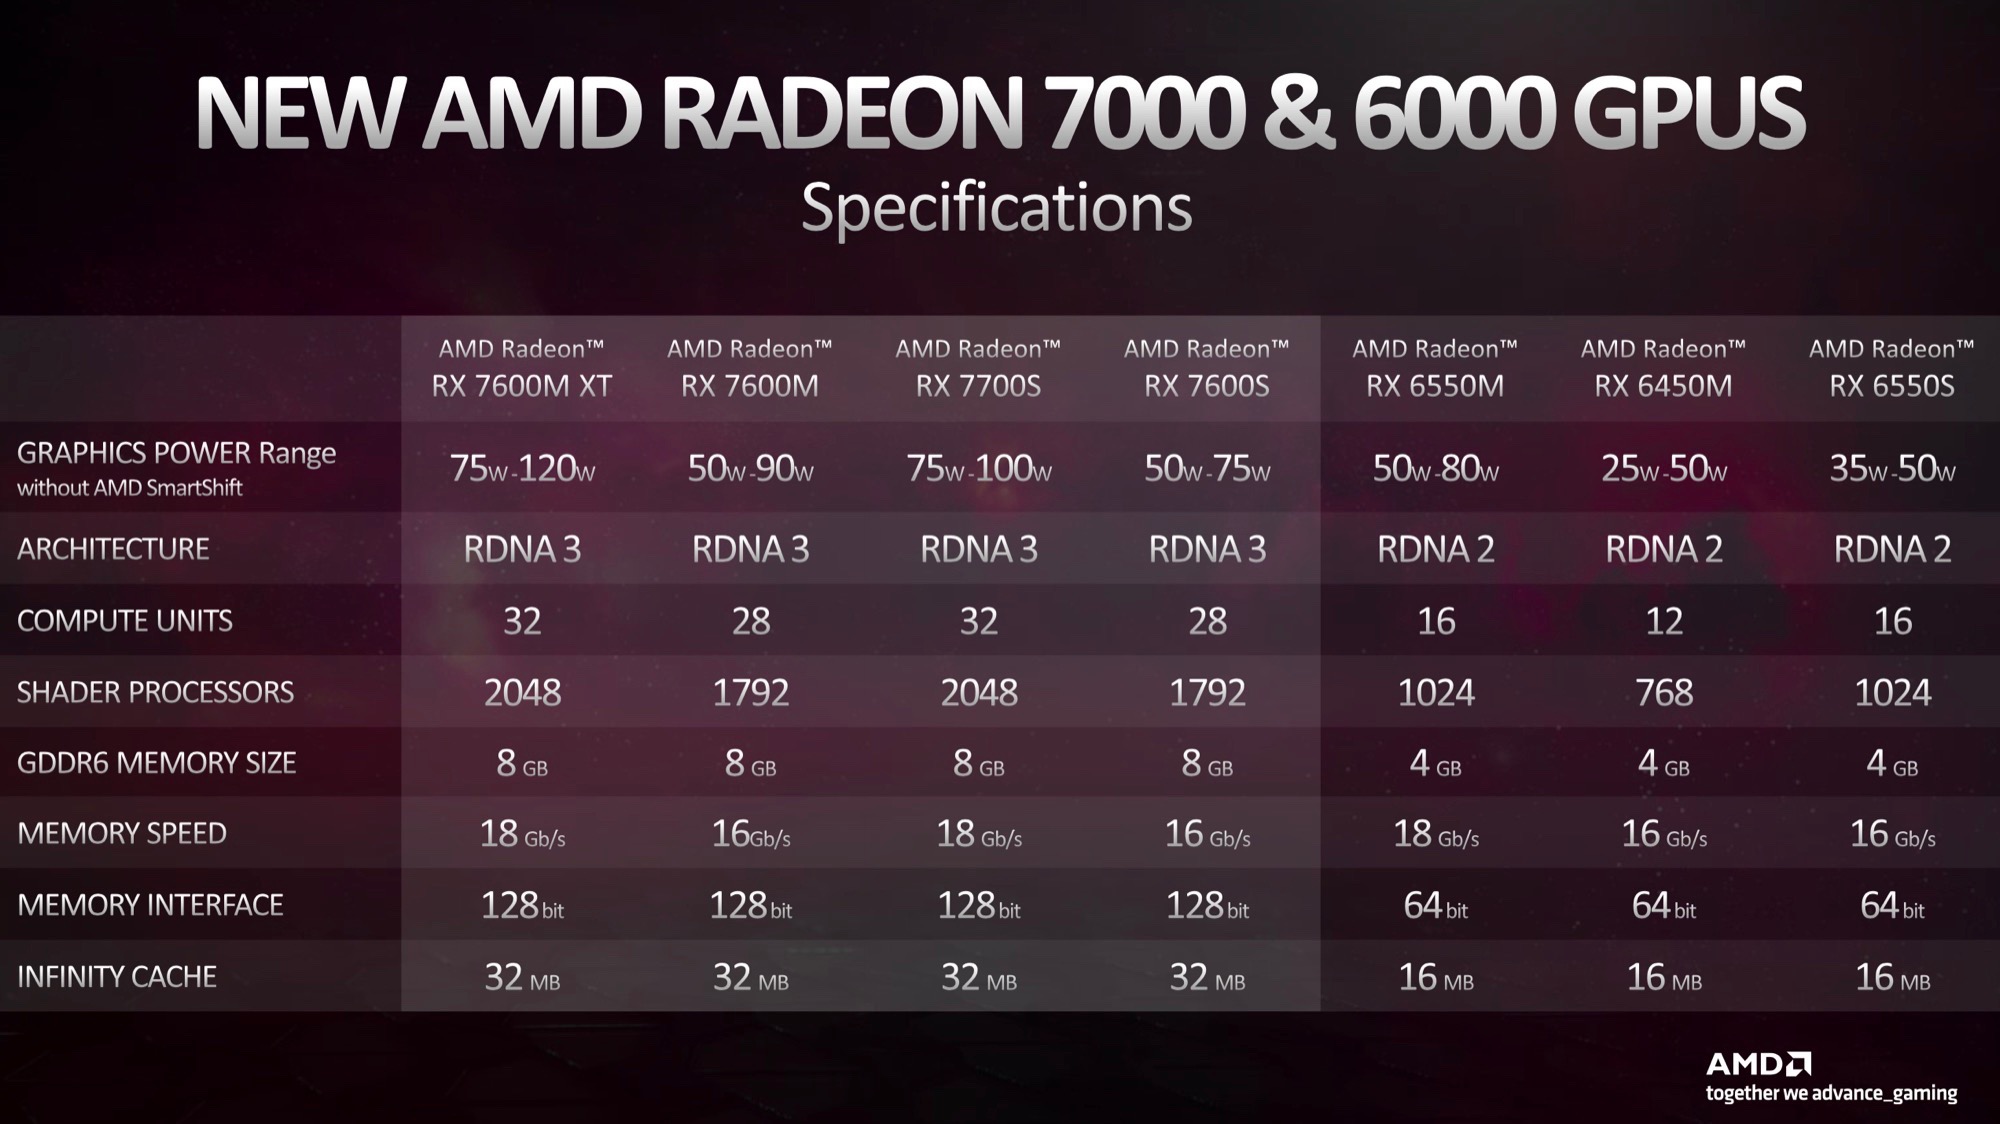
The AMD Radeon RX 6550M is a mobile entry-level graphics card based on the Navi 24 chip (RDNA 2 architecture) manufactured in the modern 6nm process. It features 1024 cores (16 CUs - compute units) and 4 GB of fast GDDR6 graphics memory connected with a 64 Bit memory bus. The chip also includes 16 MB Infinity Cache. The game clock speed is specified at 2560 MHz. Compared to the RX 6500M, the 6550M offers an increased core clock (+17%) but the memory bus i cut in half (64 versus 128 Bit).
The performance should be slightly higher than an average RX 6500M, as long as the memory bandwidth reduction wont has a too big impact.
The Navi 24 chip is manufactured at TSMC in the modern 6nm process and should offer a good energy efficiency. The RX6550M is specified at a TDP of 50 - 80 Watt and therefore best suited for normal multimedia laptops.
| AMD Radeon RX 7900M | AMD Radeon RX 6550M | |||||||||||||||||||||||||||||||||||||||||||||||||||||||||||||
| Radeon RX 6000M Series |
|
| ||||||||||||||||||||||||||||||||||||||||||||||||||||||||||||
| Codename | Navi 31 | |||||||||||||||||||||||||||||||||||||||||||||||||||||||||||||
| Architecture | RDNA 3 | RDNA 2 | ||||||||||||||||||||||||||||||||||||||||||||||||||||||||||||
| Pipelines | 4608 - unified | 1024 - unified | ||||||||||||||||||||||||||||||||||||||||||||||||||||||||||||
| ROPs | 192 | |||||||||||||||||||||||||||||||||||||||||||||||||||||||||||||
| Core Speed | 1825 - 2090 (Boost) MHz | 2000 - 2560 (Boost) MHz | ||||||||||||||||||||||||||||||||||||||||||||||||||||||||||||
| Theoretical Performance | 77.05 TFLOPS FP16, 38.52 TFLOPS FP32 | 11.6 TFLOPS FP16, 5.8 TFLOPS FP32 | ||||||||||||||||||||||||||||||||||||||||||||||||||||||||||||
| Cache | L3: 64 MB | L2: 1 MB, L3: 16 MB | ||||||||||||||||||||||||||||||||||||||||||||||||||||||||||||
| Memory Speed | 18000 MHz | 18000 MHz | ||||||||||||||||||||||||||||||||||||||||||||||||||||||||||||
| Memory Bus Width | 256 Bit | 64 Bit | ||||||||||||||||||||||||||||||||||||||||||||||||||||||||||||
| Memory Type | GDDR6 | GDDR6 | ||||||||||||||||||||||||||||||||||||||||||||||||||||||||||||
| Max. Amount of Memory | 16 GB | 4 GB | ||||||||||||||||||||||||||||||||||||||||||||||||||||||||||||
| Shared Memory | no | no | ||||||||||||||||||||||||||||||||||||||||||||||||||||||||||||
| Memory Bandwidth | 576 GB/s | |||||||||||||||||||||||||||||||||||||||||||||||||||||||||||||
| API | DirectX 12_2, Shader 6.7, OpenGL 4.6, OpenCL 2.2, Vulkan 1.3 | DirectX 12_2, Shader 6.7, OpenGL 4.6, OpenCL 2.2, Vulkan 1.3 | ||||||||||||||||||||||||||||||||||||||||||||||||||||||||||||
| Power Consumption | 180 Watt (160 - 200 Watt TGP) | 80 Watt (50 - 80 Watt TGP) | ||||||||||||||||||||||||||||||||||||||||||||||||||||||||||||
| Transistors | 53.9 Billion | 5.4 Billion | ||||||||||||||||||||||||||||||||||||||||||||||||||||||||||||
| technology | 5 nm | 6 nm | ||||||||||||||||||||||||||||||||||||||||||||||||||||||||||||
| Notebook Size | large | medium sized | ||||||||||||||||||||||||||||||||||||||||||||||||||||||||||||
| Date of Announcement | 19.10.2023 | 05.01.2023 | ||||||||||||||||||||||||||||||||||||||||||||||||||||||||||||
| Link to Manufacturer Page | www.amd.com | www.amd.com | ||||||||||||||||||||||||||||||||||||||||||||||||||||||||||||
| Die Size | 107 mm² | |||||||||||||||||||||||||||||||||||||||||||||||||||||||||||||
| Features | Radeon Media Engine (H.264, H.265, AV1 en- and decode) |
Benchmarks
Cinebench R15 OpenGL 64 Bit + AMD Radeon RX 7900M
Average Benchmarks AMD Radeon RX 7900M → 100% n=12
Average Benchmarks AMD Radeon RX 6550M → 48% n=12
* Smaller numbers mean a higher performance
1 This benchmark is not used for the average calculation
Game Benchmarks
The following benchmarks stem from our benchmarks of review laptops. The performance depends on the used graphics memory, clock rate, processor, system settings, drivers, and operating systems. So the results don't have to be representative for all laptops with this GPU. For detailed information on the benchmark results, click on the fps number.

Alan Wake 2
2023

Baldur's Gate 3
2023

F1 22
2022

Cyberpunk 2077 1.6
2022

Strange Brigade
2018
Far Cry 5
2018
X-Plane 11.11
2018
Dota 2 Reborn
2015
The Witcher 3
2015
GTA V
2015Average Gaming AMD Radeon RX 7900M → 100%
Average Gaming 30-70 fps → 100%
Average Gaming AMD Radeon RX 6550M → 32%
Average Gaming 30-70 fps → 29%
| AMD Radeon RX 7900M | AMD Radeon RX 6550M | |||||||||||||
|---|---|---|---|---|---|---|---|---|---|---|---|---|---|---|
| low | med. | high | ultra | QHD | 4K | low | med. | high | ultra | QHD | 4K | |||
| Alan Wake 2 | 104.8 | 71.7 | 37.3 | |||||||||||
| Cyberpunk 2077 2.2 Phantom Liberty | 130.7 | 129.6 | 85.2 | 37.7 | 62.8 | 45.9 | 34.7 | 28.6 | 17.3 | |||||
| Baldur's Gate 3 | 152.4 | 152.6 | 118.5 | 65.8 | 61.6 | 52.9 | 44.7 | 43 | 29 | |||||
| Ratchet & Clank Rift Apart | 86.2 | 83.6 | 54.8 | |||||||||||
| F1 22 | 296 | 102.8 | 69.3 | 36.1 | 132.5 | 120.8 | 87.5 | 19.3 | 11.3 | |||||
| Tiny Tina's Wonderlands | 150.2 | 106.8 | 56 | 124.1 | 95.5 | 59.7 | 30.3 | 27.2 | ||||||
| Cyberpunk 2077 1.6 | 135 | 93.3 | 44.3 | |||||||||||
| Shadow of the Tomb Raider | 207 | 198 | 139 | 76 | ||||||||||
| Strange Brigade | 344 | 249 | 130.5 | 319 | 122.5 | 101.1 | 88.4 | |||||||
| Far Cry 5 | 128 | 123 | 103 | 115 | 91 | 84 | 79 | |||||||
| X-Plane 11.11 | 83.7 | 64.3 | 53.7 | 41.2 | 33 | |||||||||
| Final Fantasy XV Benchmark | 152.8 | 114.6 | 69.3 | 129.3 | 67.4 | 47.8 | 31.2 | |||||||
| Dota 2 Reborn | 162.8 | 146.2 | 122.5 | 137.1 | 127.3 | 112.3 | 103 | |||||||
| The Witcher 3 | 167.7 | 116 | 277.2 | 171.5 | 83.2 | 49.4 | ||||||||
| GTA V | 172.9 | 105 | 105.6 | 146 | ||||||||||
| AMD Radeon RX 7900M | AMD Radeon RX 6550M | |||||||||||||
| low | med. | high | ultra | QHD | 4K | low | med. | high | ultra | QHD | 4K | < 30 fps < 60 fps < 120 fps ≥ 120 fps | | | 2 7 | 3 9 | 9 3 | 6 6 3 | < 30 fps < 60 fps < 120 fps ≥ 120 fps | 1 3 6 | 3 3 4 | 5 5 | 2 3 3 | 4 1 | |
For more games that might be playable and a list of all games and graphics cards visit our Gaming List