AMD Radeon RX 6550M vs Apple M3 Max 40-Core GPU vs Apple M3 Pro 14-Core GPU
AMD Radeon RX 6550M ► remove from comparison
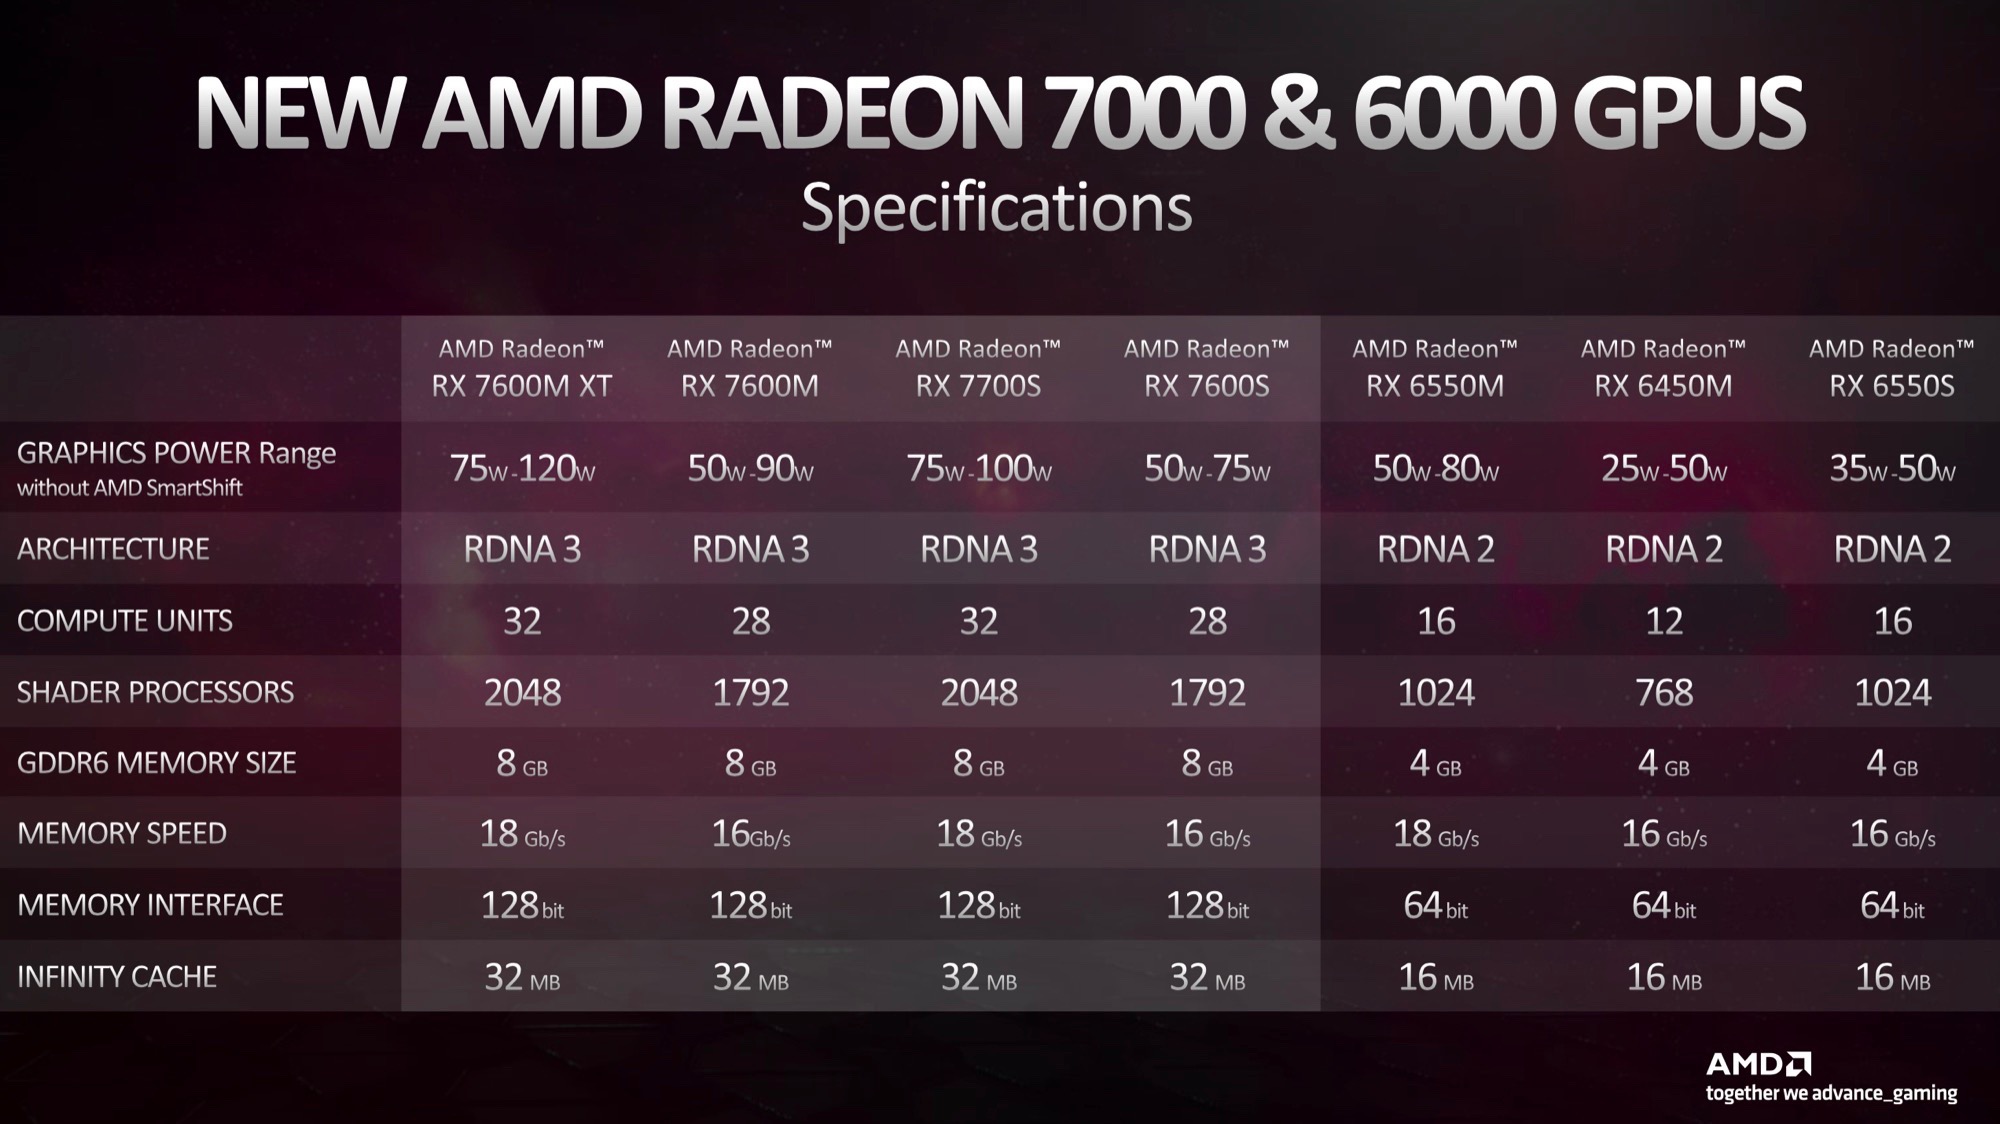
The AMD Radeon RX 6550M is a mobile entry-level graphics card based on the Navi 24 chip (RDNA 2 architecture) manufactured in the modern 6nm process. It features 1024 cores (16 CUs - compute units) and 4 GB of fast GDDR6 graphics memory connected with a 64 Bit memory bus. The chip also includes 16 MB Infinity Cache. The game clock speed is specified at 2560 MHz. Compared to the RX 6500M, the 6550M offers an increased core clock (+17%) but the memory bus i cut in half (64 versus 128 Bit).
The performance should be slightly higher than an average RX 6500M , as long as the memory bandwidth reduction wont has a too big impact.
The Navi 24 chip is manufactured at TSMC in the modern 6nm process and should offer a good energy efficiency. The RX6550M is specified at a TDP of 50 - 80 Watt and therefore best suited for normal multimedia laptops.
Apple M3 Max 40-Core GPU ► remove from comparison
The Apple M3 Max 40-Core GPU is a self-designed graphics card in the Apple M3 SoC and according to Apple with forty cores. According to Apple, the GPU uses a new architecture and now offers dynamic caching, mesh shading and ray tracing acceleration.
The GPU can access up to 128 GB LPDDR5-6400 unified memory via a 512 bit memory bus (max 400 GBit/s). Thanks to dynamic caching, the GPU should only reserve as much memory as is required.
Since the SoC is manufactured in the current 3nm (probably N3B) at TSMC. According to powermetrics, the GPU requires up to 60 watts (chip incl. CPU total 78 watts).
Apple M3 Pro 14-Core GPU ► remove from comparison
The Apple M3 Pro 14-Core GPU is a self-designed graphics card in the Apple M3 Pro (with 11 CPU cores) and offers fourteen of the eighteen cores available on the chip. The graphics card uses a new architecture and now offers dynamic caching, mesh shading and ray tracing acceleration.
The GPU can access up to 24 GB LPDDR5-6400 unified memory via a 192-bit memory bus (max 150 GBit/s). Thanks to dynamic caching, the GPU only reserves as much memory as is required.
The entire chip is manufactured in the current 3nm process (probably N3B) at TSMC.
AMD Radeon RX 6550M Apple M3 Max 40-Core GPU Apple M3 Pro 14-Core GPU Apple M3 Series Architecture RDNA 2 Pipelines 1024 - unified 40 - unified 14 - unified Core Speed 2000 - 2560 (Boost) MHz Theoretical Performance 11.6 TFLOPS FP16, 5.8 TFLOPS FP32 Cache L2: 1 MB, L3: 16 MB Memory Speed 18000 MHz Memory Bus Width 64 Bit Memory Type GDDR6 LPDDR5-6400 LPDDR5-6400 Max. Amount of Memory 4 GB Shared Memory no no no API DirectX 12_2, Shader 6.7, OpenGL 4.6, OpenCL 2.2, Vulkan 1.3 Power Consumption 80 Watt (50 - 80 Watt TGP) 53 Watt Transistors 5.4 Billion Die Size 107 mm² technology 6 nm 5 nm 5 nm Features Radeon Media Engine (H.264, H.265, AV1 en- and decode) Notebook Size medium sized medium sized medium sized Date of Announcement 05.01.2023 31.10.2023 31.10.2023 Link to Manufacturer Page www.amd.com
CPU in M3 Max 40-Core GPU GPU Base Speed GPU Boost / Turbo Apple M3 Max 16-Core 16 x 2748 MHz, 78 W ? MHz ? MHz
CPU in M3 Pro 14-Core GPU GPU Base Speed GPU Boost / Turbo Apple M3 Pro 11-Core 11 x 2748 MHz, 27 W ? MHz ? MHz
Benchmarks 3DMark - 3DMark Time Spy Score
4955 Points (14%)
3DMark - 3DMark Time Spy Graphics
4546 Points (12%)
3DMark - 3DMark Fire Strike Standard Score
12994 Points (23%)
3DMark - 3DMark Fire Strike Standard Graphics
14696 Points (17%)
3DMark - 3DMark Wild Life Extreme Unlimited
min: 31268 avg: 31336 median: 31335.5 (36%) max: 31403 Points
12094 Points (14%)
GPU TDP 24 W TDP 60 W 39% 100%
3DMark 11 - 3DM11 Performance Score
19932 Points (28%)
3DMark 11 - 3DM11 Performance GPU
20506 Points (18%)
Blender - Blender 3.3 Classroom METAL *
min: 29.6 avg: 30.8 median: 30.8 (3%) max: 32 Seconds
73 Seconds (8%)
GPU TDP 24 W TDP 60 W 100% 105%
Cinebench R15 + AMD Radeon RX 6550M Cinebench R15 - Cinebench R15 OpenGL 64 Bit
134.8 fps (8%)
Cinebench R15 OpenGL 64 Bit + Apple M3 Max 40-Core GPU
min: 136.23 avg: 137.4 median: 137.4 (8%) max: 138.52 fps
Cinebench R15 OpenGL 64 Bit + Apple M3 Pro 14-Core GPU
129.9 fps (8%)
GPU TDP 24 W TDP 60 W 95% 100%
Cinebench R15 OpenGL Ref. Match 64 Bit + AMD Radeon RX 6550M Cinebench R15 - Cinebench R15 OpenGL Ref. Match 64 Bit
97.9 % (98%)
Cinebench R15 OpenGL Ref. Match 64 Bit + Apple M3 Max 40-Core GPU
99.5 % (100%)
Cinebench R15 OpenGL Ref. Match 64 Bit + Apple M3 Pro 14-Core GPU
99.5 % (100%)
GPU TDP 24 W TDP 60 W 100% 99%
GFXBench - GFXBench 5.0 4K Aztec Ruins High Tier Offscreen
min: 188.2 avg: 196 median: 196 (80%) max: 203.7 fps
79 fps (32%)
GPU TDP 24 W TDP 60 W 40% 100%
GFXBench - GFXBench 5.0 Aztec Ruins High Tier Offscreen
min: 416 avg: 431 median: 431 (78%) max: 446 fps
178.7 fps (32%)
GPU TDP 24 W TDP 60 W 41% 100%
GFXBench - GFXBench 5.0 Aztec Ruins Normal Tier Offscreen
min: 858 avg: 863 median: 863 (64%) max: 868 fps
481.9 fps (36%)
GPU TDP 24 W TDP 60 W 56% 100%
GFXBench - GFXBench Car Chase Offscreen
min: 556 avg: 560 median: 560 (63%) max: 564 fps
376.3 fps (42%)
GPU TDP 24 W TDP 60 W 67% 100%
GFXBench 3.1 - GFXBench Manhattan ES 3.1 Offscreen
min: 1163 avg: 1178 median: 1178 (25%) max: 1193 fps
565 fps (12%)
GPU TDP 24 W TDP 60 W 48% 100%
GFXBench 3.0 - GFXBench 3.0 Manhattan Offscreen
min: 1557 avg: 1573 median: 1573 (92%) max: 1589 fps
818 fps (48%)
GPU TDP 24 W TDP 60 W 52% 100%
GFXBench (DX / GLBenchmark) 2.7 + Apple M3 Max 40-Core GPU GFXBench (DX / GLBenchmark) 2.7 - GFXBench T-Rex HD Offscreen C24Z16
min: 2893 avg: 2942 median: 2941.5 (23%) max: 2990 fps
GFXBench T-Rex HD Offscreen C24Z16 + Apple M3 Pro 14-Core GPU
1299 fps (10%)
GPU TDP 24 W TDP 60 W 44% 100%
Basemark GPU 1.2 - Basemark GPU 1.2 Vulkan Official Medium Offscreen 1080
104.6 fps (1%)
Basemark GPU 1.2 - Basemark GPU 1.2 Vulkan Official High Offscreen 2160
3.6 fps (1%)
Geekbench 6.2 - Geekbench 6.2 GPU OpenCL
30568 Points (9%)
min: 91413 avg: 91416 median: 91415.5 (26%) max: 91418 Points
42798 Points (12%)
GPU TDP 24 W TDP 60 W 60% 100%
Geekbench 6.2 - Geekbench 6.2 GPU Vulkan
29898 Points (10%)
Geekbench 6.2 - Geekbench 6.2 GPU Metal
min: 154675 avg: 155214 median: 155214 (100%) max: 155752 Points
68043 Points (44%)
GPU TDP 24 W TDP 60 W 44% 100%
Power Consumption - Furmark Stress Test Power Consumption - external Monitor *
114.5 Watt (16%)
Power Consumption - The Witcher 3 Power Consumption - external Monitor *
117.7 Watt (16%)
min: 87.7 avg: 91.6 median: 91.6 (13%) max: 95.4 Watt
32.8 Watt (5%)
GPU TDP 24 W TDP 60 W 111% 100%
Power Consumption - Witcher 3 Power Consumption *
115.8 Watt (25%)
min: 92.5 avg: 100.8 median: 100.8 (22%) max: 109 Watt
42.8 Watt (9%)
GPU TDP 24 W TDP 60 W 118% 100%
Power Consumption - Witcher 3 ultra Power Efficiency
min: 0.633 avg: 0.8 median: 0.8 (81%) max: 0.995 fps per Watt
0.9 fps per Watt (90%)
GPU TDP 24 W TDP 60 W 100% 89%
Power Consumption - Witcher 3 ultra Power Efficiency - external Monitor
min: 0.723 avg: 0.9 median: 0.9 (73%) max: 1.207 fps per Watt
min: 1.189 avg: 1.2 median: 1.2 (99%) max: 1.207 fps per Watt
GPU TDP 24 W TDP 60 W 100% 75%
Emissions Witcher 3 Fan Noise + AMD Radeon RX 6550M Emissions - Witcher 3 Fan Noise
52 dB(A) (83%)
Witcher 3 Fan Noise + Apple M3 Max 40-Core GPU
min: 42.8 avg: 43.1 median: 43.1 (69%) max: 43.4 dB(A)
Witcher 3 Fan Noise + Apple M3 Pro 14-Core GPU
25.1 dB(A) (40%)
GPU TDP 24 W TDP 60 W 54% 100%
Average Benchmarks AMD Radeon RX 6550M → 100% n=3 Average Benchmarks Apple M3 Max 40-Core GPU → 168% n=3 Average Benchmarks Apple M3 Pro 14-Core GPU → 113% n=3
- Range of benchmark values for this graphics card
- Average benchmark values for this graphics card
* Smaller numbers mean a higher performance
1 This benchmark is not used for the average calculation
Game Benchmarks The following benchmarks stem from our benchmarks of review laptops. The performance depends on the used graphics memory, clock rate, processor, system settings, drivers, and operating systems. So the results don't have to be representative for all laptops with this GPU. For detailed information on the benchmark results, click on the fps number.
M3 Max 40-Core GPU:
242 fps
M3 Pro 14-Core GPU:
193 fps
M3 Max 40-Core GPU:
207 212 ~ 210 fps
M3 Pro 14-Core GPU:
125 fps
M3 Max 40-Core GPU:
138 139 ~ 139 fps
M3 Pro 14-Core GPU:
67 fps
M3 Max 40-Core GPU:
97 121 ~ 109 fps
M3 Pro 14-Core GPU:
53 fps
M3 Max 40-Core GPU:
82 82 ~ 82 fps
M3 Pro 14-Core GPU:
35 fps
100%
Radeon RX 6550M:
62.8 fps
72%
M3 Max 40-Core GPU:
45 fps
100%
Radeon RX 6550M:
45.9 fps
96%
M3 Max 40-Core GPU:
44 fps
100%
Radeon RX 6550M:
34.7 fps
127%
M3 Max 40-Core GPU:
43.7 44.4 ~ 44 fps
100%
Radeon RX 6550M:
28.6 fps
147%
M3 Max 40-Core GPU:
40.8 42.8 ~ 42 fps
100%
Radeon RX 6550M:
17.3 fps
208%
M3 Max 40-Core GPU:
35.5 37.4 ~ 36 fps
100%
Radeon RX 6550M:
61.6 fps
100%
Radeon RX 6550M:
52.9 fps
100%
Radeon RX 6550M:
44.7 fps
215%
M3 Max 40-Core GPU:
96 fps
94%
M3 Pro 14-Core GPU:
42 fps
100%
Radeon RX 6550M:
43 fps
209%
M3 Max 40-Core GPU:
90 fps
91%
M3 Pro 14-Core GPU:
39 fps
100%
Radeon RX 6550M:
29 fps
207%
M3 Max 40-Core GPU:
60 fps
M3 Max 40-Core GPU:
51 fps
100%
Radeon RX 6550M:
132.5 fps
100%
Radeon RX 6550M:
120.8 fps
100%
Radeon RX 6550M:
87.5 fps
100%
Radeon RX 6550M:
19.3 fps
100%
Radeon RX 6550M:
11.3 fps
100%
Radeon RX 6550M:
124.1 fps
100%
Radeon RX 6550M:
95.5 fps
100%
Radeon RX 6550M:
59.7 fps
100%
Radeon RX 6550M:
30.3 fps
100%
Radeon RX 6550M:
27.2 fps
M3 Max 40-Core GPU:
170 170 ~ 170 fps
M3 Pro 14-Core GPU:
75 fps
M3 Max 40-Core GPU:
109 113 ~ 111 fps
M3 Pro 14-Core GPU:
49.5 fps
M3 Max 40-Core GPU:
80 84 ~ 82 fps
M3 Pro 14-Core GPU:
35.9 fps
M3 Max 40-Core GPU:
54 58 ~ 56 fps
M3 Pro 14-Core GPU:
22.5 fps
M3 Max 40-Core GPU:
145 150 ~ 148 fps
M3 Pro 14-Core GPU:
66 fps
M3 Max 40-Core GPU:
135 143 ~ 139 fps
M3 Pro 14-Core GPU:
60 fps
M3 Max 40-Core GPU:
118 122 ~ 120 fps
M3 Pro 14-Core GPU:
53 fps
M3 Max 40-Core GPU:
86 88 ~ 87 fps
M3 Pro 14-Core GPU:
34 fps
100%
Radeon RX 6550M:
319 fps
100%
Radeon RX 6550M:
122.5 fps
100%
Radeon RX 6550M:
101.1 fps
100%
Radeon RX 6550M:
88.4 fps
100%
Radeon RX 6550M:
115 fps
100%
Radeon RX 6550M:
91 fps
62%
M3 Max 40-Core GPU:
56 fps
100%
Radeon RX 6550M:
84 fps
64%
M3 Max 40-Core GPU:
53 54 ~ 54 fps
100%
Radeon RX 6550M:
79 fps
65%
M3 Max 40-Core GPU:
50 51 ~ 51 fps
M3 Max 40-Core GPU:
49 49 ~ 49 fps
100%
Radeon RX 6550M:
53.7 fps
100%
Radeon RX 6550M:
41.2 fps
100%
Radeon RX 6550M:
33 fps
100%
Radeon RX 6550M:
129.3 fps
100%
Radeon RX 6550M:
67.4 fps
100%
Radeon RX 6550M:
47.8 fps
100%
Radeon RX 6550M:
31.2 fps
100%
Radeon RX 6550M:
137.1 fps
100%
Radeon RX 6550M:
127.3 fps
100%
Radeon RX 6550M:
112.3 fps
100%
Radeon RX 6550M:
103 fps
100%
Radeon RX 6550M:
277.2 fps
100%
Radeon RX 6550M:
171.5 fps
100%
Radeon RX 6550M:
83.2 fps
105%
M3 Max 40-Core GPU:
87 fps
100%
Radeon RX 6550M:
49.4 fps
164%
M3 Max 40-Core GPU:
69 92 ~ 81 fps
79%
M3 Pro 14-Core GPU:
39 fps
M3 Max 40-Core GPU:
77 79 ~ 78 fps
M3 Pro 14-Core GPU:
79 fps
M3 Max 40-Core GPU:
53 54 ~ 54 fps
M3 Pro 14-Core GPU:
50 fps
M3 Max 40-Core GPU:
51 52 ~ 52 fps
Average Gaming AMD Radeon RX 6550M → 100% Average Gaming 30-70 fps → 100%
Average Gaming Apple M3 Max 40-Core GPU → 134% Average Gaming 30-70 fps → 116%
Average Gaming Apple M3 Pro 14-Core GPU → 88% Average Gaming 30-70 fps → 88%
Apple M3 Max 40-Core GPU low med. high ultra QHD 4K Total War Pharaoh 242 210 139 109 82 Cyberpunk 2077 2.0 Phantom Liberty 45 44 44 42 36 Baldur's Gate 3 96 90 60 Star Wars Jedi Survivor 51 Total War: Three Kingdoms 170 111 82 56 Shadow of the Tomb Raider 148 139 120 87 Far Cry 5 56 54 51 49 The Witcher 3 87 81 GTA V 78 54 52 < 30 fps < 60 fps < 120 fps ≥ 120 fps 1 1 2 3 2 4 2 4 4 1 4 3
Apple M3 Pro 14-Core GPU low med. high ultra QHD 4K Total War Pharaoh 193 125 67 53 35 Baldur's Gate 3 42 39 Total War: Three Kingdoms 75 49.5 35.9 22.5 Shadow of the Tomb Raider 66 60 53 34 The Witcher 3 39 GTA V 79 50 < 30 fps < 60 fps < 120 fps ≥ 120 fps 1 2 1 2 3 6 1 2
AMD Radeon RX 6550M low med. high ultra QHD 4K Cyberpunk 2077 2.0 Phantom Liberty 62.8 45.9 34.7 28.6 17.3 Baldur's Gate 3 61.6 52.9 44.7 43 29 F1 22 132.5 120.8 87.5 19.3 11.3 Tiny Tina's Wonderlands 124.1 95.5 59.7 30.3 27.2 Strange Brigade 319 122.5 101.1 88.4 Far Cry 5 115 91 84 79 X-Plane 11.11 53.7 41.2 33 Final Fantasy XV Benchmark 129.3 67.4 47.8 31.2 Dota 2 Reborn 137.1 127.3 112.3 103 The Witcher 3 277.2 171.5 83.2 49.4 < 30 fps < 60 fps < 120 fps ≥ 120 fps 1 3 6 3 3 4 5 5 2 3 3 4 1
For more games that might be playable and a list of all games and graphics cards visit our Gaming List
v1.26
log 02. 23:37:00
#0 checking url part for id 11558 +0s ... 0s
#1 checking url part for id 11636 +0s ... 0s
#2 checking url part for id 12032 +0s ... 0s
#3 not redirecting to Ajax server +0s ... 0s
#4 did not recreate cache, as it is less than 5 days old! Created at Wed, 01 May 2024 05:36:19 +0200 +0.001s ... 0.001s
#5 composed specs +0.14s ... 0.141s
#6 did output specs +0s ... 0.141s
#7 start showIntegratedCPUs +0s ... 0.141s
#8 getting avg benchmarks for device 11558 +0.041s ... 0.182s
#9 got single benchmarks 11558 +0.013s ... 0.195s
#10 getting avg benchmarks for device 11636 +0.002s ... 0.196s
#11 got single benchmarks 11636 +0.01s ... 0.206s
#12 getting avg benchmarks for device 12032 +0.002s ... 0.208s
#13 got single benchmarks 12032 +0.008s ... 0.216s
#14 got avg benchmarks for devices +0s ... 0.216s
#15 min, max, avg, median took s +0.129s ... 0.345s
#16 before gaming benchmark output +0s ... 0.345s
#17 Got 114 rows for game benchmarks. +0.034s ... 0.379s
#18 composed SQL query for gamebenchmarks +0s ... 0.379s
#19 got data and put it in $dataArray +0.012s ... 0.39s
#20 benchmarks composed for output. +0.036s ... 0.427s
#21 calculated avg scores. +0s ... 0.427s
#22 return log +0.002s ... 0.429s
Please share our article, every link counts!
Redaktion, 2017-09- 8 (Update: 2023-07- 1)
 Deutsch
 English
 Español
 Français
 Italiano
 Nederlands
 Polski
 Português
 Русский
 Türkçe
 Svenska
 Chinese
 Magyar