The AMD Ryzen 9 7845HX is a fast high-end laptop processor of the Dragon Range series. It offers 12 of the 16 cores based on the Zen 4 architecture that supports hyperthreading (24 threads). The cores clock from 3 (base) up to 5.2 GHz (single core boost). The 7845HX is the second-fastest mobile Ryzen CPU at launch and derived from the desktop Ryzen 9 7900X.
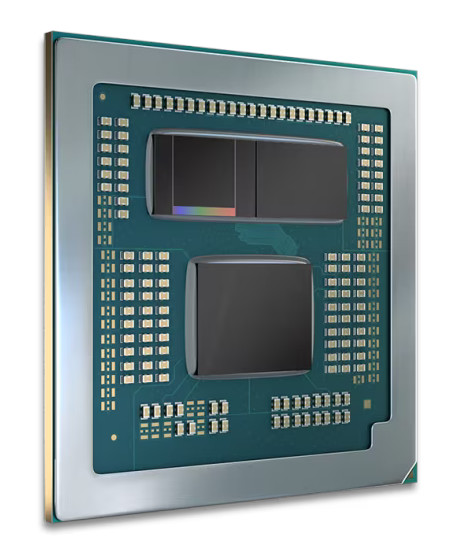
The Dragon Range series still uses a chiplet design with two CCD-clusters (each with 8 possible cores) in 5nm and an IO-die (including the memory controller and the Radeon 610M iGPU) in 6nm. The chip integrates 4x USB 3.2 Gen2 (10 Gbps) ports (no USB4), 28 PCIe 5.0 lanes (for GPU and SSDs) and a dual-channel DDR5-5200 memory controller.
Performance
The average 7845HX in our database is in the same league as the Core i9-13900HX, as far as multi-thread benchmark scores are concerned. This is a super-fast chip, as of mid 2023; of course, your mileage may vary depending on how competent the cooling solution of your laptop is and how high the CPU power limits are.
The R9 7845HX is rated at a TDP of 55 Watt and can be configured from 45 to 75 Watt (cTDP).
The AMD Ryzen 7 7745HX is a fast high-end laptop processor of the Dragon Range series. It offers 8 cores based on the Zen 4 architecture that supports hyperthreading (16 threads). The cores clock from 3.6 (base) up to 5.1 GHz (single core boost).
The Dragon Range series still uses a chiplet design with two CCD-clusters (each with 8 possible cores, the 7745HX only uses one CCD) in 5nm and an IO-die (including the memory controller and the Radeon 610M iGPU) in 6nm. The chip integrates 4x USB 3.2 Gen2 (10 Gbps) ports (no USB4), 28 PCIe 5.0 lanes (for GPU and SSDs) and a dual-channel DDR5-5200 memory controller.
Performance
The average 7745HX in our database is in the same league as the Core i5-13500HX and the Core i7-13705H, as far as multi-thread benchmark scores are concerned. This is a very fast chip, as of early 2023, and it will make both content creators and gamers happy - for the next two years or so, at least. Your mileage may vary depending on how competent the cooling solution of your system is and how high the CPU power limits are.
The R7 7745HX is rated at a TDP of 55 Watt and can be configured up to 75 Watt (cTDP).
The AMD Ryzen 9 7945HX3D is a fast high-end laptop processor of the Dragon Range series. It offers 16 cores based on the Zen 4 architecture that supports hyperthreading (32 threads). The cores clock from 2.3 (base) up to 5.4 GHz (single core boost). Compared to the similar R9 7945HX, the 7945HX3D offers an additional 64 MB 3D V-Cache on one CCD-Cluster. This helps in some workloads that can use the additional fast cache (e.g. some games). The guaranteed base clock however was reduced from 2.5 to 2.3 GHz.
The performance of the R9 7945HX3D is similar to the R9 7945HX in workloads that wont make use of the bigger L3 cache. Most games however can use the additional memory. AMD e.g. was advertising the HX3D with 4% to 53% higher performance in 1080p high settings.
The Dragon Range series still uses a chiplet design with two CCD-clusters (each with 8 possible cores) in 5nm and an IO-die (including the memory controller and the Radeon 610M iGPU) in 6nm. The chip integrates 4x USB 3.2 Gen2 (10 Gbps) ports (no USB4), 28 PCIe 5.0 lanes (for GPU and SSDs) and a dual-channel DDR5-5200 memory controller.
The R9 7945HX3D is rated at a TDP of 55 Watt and can be configured up to 75 Watt (cTDP).
Average Benchmarks AMD Ryzen 9 7945HX3D → 115%n=23
- Range of benchmark values for this graphics card - Average benchmark values for this graphics card * Smaller numbers mean a higher performance 1 This benchmark is not used for the average calculation
v1.26
log 06. 12:38:19
#0 checking url part for id 14938 +0s ... 0s
#1 checking url part for id 14940 +0s ... 0s
#2 checking url part for id 15073 +0s ... 0s
#3 not redirecting to Ajax server +0s ... 0s
#4 did not recreate cache, as it is less than 5 days old! Created at Sat, 04 May 2024 05:40:37 +0200 +0.001s ... 0.001s
#5 composed specs +0.038s ... 0.039s
#6 did output specs +0s ... 0.039s
#7 getting avg benchmarks for device 14938 +0.018s ... 0.057s
#8 got single benchmarks 14938 +0.015s ... 0.072s
#9 getting avg benchmarks for device 14940 +0.014s ... 0.086s
#10 got single benchmarks 14940 +0.016s ... 0.101s
#11 getting avg benchmarks for device 15073 +0.011s ... 0.113s
#12 got single benchmarks 15073 +0.009s ... 0.122s
#13 got avg benchmarks for devices +0s ... 0.122s
#14 min, max, avg, median took s +0.464s ... 0.585s
 Deutsch
 English
 Español
 Français
 Italiano
 Nederlands
 Polski
 Português
 Русский
 Türkçe
 Svenska
 Chinese
 Magyar