Notebookcheck Logo

AMD Ryzen 7 7700X vs Intel Core i7-12700K vs Intel Core i7-12700

AMD Ryzen 7 7700X

► remove from comparison AMD R7 7700X

The AMD Ryzen 7 7700X is a fast high-end desktop processor of the Raphael series. It offers 8 cores based on the Zen 4 architecture that supports hyperthreading (16 threads). The cores clock from 4.5 (base) up to 5.4 GHz (single core boost). Compared to the faster Ryzen 9 CPUs (like the 7900X), the R7 offers less cores and slightly lower clock speeds.

The performance of the R7 7700X is clearly better than the old Ryzen 7 of the 5000 generation thanks to the improved architecture and modern 5nm process. Compared to Intels Alder Lake Core i7-12900K the performance is quite similar but stays behind the newer Rocket Lake i5-13600K (multi-threaded).

The Raphael series still uses a chiplet design with two CCD-clusters (each with 8 possible cores, so only one used for the 7700X) in 5nm and an IO-die (including the memory controller and the Radeon Graphics iGPU) in 6nm.

Intel Core i7-12700K

► remove from comparison Intel i7-12700K

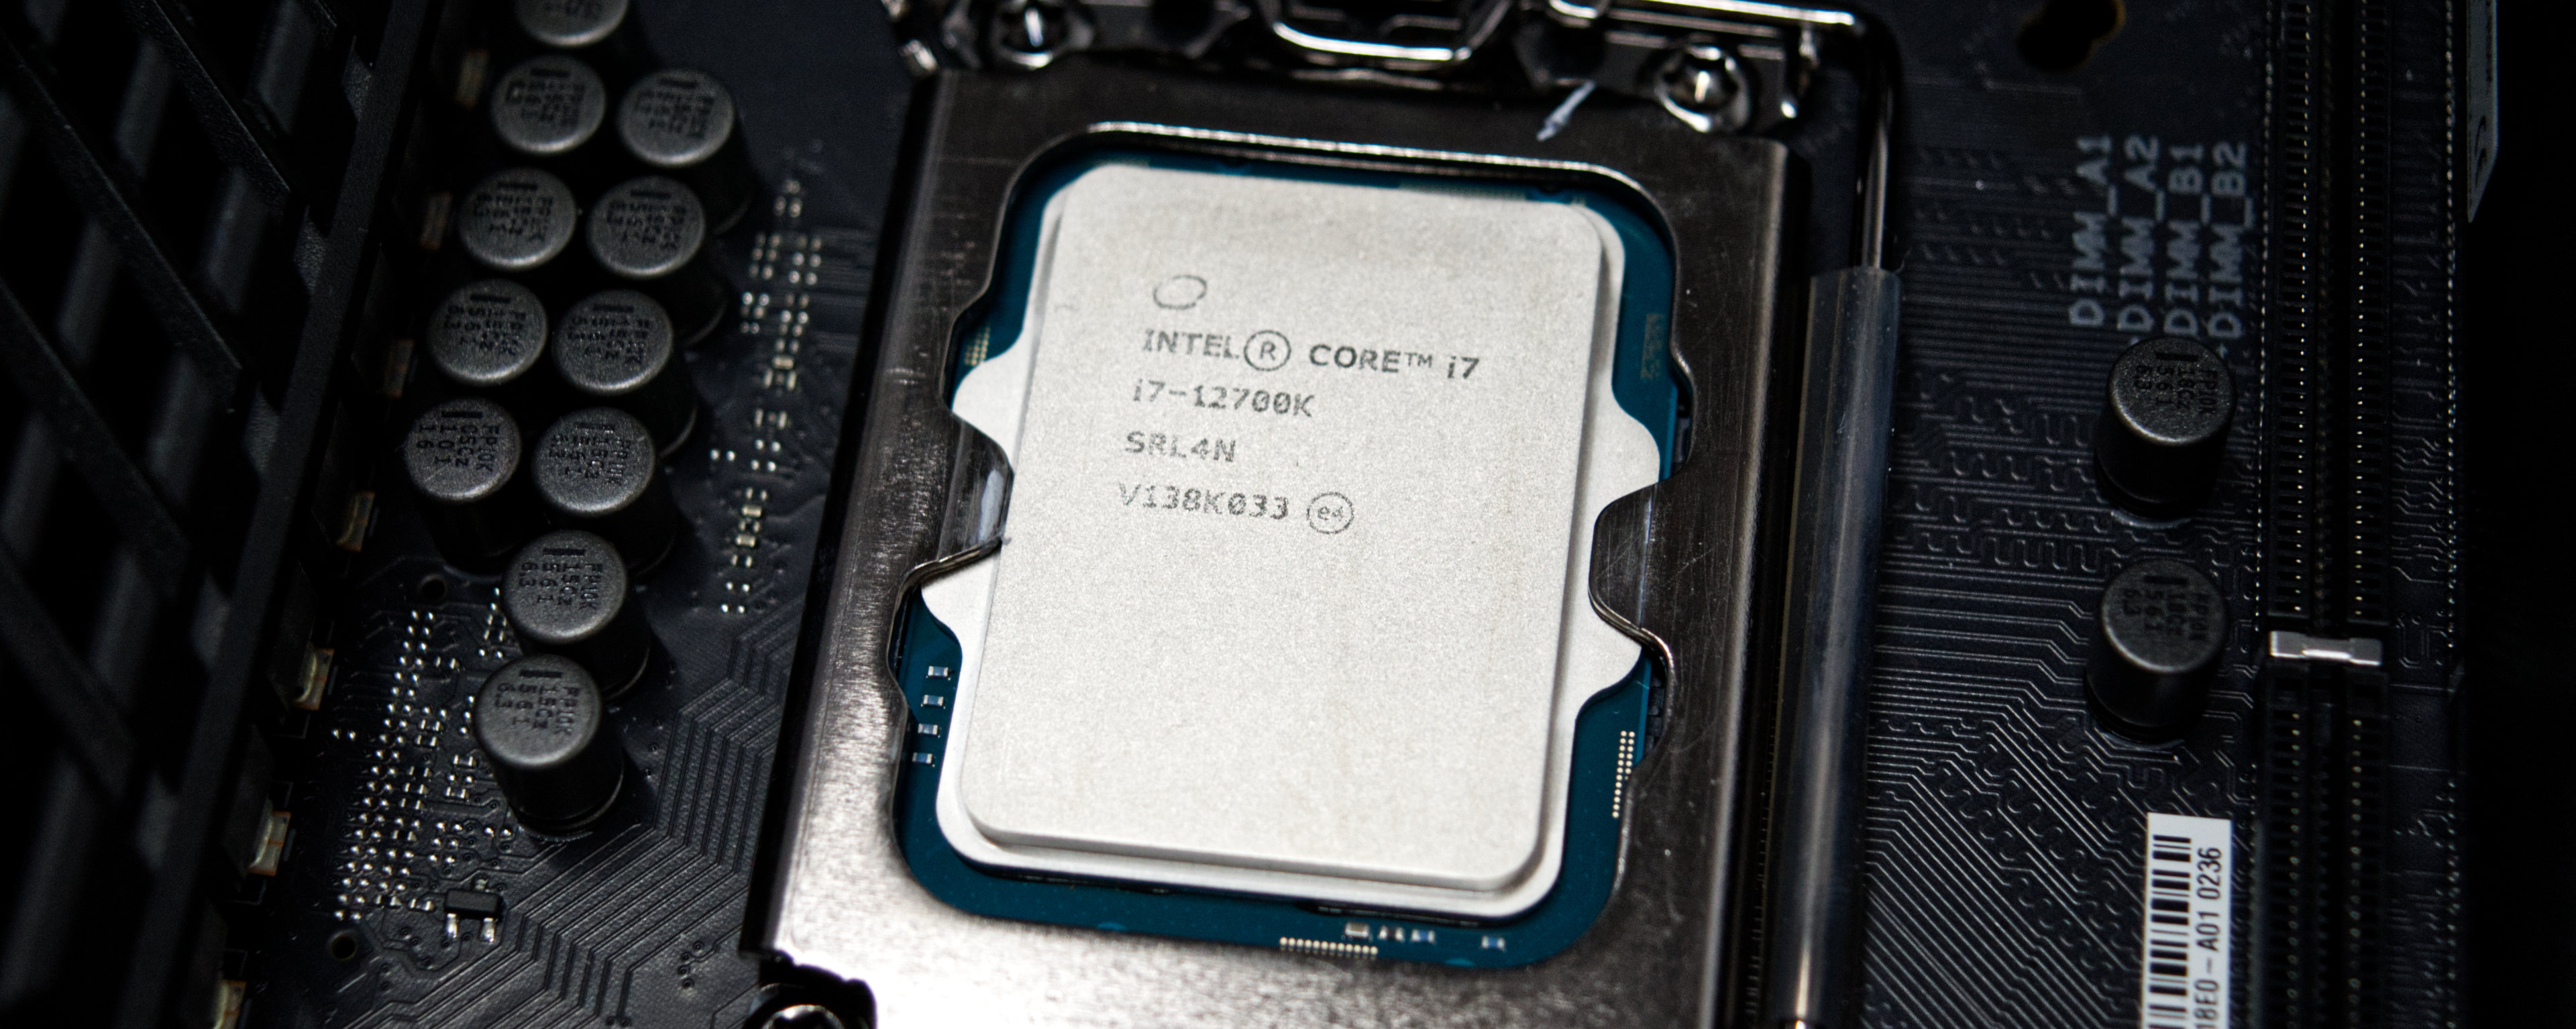
The Intel Core i7-12700K is a high end CPU for desktops based on the Alder Lake architecture. It was first announced in November 2021 and offers 8 performance cores and 4 efficiency cores. The performance cores (P-cores) support HyperThreading, leading to 20 Threads that can be processed at once. The performance cores can clock with up to 5 GHz (Turbo Boost Max 3.0), the efficiency cores can clock with up to 3.9 GHz. All cores can use 25 MB Smart Cache. The integrated memory controller supports up to 128 GB DDR5 with 4800 MT/s (dual channel).

Thread Director (in hardware) can support the operating system to decide which thread to use on the performance or efficiency cores for the best performance.

The integrated graphics adapter is based on the Xe-architecture and called Intel UHD Graphics 770. It clocks between 300 and 1.5 GHz.

For AI tasks, the CPU also integrates GNA 3.0 and DL Boost. Quick Sync in version 8 is the same as in the Rocket Lake CPUs and supports MPEG-2, AVC, VC-1 decode, JPEG, VP8 decode, VP9, HEVC and AV1 decode in hardware.

Performance

The average 12700K in our database is way ahead of the Ryzen 7 5800X and the Ryzen 9 3900X, as far as multi-thread benchmark scores are concerned. Which is a very, very impressive result, as of late 2022.

Power consumption

This Core i7 series chip has a Base power consumption of 125 W, with its highest Intel-recommended Turbo power consumption sitting at 190 W. It might be a good idea to get an AIO cooling solution for a chip this power hungry.

The i7-12700K is manufactured on Intel's fourth-generation 10 nm process marketed as Intel 7 for lower-than-average, as of early 2023, energy efficiency.

Intel Core i7-12700

► remove from comparison Intel i7-12700

The Intel Core i7-12700F is a fast eight-core desktop processor based on the Alder Lake architecture, which was introduced in November 2021. The processor offers a base clock of 3.3 GHz and reaches up to 4.9 GHz in Turbo. In the same way, the Intel Core i7-12700K the Core i7-12700F is based on a hybrid architecture of 8P and 4E cores. The innovations of the Alder Lake-S processor compared to Rocket Lake, together with the smaller 10 nm manufacturing process, are clearly noticeable. The Intel Core i7-12700 does not offer a free multiplier, which means that overclocking is not possible.

Performance

Compared to the Intel Core i7-11700 , performance has been increased with a better IPC. The additional e-cores are also clearly noticeable in multi-threaded applications. Overall, this provides a noticeable performance boost, which also has an effect on all application areas. The 4 E-Cores provide the P-Cores with significantly more power. If all requirements are met, Intel Turbo Boost 3.0can increase the clock rate of the P-Cores to up to 4.9 GHz. The E-cores also offer a turbo and clock up to 3.6 GHz.

Graphics unit

The Intel Core i7-12700 is a processor with an integrated graphics unit. However, with the Intel UHD Graphics 770 there is only a simple iGPU which is only suitable for office use.

Power consumption

The TDP of the Intel Core i7-12700 is 65 watts, with the option to consume up to 180 watts in Turbo mode. If all restrictions are deactivated in the BIOS, the PL2 value can be achieved permanently. However, a high-quality and powerful cooling unit should be used for this.

ModelAMD Ryzen 7 7700XIntel Core i7-12700KIntel Core i7-12700
CodenameRaphael (Zen4)Alder LakeAlder Lake
SeriesAMD Raphael (Zen 4, Ryzen 7000)Intel Alder Lake-SIntel Alder Lake-S
Series: Alder Lake-S Alder Lake
AMD Ryzen 9 7950X3D4.2 - 5.7 GHz16 / 32 cores128 MB L3
AMD Ryzen 9 7900X4.7 - 5.6 GHz12 / 24 cores64 MB L3
AMD Ryzen 9 79003.7 - 5.4 GHz12 / 24 cores64 MB L3
AMD Ryzen 7 7700X « 4.5 - 5.4 GHz8 / 16 cores32 MB L3
AMD Ryzen 7 77003.8 - 5.3 GHz8 / 16 cores32 MB L3
AMD Ryzen 7 7800X3D4.2 - 5 GHz8 / 16 cores96 MB L3
AMD Ryzen 5 7600X4.7 - 5.3 GHz6 / 12 cores32 MB L3
AMD Ryzen 5 76003.8 - 5.1 GHz6 / 12 cores32 MB L3
Intel Core i9-12900K3.2 - 5.2 GHz16 / 24 cores30 MB L3
Intel Core i9-129002.4 - 5.1 GHz16 / 24 cores20 MB L3
Intel Core i7-12700K « 2.7 - 5 GHz12 / 20 cores25 MB L3
Intel Core i7-12700F3.3 - 4.9 GHz12 / 20 cores25 MB L3
Intel Core i7-127003.3 - 4.9 GHz12 / 20 cores25 MB L3
Intel Core i5-12600K2.8 - 4.9 GHz10 / 16 cores20 MB L3
Intel Core i9-12900K3.2 - 5.2 GHz16 / 24 cores30 MB L3
Intel Core i9-129002.4 - 5.1 GHz16 / 24 cores20 MB L3
Intel Core i7-12700K2.7 - 5 GHz12 / 20 cores25 MB L3
Intel Core i7-12700F3.3 - 4.9 GHz12 / 20 cores25 MB L3
Intel Core i7-12700 « 3.3 - 4.9 GHz12 / 20 cores25 MB L3
Intel Core i5-12600K2.8 - 4.9 GHz10 / 16 cores20 MB L3
Clock4500 - 5400 MHz2700 - 5000 MHz3300 - 4900 MHz
L1 Cache512 KB1 MB
L2 Cache8 MB12 MB12 MB
L3 Cache32 MB25 MB25 MB
Cores / Threads8 / 1612 / 2012 / 20
TDP170 Watt125 Watt65 Watt
Transistors9.9 Million
Technology5 nm10 nm10 nm
Voltage0.650 - 1.475V V
Die Size2x 70 (CCD) mm2 + 122 (I/O) mm2215 mm2
max. Temp.95 °C100 °C100 °C
SocketAM5 (LGA 1718)LGA1700LGA 1700
FeaturesMMX(+), SSE, SSE2, SSE3, SSSE3, SSE4.1, SSE4.2, SSE4A, x86-64, AMD-V, AES, AVX, AVX2, AVX512F, FMA3, SHA, Precision Boost 2DDR4-3200/DDR5-4800 RAM, PCIe 5, Thr. Dir., DL Boost, GNA, vPro Enterp., MMX, SSE, SSE2, SSE3, SSSE3, SSE4.1, SSE4.2, AVX, AVX2, BMI2, ABM, FMA, ADX, SMEP, SMAP, EIST, TM1, TM2, HT, Turbo, SST, AES-NI, RDRAND, RDSEED, SHA
iGPUAMD Radeon Graphics (Ryzen 7000) (400 - 2200 MHz)Intel UHD Graphics 770 (300 - 1500 MHz)Intel UHD Graphics 770 (300 - 1500 MHz)
Architecturex86x86x86
Announced
Manufacturerwww.amd.comark.intel.comwww.intel.de
$409 U.S.$349 U.S.

Benchmarks

Performance Rating - CB R15 + R20 + 7-Zip + X265 + Blender + 3DM11 CPU - R7 7700X
45.1 pt (75%)
Restrict / Search: Model: Max. age: years
Performance Rating - CB R15 + R20 + 7-Zip + X265 + Blender + 3DM11 CPU - i7-12700K
41.2 pt (69%)
Restrict / Search: Model: Max. age: years
Performance Rating - CB R15 + R20 + 7-Zip + X265 + Blender + 3DM11 CPU - i7-12700
41.2 pt (69%)
Restrict / Search: Model: Max. age: years
Cinebench R23 - Cinebench R23 Multi Core
min: 18667     avg: 19088     median: 19088 (18%)     max: 19509 Points
min: 17003     avg: 19784     median: 19784 (18%)     max: 22565 Points
21751 Points (20%)
Cinebench R23 - Cinebench R23 Single Core
min: 1986     avg: 1987     median: 1987 (84%)     max: 1988 Points
min: 1806     avg: 1851     median: 1850.5 (78%)     max: 1895 Points
1894 Points (80%)
Cinebench R20 - Cinebench R20 CPU (Single Core)
min: 772     avg: 773     median: 772.5 (84%)     max: 773 Points
min: 731     avg: 736     median: 735.5 (80%)     max: 740 Points
731 Points (80%)
Cinebench R20 - Cinebench R20 CPU (Multi Core)
min: 7308     avg: 7463     median: 7462.5 (18%)     max: 7617 Points
min: 6953     avg: 7801     median: 7800.5 (19%)     max: 8648 Points
8338 Points (20%)
Cinebench R15 - Cinebench R15 CPU Multi 64 Bit
min: 3036     avg: 3114     median: 3113.5 (20%)     max: 3191 Points
3325 Points (21%)
3151 Points (20%)
Cinebench R15 - Cinebench R15 CPU Single 64 Bit
min: 314     avg: 315     median: 315 (87%)     max: 316 Points
272 Points (75%)
272 Points (75%)
Cinebench R11.5 - Cinebench R11.5 CPU Multi 64 Bit
36.1 Points (47%)
38.4 Points (50%)
36.9 Points (48%)
Cinebench R11.5 - Cinebench R11.5 CPU Single 64 Bit
3.7 Points (88%)
3.3 Points (78%)
3.3 Points (78%)
Cinebench R10 - Cinebench R10 Rend. Single (32bit)
8633 Points (52%)
9305 Points (56%)
9171 Points (55%)
Cinebench R10 - Cinebench R10 Rend. Multi (32bit)
56024 Points (41%)
63484 Points (46%)
60892 Points (44%)
Cinebench R10 - Cinebench R10 Rend. Multi (64bit)
102539 Points (65%)
103354 Points (66%)
Cinebench R10 - Cinebench R10 Rend. Single (64bit)
15179 Points (18%)
15091 Points (18%)
wPrime 2.10 - wPrime 2.0 1024m *
61.1 s (1%)
171.2 s (2%)
272.8 s (3%)
wPrime 2.10 - wPrime 2.0 32m *
2.2 s (0%)
2.7 s (1%)
2.9 s (1%)
WinRAR - WinRAR 4.0
14879 Points (24%)
10389 Points (16%)
9328 Points (15%)
7-Zip 18.03 - 7-Zip 18.03 Multi Thread 4 runs
min: 85624     avg: 85707     median: 85706.5 (49%)     max: 85789 MIPS
min: 65508     avg: 73439     median: 73438.5 (42%)     max: 81369 MIPS
78331 MIPS (45%)
7-Zip 18.03 - 7-Zip 18.03 Single Thread 4 runs
min: 8052     avg: 8074     median: 8074 (95%)     max: 8096 MIPS
min: 6117     avg: 6270     median: 6269.5 (74%)     max: 6422 MIPS
6292 MIPS (74%)
X264 HD Benchmark 4.0 - x264 Pass 2
181.2 fps (61%)
179 fps (60%)
172.4 fps (58%)
X264 HD Benchmark 4.0 - x264 Pass 1
373.5 fps (86%)
349.5 fps (81%)
347 fps (80%)
HWBOT x265 Benchmark v2.2 - HWBOT x265 4k Preset
min: 24.8     avg: 25.5     median: 25.5 (45%)     max: 26.1 fps
min: 14.9     avg: 20.5     median: 20.5 (36%)     max: 26.1 fps
25.5 fps (45%)
TrueCrypt - TrueCrypt Serpent
1.4 GB/s (41%)
1.6 GB/s (47%)
1.5 GB/s (44%)
TrueCrypt - TrueCrypt Twofish
2.3 GB/s (40%)
2.8 GB/s (48%)
2.7 GB/s (47%)
TrueCrypt - TrueCrypt AES
17.5 GB/s (46%)
15.7 GB/s (41%)
14.5 GB/s (38%)
Blender - Blender 3.3 Classroom CPU *
min: 255     avg: 261     median: 261 (3%)     max: 267 Seconds
242 Seconds (3%)
Blender - Blender 2.79 BMW27 CPU *
min: 160     avg: 163     median: 163 (1%)     max: 166 Seconds
min: 152.3     avg: 173.1     median: 173.1 (1%)     max: 193.9 Seconds
151 Seconds (1%)
R Benchmark 2.5 - R Benchmark 2.5 *
min: 0.3758     avg: 0.4     median: 0.4 (8%)     max: 0.383 sec
min: 0.412     avg: 0.4     median: 0.4 (9%)     max: 0.423 sec
0.4 sec (9%)
3DMark 06 - CPU - 3DMark 06 - CPU
18115 Points (39%)
16827 Points (36%)
15390 Points (33%)
Super Pi mod 1.5 XS 1M - Super Pi mod 1.5 XS 1M *
6.3 s (1%)
7.3 s (2%)
7.5 s (2%)
Super Pi mod 1.5 XS 2M - Super Pi mod 1.5 XS 2M *
13.6 s (1%)
16.6 s (1%)
16.8 s (1%)
Super Pi Mod 1.5 XS 32M - Super Pi mod 1.5 XS 32M *
322.8 s (1%)
387 s (2%)
400.4 s (2%)
3DMark Vantage - 3DM Vant. Perf. CPU no Physx
93250 Points (72%)
72464 Points (56%)
3DMark 11 - 3DM11 Performance Physics
31467 Points (77%)
min: 23129     avg: 24947     median: 24947 (61%)     max: 26765 Points
27022 Points (67%)
3DMark - 3DMark Ice Storm Physics
109742 Points (89%)
86815 Points (71%)
3DMark - 3DMark Ice Storm Extreme Physics
112268 Points (91%)
86587 Points (70%)
3DMark - 3DMark Ice Storm Unlimited Physics
109389 Points (91%)
96264 Points (80%)
3DMark - 3DMark Cloud Gate Physics
min: 21804     avg: 23017     median: 23017 (58%)     max: 24230 Points
23193 Points (59%)
3DMark - 3DMark Fire Strike Standard Physics
35357 Points (63%)
min: 31240     avg: 34160     median: 34159.5 (61%)     max: 37079 Points
34681 Points (62%)
3DMark - 3DMark Time Spy CPU
14182 Points (60%)
min: 13915     avg: 15550     median: 15550 (66%)     max: 17185 Points
16400 Points (69%)
Geekbench 5.5 - Geekbench 5.1 - 5.5 64 Bit Single-Core
2218 Points (87%)
min: 1890     avg: 1912     median: 1911.5 (75%)     max: 1933 Points
1924 Points (75%)
Geekbench 5.5 - Geekbench 5.1 - 5.5 64 Bit Multi-Core
min: 13889     avg: 14131     median: 14131 (25%)     max: 14373 Points
min: 12475     avg: 14016     median: 14016 (25%)     max: 15557 Points
14961 Points (27%)
Geekbench 5.0 - Geekbench 5.0 64 Bit Single-Core
2123 Points (9%)
min: 1835     avg: 1841     median: 1840.5 (8%)     max: 1846 Points
1845 Points (8%)
Geekbench 5.0 - Geekbench 5.0 64 Bit Multi-Core
14215 Points (45%)
min: 12318     avg: 13879     median: 13879 (44%)     max: 15440 Points
14883 Points (47%)
Geekbench 4.4 - Geekbench 4.1 - 4.4 64 Bit Single-Core
8991 Points (90%)
8133 Points (81%)
8059 Points (80%)
Geekbench 4.4 - Geekbench 4.1 - 4.4 64 Bit Multi-Core
56909 Points (57%)
55786 Points (56%)
52676 Points (53%)
Mozilla Kraken 1.1 - Kraken 1.1 Total Score *
440 ms (1%)
min: 496     avg: 498     median: 498 (1%)     max: 500 ms
508 ms (1%)
WebXPRT 4 - WebXPRT 4 Score
301 Points (83%)
268 Points (74%)
WebXPRT 3 - WebXPRT 3 Score
355 Points (64%)
min: 301     avg: 303.5     median: 303.5 (54%)     max: 306 Points
314 Points (56%)
CrossMark - CrossMark Overall
min: 2297     avg: 2313     median: 2312.5 (86%)     max: 2328 Points
1999 Points (75%)
2016 Points (75%)
Power Consumption - Prime95 Power Consumption - external Monitor *
min: 189.8     avg: 209.9     median: 209.9 (36%)     max: 230 Watt
min: 132.1     avg: 206.6     median: 206.6 (36%)     max: 281 Watt
327 Watt (56%)
Power Consumption - Cinebench R15 Multi Power Consumption - external Monitor *
min: 196.1     avg: 218.1     median: 218.1 (40%)     max: 240 Watt
278.2 Watt (51%)
284 Watt (52%)
Power Consumption - Idle Power Consumption - external Monitor *
min: 89.8     avg: 94     median: 94 (62%)     max: 98.2 Watt
82.7 Watt (55%)
Power Consumption - Power Efficiency - Cinebench R15 Multi external Monitor
min: 13.3     avg: 14.4     median: 14.4 (11%)     max: 15.5 Points per Watt
12 Points per Watt (9%)

Average Benchmarks AMD Ryzen 7 7700X → 100% n=39

Average Benchmarks Intel Core i7-12700K → 92% n=39

Average Benchmarks Intel Core i7-12700 → 92% n=39

- Range of benchmark values for this graphics card
red legend - Average benchmark values for this graphics card
* Smaller numbers mean a higher performance
1 This benchmark is not used for the average calculation

v1.33
log 07. 05:22:07

#0 ran 0s before starting gpusingle class +0s ... 0s

#1 checking url part for id 14655 +0s ... 0s

#2 checking url part for id 14033 +0s ... 0s

#3 checking url part for id 14995 +0s ... 0s

#4 redirected to Ajax server, took 1754536927s time from redirect:0 +0s ... 0s

#5 did not recreate cache, as it is less than 5 days old! Created at Thu, 07 Aug 2025 05:18:16 +0200 +0s ... 0s

#6 composed specs +0.006s ... 0.006s

#7 did output specs +0s ... 0.006s

#8 getting avg benchmarks for device 14655 +0.004s ... 0.01s

#9 got single benchmarks 14655 +0.004s ... 0.014s

#10 getting avg benchmarks for device 14033 +0.003s ... 0.017s

#11 got single benchmarks 14033 +0.005s ... 0.022s

#12 getting avg benchmarks for device 14995 +0.003s ... 0.025s

#13 got single benchmarks 14995 +0.004s ... 0.029s

#14 got avg benchmarks for devices +0s ... 0.029s

#15 min, max, avg, median took s +0.068s ... 0.098s

#16 return log +0s ... 0.098s

Please share our article, every link counts!
Mail Logo
> Expert Reviews and News on Laptops, Smartphones and Tech Innovations > Benchmarks / Tech > Processor Comparison - Head 2 Head
Redaktion, 2017-09- 8 (Update: 2023-07- 1)