Notebookcheck Logo

AMD Ryzen 7 7700X vs Intel Core i5-13400F vs Intel Core i7-13700

AMD Ryzen 7 7700X

► remove from comparison AMD R7 7700X

The AMD Ryzen 7 7700X is a fast high-end desktop processor of the Raphael series. It offers 8 cores based on the Zen 4 architecture that supports hyperthreading (16 threads). The cores clock from 4.5 (base) up to 5.4 GHz (single core boost). Compared to the faster Ryzen 9 CPUs (like the 7900X), the R7 offers less cores and slightly lower clock speeds.

The performance of the R7 7700X is clearly better than the old Ryzen 7 of the 5000 generation thanks to the improved architecture and modern 5nm process. Compared to Intels Alder Lake Core i7-12900K the performance is quite similar but stays behind the newer Rocket Lake i5-13600K (multi-threaded).

The Raphael series still uses a chiplet design with two CCD-clusters (each with 8 possible cores, so only one used for the 7700X) in 5nm and an IO-die (including the memory controller and the Radeon Graphics iGPU) in 6nm.

Intel Core i5-13400F

► remove from comparison Intel i5-13400F

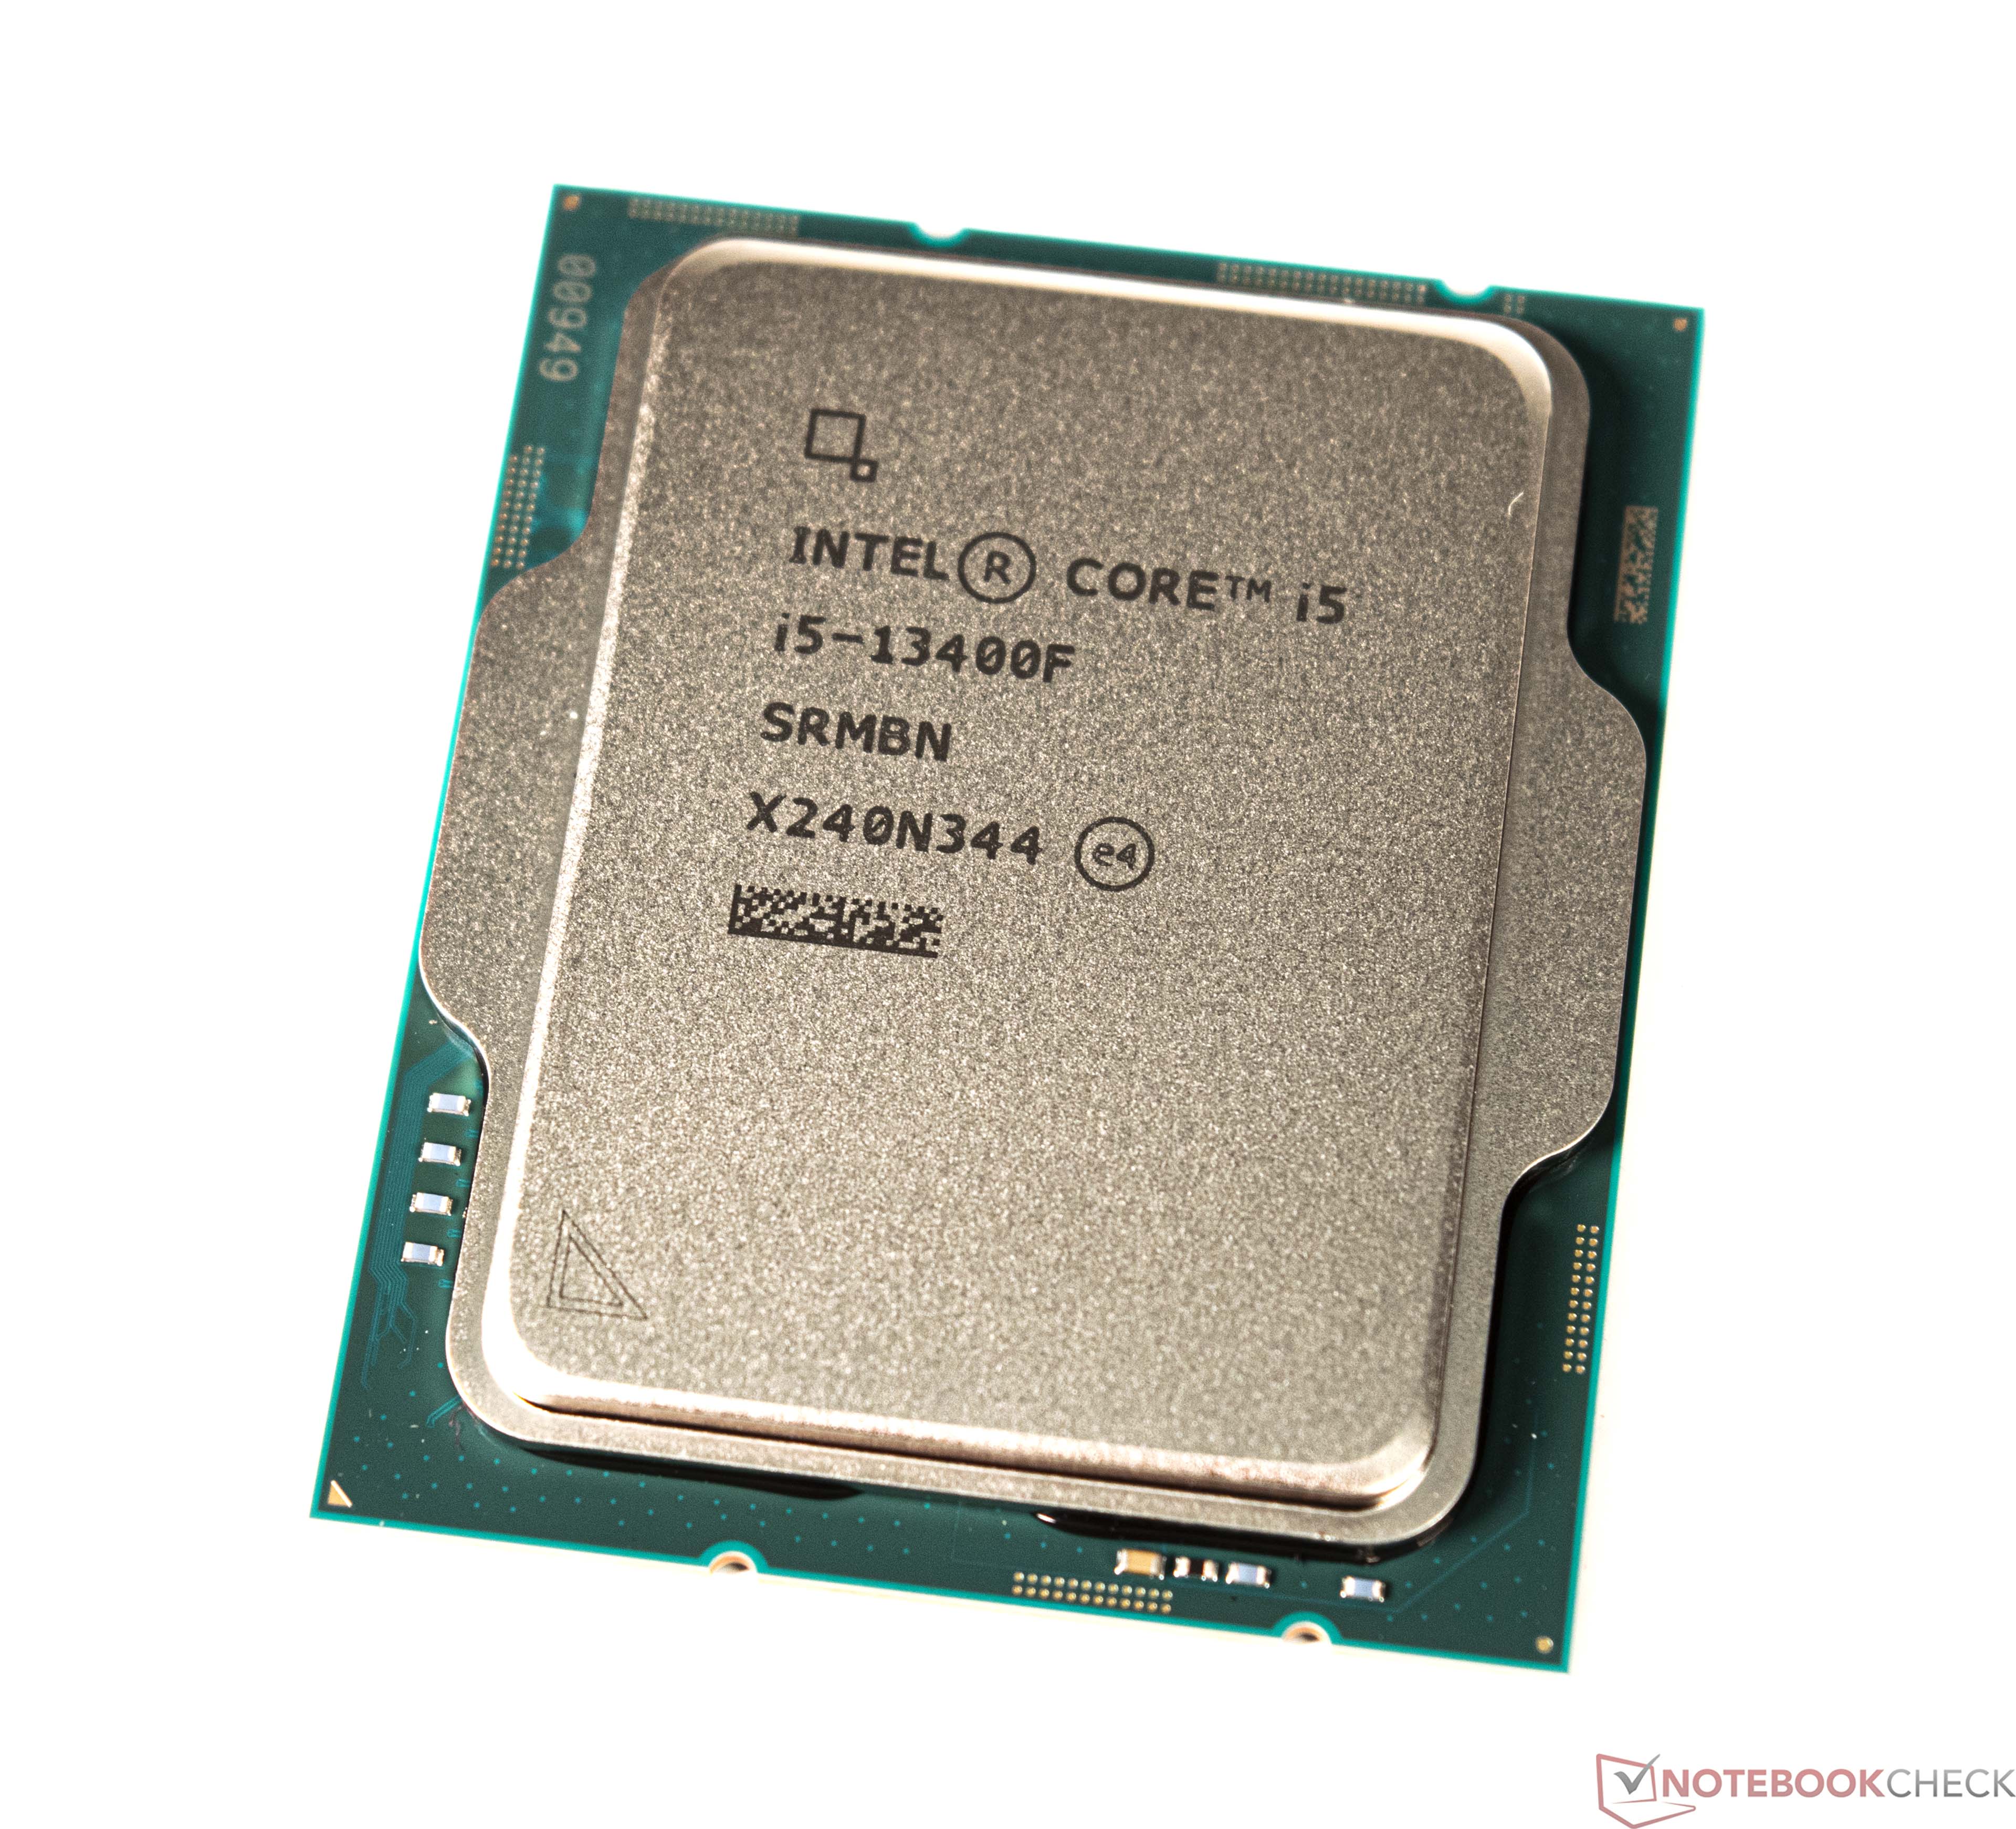
The Intel Core i5-13400F is a mid-range desktop processor of the Raptor Lake series. It includes a hybrid architecture for the CPU cores with combined 10 cores. Six fast Golden Cove / Raptor Cove performance cores (P-cores) with HyperThreading and a clock speed of 3.5 - 5.1 GHz and four Gracemont efficiency cores without HyperThreading and a clock speed of 2.6 - 3.9 GHz. The 13400F can be based on the older Alder Lake chips (at least for early models) or the newer Raptor Lake chips. The F-series of CPUs do not integrate a iGPU.

The performance is clearly higher than the old Core i5-12400F due to the additional four E-cores. These help in multi-threaded workloads and the higher boost core of the p-cores help for single threaded workloads.

The power consumption of the 13400F is rated at 65 Watt for sustained workloads (PL1) and 148 Watt for short bursts (PL2).

Intel Core i7-13700

► remove from comparison Intel i7-13700

The Intel Core i7-13700 is a fast and relatively economical desktop processor from the current Raptor Lake series. The processor was introduced in early 2023 and offers a base clock of 2.1 GHz. It reaches up to 5.2 GHz in Turbo mode. As with Alder Lake-S, Raptor Lake-S is also based on a hybrid design that combines P and E cores. Compared to the Intel Core i7-12700, the number of E-cores has been doubled to 8, meaning that the Intel Core i7-13700 offers up to 24 threads together with its 8 P-cores. The processor continues to be manufactured using the 10 nm production process called "Intel 7". There is no freely selectable multiplier for the Intel Core i7-13700 (compared to the faster i7-13700K) and the LGA 1700 socket introduced with the Alder Lake series continues to serve as the basis.

Performance

Compared to the Intel Core i7-12700, the IPC of the new Core i7-13700 has been increased slightly. At the same time, the 4 additional E-cores now provide slightly more performance for multi-threaded tasks. This puts the Intel Core i7-13700 at the level of an Intel Core i9-12900K, which also offers a total of 24 threads.

iGPU

The Intel Core i7-13700 is a processor with an integrated graphics unit. The Intel UHD Graphics 770 however is only suitable for office use and very old or low demanding games.

Power consumption

The TDP of the Intel Core i7-13700 is 65 watts in PL1. Intel defines the PL2 limit at 219 watts. If the restrictions regarding power consumption are deactivated in the BIOS, the PL2 value can be reached permanently and even exceeded with good cooling. However, a high-quality and powerful cooling unit should be used for this.

ModelAMD Ryzen 7 7700XIntel Core i5-13400FIntel Core i7-13700
CodenameRaphael (Zen4)Raptor Lake-SRaptor Lake-S
SeriesAMD Raphael (Zen 4, Ryzen 7000)Intel Raptor Lake-SIntel Raptor Lake-S
Series: Raptor Lake-S Raptor Lake-S
AMD Ryzen 9 7950X3D4.2 - 5.7 GHz16 / 32 cores128 MB L3
AMD Ryzen 9 7900X4.7 - 5.6 GHz12 / 24 cores64 MB L3
AMD Ryzen 9 79003.7 - 5.4 GHz12 / 24 cores64 MB L3
AMD Ryzen 7 7700X « 4.5 - 5.4 GHz8 / 16 cores32 MB L3
AMD Ryzen 7 77003.8 - 5.3 GHz8 / 16 cores32 MB L3
AMD Ryzen 7 7800X3D4.2 - 5 GHz8 / 16 cores96 MB L3
AMD Ryzen 5 7600X4.7 - 5.3 GHz6 / 12 cores32 MB L3
AMD Ryzen 5 76003.8 - 5.1 GHz6 / 12 cores32 MB L3
Intel Core i7-137002.1 - 5.2 GHz16 / 24 cores30 MB L3
Intel Core i5-13400F « 2.5 - 4.6 GHz10 / 16 cores20 MB L3
Intel Core i5-134002.5 - 4.6 GHz10 / 16 cores20 MB L3
Intel Core i7-13700 « 2.1 - 5.2 GHz16 / 24 cores30 MB L3
Intel Core i5-13400F2.5 - 4.6 GHz10 / 16 cores20 MB L3
Intel Core i5-134002.5 - 4.6 GHz10 / 16 cores20 MB L3
Clock4500 - 5400 MHz2500 - 4600 MHz2100 - 5200 MHz
L1 Cache512 KB0.1 MB
L2 Cache8 MB9.5 MB24 MB
L3 Cache32 MB20 MB30 MB
Cores / Threads8 / 1610 / 1616 / 24
8 x 5.2 GHz Intel Raptor Cove P-Core
8 x 4.1 GHz Intel Gracemont E-Core
TDP170 Watt65 Watt65 Watt
Transistors9.9 Million
Technology5 nm10 nm10 nm
Voltage0.650 - 1.475V V
Die Size2x 70 (CCD) mm2 + 122 (I/O) mm2257 mm2257 mm2
max. Temp.95 °C100 °C100 °C
SocketAM5 (LGA 1718)LGA 1700LGA 1700
FeaturesMMX(+), SSE, SSE2, SSE3, SSSE3, SSE4.1, SSE4.2, SSE4A, x86-64, AMD-V, AES, AVX, AVX2, AVX512F, FMA3, SHA, Precision Boost 2Intel SSE4.1, Intel SSE4.2, Intel AVX2Intel SSE4.1, Intel SSE4.2, Intel AVX2
iGPUAMD Radeon Graphics (Ryzen 7000) (400 - 2200 MHz)Intel UHD Graphics 770 (300 - 1600 MHz)
Architecturex86x86x86
Announced
Manufacturerwww.amd.comark.intel.comwww.intel.de
$196 U.S.$384 U.S.

Benchmarks

Performance Rating - CB R15 + R20 + 7-Zip + X265 + Blender + 3DM11 CPU - R7 7700X
45.1 pt (75%)
Restrict / Search: Model: Max. age: years
Performance Rating - CB R15 + R20 + 7-Zip + X265 + Blender + 3DM11 CPU - i5-13400F
37.9 pt (63%)
Restrict / Search: Model: Max. age: years
Performance Rating - CB R15 + R20 + 7-Zip + X265 + Blender + 3DM11 CPU - i7-13700
42.8 pt (71%)
Restrict / Search: Model: Max. age: years
Cinebench R23 - Cinebench R23 Multi Core
min: 18667     avg: 19088     median: 19088 (18%)     max: 19509 Points
15911 Points (15%)
min: 21013     avg: 25369     median: 25369 (24%)     max: 29725 Points
Cinebench R23 - Cinebench R23 Single Core
min: 1986     avg: 1987     median: 1987 (84%)     max: 1988 Points
1744 Points (73%)
min: 1997     avg: 2009     median: 2008.5 (84%)     max: 2020 Points
Cinebench R20 - Cinebench R20 CPU (Single Core)
min: 772     avg: 773     median: 772.5 (84%)     max: 773 Points
672 Points (73%)
min: 703     avg: 740     median: 739.5 (81%)     max: 776 Points
Cinebench R20 - Cinebench R20 CPU (Multi Core)
min: 7308     avg: 7463     median: 7462.5 (18%)     max: 7617 Points
6091 Points (15%)
min: 7027     avg: 9194     median: 9194 (22%)     max: 11361 Points
Cinebench R15 - Cinebench R15 CPU Multi 64 Bit
min: 3036     avg: 3114     median: 3113.5 (20%)     max: 3191 Points
2364 Points (15%)
min: 2986     avg: 3692     median: 3692 (23%)     max: 4398 Points
Cinebench R15 - Cinebench R15 CPU Single 64 Bit
min: 314     avg: 315     median: 315 (87%)     max: 316 Points
252 Points (70%)
min: 279     avg: 285     median: 285 (79%)     max: 291 Points
Cinebench R11.5 - Cinebench R11.5 CPU Multi 64 Bit
36.1 Points (47%)
27.5 Points (36%)
50.4 Points (65%)
Cinebench R11.5 - Cinebench R11.5 CPU Single 64 Bit
3.7 Points (88%)
3.1 Points (73%)
3.5 Points (83%)
Cinebench R10 - Cinebench R10 Rend. Single (32bit)
8633 Points (52%)
8689 Points (52%)
10840 Points (65%)
Cinebench R10 - Cinebench R10 Rend. Multi (32bit)
56024 Points (41%)
51113 Points (37%)
82724 Points (60%)
Cinebench R10 - Cinebench R10 Rend. Multi (64bit)
82988 Points (53%)
125536 Points (80%)
Cinebench R10 - Cinebench R10 Rend. Single (64bit)
13947 Points (17%)
16324 Points (20%)
wPrime 2.10 - wPrime 2.0 1024m *
61.1 s (1%)
367.9 s (4%)
161.5 s (2%)
wPrime 2.10 - wPrime 2.0 32m *
2.2 s (0%)
3.3 s (1%)
2.5 s (1%)
WinRAR - WinRAR 4.0
14879 Points (24%)
8602 Points (14%)
12289 Points (19%)
7-Zip 18.03 - 7-Zip 18.03 Multi Thread 4 runs
min: 85624     avg: 85707     median: 85706.5 (49%)     max: 85789 MIPS
60048 MIPS (34%)
min: 74475     avg: 91604     median: 91604 (53%)     max: 108733 MIPS
7-Zip 18.03 - 7-Zip 18.03 Single Thread 4 runs
min: 8052     avg: 8074     median: 8074 (95%)     max: 8096 MIPS
5743 MIPS (68%)
min: 6466     avg: 6643     median: 6642.5 (78%)     max: 6819 MIPS
X264 HD Benchmark 4.0 - x264 Pass 2
181.2 fps (61%)
136.9 fps (46%)
224 fps (75%)
X264 HD Benchmark 4.0 - x264 Pass 1
373.5 fps (86%)
314.5 fps (73%)
393 fps (91%)
HWBOT x265 Benchmark v2.2 - HWBOT x265 4k Preset
min: 24.8     avg: 25.5     median: 25.5 (45%)     max: 26.1 fps
19.2 fps (34%)
min: 21.4     avg: 27.3     median: 27.3 (48%)     max: 33.1 fps
TrueCrypt - TrueCrypt Serpent
1.4 GB/s (41%)
1.1 GB/s (32%)
2.1 GB/s (62%)
TrueCrypt - TrueCrypt Twofish
2.3 GB/s (40%)
2 GB/s (34%)
3.8 GB/s (66%)
TrueCrypt - TrueCrypt AES
17.5 GB/s (46%)
12.2 GB/s (32%)
22 GB/s (57%)
Blender - Blender 3.3 Classroom CPU *
min: 255     avg: 261     median: 261 (3%)     max: 267 Seconds
336 Seconds (4%)
min: 181     avg: 250.5     median: 250.5 (3%)     max: 320 Seconds
Blender - Blender 2.79 BMW27 CPU *
min: 160     avg: 163     median: 163 (1%)     max: 166 Seconds
206 Seconds (1%)
min: 111     avg: 144.5     median: 144.5 (1%)     max: 178 Seconds
R Benchmark 2.5 - R Benchmark 2.5 *
min: 0.3758     avg: 0.4     median: 0.4 (8%)     max: 0.383 sec
0.5 sec (10%)
min: 0.4075     avg: 0.4     median: 0.4 (9%)     max: 0.423 sec
3DMark 06 - CPU - 3DMark 06 - CPU
18115 Points (39%)
13989 Points (30%)
17194 Points (37%)
Super Pi mod 1.5 XS 1M - Super Pi mod 1.5 XS 1M *
6.3 s (1%)
8 s (2%)
6.4 s (1%)
Super Pi mod 1.5 XS 2M - Super Pi mod 1.5 XS 2M *
13.6 s (1%)
17.9 s (1%)
13.9 s (1%)
Super Pi Mod 1.5 XS 32M - Super Pi mod 1.5 XS 32M *
322.8 s (1%)
420.5 s (2%)
329.2 s (1%)
3DMark Vantage - 3DM Vant. Perf. CPU no Physx
77937 Points (60%)
82438 Points (63%)
3DMark 11 - 3DM11 Performance Physics
31467 Points (77%)
23820 Points (59%)
min: 23197     avg: 26874     median: 26874 (66%)     max: 30551 Points
3DMark - 3DMark Ice Storm Physics
77765 Points (63%)
96793 Points (79%)
3DMark - 3DMark Ice Storm Extreme Physics
76636 Points (62%)
96083 Points (78%)
3DMark - 3DMark Ice Storm Unlimited Physics
80273 Points (64%)
97199 Points (78%)
3DMark - 3DMark Cloud Gate Physics
19846 Points (50%)
26999 Points (68%)
3DMark - 3DMark Fire Strike Standard Physics
35357 Points (63%)
28087 Points (50%)
min: 31032     avg: 37512     median: 37512 (67%)     max: 43992 Points
3DMark - 3DMark Time Spy CPU
14182 Points (60%)
12669 Points (53%)
min: 14079     avg: 16213     median: 16212.5 (68%)     max: 18346 Points
Geekbench 6.4 - Geekbench 6.4 Single-Core
2761 Points (69%)
Geekbench 6.4 - Geekbench 6.4 Multi-Core
15882 Points (62%)
Geekbench 5.5 - Geekbench 5.1 - 5.5 64 Bit Single-Core
2218 Points (87%)
1792 Points (70%)
min: 1958     avg: 1984     median: 1983.5 (78%)     max: 2009 Points
Geekbench 5.5 - Geekbench 5.1 - 5.5 64 Bit Multi-Core
min: 13889     avg: 14131     median: 14131 (25%)     max: 14373 Points
12095 Points (22%)
min: 15525     avg: 17564     median: 17563.5 (31%)     max: 19602 Points
Geekbench 5.0 - Geekbench 5.0 64 Bit Single-Core
2123 Points (9%)
1721 Points (7%)
1925 Points (8%)
Geekbench 5.0 - Geekbench 5.0 64 Bit Multi-Core
14215 Points (45%)
12009 Points (38%)
18964 Points (60%)
Geekbench 4.4 - Geekbench 4.1 - 4.4 64 Bit Single-Core
8991 Points (90%)
7684 Points (77%)
8714 Points (87%)
Geekbench 4.4 - Geekbench 4.1 - 4.4 64 Bit Multi-Core
56909 Points (57%)
43856 Points (44%)
67866 Points (68%)
Mozilla Kraken 1.1 - Kraken 1.1 Total Score *
440 ms (1%)
535 ms (1%)
min: 468     avg: 470     median: 470 (1%)     max: 472 ms
WebXPRT 4 - WebXPRT 4 Score
301 Points (83%)
254 Points (70%)
min: 289     avg: 289.5     median: 289.5 (80%)     max: 290 Points
WebXPRT 3 - WebXPRT 3 Score
355 Points (64%)
294 Points (53%)
min: 332     avg: 338     median: 338 (61%)     max: 344 Points
CrossMark - CrossMark Overall
min: 2297     avg: 2313     median: 2312.5 (86%)     max: 2328 Points
1941 Points (73%)
min: 2017     avg: 2169     median: 2168.5 (81%)     max: 2320 Points
Power Consumption - Prime95 Power Consumption - external Monitor *
min: 189.8     avg: 209.9     median: 209.9 (36%)     max: 230 Watt
214 Watt (37%)
min: 109.8     avg: 247.9     median: 247.9 (43%)     max: 386 Watt
Power Consumption - Cinebench R15 Multi Power Consumption - external Monitor *
min: 196.1     avg: 218.1     median: 218.1 (40%)     max: 240 Watt
184.2 Watt (34%)
min: 149.6     avg: 257.3     median: 257.3 (47%)     max: 365 Watt
Power Consumption - Idle Power Consumption - external Monitor *
min: 89.8     avg: 94     median: 94 (62%)     max: 98.2 Watt
76.3 Watt (50%)
min: 8.49     avg: 46.1     median: 46.1 (30%)     max: 83.7 Watt
Power Consumption - Power Efficiency - Cinebench R15 Multi external Monitor
min: 13.3     avg: 14.4     median: 14.4 (11%)     max: 15.5 Points per Watt
20 Points per Watt (15%)

Average Benchmarks AMD Ryzen 7 7700X → 100% n=41

Average Benchmarks Intel Core i5-13400F → 79% n=41

Average Benchmarks Intel Core i7-13700 → 107% n=41

- Range of benchmark values for this graphics card
red legend - Average benchmark values for this graphics card
* Smaller numbers mean a higher performance
1 This benchmark is not used for the average calculation

v1.33
log 17. 05:58:54

#0 ran 0s before starting gpusingle class +0s ... 0s

#1 checking url part for id 14655 +0s ... 0s

#2 checking url part for id 14966 +0s ... 0s

#3 checking url part for id 14997 +0s ... 0s

#4 redirected to Ajax server, took 1755403134s time from redirect:0 +0s ... 0s

#5 did not recreate cache, as it is less than 5 days old! Created at Sat, 16 Aug 2025 05:18:17 +0200 +0s ... 0s

#6 composed specs +0.006s ... 0.006s

#7 did output specs +0s ... 0.006s

#8 getting avg benchmarks for device 14655 +0.005s ... 0.011s

#9 got single benchmarks 14655 +0.006s ... 0.017s

#10 getting avg benchmarks for device 14966 +0.004s ... 0.021s

#11 got single benchmarks 14966 +0.005s ... 0.026s

#12 getting avg benchmarks for device 14997 +0.004s ... 0.03s

#13 got single benchmarks 14997 +0.006s ... 0.036s

#14 got avg benchmarks for devices +0s ... 0.036s

#15 min, max, avg, median took s +0.07s ... 0.106s

#16 return log +0s ... 0.106s

Please share our article, every link counts!
Mail Logo
> Expert Reviews and News on Laptops, Smartphones and Tech Innovations > Benchmarks / Tech > Processor Comparison - Head 2 Head
Redaktion, 2017-09- 8 (Update: 2023-07- 1)