

AMD Ryzen 7 5700X vs Apple M3 Pro 12-Core vs AMD Ryzen 5 5600X
AMD Ryzen 7 5700X
► remove from comparison
The AMD Ryzen 7 5700X is a desktop processor with 8 cores and simultaneous multithreading (SMT), which means it can process 16 threads simultaneously. In April 2022, AMD presented the Ryzen 7 5700X, a new 8-core processor that is very similar to the AMD Ryzen 7 5800X. However, due to the lower TDP, there are no restrictions on the clock frequency. Nevertheless, the AMD Ryzen 7 5700X reaches up to 4.6 GHz in boost, which is only 100 MHz less than the AMD Ryzen 7 5800X. However, the base clock drops significantly to 3.4 GHz.
The performance of the AMD Ryzen 7 5700X is consistently excellent in all applications. The native 8-core can really show off its strengths, especially in multi-threaded applications, although the single-core performance has also been significantly improved compared to the older Zen 2 architecture.
The internal structure of the processor is similar to the AMD Ryzen 7 5800X. The CCX modules are also connected to each other via the I/O die, which we already know from Zen2. However, according to AMD, the Infinity Fabric should now achieve clock rates of up to 2 GHz, which in turn enables a RAM clock rate of 4,000 MHz without any loss of performance.
In terms of manufacturing processes, AMD also relies on TSCM for the 7nm production of the CPU cores in the Vermeer processors, although the I/O die is still supplied in 12 nm by Globalfoundries.
The AMD Ryzen 7 5700X is impressive in gaming thanks to the significantly improved IPC compared to Zen2. In terms of power consumption, the AMD Ryzen 7 5700X impresses with its low TDP of just 65 watts. This means that the processor can also be operated with a compact air cooler without any problems. The AMD Ryzen 7 5800X is operated with a TDP of 105 watts.
Apple M3 Pro 12-Core
► remove from comparison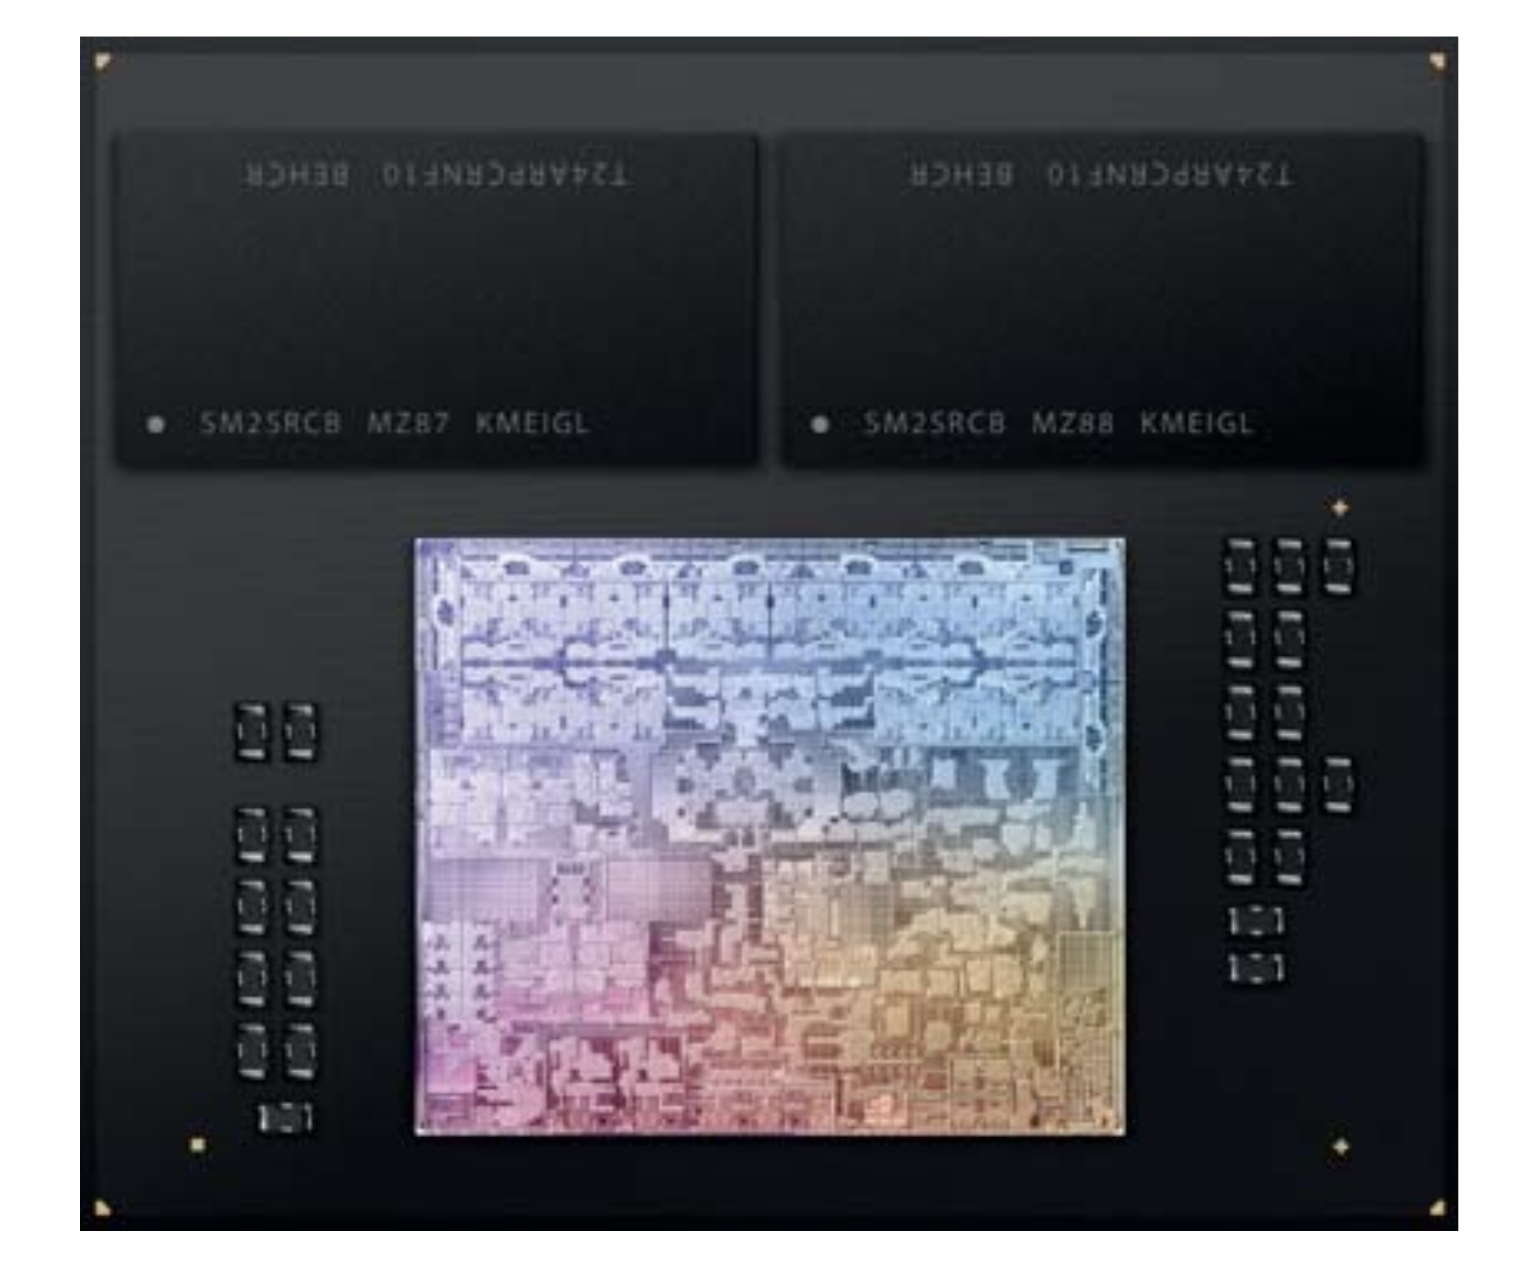
The Apple M3 Pro (12 Core) is a system on a chip (SoC) from Apple for notebooks that was launched in late 2023. It integrates a new 12-core CPU with 6 performance cores with up to 4.06 GHz and 6 efficiency cores with 2.8 GHz. There is also a slimmed-down 11-core variant with a 14-core GPU.
Compared to the M2 Pro the M3 Pro has been slimmed down somewhat and swaps two performance cores for efficiency cores. This is due to the changed core configuration, as 6 cores are now used per cluster (the M2 Pro and M3 still have 4 cores per cluster). Furthermore, the memory bus has been reduced from 256 bits to 192 bits (150 GB/s vs. 200 GB/s). However, thanks to the new architecture and higher clock rates, the new M3 Pro is still slightly faster.
The M3 Pro also integrates a new graphics card with dynamic caching, mesh shading and ray tracing acceleration via hardware. In the top model, all 18 cores of the chip are used and support up to 3 displays simultaneously (internal and 2 external).
GPU and CPU can jointly access the shared memory on the package (unified memory). This is available in 18 or 36 GB variants and offers 150 GB/s maximum bandwidth (192 bit bus).
The integrated 16-core Neural Engine has also been revised and now offers 18 TOPS peak performance (compared to 15.8 TOPS in the M2 but 35 TOPS in the new A17 Pro). The video engine now also supports AV1 decoding in hardware. H.264, HEVC and ProRes (RAW) can still be decoded and encoded.
Unfortunately, the integrated WLAN only continues to support WiFi 6E (no WiFi 7), unlike the small M3 SoC thunderbolt 4 is also supported (max 40 Gbit/s).
The chip is manufactured in the current 3nm process (N3B) at TSMC and contains 37 billion transistors (-7.5% vs. Apple M2 Pro).
AMD Ryzen 5 5600X
► remove from comparison
The AMD Ryzen 5 5600X is a desktop processor with 6 SMT-enabled (12 threads) and based on the Zen 3 architecture. Launched in November 2020, it is the fastest 6-core Ryzen desktop processor. With a TDP of 65 watts, the Ryzen 5 5600X is the least energy-hungry model in the Zen 3 family to date.
The Ryzen 5 5600X is clocked at 3.7 GHz base clock and can be clocked up to 4.6 GHz with Precision Boost 2.
Performance
The average 5600X in our database is in the same league as the Ryzen 9 4900H and the Ryzen 7 6800HS, as far as multi-thread benchmark scores are concerned. While this isn't the fastest CPU money can buy, it still rips through most workloads with ease, as of mid 2022. Find out more in our full review.
Power consumption
This Ryzen 5 series chip has a default TDP (also known as the long-term power limit) of 65 W to be in line with most desktop processors.
The R5 5600X is built with TSMC's 7 nm process for average, as of early 2023, energy efficiency.
| Model | AMD Ryzen 7 5700X | Apple M3 Pro 12-Core | AMD Ryzen 5 5600X | ||||||||||||||||||||||||||||||||||||||||||||||||||||
| Codename | Vermeer (Zen 3) | Vermeer (Zen 3) | |||||||||||||||||||||||||||||||||||||||||||||||||||||
| Series | AMD Vermeer (Ryzen 5000) | Apple M3 | AMD Vermeer (Ryzen 5000) | ||||||||||||||||||||||||||||||||||||||||||||||||||||
| Series: Vermeer (Ryzen 5000) Vermeer (Zen 3) |
|
|
| ||||||||||||||||||||||||||||||||||||||||||||||||||||
| Clock | 3400 - 4600 MHz | 2748 - 4056 MHz | 3700 - 4600 MHz | ||||||||||||||||||||||||||||||||||||||||||||||||||||
| L1 Cache | 512 KB | 384 KB | |||||||||||||||||||||||||||||||||||||||||||||||||||||
| L2 Cache | 4 MB | 3 MB | |||||||||||||||||||||||||||||||||||||||||||||||||||||
| L3 Cache | 32 MB | 32 MB | |||||||||||||||||||||||||||||||||||||||||||||||||||||
| Cores / Threads | 8 / 16 | 12 / 12 6 x 4.1 GHz Apple M3 P-Core 6 x 2.7 GHz Apple M3 E-Core | 6 / 12 | ||||||||||||||||||||||||||||||||||||||||||||||||||||
| TDP | 65 Watt | 27 Watt | 65 Watt | ||||||||||||||||||||||||||||||||||||||||||||||||||||
| Technology | 7 nm | 3 nm | 7 nm | ||||||||||||||||||||||||||||||||||||||||||||||||||||
| Die Size | 2 x 74 sq. mm; I/O = 125 sq. mm mm2 | ||||||||||||||||||||||||||||||||||||||||||||||||||||||
| max. Temp. | 90 °C | 95 °C | |||||||||||||||||||||||||||||||||||||||||||||||||||||
| Socket | 1331 | AM4 | |||||||||||||||||||||||||||||||||||||||||||||||||||||
| Features | MMX(+), SSE, SSE2, SSE3, SSSE3, SSE4.1, SSE4.2, SSE4A, x86-64, AMD-V, AES, AVX, AVX2, FMA3, SHA, Precision Boost 2 | ARMv8 Instruction Set | DDR4-3200 RAM, PCIe 4, MMX (+), SSE, SSE2, SSE3, SSSE3, SSE4.1, SSE4.2, SSE4A, AES, AVX, AVX2, FMA3, SHA | ||||||||||||||||||||||||||||||||||||||||||||||||||||
| Architecture | x86 | ARM | x86 | ||||||||||||||||||||||||||||||||||||||||||||||||||||
| $299 U.S. | $299 U.S. | ||||||||||||||||||||||||||||||||||||||||||||||||||||||
| Announced | |||||||||||||||||||||||||||||||||||||||||||||||||||||||
| Manufacturer | www.amd.com | www.apple.com | www.amd.com | ||||||||||||||||||||||||||||||||||||||||||||||||||||
| Transistors | 37000 Million | ||||||||||||||||||||||||||||||||||||||||||||||||||||||
| iGPU | Apple M3 Pro 18-Core GPU |

Benchmarks
Average Benchmarks AMD Ryzen 7 5700X → 100% n=9
Average Benchmarks Apple M3 Pro 12-Core → 127% n=9
Average Benchmarks AMD Ryzen 5 5600X → 95% n=9
* Smaller numbers mean a higher performance
1 This benchmark is not used for the average calculation