Notebookcheck Logo

Intel Celeron N2930 vs Intel Core 2 Duo T9400

Intel Celeron N2930

► remove from comparison Intel N2930

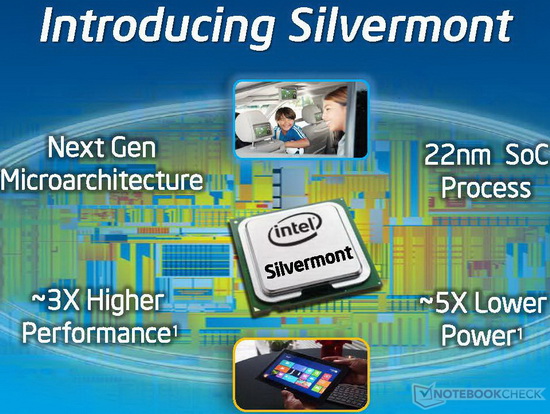
The Intel Celeron N2930 is a power efficient quad-core SoC for entry-level notebooks. It is clocked at 1.83 - 2.16 GHz and part of the Bay Trail-M platform. Thanks to the specially optimized 22 nanometer low-power process (P1271) with tri-gate transistors, performance and energy efficiency have been significantly improved compared to previous Intel Atom CPUs. The N2930 supports Quick Sync as well as Wireless Display.

Architecture

The processor cores are based on the new Silvermont architecture, which is an out-of-order design for the first time. The increased utilization of the pipeline and many other improvements (optimized branch prediction, increased buffers, enhanced decoders) have increased the performance per clock by about 50 percent. At the same time, however, the Hyper-Threading feature of the previous generation has been removed. Other major changes are the support for new instruction set extensions such as SSE 4.1 and 4.2 as well as AES-NI (depending on the model).

Performance

Thanks to the improved performance per clock and the 4 cores, the Celeron N2930 is significantly faster than previous Intel Atoms, e.g. the N2800. Depending on the benchmark, the N2930 competes with AMD Kabini APUs like the A4-5000. For most everyday tasks such as Internet or Office the performance is adequate, but not for complex software or modern games.

Graphics

The HD Graphics (Bay Trail) is based on the Intel Gen7 architecture, which supports DirectX 11 and is also found in the Ivy Bridge series (e.g. HD Graphics 4000). With only 4 EUs (Execution Units) and a relatively low clock speed of 313 - 854 MHz, the GPU is even slower than the HD Graphics (Ivy Bridge). Therefore, only older and less demanding games will run fluently.

Power Consumption

The entire SoC is rated at a TDP of 7.5 watts. Thus, the chip can be used in compact (and sometimes even passively cooled) subnotebooks and tablets.

Intel Core 2 Duo T9400

► remove from comparison Intel T9400

The Intel Core 2 Duo T9400 was a uppder middle class dual core CPU for laptops, at the time of introduction. It is similar to the Core 2 Duo P9500 except for the higher TDP of 35 versus 25 Watt).

Due to the relatively high clock speed and 6MB Level 2 cache, the T9400 offers enough performance for most demanding games (in 2009) and applications.

The T9400 uses a Penryn (Montevina Update) core that features 2 integer units, 1 floating point unit, 1 load unit, and 1 store unit in a 14-stages long pipeline. Due to the Wide Dynamic Execution Technology, the core is able to simultaneously execute up to four instructions.

The integrated Enhanced Speedstep is able to downclock the core dynamically to save power (in idle mode).

ModelIntel Celeron N2930Intel Core 2 Duo T9400
CodenameBay Trail-MPenryn
SeriesIntel CeleronIntel Core 2 Duo
Series: Core 2 Duo Penryn
Intel Celeron N2940 compare1.83 - 2.25 GHz4 / 4 cores
Intel Celeron N2930 « 1.83 - 2.16 GHz4 / 4 cores
Intel Celeron N2920 compare1.86 - 2 GHz4 / 4 cores
Intel Celeron N2840 compare2.16 - 2.58 GHz2 / 2 cores
Intel Celeron N2910 compare1.6 GHz4 / 4 cores
Intel Celeron N2830 compare2.16 - 2.41 GHz2 / 2 cores
Intel Celeron N2820 compare2.17 - 2.39 GHz2 / 2 cores
Intel Celeron N2815 compare1.86 - 2.13 GHz2 / 2 cores
Intel Celeron N2810 compare2 GHz2 / 2 cores
Intel Celeron N2808 compare1.58 - 2.25 GHz2 / 2 cores
Intel Celeron N2807 compare1.58 - 2.16 GHz2 / 2 cores
Intel Celeron N2806 compare1.58 - 2 GHz2 / 2 cores
Intel Celeron N2805 compare1.46 GHz2 / 2 cores
Intel Core 2 Duo T9900 compare3.06 GHz2 / 2 cores
Intel Core 2 Duo T9800 compare2.92 GHz2 / 2 cores
Intel Core 2 Duo P9700 compare2.8 GHz2 / 2 cores
Intel Core 2 Duo T9600 compare2.8 GHz2 / 2 cores
Intel Core 2 Duo P9600 compare2.66 GHz2 / 2 cores
Intel Core 2 Duo T9550 compare2.66 GHz2 / 2 cores
Intel Core 2 Duo T9500 compare2.6 GHz2 / 2 cores
Intel Core 2 Duo SP9600 compare2.53 GHz2 / 2 cores
Intel Core 2 Duo P9500 compare2.53 GHz2 / 2 cores
Intel Core 2 Duo T9400 « 2.53 GHz2 / 2 cores
Intel Core 2 Duo P8800 compare2.66 GHz2 / 2 cores
Intel Core 2 Duo T9300 compare2.5 GHz2 / 2 cores
Intel Core 2 Duo P8700 compare2.53 GHz2 / 2 cores
Intel Core 2 Duo SP9400 compare2.4 GHz2 / 2 cores
Intel Core 2 Duo P8600 compare2.4 GHz2 / 2 cores
Intel Core 2 Duo T8300 compare2.4 GHz2 / 2 cores
Intel Core 2 Duo SP9300 compare2.26 GHz2 / 2 cores
Intel Core 2 Duo P8400 compare2.26 GHz2 / 2 cores
Intel Core 2 Duo P7570 compare2.26 GHz2 / 2 cores
Intel Core 2 Duo P7550 compare2.26 GHz2 / 2 cores
Intel Core 2 Duo T6770 compare2.3 GHz2 / 2 cores
Intel Core 2 Duo SL9600 compare2.13 GHz2 / 2 cores
Intel Core 2 Duo P7450 compare2.13 GHz2 / 2 cores
Intel Core 2 Duo T6670 compare2.2 GHz2 / 2 cores
Intel Core 2 Duo T6600 compare2.2 GHz2 / 2 cores
Intel Core 2 Duo T8100 compare2.1 GHz2 / 2 cores
Intel Core 2 Duo P7370 compare2 GHz2 / 2 cores
Intel Core 2 Duo P7350 compare2 GHz2 / 2 cores
Intel Core 2 Duo T6570 compare2.1 GHz2 / 2 cores
Intel Core 2 Duo T6500 compare2.1 GHz2 / 2 cores
Intel Core 2 Duo SL9400 compare1.86 GHz2 / 2 cores
Intel Core 2 Duo SL9380 compare1.8 GHz2 / 2 cores
Intel Core 2 Duo T6400 compare2 GHz2 / 2 cores
Intel Core 2 Duo SL9300 compare1.6 GHz2 / 2 cores
Intel Core 2 Duo SU9600 compare1.6 GHz2 / 2 cores
Intel Core 2 Duo SU9400 compare1.4 GHz2 / 2 cores
Intel Core 2 Duo SU7300 compare1.3 GHz2 / 2 cores
Intel Core 2 Duo SU9300 compare1.2 GHz2 / 2 cores
Clock1830 - 2160 MHz2530 MHz
L1 Cache224 KB128 KB
L2 Cache2 MB6 MB
Cores / Threads4 / 42 / 2
TDP7.5 Watt35 Watt
Technology22 nm45 nm
max. Temp.105 °C105 °C
SocketFCBGA1170BGA479, PGA478
FeaturesHD Graphics (Bay Trail, 313 - 854 MHz), Quick Sync, Wireless Display, SpeedstepVirtualization Technology (VT-x), Trusted Execution, Intel 64, Enhanced Speedstep, Execute Disable Bit
iGPUIntel HD Graphics (Bay Trail) (313 - 854 MHz)
Architecturex86x86
Announced
Manufacturerark.intel.comark.intel.com
FSB1066
Transistors410 Million
Voltage1.050V-1.162V V
Die Size107 mm2
$316 U.S.

Benchmarks

Cinebench R15 - Cinebench R15 CPU Multi 64 Bit
100%
1 N2930 +
min: 123     avg: 129.4     median: 129 (1%)     max: 133 Points
Cinebench R15 - Cinebench R15 CPU Single 64 Bit
100%
1 N2930 +
min: 33     avg: 34.8     median: 35 (10%)     max: 36 Points
Cinebench R11.5 - Cinebench R11.5 CPU Multi 64 Bit
100%
1 N2930 +
min: 1.39     avg: 1.5     median: 1.6 (2%)     max: 1.59 Points
Cinebench R11.5 - Cinebench R11.5 CPU Single 64 Bit
100%
1 N2930 +
min: 0.4     avg: 0.4     median: 0.4 (10%)     max: 0.41 Points
Cinebench R10 - Cinebench R10 Rend. Single (32bit)
min: 1120     avg: 1131     median: 1131.5 (7%)     max: 1141 Points
min: 2713     avg: 2848     median: 2818 (17%)     max: 3207 Points
Cinebench R10 - Cinebench R10 Rend. Multi (32bit)
min: 3687     avg: 3865     median: 3880 (3%)     max: 4013 Points
min: 5008     avg: 5341     median: 5267.5 (4%)     max: 6173 Points
Cinebench R10 - Cinebench R10 Rend. Multi (64bit)
100%
1 N2930 +
min: 5663     avg: 5709     median: 5708.5 (4%)     max: 5754 Points
Cinebench R10 - Cinebench R10 Rend. Single (64bit)
100%
1 N2930 +
min: 1525     avg: 1567     median: 1566.5 (2%)     max: 1608 Points
wPrime 2.10 - wPrime 2.0 1024m *
852 s (10%)
wPrime 2.10 - wPrime 2.0 32m *
27.3 s (5%)
min: 30.1     avg: 37.7     median: 31 (6%)     max: 52.1 s
WinRAR - WinRAR 4.0
100%
1 N2930 +
1181 Points (2%)
X264 HD Benchmark 4.0 - x264 Pass 2
100%
1 N2930 +
9.3 fps (3%)
X264 HD Benchmark 4.0 - x264 Pass 1
100%
1 N2930 +
47 fps (11%)
TrueCrypt - TrueCrypt Serpent
100%
1 N2930 +
0.1 GB/s (4%)
TrueCrypt - TrueCrypt Twofish
100%
1 N2930 +
0.2 GB/s (3%)
TrueCrypt - TrueCrypt AES
100%
1 N2930 +
0.2 GB/s (1%)
3DMark 06 - CPU - 3DMark 06 - CPU
2214 Points (5%)
min: 2026     avg: 2262     median: 2304 (5%)     max: 2349 Points
Super Pi mod 1.5 XS 1M - Super Pi mod 1.5 XS 1M *
38.7 s (8%)
min: 17.75     avg: 18.1     median: 18.1 (4%)     max: 18.55 s
Super Pi mod 1.5 XS 2M - Super Pi mod 1.5 XS 2M *
84.7 s (4%)
min: 42.53     avg: 43.1     median: 43 (2%)     max: 44.02 s
Super Pi Mod 1.5 XS 32M - Super Pi mod 1.5 XS 32M *
1814 s (8%)
min: 1107     avg: 1150     median: 1164 (5%)     max: 1180 s
SiSoft Sandra Dhrystone (MIPS) - SiSoft Sandra Dhrystone (MIPS)
100%
1 T9400 +
23652 MIPS (11%)
SiSoft Sandra Whetstone (MFLOPS) - SiSoft Sandra Whetstone (MFLOPS)
100%
1 T9400 +
17818 MFLOPS (14%)
PCMark 05 - PCMark 05 - Standard
100%
1 T9400 +
min: 2293     avg: 5930     median: 6175 (13%)     max: 7555 Points
Windows Vista Experience Index - Windows Vista Leistungsindex - Prozessor
100%
1 T9400 +
5.4 Points (77%)
3DMark Vantage - 3DM Vant. Perf. CPU no Physx
100%
1 T9400 +
min: 3066     avg: 4502     median: 4892 (4%)     max: 5156 Points
3DMark 11 - 3DM11 Performance Physics
100%
1 N2930 +
min: 1594     avg: 1666     median: 1679 (4%)     max: 1693 Points
3DMark - 3DMark Ice Storm Physics
100%
1 N2930 +
min: 4049     avg: 14857     median: 17776 (14%)     max: 18182 Points
3DMark - 3DMark Cloud Gate Physics
100%
1 N2930 +
min: 331     avg: 1258     median: 1477 (4%)     max: 1532 Points
Geekbench 3 - Geekbench 3 32 Bit Multi-Core
100%
1 N2930 +
min: 2621     avg: 2686     median: 2703 (5%)     max: 2728 Points
Geekbench 3 - Geekbench 3 32 Bit Single-Core
100%
1 N2930 +
min: 819     avg: 836     median: 839 (16%)     max: 842 Points
Geekbench 2 - 32 Bit - Geekbench Stream
100%
1 N2930 +
2493 Points (20%)
Geekbench 2 - 32 Bit - Geekbench Memory
100%
1 N2930 +
2275 Points (21%)
Geekbench 2 - 32 Bit - Geekbench Floating Point
100%
1 N2930 +
2992 Points (6%)
Geekbench 2 - 32 Bit - Geekbench Integer
100%
1 N2930 +
3477 Points (7%)
Geekbench 2 - 32 Bit - Geekbench Total Score
100%
1 N2930 +
2968 Points (8%)
Mozilla Kraken 1.1 - Kraken 1.1 Total Score *
100%
1 N2930 +
min: 4664     avg: 9867     median: 7469.5 (9%)     max: 19863 ms
Sunspider - Sunspider 1.0 Total Score *
100%
1 N2930 +
min: 378.6     avg: 828     median: 423.3 (5%)     max: 2304 ms
Octane V2 - Octane V2 Total Score
100%
1 N2930 +
min: 1238     avg: 4231     median: 4176.5 (3%)     max: 7334 Points
AnTuTu v5 - AnTuTu v5 Total Score
100%
1 N2930 +
41680 Points (42%)
PCMark for Android - PCM f. Android Work Score
100%
1 N2930 +
2046 Points (10%)

Average Benchmarks Intel Celeron N2930 → 100% n=8

Average Benchmarks Intel Core 2 Duo T9400 → 149% n=8

- Range of benchmark values for this graphics card
red legend - Average benchmark values for this graphics card
* Smaller numbers mean a higher performance
1 This benchmark is not used for the average calculation

Add one or more devices and compare

In the following list you can select (and also search for) devices that should be added to the comparison. You can select more than one device.

restrict list:
v1.33
log 05. 10:08:18

#0 ran 0s before starting gpusingle class +0s ... 0s

#1 checking url part for id 5686 +0s ... 0s

#2 checking url part for id 393 +0s ... 0s

#3 redirected to Ajax server, took 1751702898s time from redirect:0 +0s ... 0s

#4 did not recreate cache, as it is less than 5 days old! Created at Fri, 04 Jul 2025 05:20:26 +0200 +0s ... 0s

#5 composed specs +0.005s ... 0.005s

#6 did output specs +0s ... 0.005s

#7 getting avg benchmarks for device 5686 +0.001s ... 0.006s

#8 got single benchmarks 5686 +0.006s ... 0.012s

#9 getting avg benchmarks for device 393 +0.001s ... 0.013s

#10 got single benchmarks 393 +0.019s ... 0.032s

#11 got avg benchmarks for devices +0s ... 0.032s

#12 min, max, avg, median took s +0.02s ... 0.052s

#13 return log +0.002s ... 0.054s

Please share our article, every link counts!
Mail Logo
> Expert Reviews and News on Laptops, Smartphones and Tech Innovations > Benchmarks / Tech > Processor Comparison - Head 2 Head
Redaktion, 2017-09- 8 (Update: 2023-07- 1)