Apple M2 10-Core GPU vs AMD Radeon RX 560 (Laptop)
Apple M2 10-Core GPU ► remove from comparison
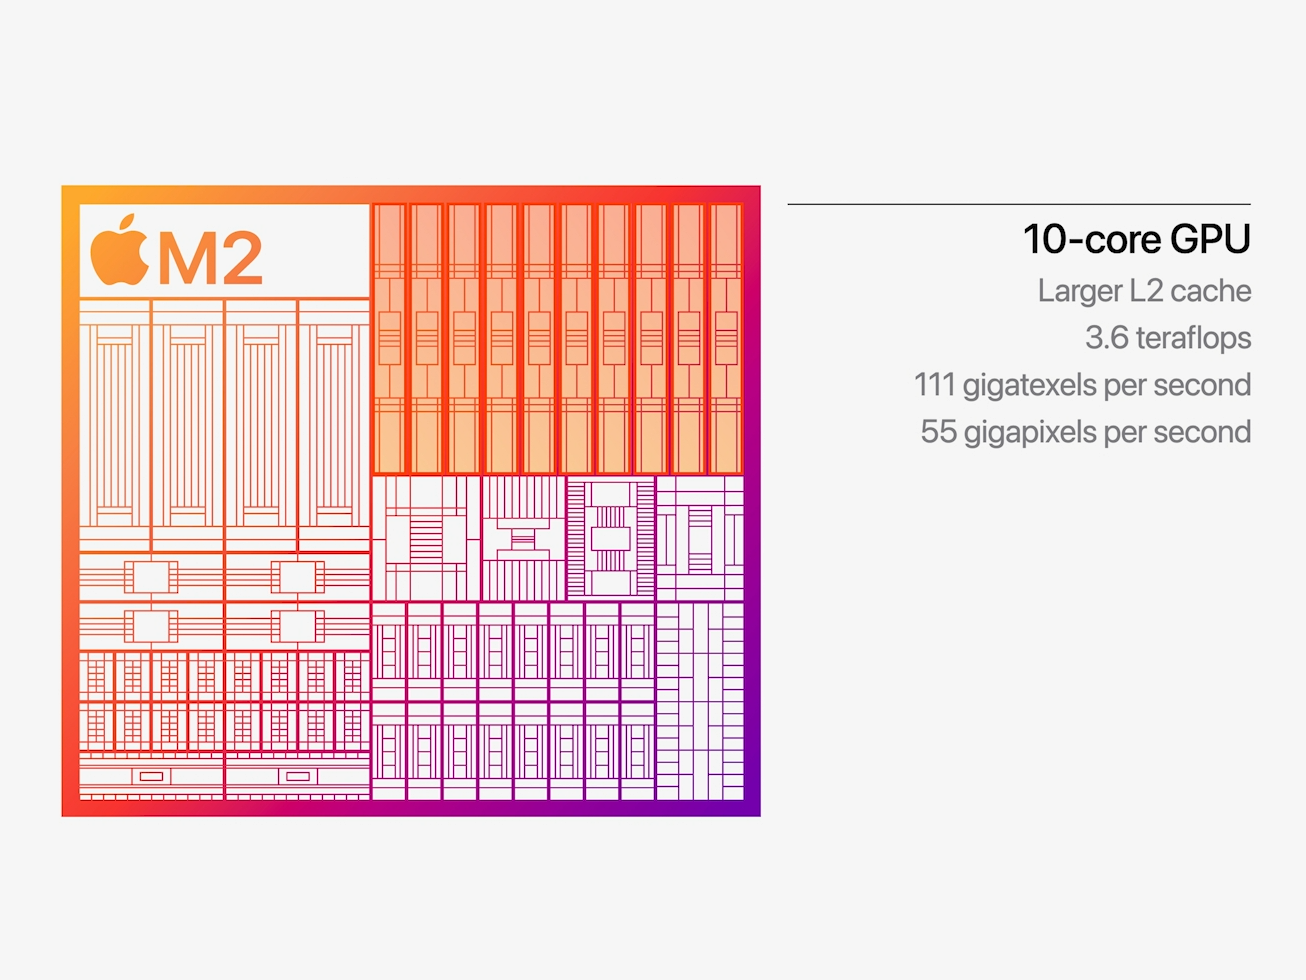
The Apple M2 GPU is an integrated graphics card offering 10 cores designed by Apple and integrated in the Apple M2 SoC . It uses the unified memory architecture of the M2 SoC (up to 24 GB LPDDR5-6400 with 100 GB/s bandwidth) and should offer 160 execution units.
According to Apple it offers a 25% higher performance at slightly higher power consumption. The theoretical performance is rated at 3.6 Teraflops and therefore 1 TFLOP higher than the M1 8-core GPU . In our benchmarks, the GPU was able to top the M1 with up to 40%, but still stays behind the 14-core GPU in the M1 Pro. Compared to other iGPUs from AMD and Intel, the M2 benefits greatly from the unified memory architecture and the high bandwidth.
The M2 chip is manufactured in the second generation 5nm process at TSMC (most likely N5P). The power consumption is around 13.5 Watt (in our tests under load of the MBP13) and up to 15W according to Apple.
AMD Radeon RX 560 (Laptop) ► remove from comparison
The AMD Radeon RX 560 for laptops (RX 560M) is a mid-range Polaris 11 / 21 gaming graphics card for laptops. It was first shown at CES 2017 in the Lenovo Legion Y520 as the "AMD RX 560M" with up to 4 GB GDDR5 VRAM. As the desktop RX 560 it can be based on the Polaris 21 and 11 chip (RX 560 and RX 460) with 986 or 1024 shaders. The performance should be similar to the desktop variants, with slightly reduced clock speeds.
More information on the Polaris architecture and its features can be found here .
Apple M2 10-Core GPU AMD Radeon RX 560 (Laptop) Radeon RX 500 Series Pipelines 10 - unified 1024 - unified Core Speed 1398 (Boost) MHz 1090 - 1292 (Boost) MHz Memory Type LPDDR5-6400 GDDR5 Shared Memory no no Power Consumption 15 Watt 75 Watt technology 5 nm 14 nm Date of Announcement 06.06.2022 05.01.2017 Predecessor M1 8-Core GPU Codename Polaris 11 Architecture Polaris Memory Speed 6000 MHz Memory Bus Width 128 Bit Max. Amount of Memory 4 GB API DirectX 12, OpenGL Vulkan Transistors 3 Billion Features DisplayPort 1.3 HBR / 1.4 HDR Ready, HDMI 2.0, AMD FreeSync Notebook Size large
CPU in M2 10-Core GPU GPU Base Speed GPU Boost / Turbo Apple M2 8 x 2424 MHz, 20 W ? MHz 1398 MHz
Benchmarks 3DMark - 3DMark Cloud Gate Score
min: 11994 avg: 13162 median: 13138 (14%) max: 14354 Points
3DMark - 3DMark Cloud Gate Graphics
min: 36424 avg: 36501 median: 36528 (10%) max: 36552 Points
3DMark - 3DMark Fire Strike Standard Score
min: 4699 avg: 4893 median: 4899 (9%) max: 5081 Points
3DMark - 3DMark Fire Strike Standard Graphics
min: 5705 avg: 5900 median: 5738 (6%) max: 6258 Points
3DMark - 3DMark Wild Life Unlimited
min: 21302 avg: 23989 median: 24875 (13%) max: 25317 Points
GPU TDP ? TDP 13 W 94% 100%
3DMark - 3DMark Wild Life Extreme Unlimited
min: 5328 avg: 6563 median: 6824 (8%) max: 6987 Points
GPU TDP ? TDP 12 W TDP 13 W 88% 100% 98%
3DMark 11 - 3DM11 Performance Score
min: 6828 avg: 7117 median: 6955 (10%) max: 7567 Points
3DMark 11 - 3DM11 Performance GPU
min: 8296 avg: 8323 median: 8329 (7%) max: 8345 Points
Blender - Blender 3.3 Classroom METAL *
min: 205 avg: 221 median: 221 (23%) max: 237 Seconds
GPU TDP 12 W TDP 13 W 104% 100%
Cinebench R15 + Apple M2 10-Core GPU Cinebench R15 - Cinebench R15 OpenGL 64 Bit
min: 128.65 avg: 132.8 median: 131 (8%) max: 140.5 fps
GPU TDP 12 W TDP 13 W 100% 93%
Cinebench R15 OpenGL 64 Bit + AMD Radeon RX 560 (Laptop)
min: 98.3 avg: 98.6 median: 98.6 (6%) max: 98.8 fps
GPU TDP ? TDP 12 W TDP 13 W 70% 100% 93%
Cinebench R15 OpenGL Ref. Match 64 Bit + Apple M2 10-Core GPU Cinebench R15 - Cinebench R15 OpenGL Ref. Match 64 Bit
99.5 % (100%)
GPU TDP 12 W TDP 13 W 100% 100%
Cinebench R15 OpenGL Ref. Match 64 Bit + AMD Radeon RX 560 (Laptop)
98 % (98%)
GPU TDP ? TDP 12 W TDP 13 W 98% 100% 100%
GFXBench - GFXBench 5.0 4K Aztec Ruins High Tier Offscreen
min: 35.6 avg: 44.1 median: 48 (19%) max: 48.6 fps
GPU TDP ? TDP 12 W TDP 13 W 83% 99% 100%
GFXBench - GFXBench 5.0 Aztec Ruins High Tier Offscreen
min: 68 avg: 95.8 median: 107.7 (20%) max: 110 fps
GPU TDP ? TDP 12 W TDP 13 W 72% 99% 100%
GFXBench - GFXBench 5.0 Aztec Ruins Normal Tier Offscreen
min: 208 avg: 271 median: 289 (21%) max: 296 fps
GPU TDP ? TDP 12 W TDP 13 W 83% 99% 100%
GFXBench - GFXBench Car Chase Offscreen
min: 136 avg: 197.5 median: 214 (24%) max: 232 fps
GPU TDP ? TDP 12 W TDP 13 W 80% 100% 85%
GFXBench 3.1 - GFXBench Manhattan ES 3.1 Offscreen
min: 247 avg: 317.9 median: 339 (7%) max: 374.6 fps
GPU TDP ? TDP 12 W TDP 13 W 80% 100% 85%
GFXBench 3.0 - GFXBench 3.0 Manhattan Offscreen
min: 411 avg: 504 median: 525 (31%) max: 557.2 fps
GPU TDP ? TDP 12 W TDP 13 W 81% 100% 97%
GFXBench (DX / GLBenchmark) 2.7 + Apple M2 10-Core GPU GFXBench (DX / GLBenchmark) 2.7 - GFXBench T-Rex HD Offscreen C24Z16
min: 628 avg: 840 median: 910 (7%) max: 931.9 fps
GPU TDP ? TDP 12 W TDP 13 W 79% 100% 98%
Antutu v9 - AnTuTu v9 GPU
min: 654168 avg: 728087 median: 728086 (91%) max: 802005 Points
Geekbench 6.2 - Geekbench 6.2 GPU OpenCL
min: 27880 avg: 27900 median: 27900 (8%) max: 27920 Points
GPU TDP 12 W TDP 13 W 100% 100%
Geekbench 6.2 - Geekbench 6.2 GPU Metal
min: 45460 avg: 45703 median: 45703 (29%) max: 45946 Points
GPU TDP 12 W TDP 13 W 100% 99%
Power Consumption - The Witcher 3 Power Consumption - external Monitor *
min: 22.8 avg: 27.8 median: 26.9 (4%) max: 34.4 Watt
GPU TDP 12 W TDP 13 W 100% 100%
Power Consumption - Witcher 3 Power Consumption *
min: 27.8 avg: 32.5 median: 30.8 (7%) max: 38.9 Watt
min: 84 avg: 88.5 median: 88.5 (19%) max: 93 Watt
GPU TDP ? TDP 13 W 100% 115%
Power Consumption - GFXBench Aztec Ruins Normal Tier Offscreen Power Consumption 150cd *
min: 16 avg: 16.5 median: 16.7 (6%) max: 16.7 Watt
Power Consumption - Witcher 3 ultra Power Efficiency
1 fps per Watt (100%)
min: 0.2226 avg: 0.2 median: 0.2 (23%) max: 0.2333 fps per Watt
GPU TDP ? TDP 13 W 23% 100%
Power Consumption - Witcher 3 ultra Power Efficiency - external Monitor
min: 1.116 avg: 1.1 median: 1.1 (92%) max: 1.207 fps per Watt
Emissions Witcher 3 Fan Noise + Apple M2 10-Core GPU Emissions - Witcher 3 Fan Noise
34.6 dB(A) (55%)
Witcher 3 Fan Noise + AMD Radeon RX 560 (Laptop)
min: 41.2 avg: 41.4 median: 41.4 (66%) max: 41.6 dB(A)
GPU TDP ? TDP 13 W 100% 84%
Average Benchmarks Apple M2 10-Core GPU → 100% n=2 Average Benchmarks AMD Radeon RX 560 (Laptop) → 87% n=2
- Range of benchmark values for this graphics card
- Average benchmark values for this graphics card
* Smaller numbers mean a higher performance
1 This benchmark is not used for the average calculation
Game Benchmarks The following benchmarks stem from our benchmarks of review laptops. The performance depends on the used graphics memory, clock rate, processor, system settings, drivers, and operating systems. So the results don't have to be representative for all laptops with this GPU. For detailed information on the benchmark results, click on the fps number.
100%
M2 10-Core GPU:
59.3 fps
100%
M2 10-Core GPU:
118.8 fps
100%
M2 10-Core GPU:
58.5 fps
100%
M2 10-Core GPU:
65 fps
100%
M2 10-Core GPU:
118.4 fps
100%
M2 10-Core GPU:
60 76 102 ~ 79 fps
100%
M2 10-Core GPU:
28 31 39 40 ~ 35 fps
100%
M2 10-Core GPU:
25 27 36 36 ~ 31 fps
100%
M2 10-Core GPU:
21 23 31 32 ~ 27 fps
100%
M2 10-Core GPU:
20 fps
100%
M2 10-Core GPU:
39.8 fps
Radeon RX 560 (Laptop):
63 fps
Radeon RX 560 (Laptop):
35 fps
Radeon RX 560 (Laptop):
30 fps
Radeon RX 560 (Laptop):
27 fps
Radeon RX 560 (Laptop):
53.3 fps
Radeon RX 560 (Laptop):
32.5 fps
Radeon RX 560 (Laptop):
28.3 fps
Radeon RX 560 (Laptop):
21.4 fps
Radeon RX 560 (Laptop):
54.4 fps
Radeon RX 560 (Laptop):
26.1 fps
Radeon RX 560 (Laptop):
6.5 fps
Radeon RX 560 (Laptop):
151.3 fps
Radeon RX 560 (Laptop):
87.4 fps
Radeon RX 560 (Laptop):
63 fps
Radeon RX 560 (Laptop):
50.2 fps
Radeon RX 560 (Laptop):
35.9 fps
Radeon RX 560 (Laptop):
70.1 fps
Radeon RX 560 (Laptop):
47 fps
Radeon RX 560 (Laptop):
43 fps
Radeon RX 560 (Laptop):
17 fps
Radeon RX 560 (Laptop):
59 fps
Radeon RX 560 (Laptop):
49.7 fps
Radeon RX 560 (Laptop):
41.4 fps
Radeon RX 560 (Laptop):
36.3 fps
Radeon RX 560 (Laptop):
56.3 (!) [X] Lenovo IdeaPad 720-15IKB Intel Core i5-7200U 2.5GHz
Radeon RX 560 (Laptop)
fps
Radeon RX 560 (Laptop):
39.5 (!) [X] Lenovo IdeaPad 720-15IKB Intel Core i5-7200U 2.5GHz
Radeon RX 560 (Laptop)
fps
Radeon RX 560 (Laptop):
21.8 (!) [X] Lenovo IdeaPad 720-15IKB Intel Core i5-7200U 2.5GHz
Radeon RX 560 (Laptop)
fps
Radeon RX 560 (Laptop):
36 fps
Radeon RX 560 (Laptop):
23 fps
Radeon RX 560 (Laptop):
19 fps
Radeon RX 560 (Laptop):
9 fps
Radeon RX 560 (Laptop):
106.5 (!) [X] Lenovo IdeaPad 720-15IKB Intel Core i5-7200U 2.5GHz
Radeon RX 560 (Laptop)
fps
Radeon RX 560 (Laptop):
47.5 (!) [X] Lenovo IdeaPad 720-15IKB Intel Core i5-7200U 2.5GHz
Radeon RX 560 (Laptop)
fps
Radeon RX 560 (Laptop):
44.1 fps
Radeon RX 560 (Laptop):
36.2 fps
Radeon RX 560 (Laptop):
154.3 fps
Radeon RX 560 (Laptop):
144.1 fps
Radeon RX 560 (Laptop):
125.1 fps
Radeon RX 560 (Laptop):
124.3 fps
Radeon RX 560 (Laptop):
100 fps
Radeon RX 560 (Laptop):
66 fps
Radeon RX 560 (Laptop):
47 fps
Radeon RX 560 (Laptop):
24 fps
Radeon RX 560 (Laptop):
108.2 fps
Radeon RX 560 (Laptop):
49.4 fps
Radeon RX 560 (Laptop):
45.4 fps
Radeon RX 560 (Laptop):
12.5 fps
Radeon RX 560 (Laptop):
176.5 fps
Radeon RX 560 (Laptop):
83.6 fps
Radeon RX 560 (Laptop):
49.8 fps
Radeon RX 560 (Laptop):
28.6 fps
Radeon RX 560 (Laptop):
196.3 fps
Radeon RX 560 (Laptop):
96.8 fps
Radeon RX 560 (Laptop):
69 fps
Radeon RX 560 (Laptop):
79 fps
Radeon RX 560 (Laptop):
63.2 fps
Radeon RX 560 (Laptop):
36.7 fps
Radeon RX 560 (Laptop):
29.3 fps
Radeon RX 560 (Laptop):
224.2 fps
Radeon RX 560 (Laptop):
176.1 fps
Radeon RX 560 (Laptop):
95.4 fps
Radeon RX 560 (Laptop):
47.9 fps
Radeon RX 560 (Laptop):
38.7 fps
Radeon RX 560 (Laptop):
60.9 fps
Radeon RX 560 (Laptop):
22.2 fps
Radeon RX 560 (Laptop):
15.4 fps
Radeon RX 560 (Laptop):
51.8 71.9 ~ 62 fps
Radeon RX 560 (Laptop):
47.4 51.6 ~ 50 fps
Radeon RX 560 (Laptop):
30.6 35.1 ~ 33 fps
Radeon RX 560 (Laptop):
24.1 27.8 ~ 26 fps
Radeon RX 560 (Laptop):
99.5 fps
Radeon RX 560 (Laptop):
64.4 fps
100%
M2 10-Core GPU:
34 fps
103%
Radeon RX 560 (Laptop):
34.1 35.2 ~ 35 fps
100%
M2 10-Core GPU:
28 fps
71%
Radeon RX 560 (Laptop):
19.6 20.7 ~ 20 fps
Radeon RX 560 (Laptop):
83.1 fps
Radeon RX 560 (Laptop):
70 fps
Radeon RX 560 (Laptop):
34.9 40.3 ~ 38 fps
Radeon RX 560 (Laptop):
23.9 26.4 ~ 25 fps
Radeon RX 560 (Laptop):
38.3 fps
Radeon RX 560 (Laptop):
35.4 fps
Radeon RX 560 (Laptop):
34.5 fps
Radeon RX 560 (Laptop):
30.6 fps
100%
M2 10-Core GPU:
67.7 fps
100%
M2 10-Core GPU:
44.2 fps
Radeon RX 560 (Laptop):
75.3 141 ~ 108 fps
Radeon RX 560 (Laptop):
40.1 44.2 ~ 42 fps
Average Gaming Apple M2 10-Core GPU → 100% Average Gaming 30-70 fps → 100%
Average Gaming AMD Radeon RX 560 (Laptop) → 87% Average Gaming 30-70 fps → 103%
AMD Radeon RX 560 (Laptop) low med. high ultra QHD 4K Far Cry 5 63 35 30 27 Kingdom Come: Deliverance 53.3 32.5 28.3 21.4 Final Fantasy XV Benchmark 54.4 26.1 6.5 Fortnite 151.3 87.4 63 50.2 35.9 Star Wars Battlefront 2 70.1 47 43 17 Need for Speed Payback 59 49.7 41.4 36.3 Call of Duty WWII 56.3 39.5 21.8 Assassin´s Creed Origins 36 23 19 9 Destiny 2 106.5 47.5 44.1 36.2 FIFA 18 154.3 144.1 125.1 124.3 F1 2017 100 66 47 24 Playerunknown's Battlegrounds (PUBG) 108.2 49.4 45.4 12.5 Dirt 4 176.5 83.6 49.8 28.6 Rocket League 196.3 96.8 69 Battlefield 1 79 63.2 36.7 29.3 Overwatch 224.2 176.1 95.4 47.9 Doom 38.7 60.9 22.2 15.4 Rise of the Tomb Raider 62 50 33 26 The Witcher 3 99.5 64.4 35 20 Dragon Age: Inquisition 83.1 70 38 25 Thief 38.3 35.4 34.5 30.6 BioShock Infinite 120 108 100 42 < 30 fps < 60 fps < 120 fps ≥ 120 fps 6 9 6 2 9 9 2 4 13 4 1 13 6 1 1
For more games that might be playable and a list of all games and graphics cards visit our Gaming List
v1.26
log 01. 11:09:04
#0 checking url part for id 11368 +0s ... 0s
#1 checking url part for id 7682 +0s ... 0s
#2 not redirecting to Ajax server +0s ... 0s
#3 did not recreate cache, as it is less than 5 days old! Created at Sat, 01 Jun 2024 05:39:27 +0200 +0.001s ... 0.001s
#4 composed specs +0.115s ... 0.117s
#5 did output specs +0s ... 0.117s
#6 start showIntegratedCPUs +0s ... 0.117s
#7 getting avg benchmarks for device 11368 +0.032s ... 0.149s
#8 got single benchmarks 11368 +0.017s ... 0.166s
#9 getting avg benchmarks for device 7682 +0.002s ... 0.168s
#10 got single benchmarks 7682 +0.02s ... 0.189s
#11 got avg benchmarks for devices +0s ... 0.189s
#12 min, max, avg, median took s +0.102s ... 0.29s
#13 before gaming benchmark output +0s ... 0.29s
#14 Got 152 rows for game benchmarks. +0.027s ... 0.317s
#15 composed SQL query for gamebenchmarks +0s ... 0.317s
#16 got data and put it in $dataArray +0.026s ... 0.343s
#17 benchmarks composed for output. +0.081s ... 0.424s
#18 calculated avg scores. +0s ... 0.424s
#19 return log +0.077s ... 0.502s
Please share our article, every link counts!
Redaktion, 2017-09- 8 (Update: 2023-07- 1)
 Deutsch
 English
 Español
 Français
 Italiano
 Nederlands
 Polski
 Português
 Русский
 Türkçe
 Svenska
 Chinese
 Magyar