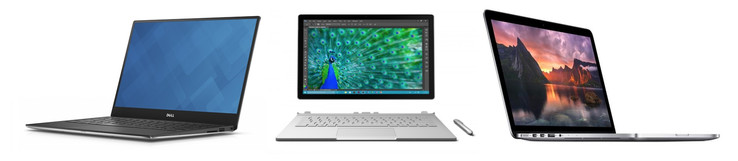
Face Off: Microsoft Surface Book vs. Dell XPS 13 InfinityEdge vs. Apple MacBook Pro Retina 13
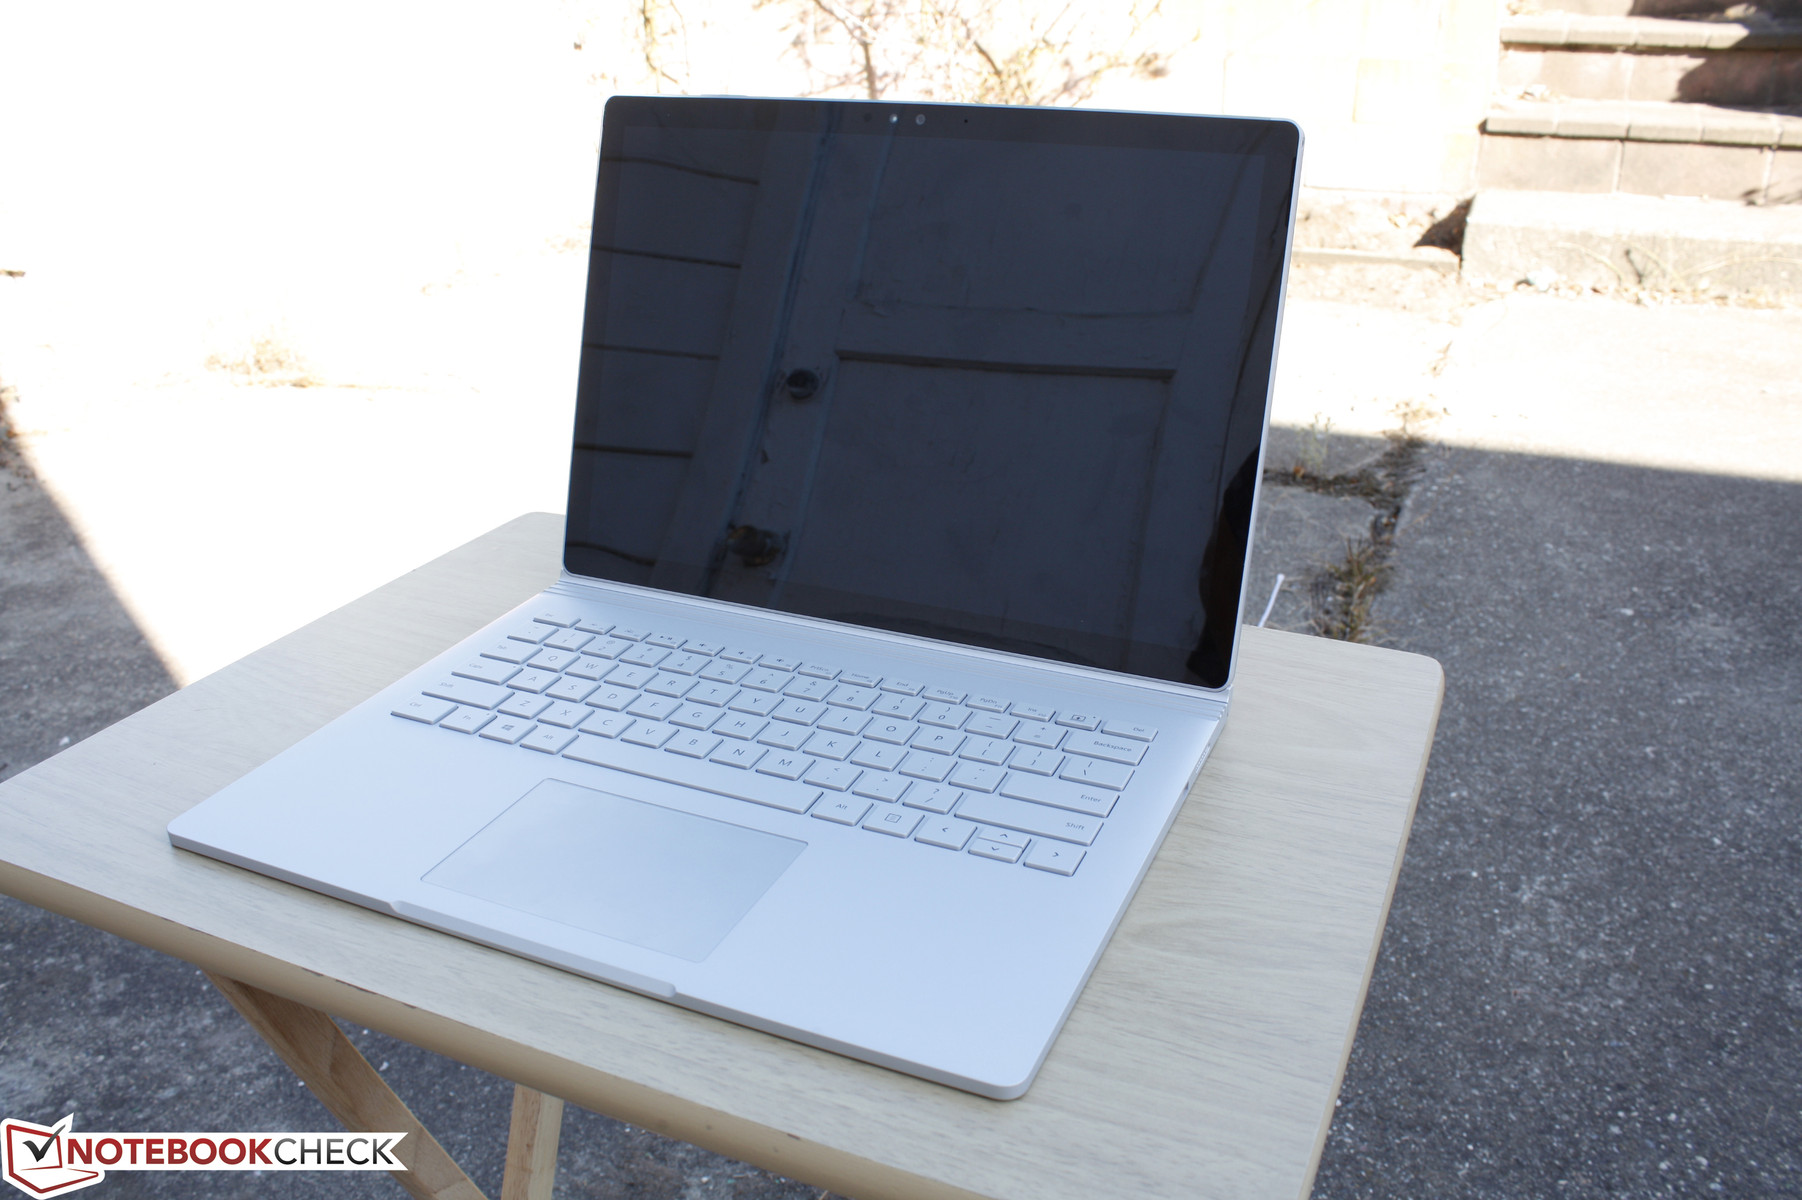
Microsoft is redefining what it means to be a laptop with the recent launch of the Surface Book. As explained in our review of the device, its design and hardware make it more than just a simple detachable or convertible.
Comparisons between the Surface Book and other popular 13-inch notebooks are inevitable. For this Face Off, we'll be seeing how it compares to the recent XPS 13 InfinityEdge and MacBook Pro Retina 13. No subjective opinions on appearance or software - just the hardware facts to make it easier for the reader to decide on his or her own.
We encourage users to check out our dedicated review pages below for more data and detailed analyses of each of the three models. This comparison is by no means a replacement, but a condensed aid for those on the fence.
Dell XPS 13 InfinityEdge Review (Dell XPS 13 3/2015) (Dell XPS 13 2/2015) (Dell XPS 13 Touchscreen 2/2015) (Dell XPS 13 3/2014)
Apple MacBook Pro Retina 13 2015 Review (MacBook Pro Retina 13 2013)
Case
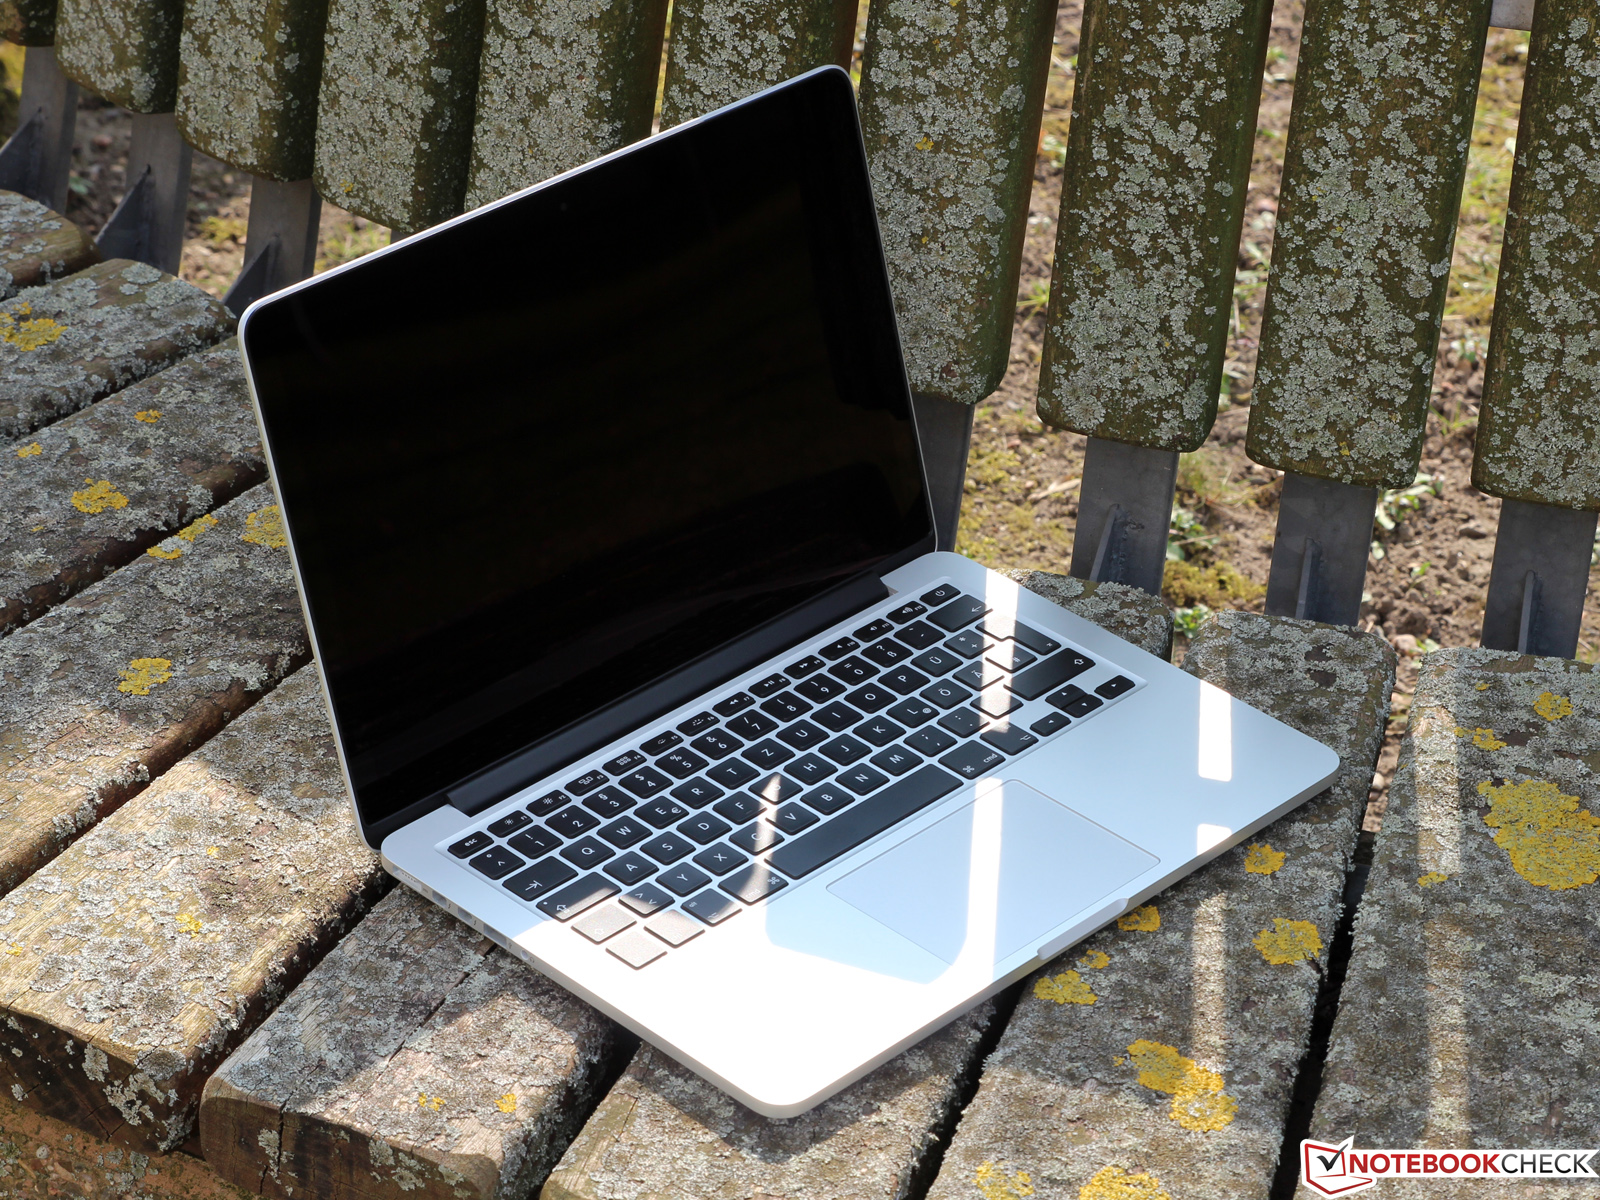
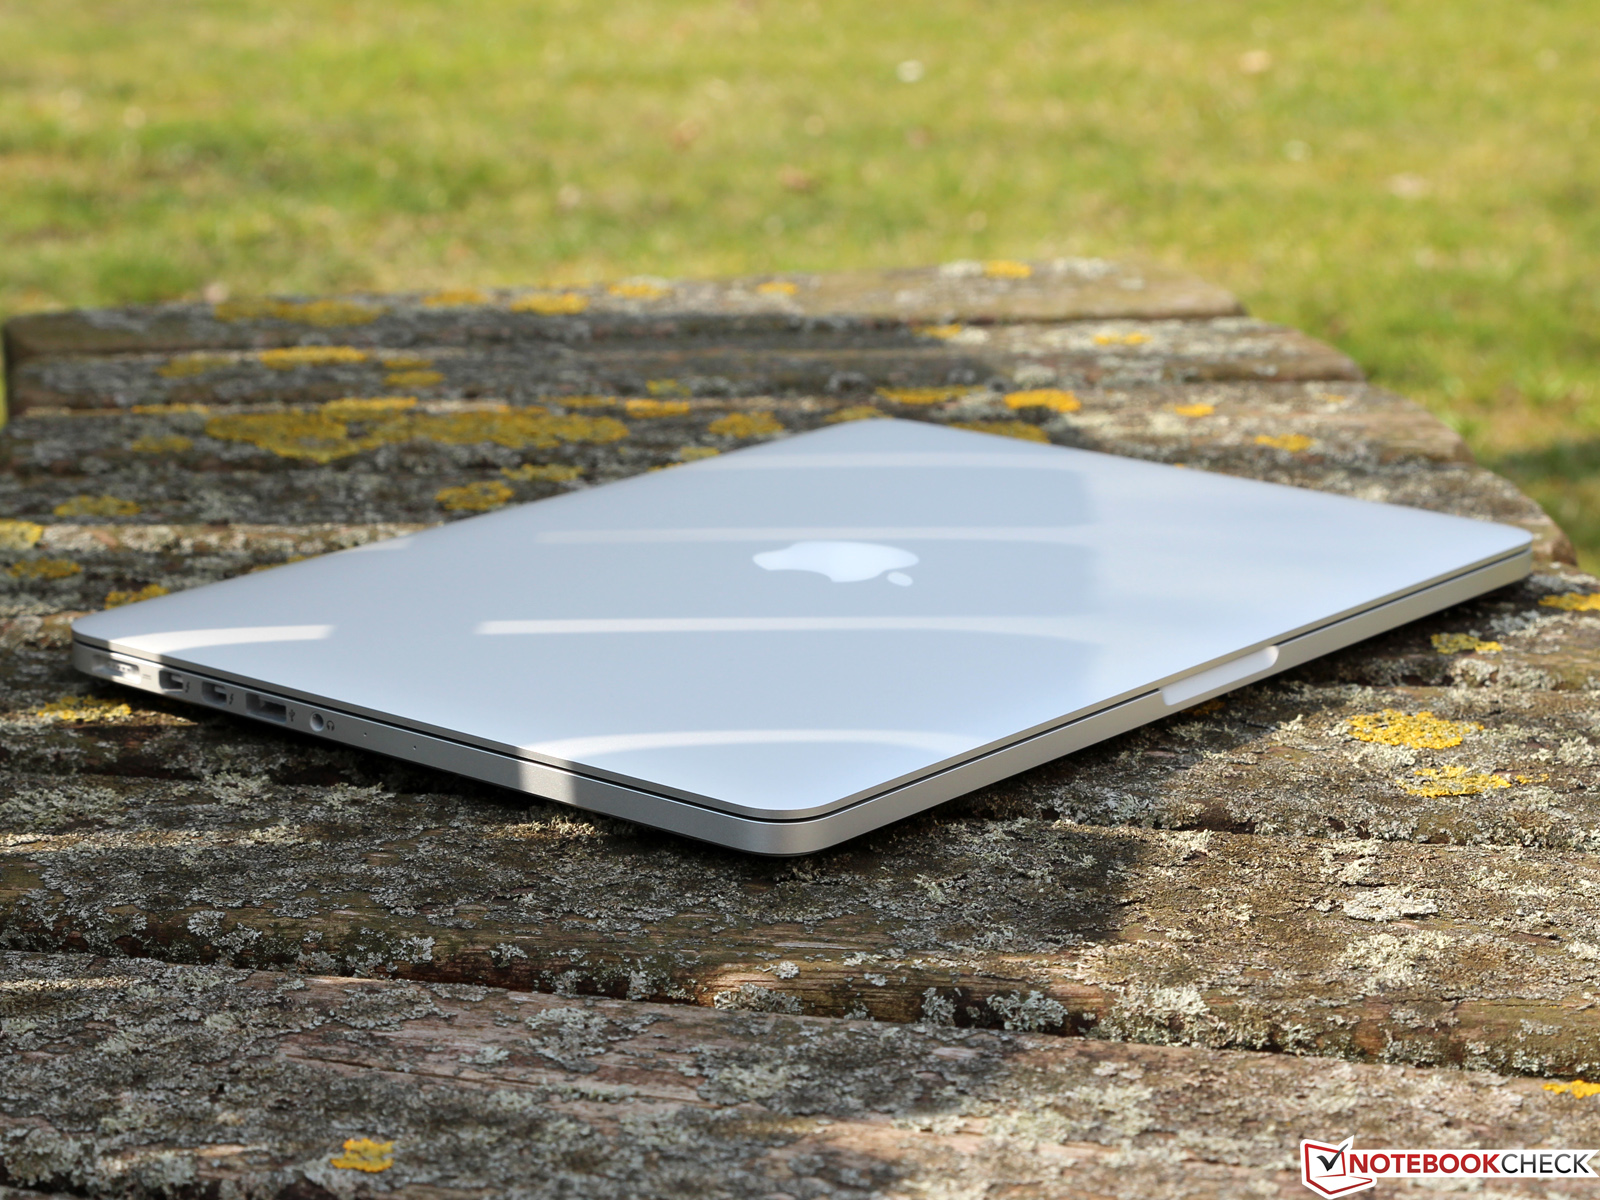
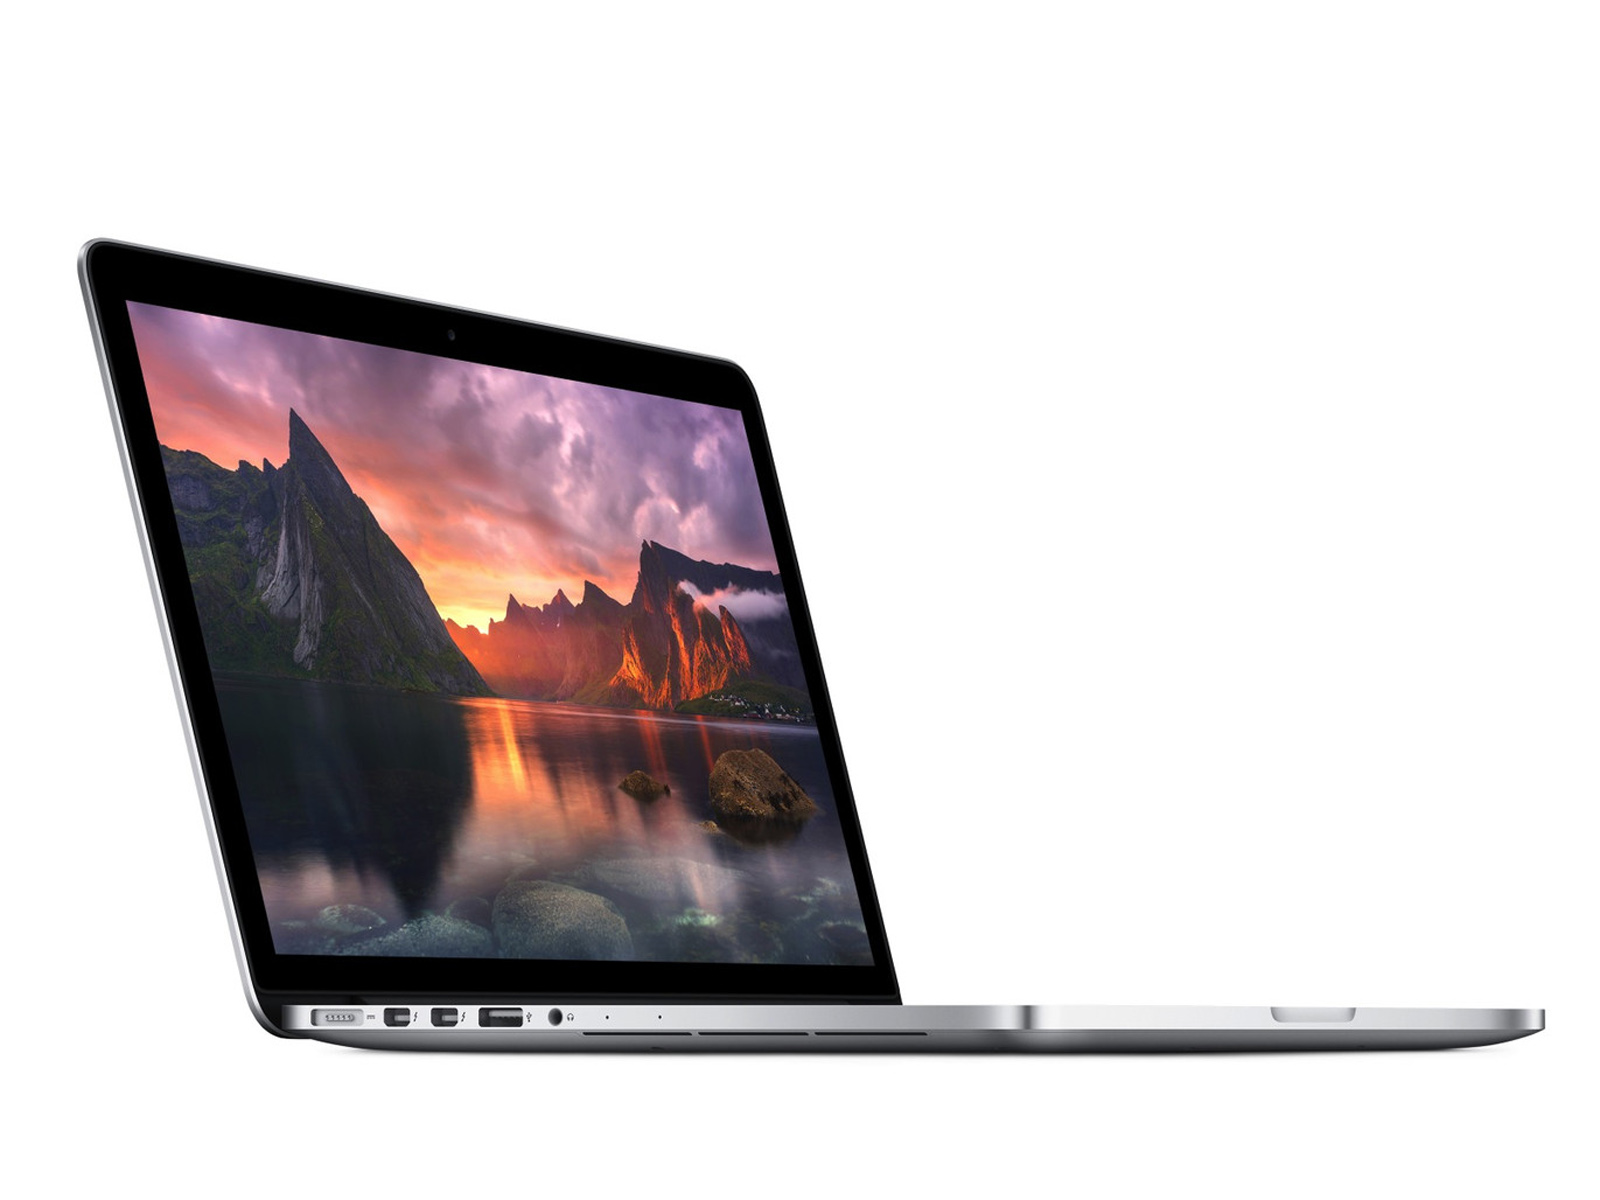
Starting with the tried-and-true MacBook design, Apple has not changed the chassis on the MacBook Pro Retina 13 for the 2015 model. This makes sense from a quality point-of-view as the unibody chassis is almost perfectly rigid with no notable weak spots. This is also the standard that users tend to hold Ultrabooks against when comparing between them.
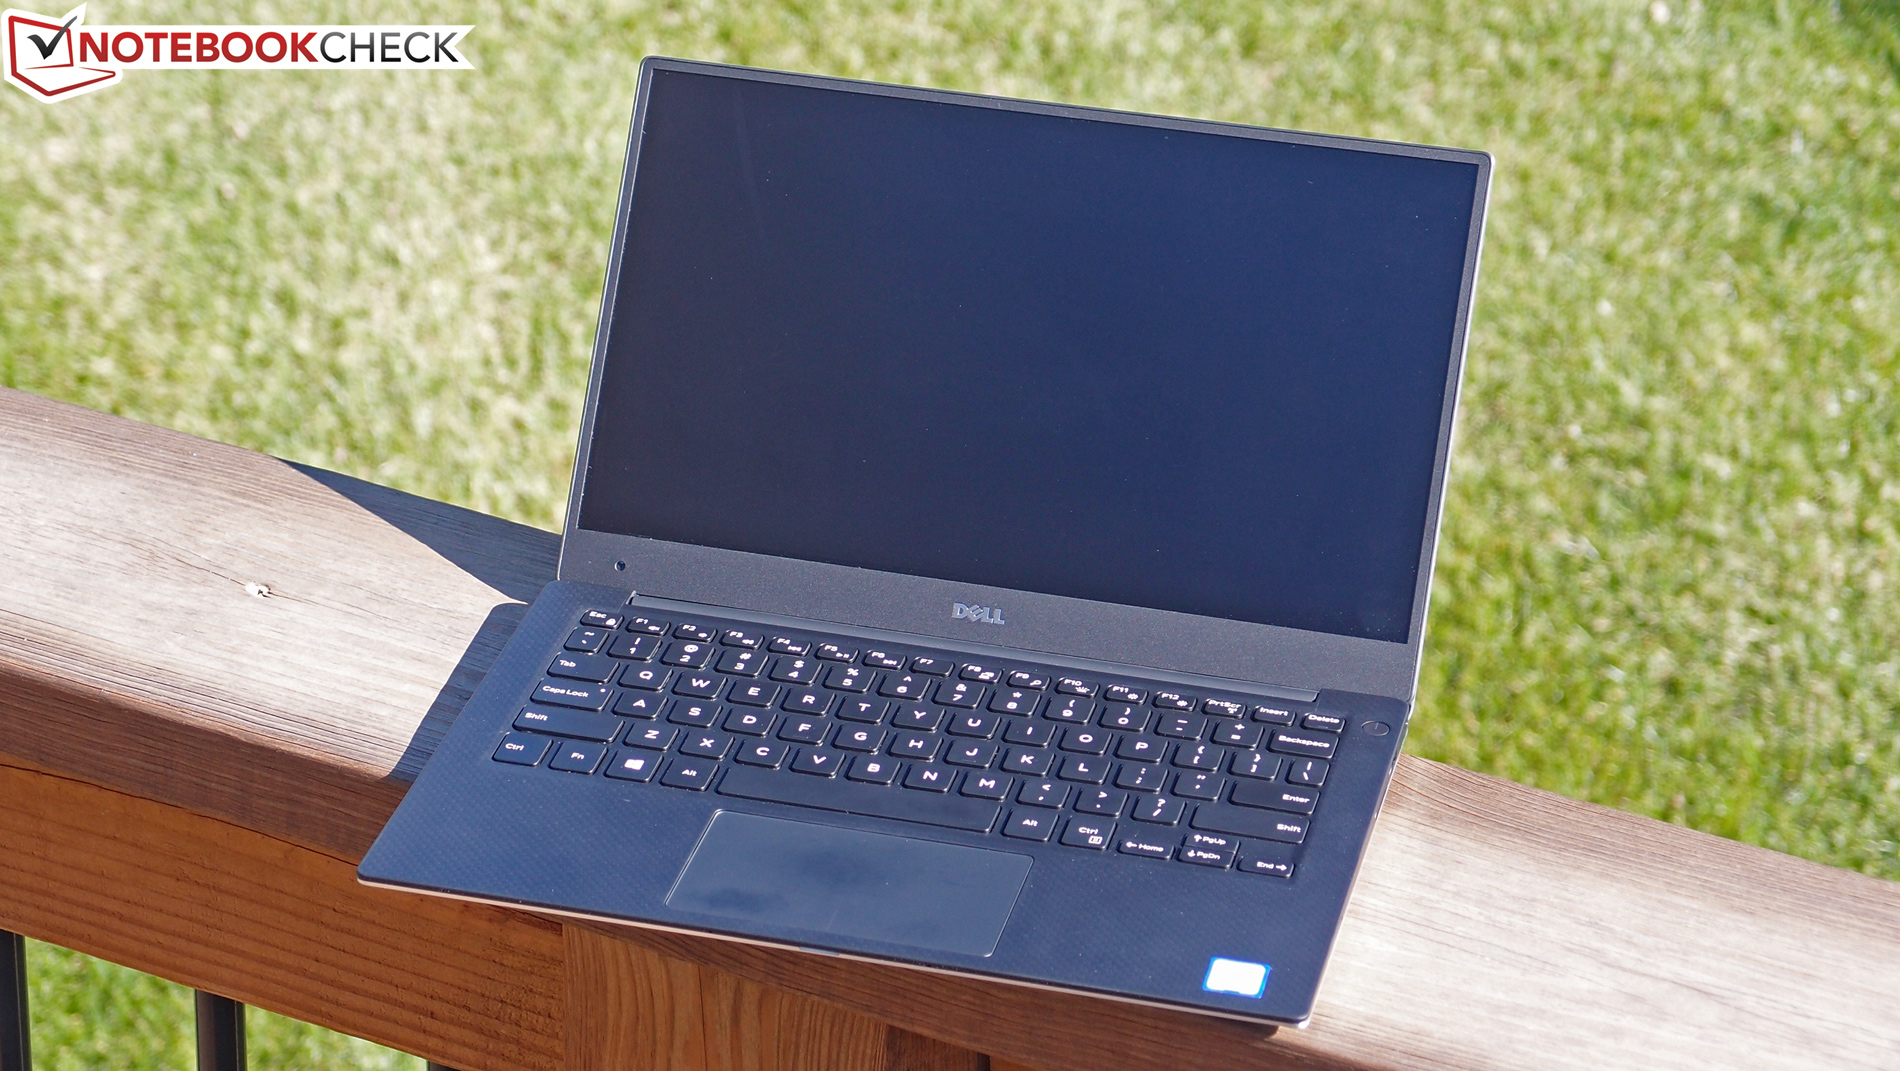
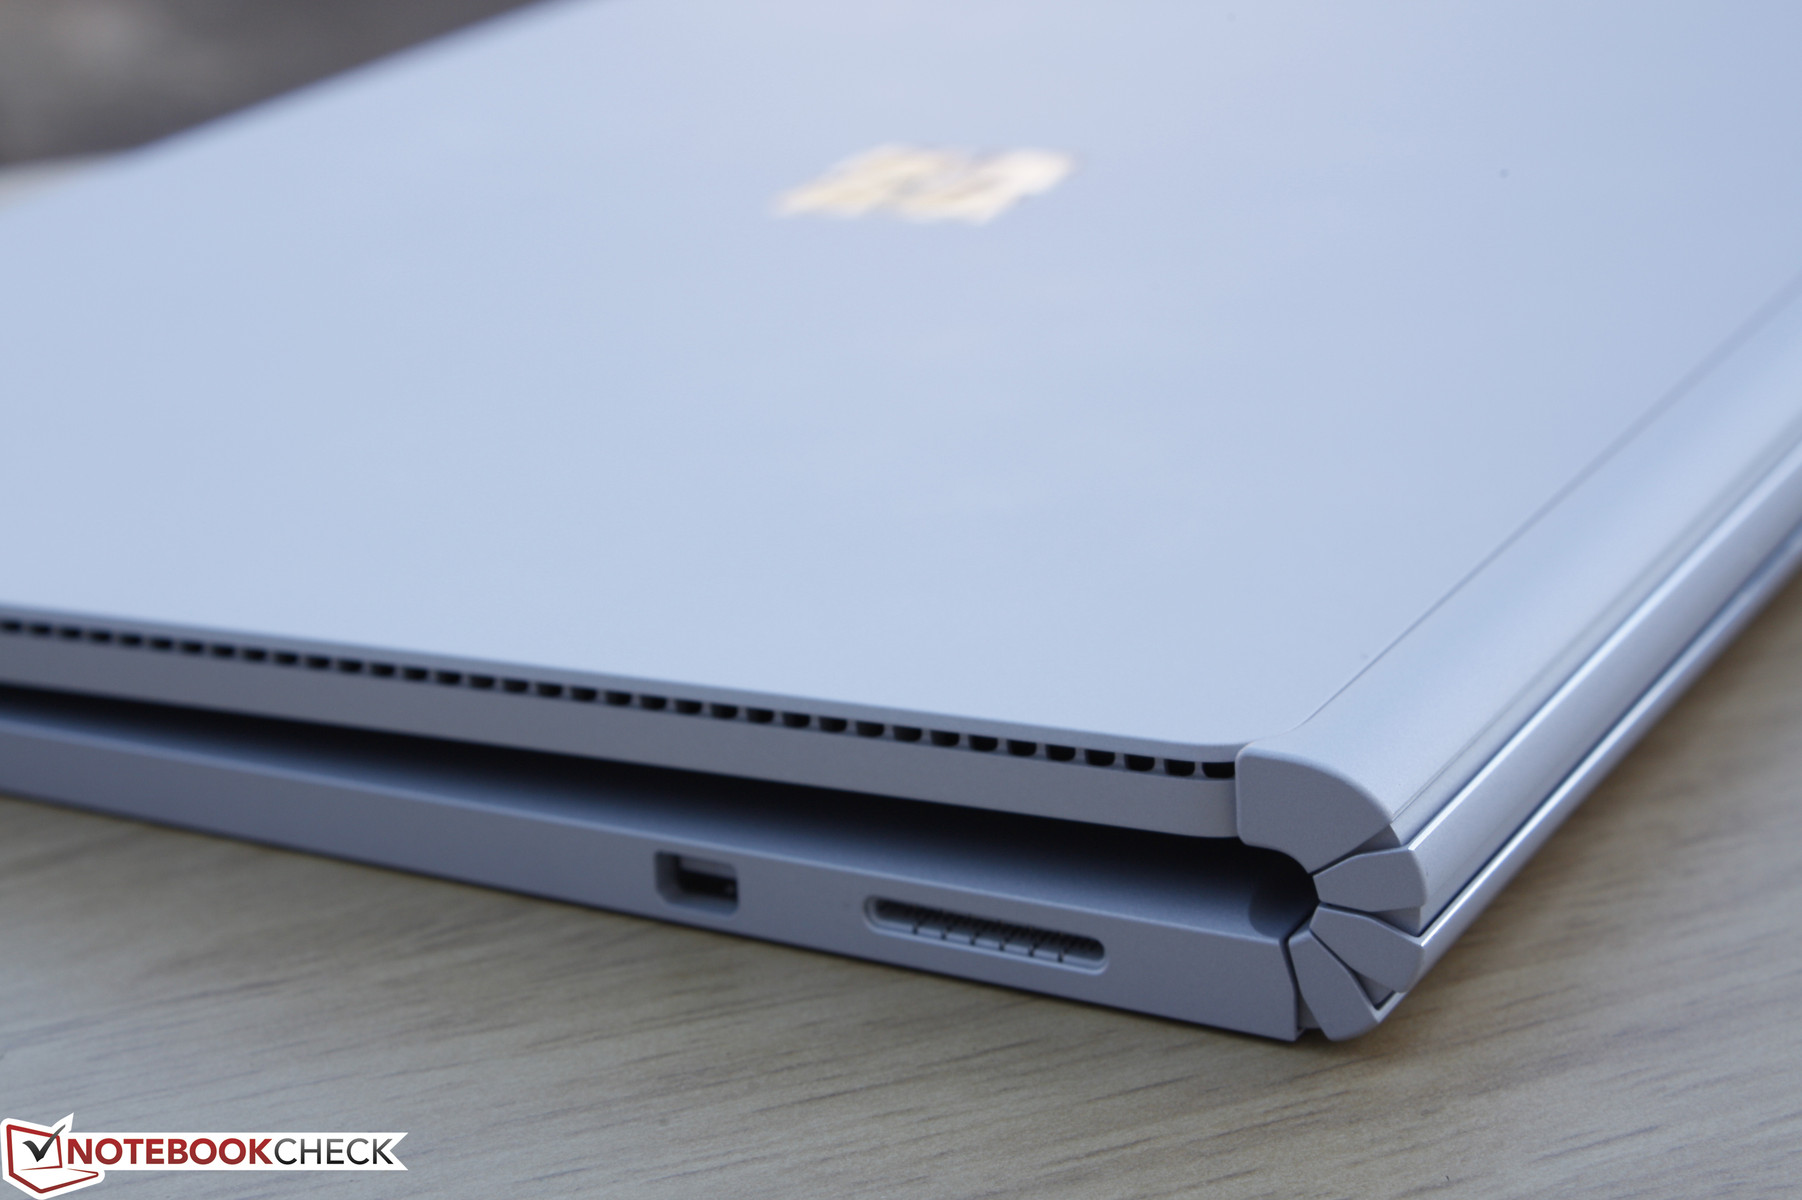
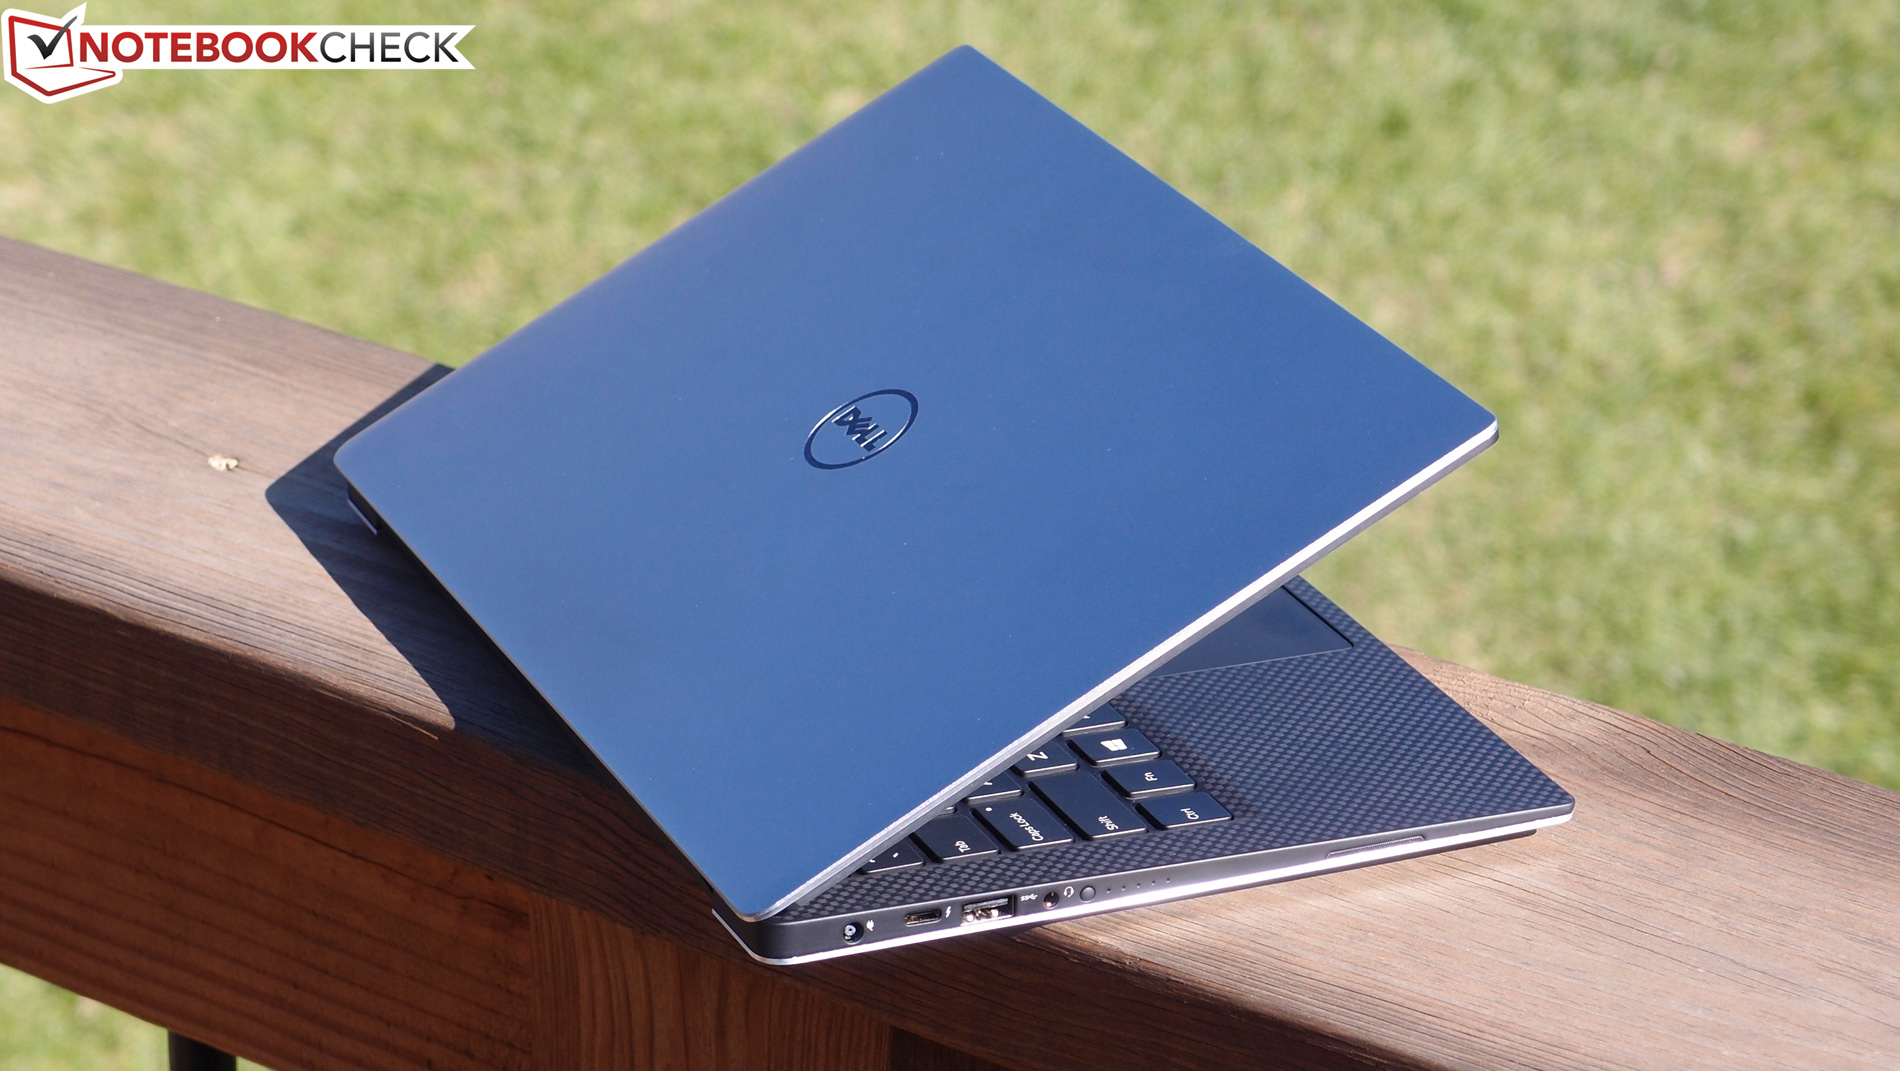
For a system as unique as the Surface Book, it would have been easy for Microsoft to overlook some of the more minute details such as gaps in the chassis or general weak spots around the corners or base. This has proven to not be the case as the aluminum body is very resistant to any twisting or depressions. Dell takes a more mixed approach with its combination of carbon fiber and aluminum, but quality is not significantly any worse.
If build quality is excellent between the three, then how do we crown a winner? This comes down to their differing sizes and weights. The Surface Book is the largest and thickest of the three and nearly as heavy as the dense MacBook Pro Retina 13 (1.50 kg vs. 1.56 kg). Meanwhile, the slim bezel design of the XPS 13 InfinityEdge gives it a significantly smaller footprint and lighter weight of just 1.23 kg. The chassis is slightly less rigid than the Surface Book and MacBook, but the flexing is so minor that it should have no impact on longevity or quality.
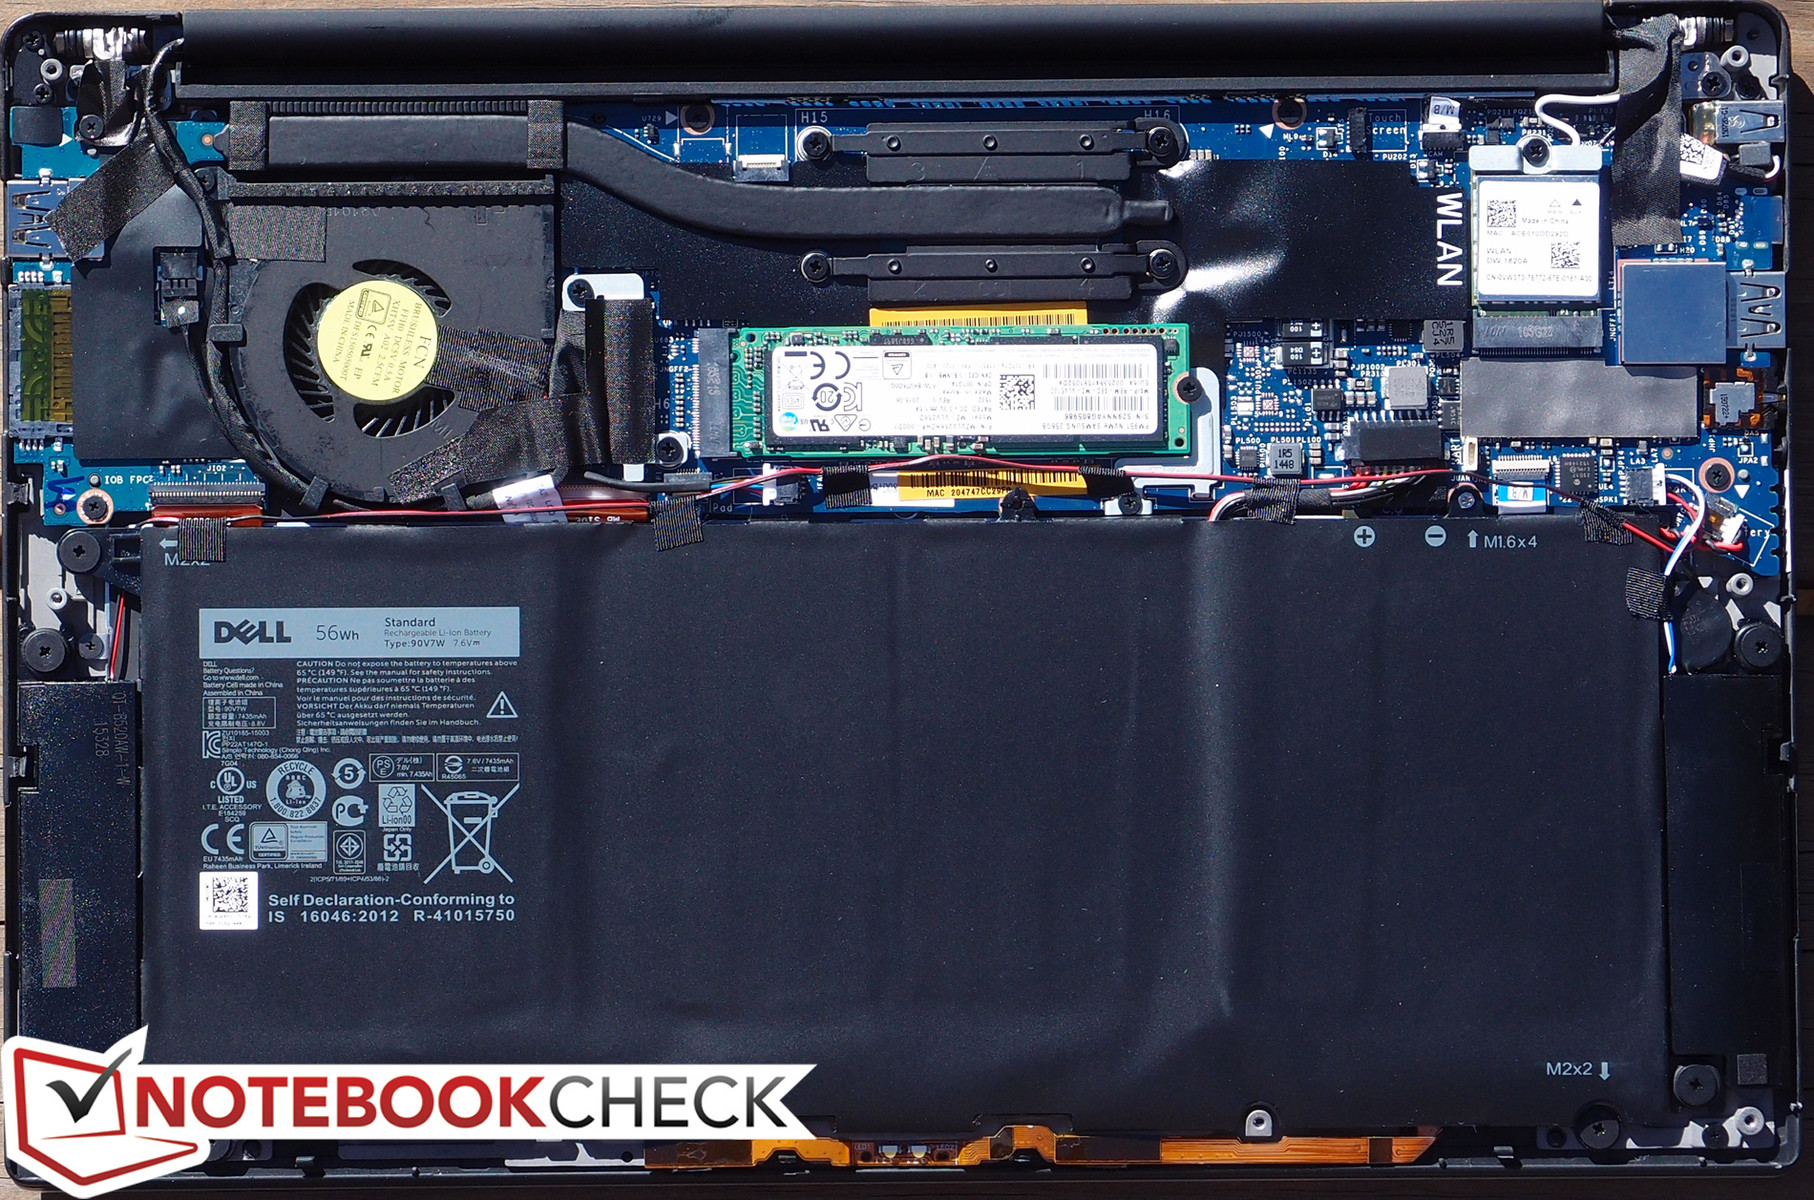
The size and weight advantages of the XPS 13 are much more noticeable compared to any structural advantages of the Surface Book or MacBook. The Dell is more accessible as well should any maintenance be required in its lifetime.
Winner: Dell XPS 13 InfinityEdge
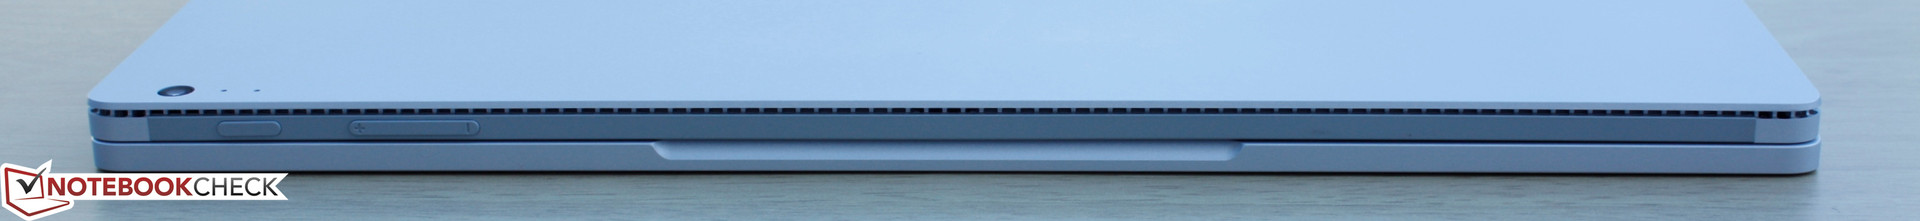
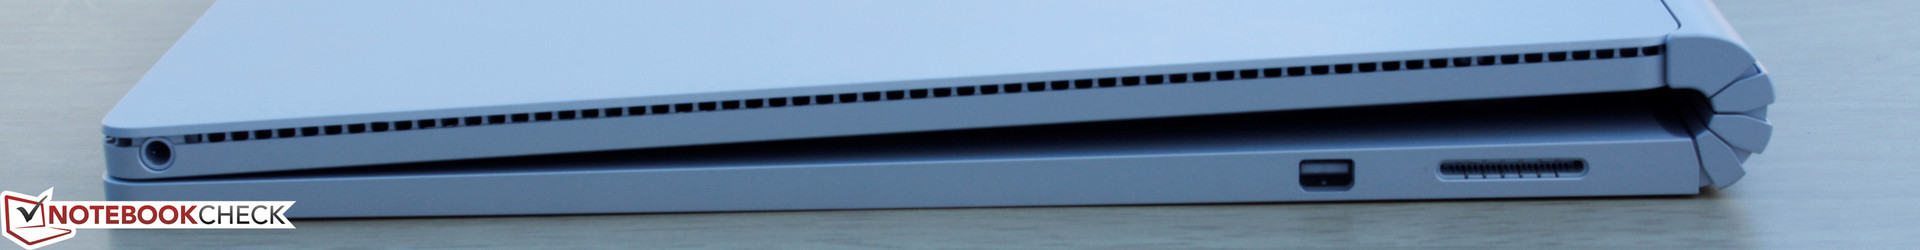
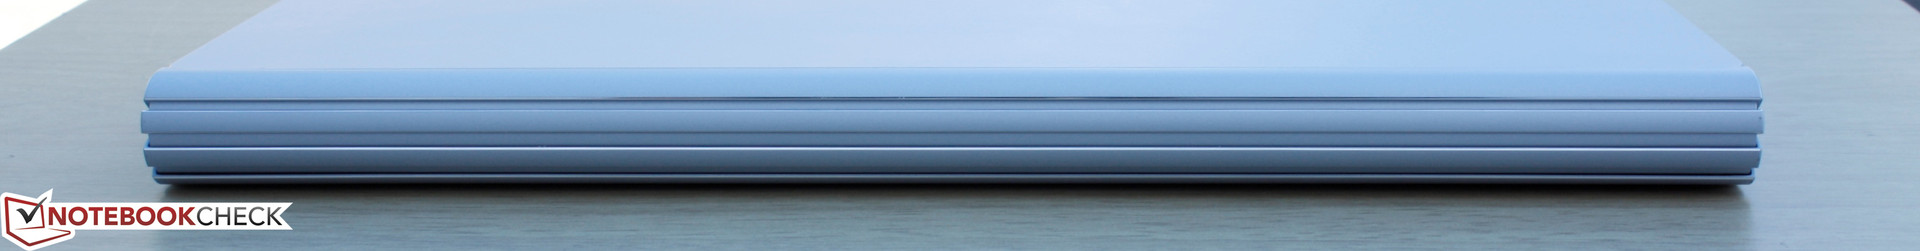
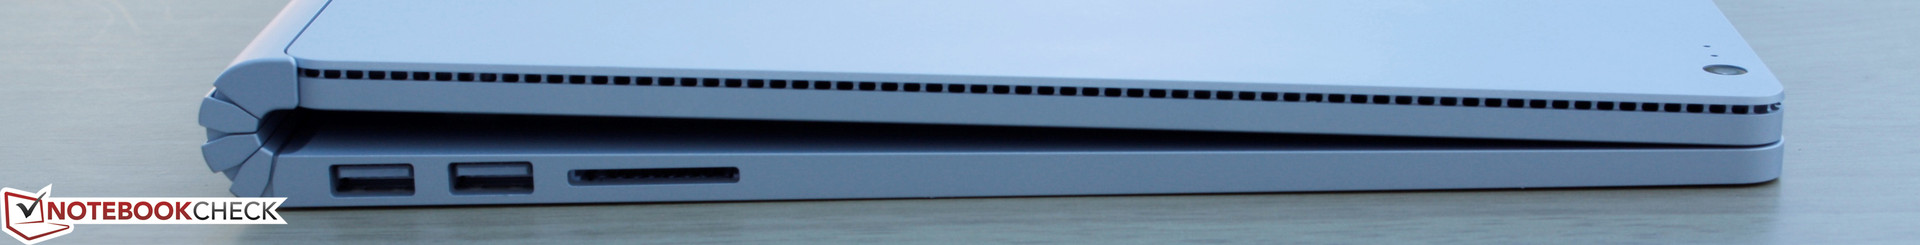
Ports in Comparison
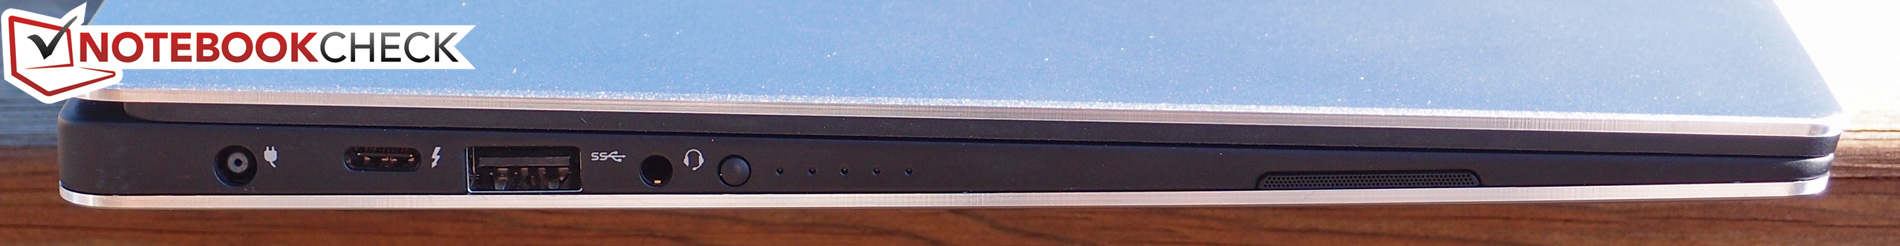
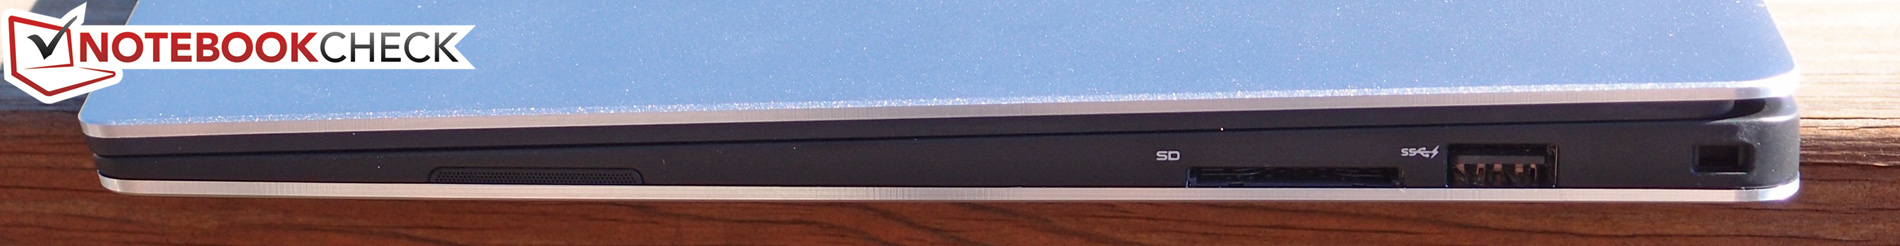
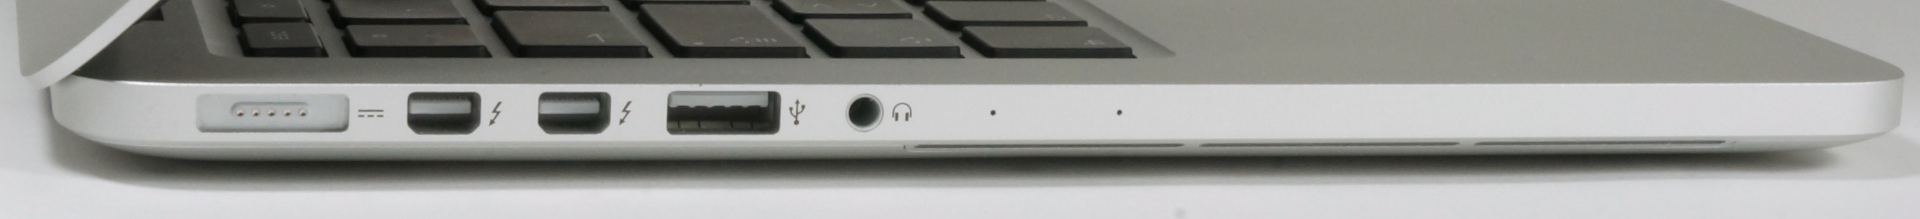
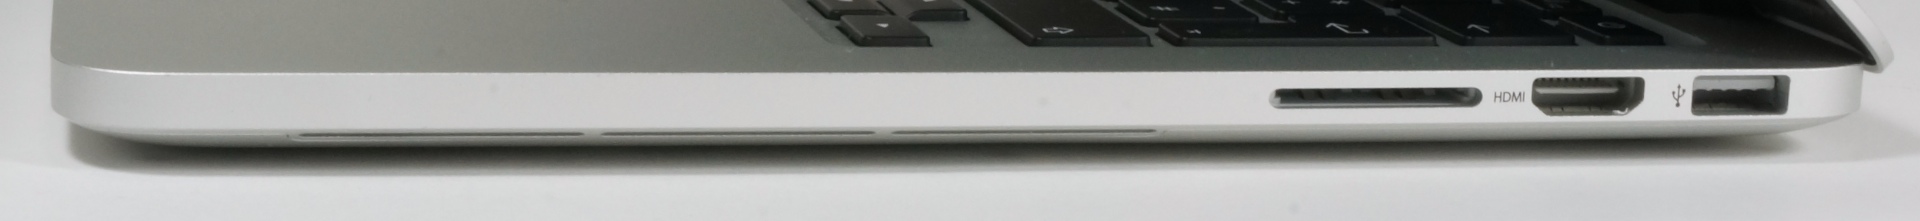
Connectivity
The Surface Book has the least amount of options regarding port connectivity. The XPS 13 and MacBook are limited in ports as well, but the included USB 3.1 Type-C and Thunderbolt 2 ports are more future-proof and much more versatile than what Microsoft has to offer.
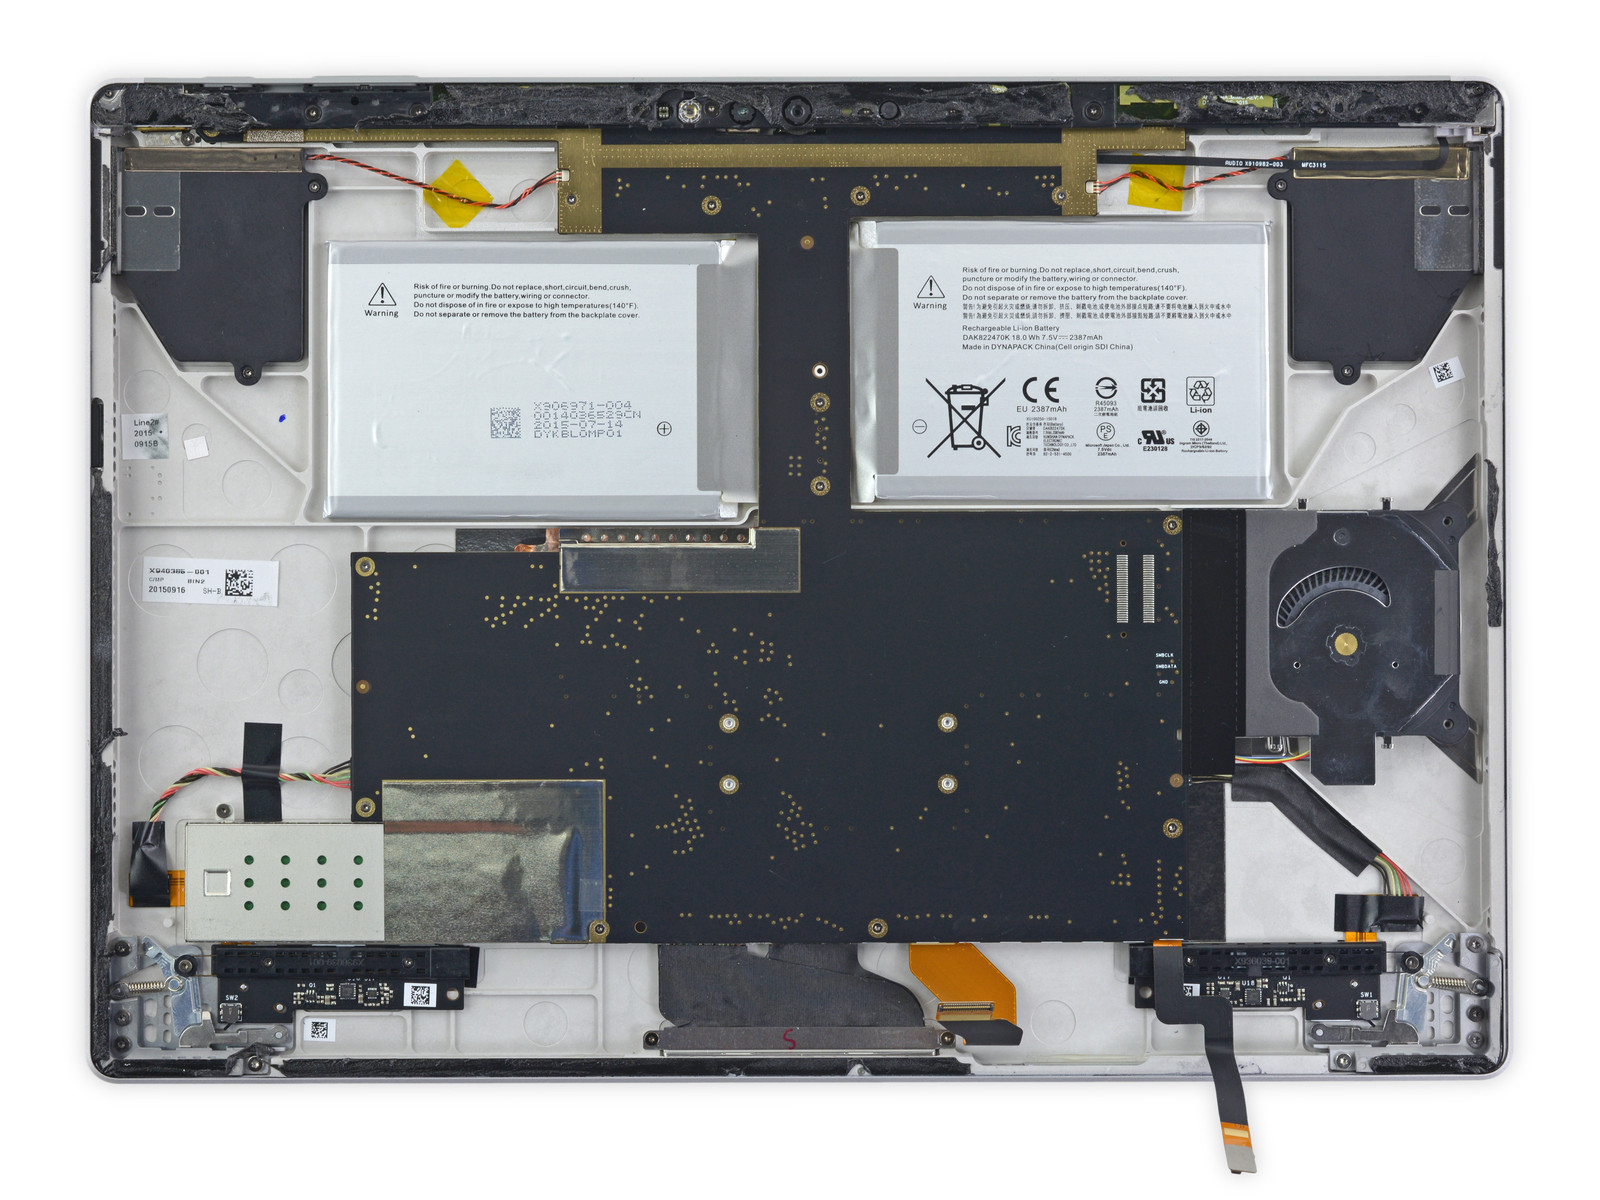
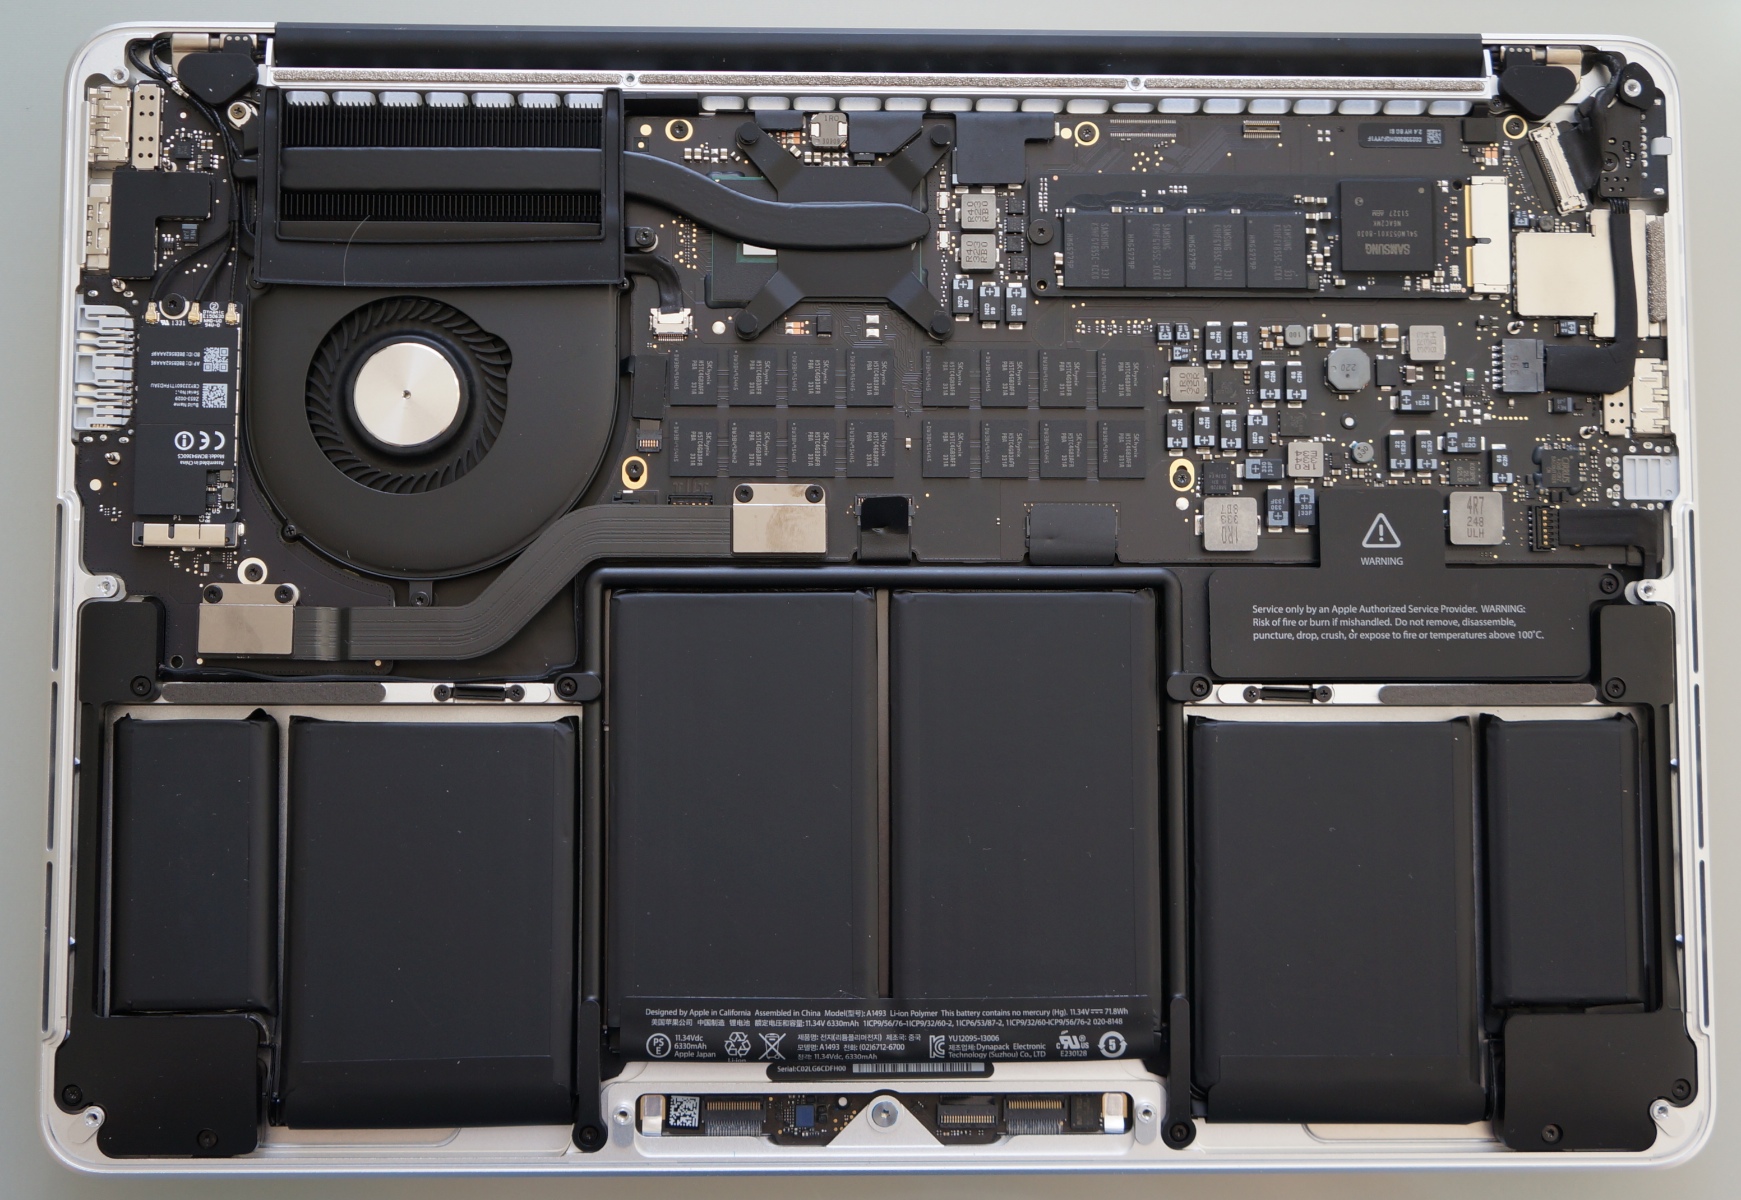
Safe access to the M.2 slot is nearly impossible on the Surface Book compared to the Dell and Apple. There are no internal secondary storage options available on any of the three models.
The MacBook may be missing the USB Type-C port, but its standard HDMI port and dual Thunderbolt ports put it ahead of Dell and far ahead of the Surface Book.
Winner: Apple MacBook Pro Retina 13
| Microsoft Surface Book | Dell XPS 13 InfinityEdge | Apple MacBook Pro Retina 13 | |
| USB | 2x USB 3.0 | 2x USB 3.0 | 2x USB 3.0 |
| Video-out | 1x mDP | 1x USB 3.1 Type-C Gen. 2 + Thunderbolt 3 | HDMI, 2x Thunderbolt 2 |
| Other | SD reader, 1x 3.5 mm audio | SD reader, 1x 3.5 mm audio, Kensington Lock | SD reader, 1x 3.5 mm combo, MagSafe 2 |
| Storage Bays | 1x M.2 | 1x M.2 | 1x M.2 |
Input Devices
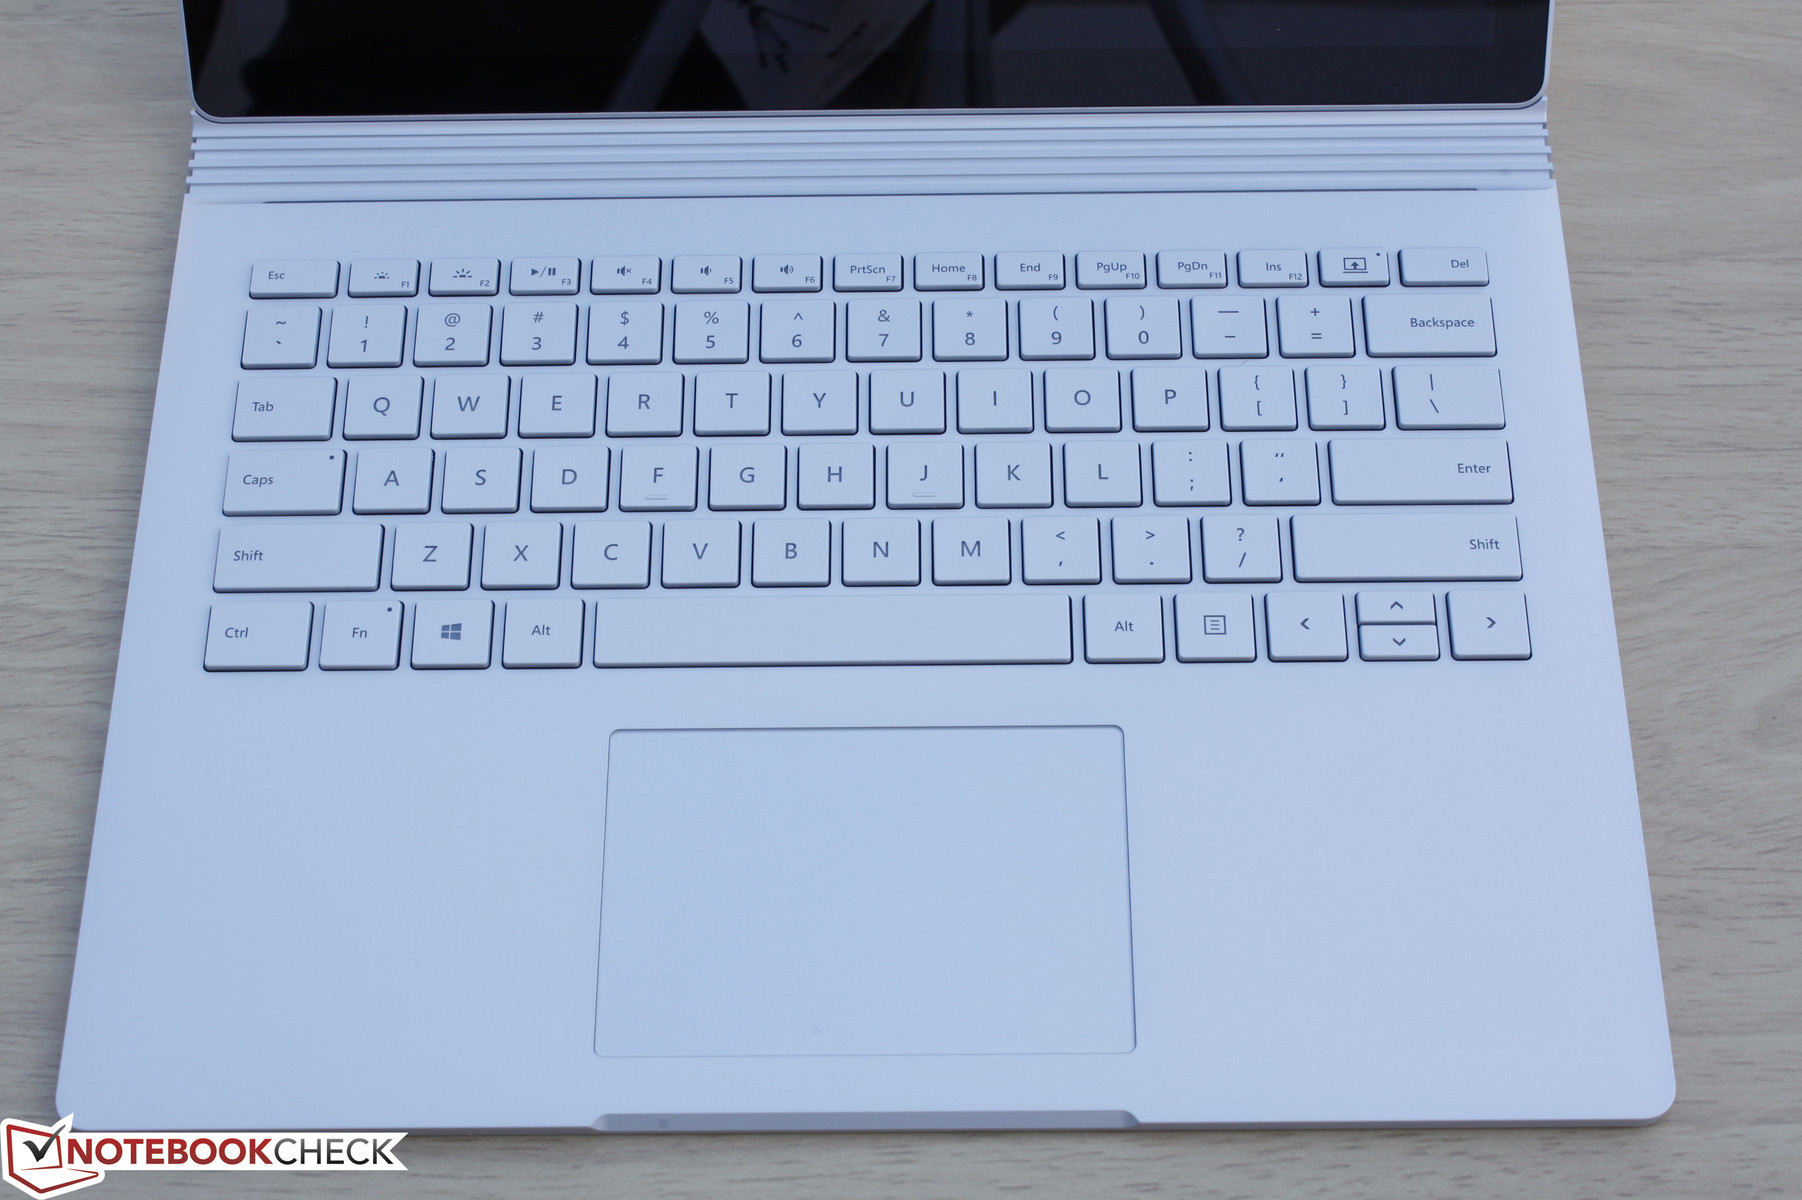
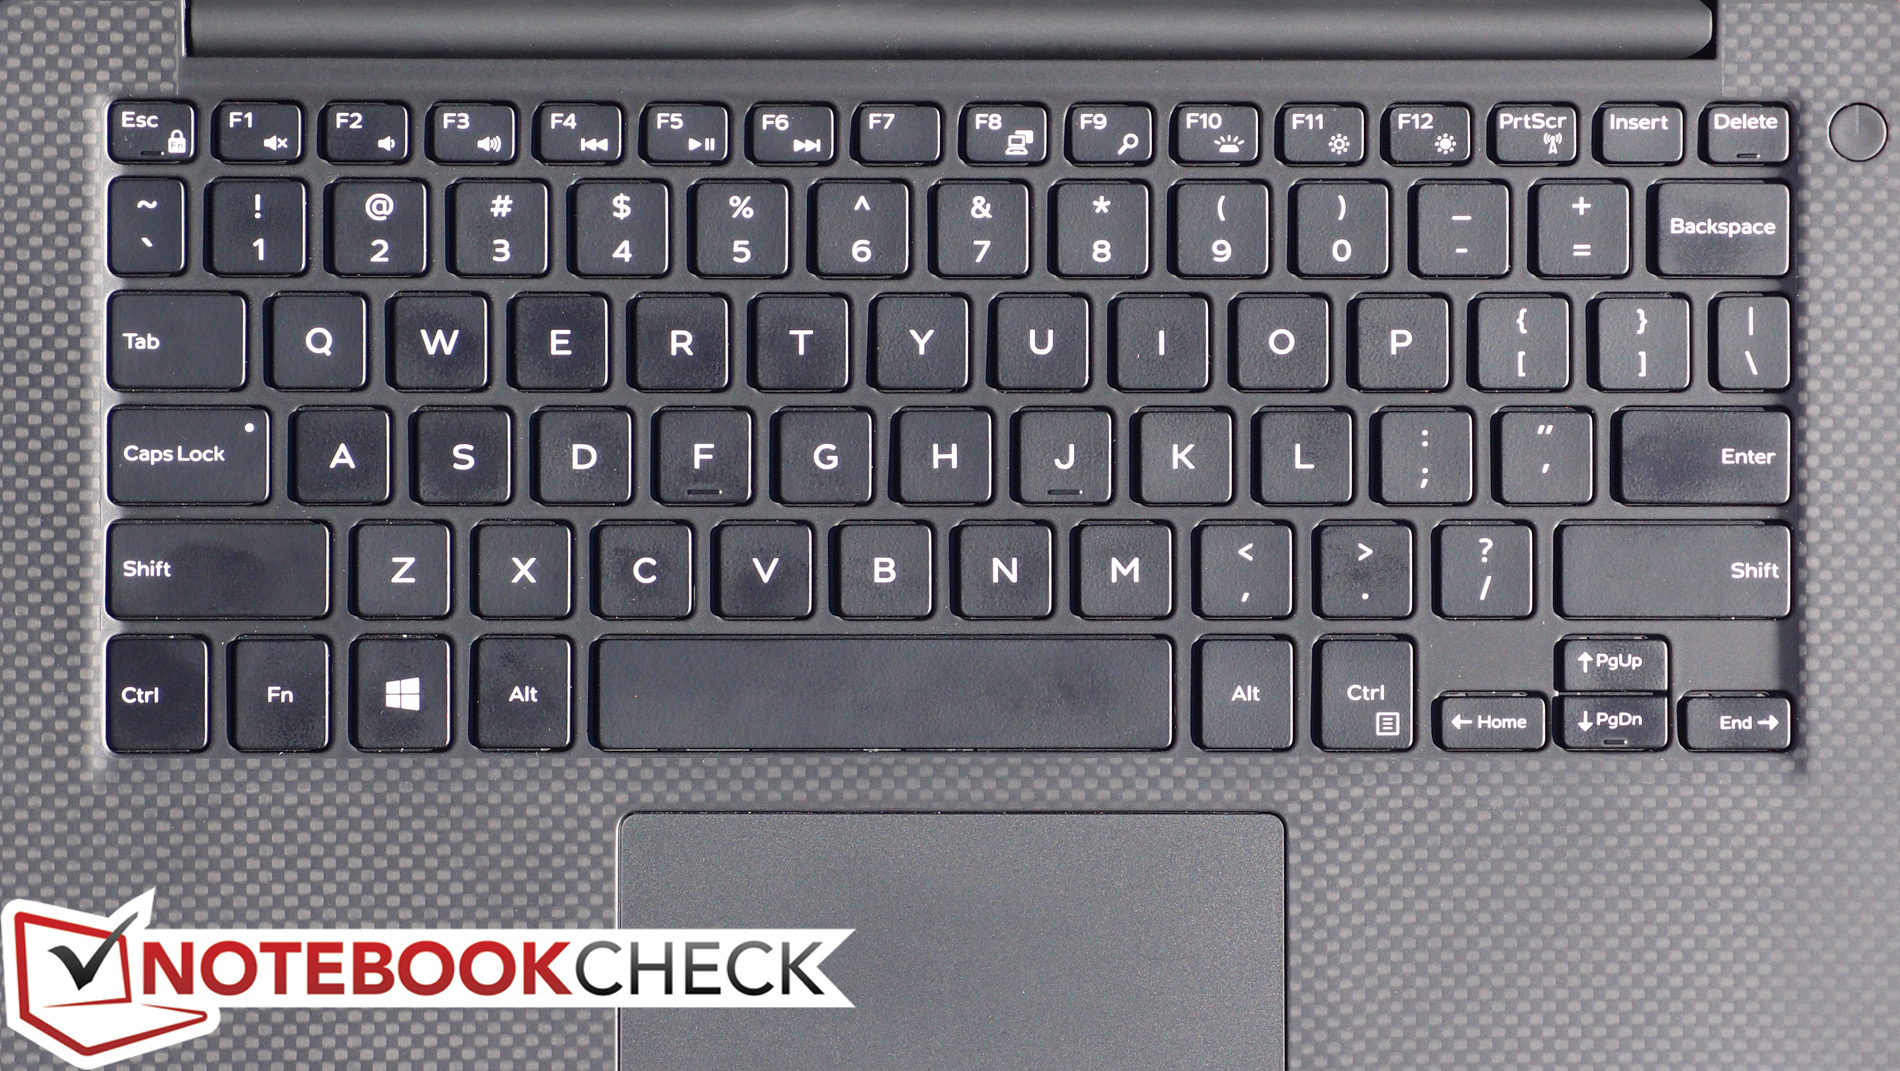
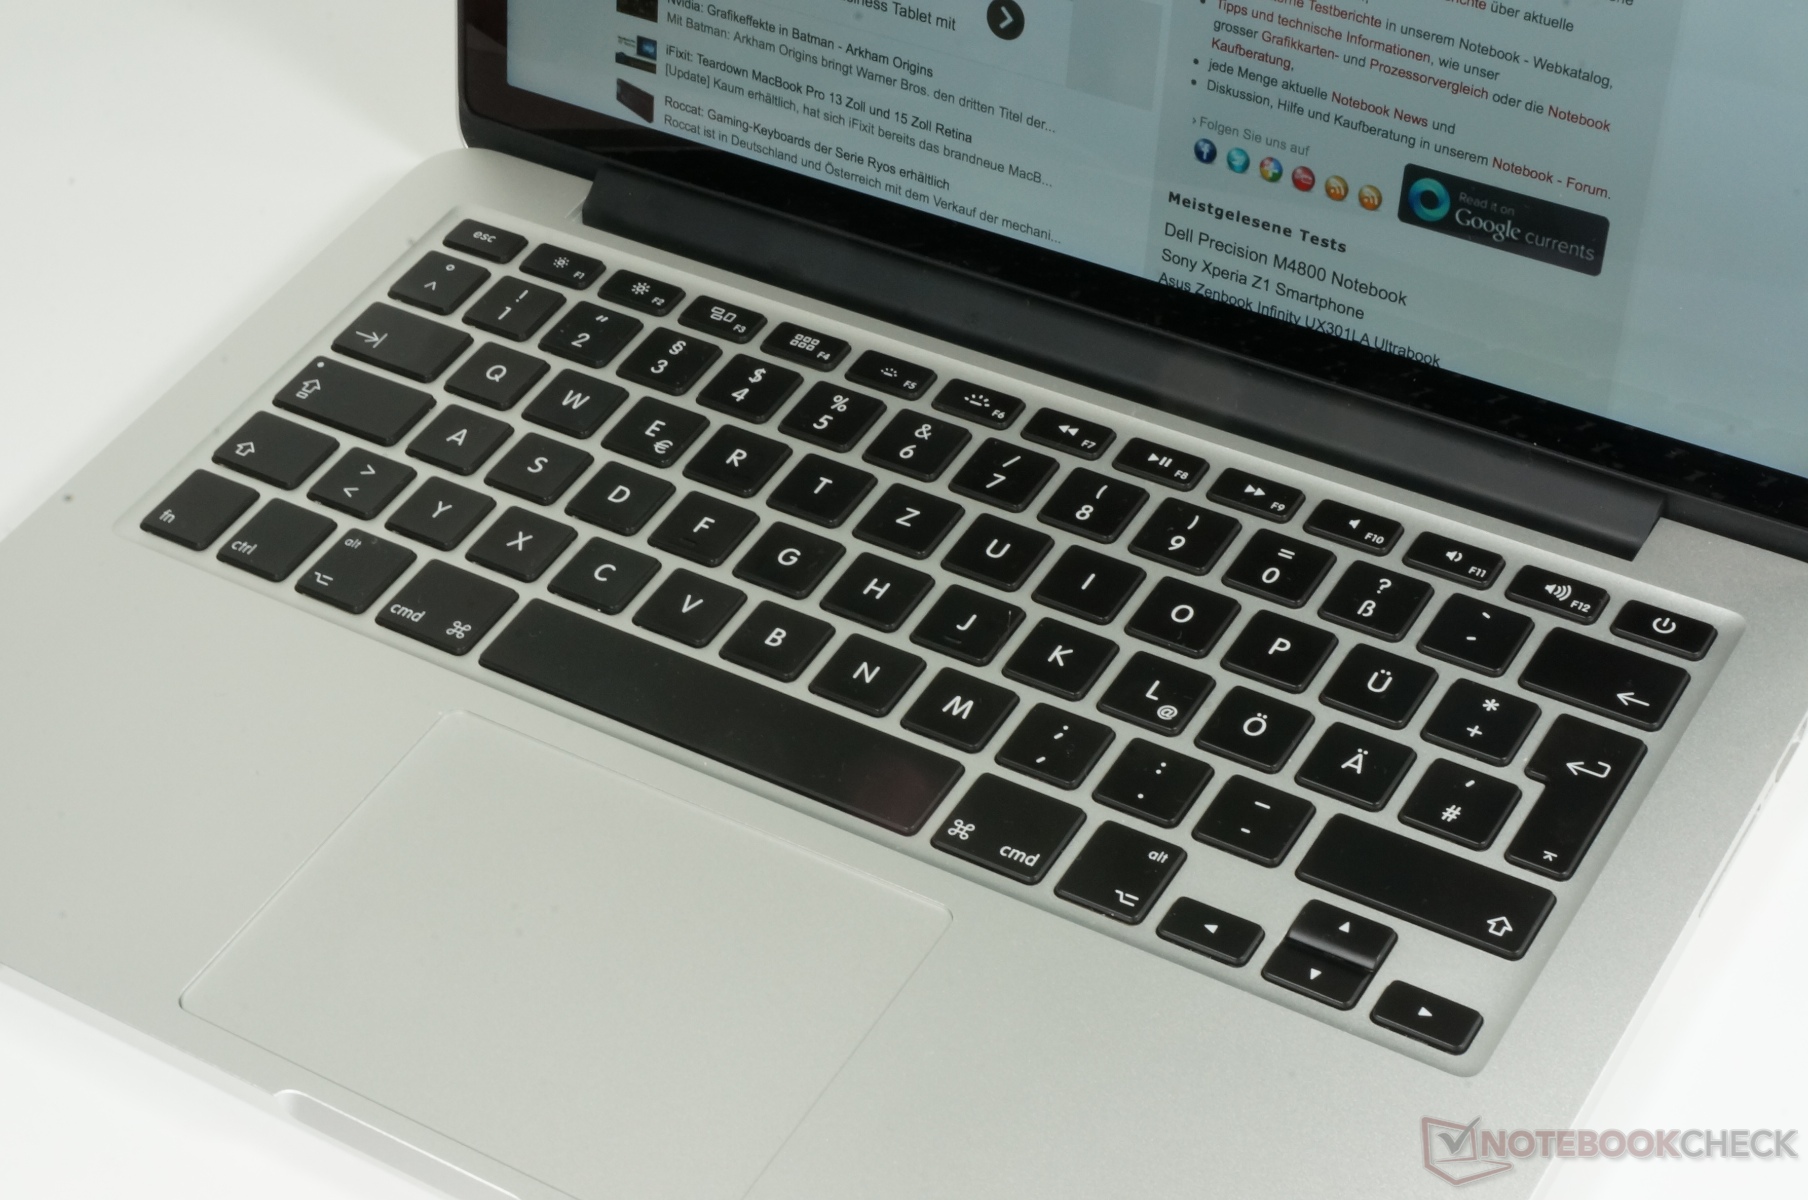
The keyboards on the Surface Book and MacBook Pro Retina offer an excellent balance of feedback and travel, so user preferences will largely come down to layout and style rather than comfort. The XPS 13 keyboard provides shallower travel in comparison, though feedback is solid nonetheless.
As for the touchpads, all three notebooks have large surface areas with integrated mouse keys. The Surface Book touchpad is a bit buggy as it would sometimes be unresponsive to inputs. The XPS 13 touchpad works smoothly enough, but oddly provides no dedicated driver settings for customized inputs. Apple's trump card in this category is its Force Touch feature on top of an already excellent trackpad for a wider range of options.
Perhaps the most notable downside for the MacBook is its lack of touchscreen options. The Surface Book includes it as standard while it is optional for the XPS 13.
Winner: Keyboard: Tie -- Microsoft Surface Book and Apple MacBook Pro Retina 13
Touchpad: Apple MacBook Pro Retina 13
Display
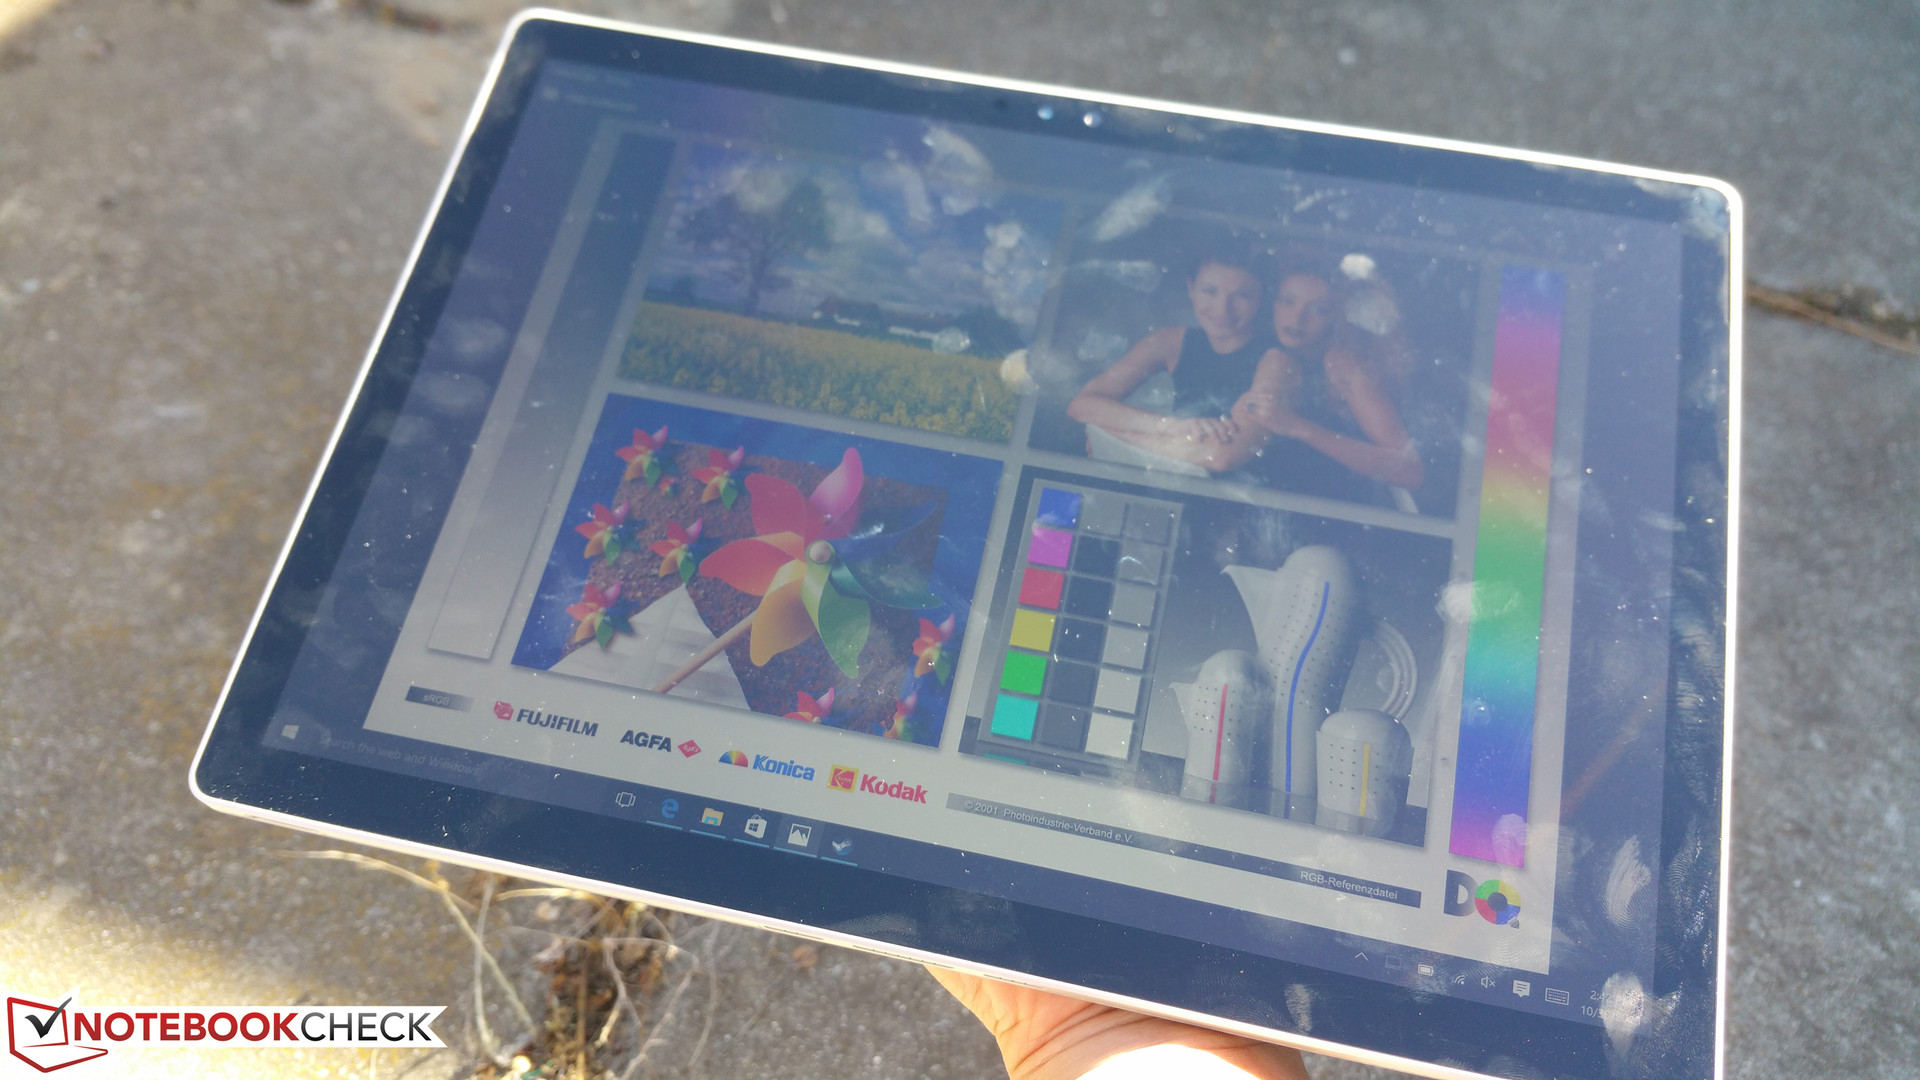
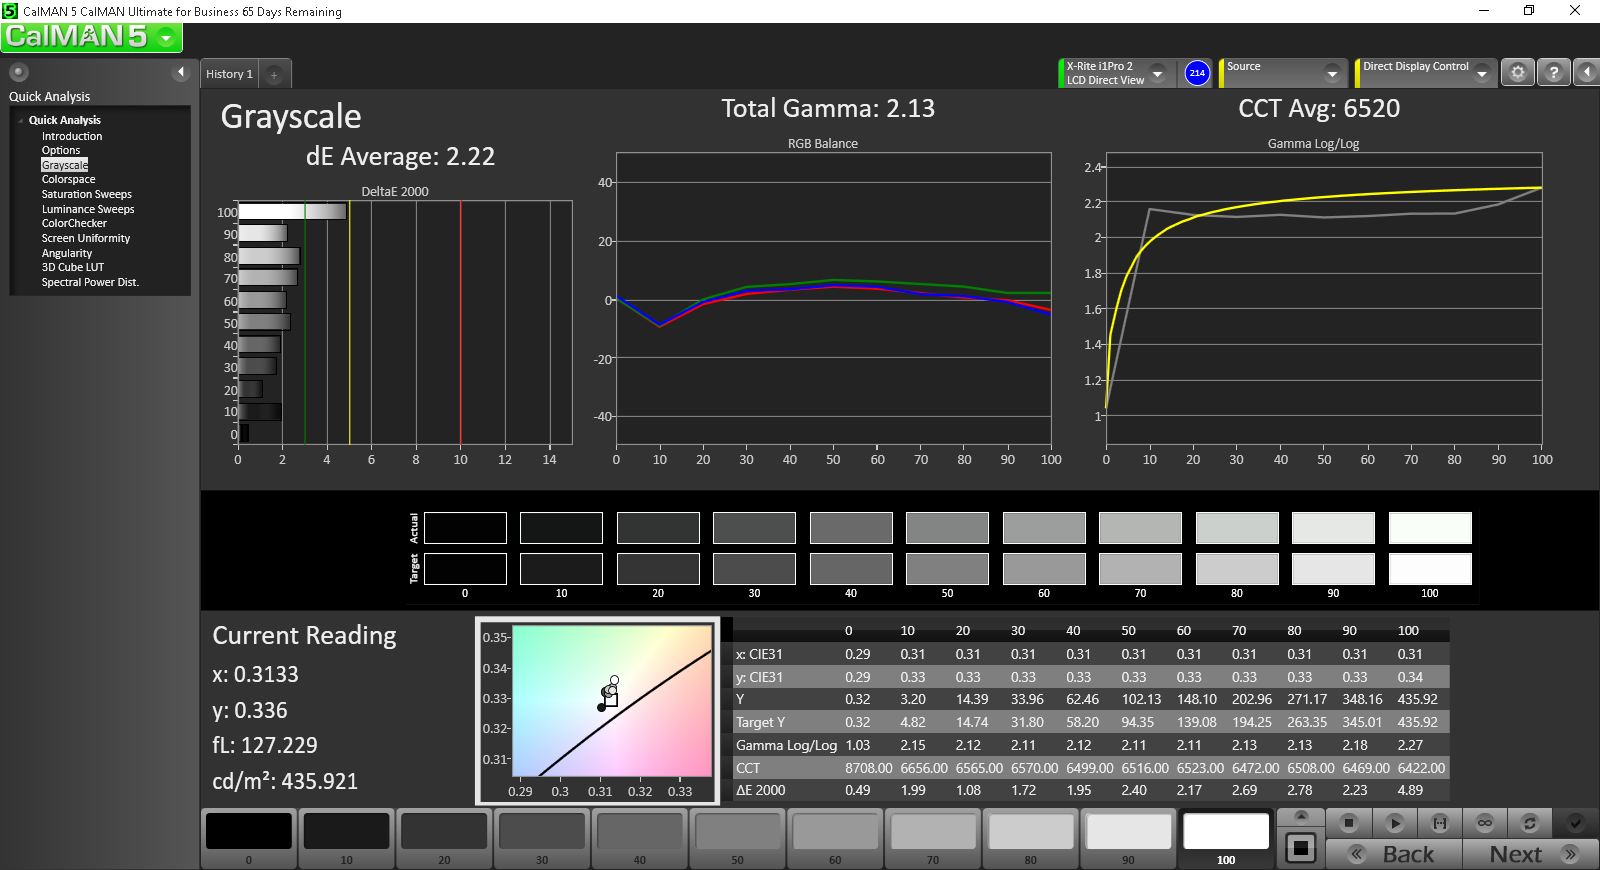
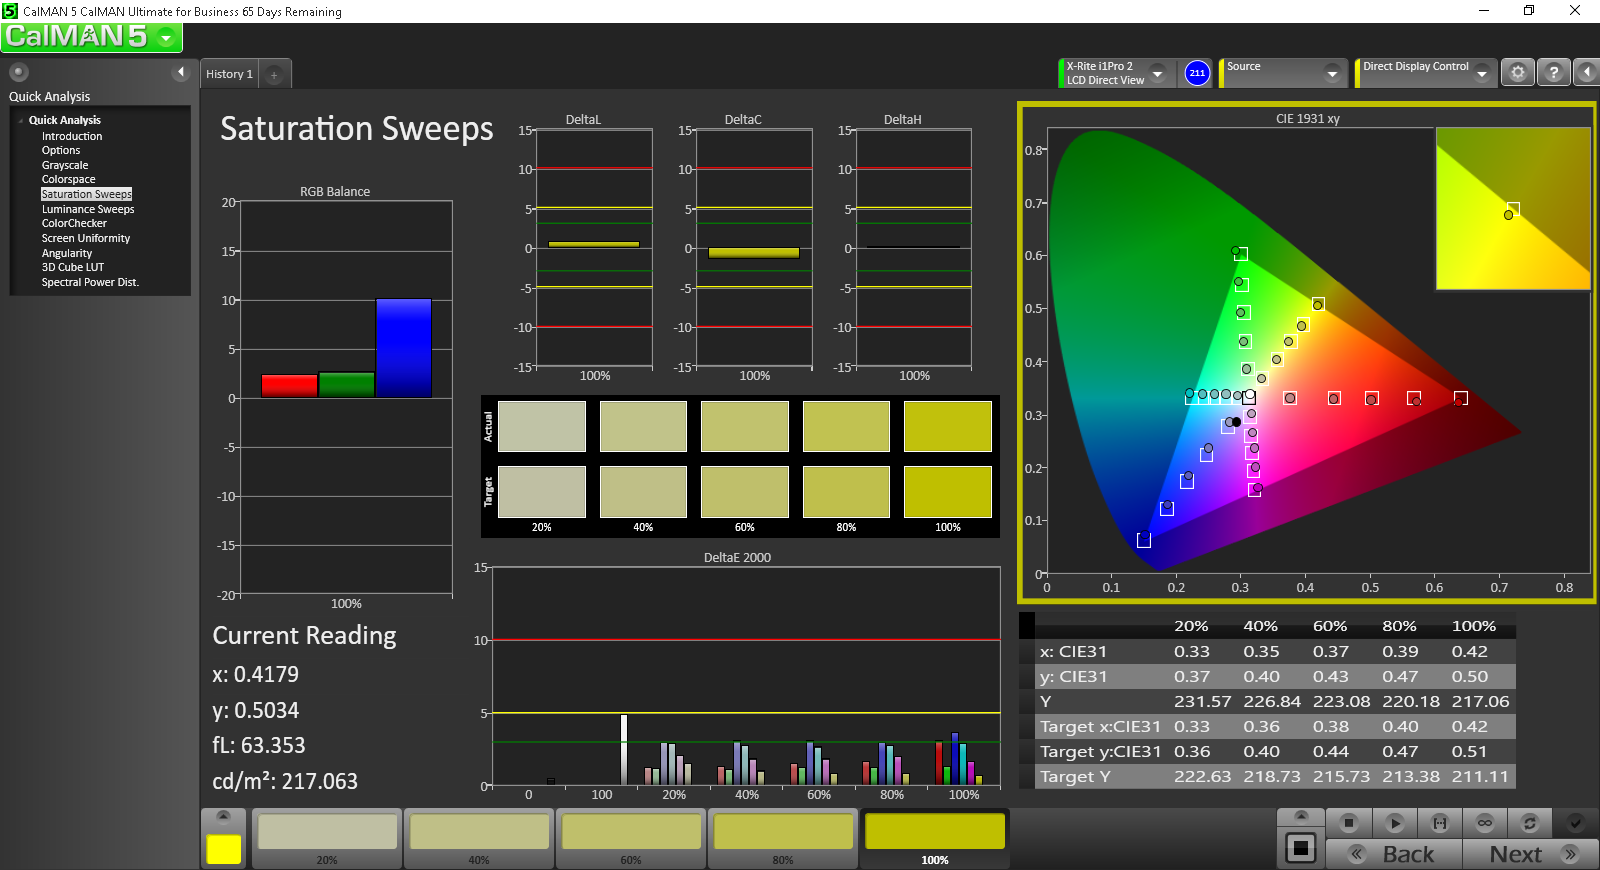
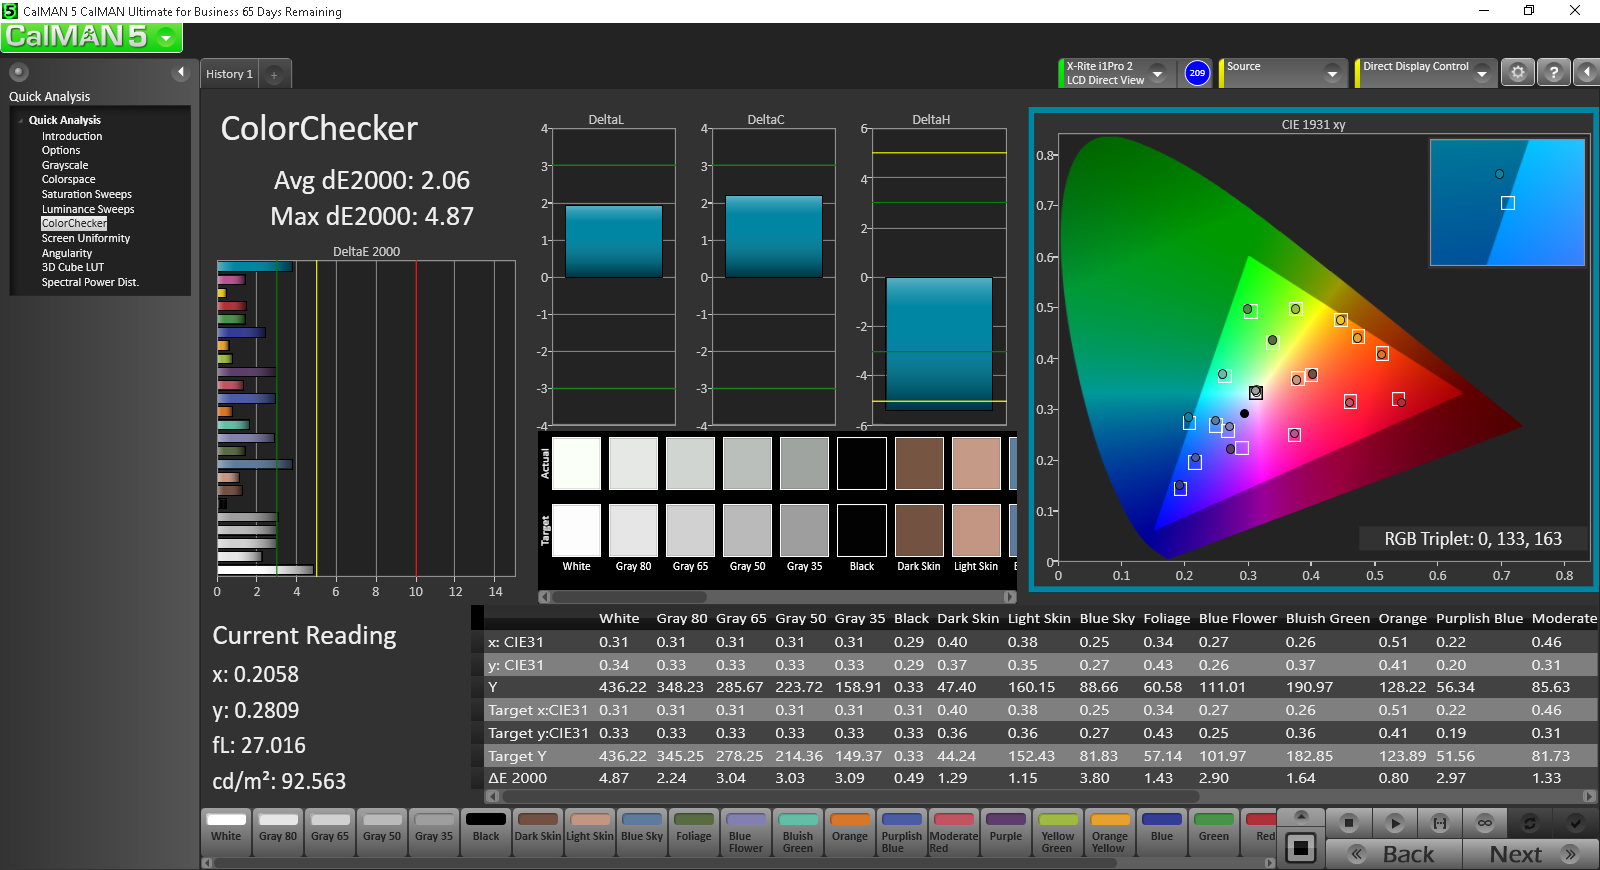
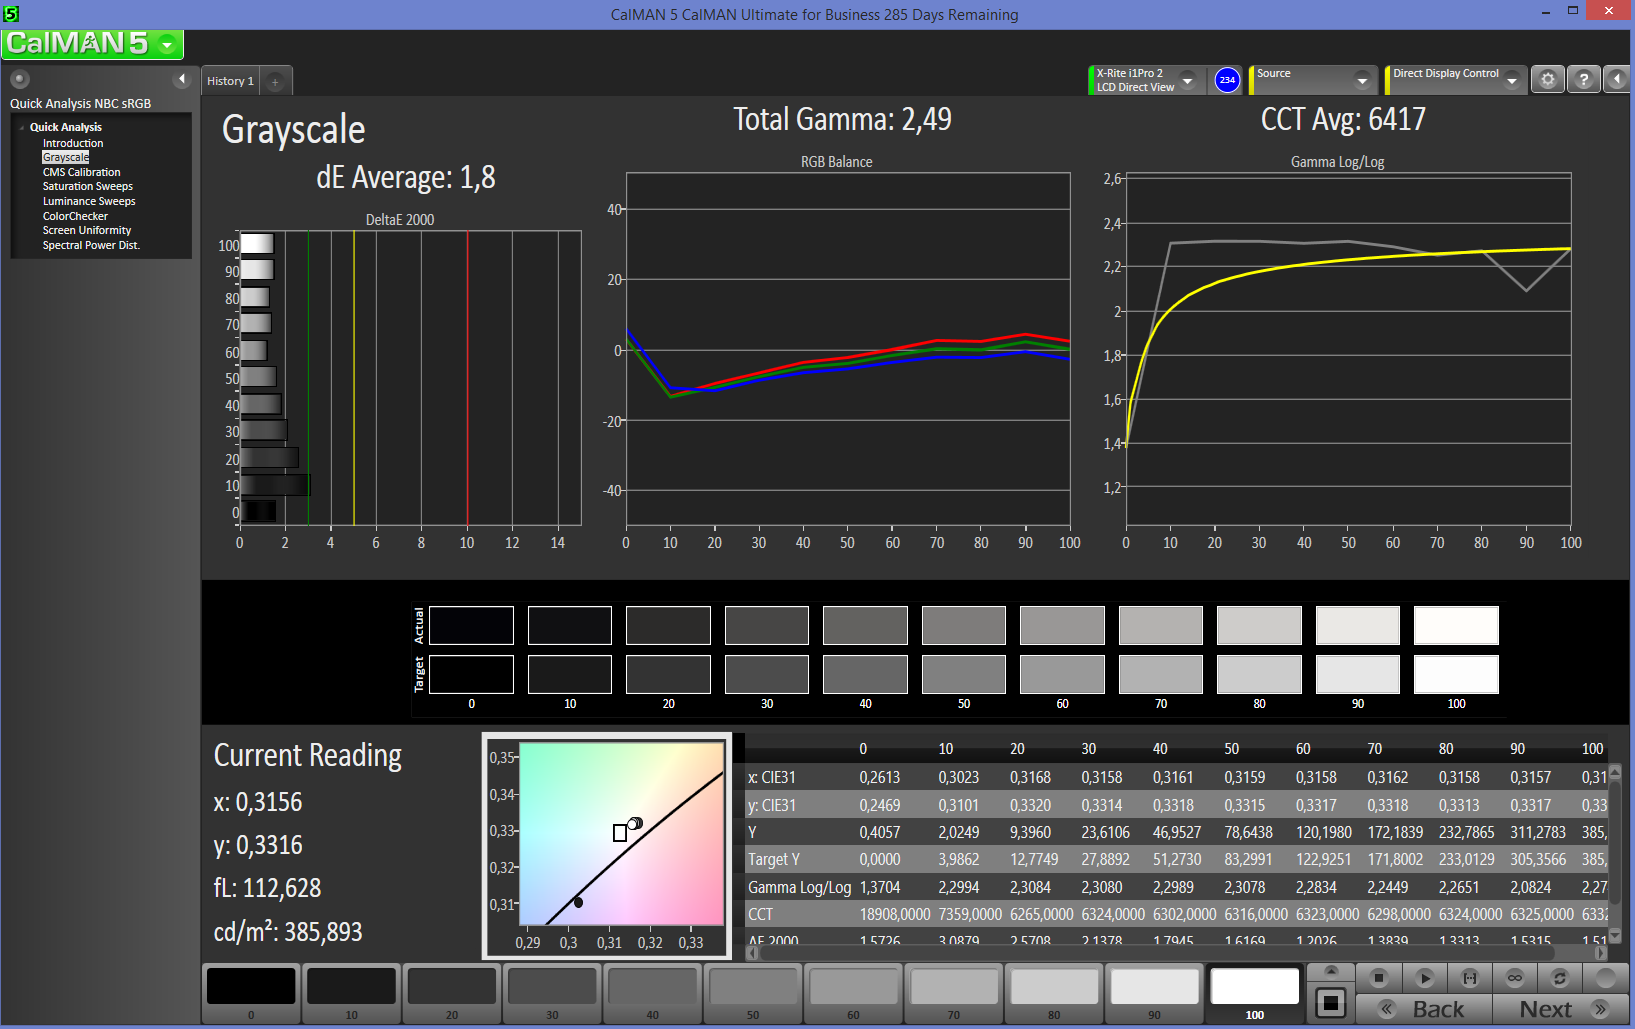
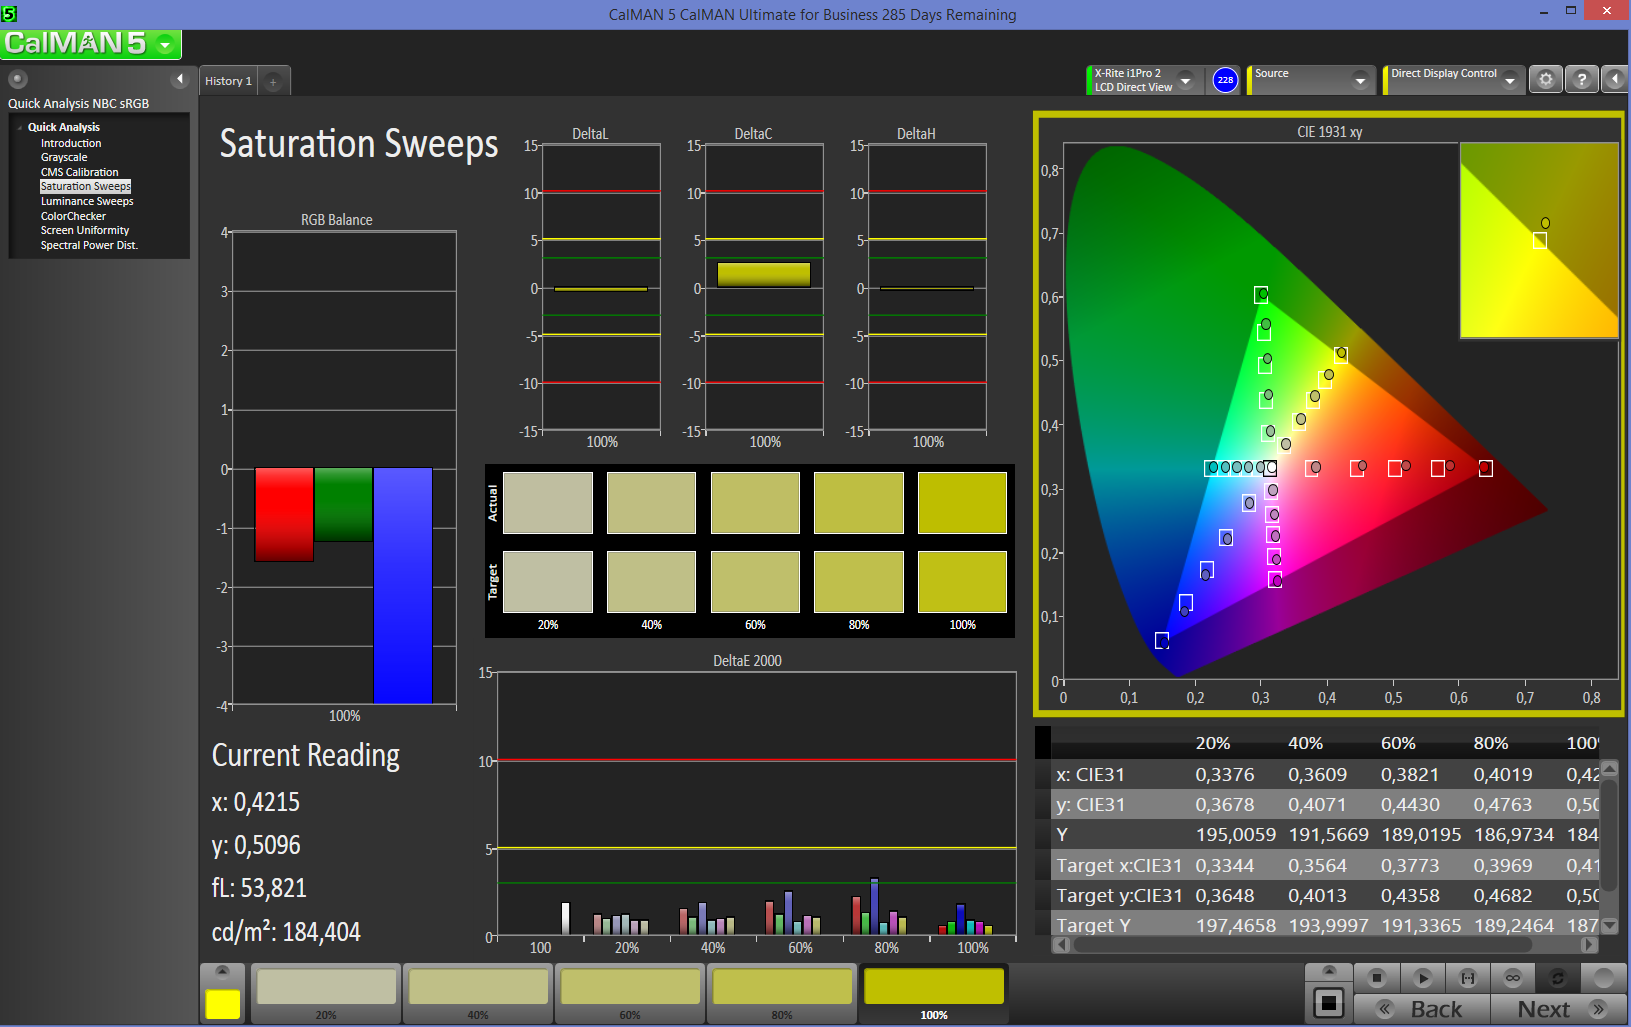
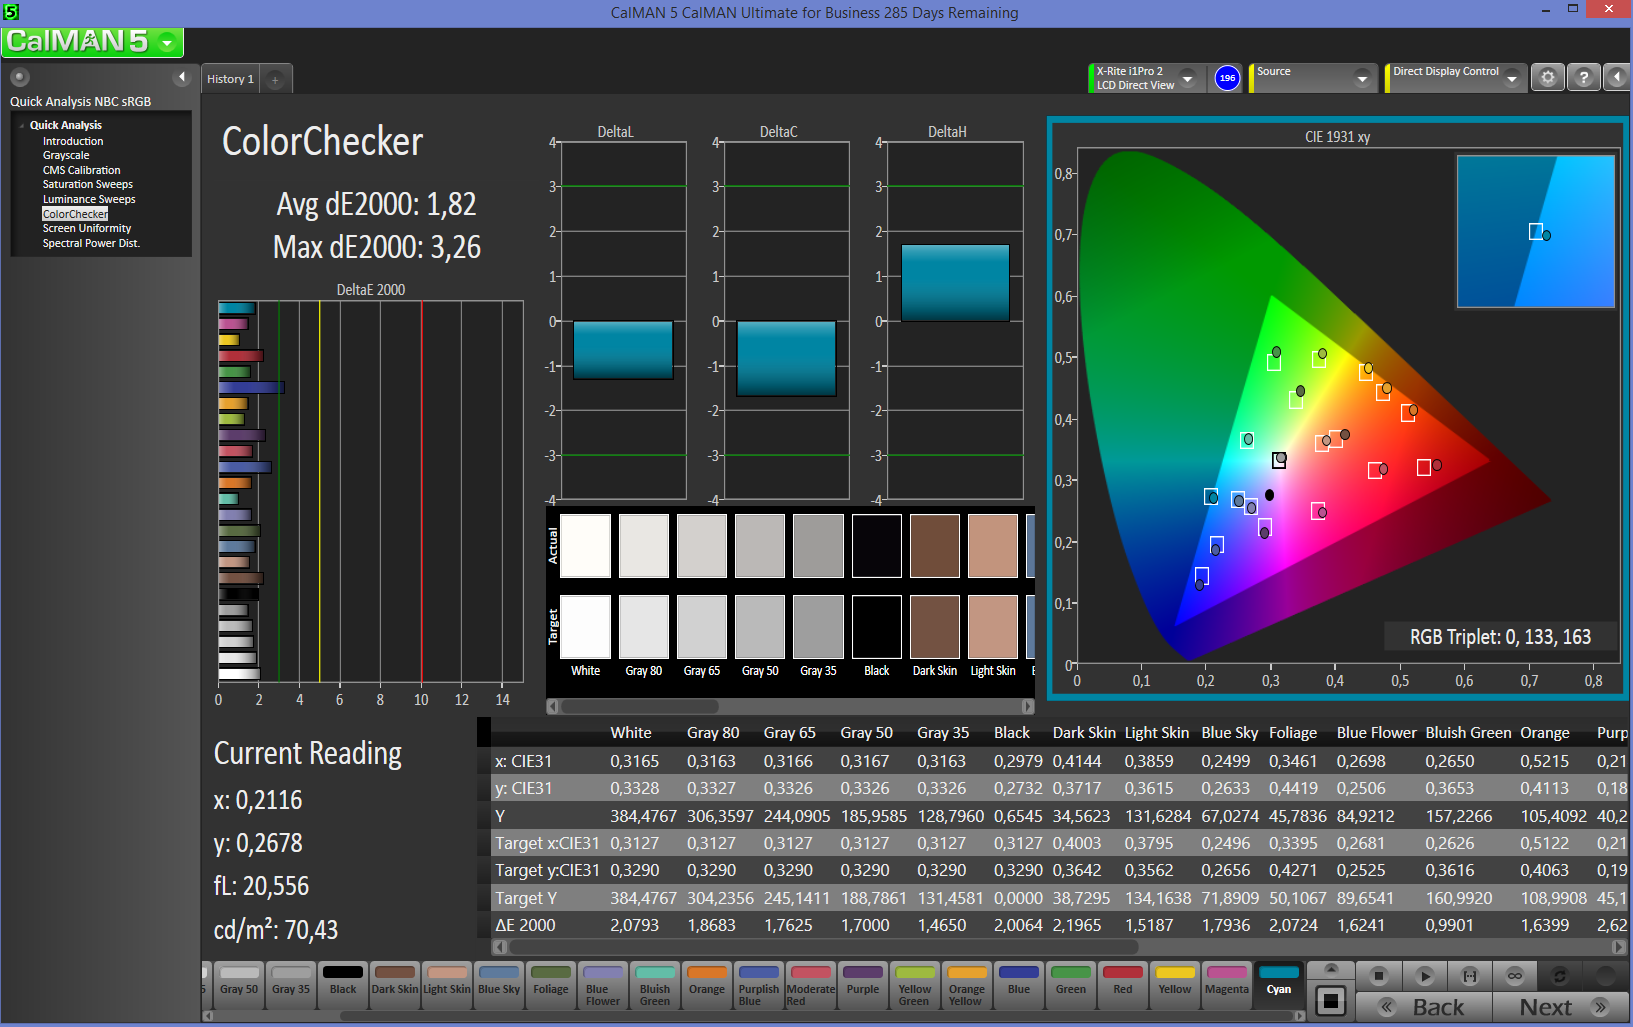
Aside from the obvious resolution and aspect ratio differences, the displays on all three notebooks are gorgeous and representative of their high starting prices. If we are to cherry pick the objectively better display, then it would be either the Surface Book or the MacBook. The former carries a brighter screen with deeper contrast while the latter carries more accurate colors without need of end-user calibration.
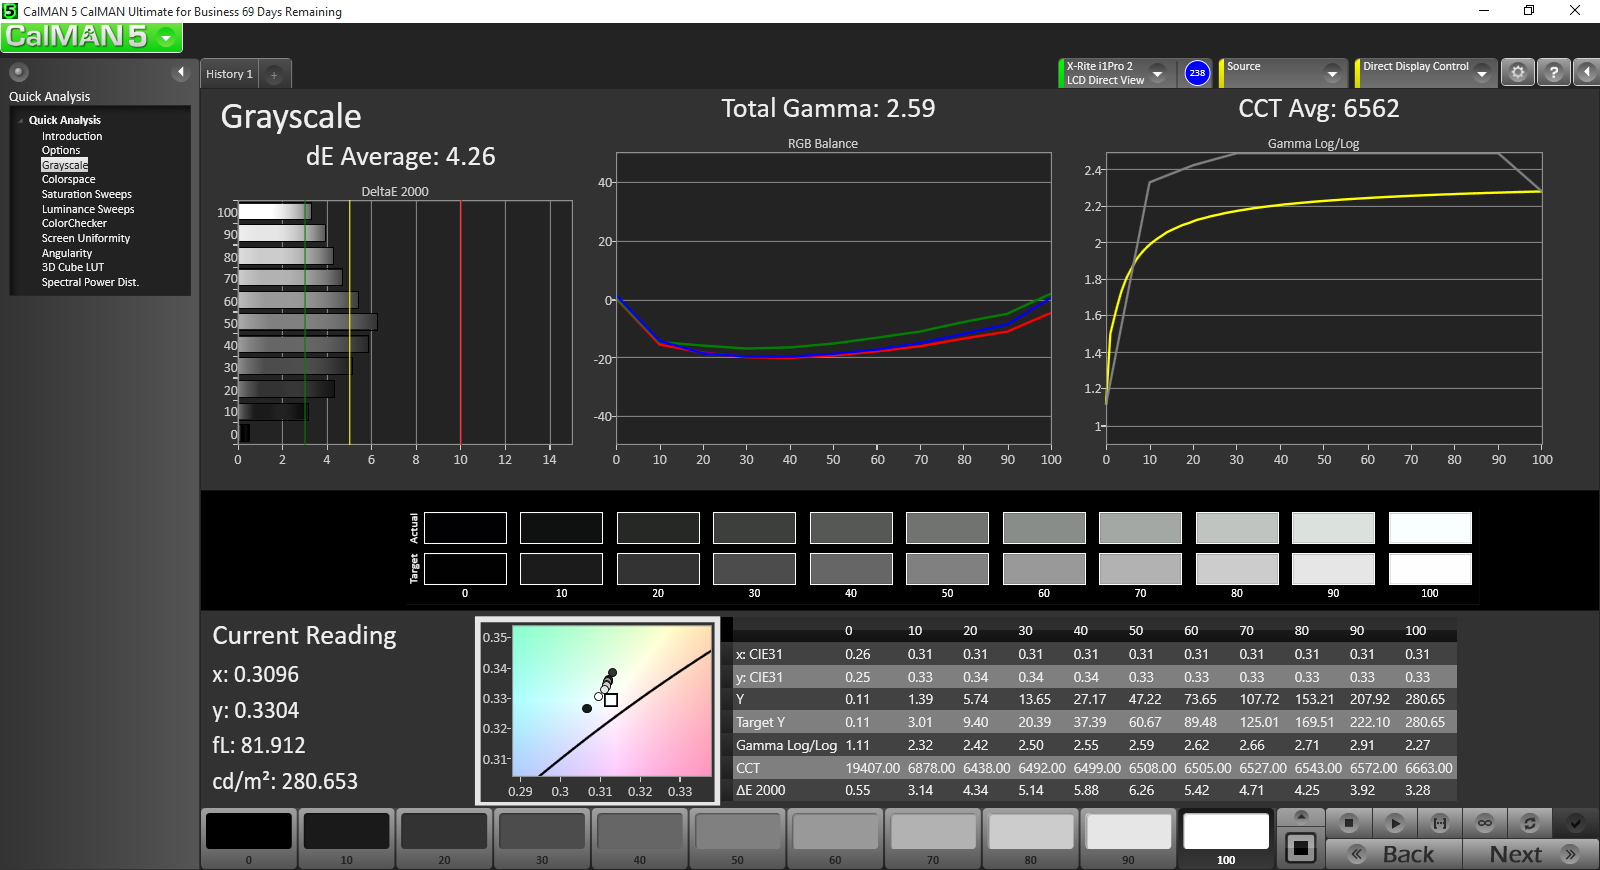
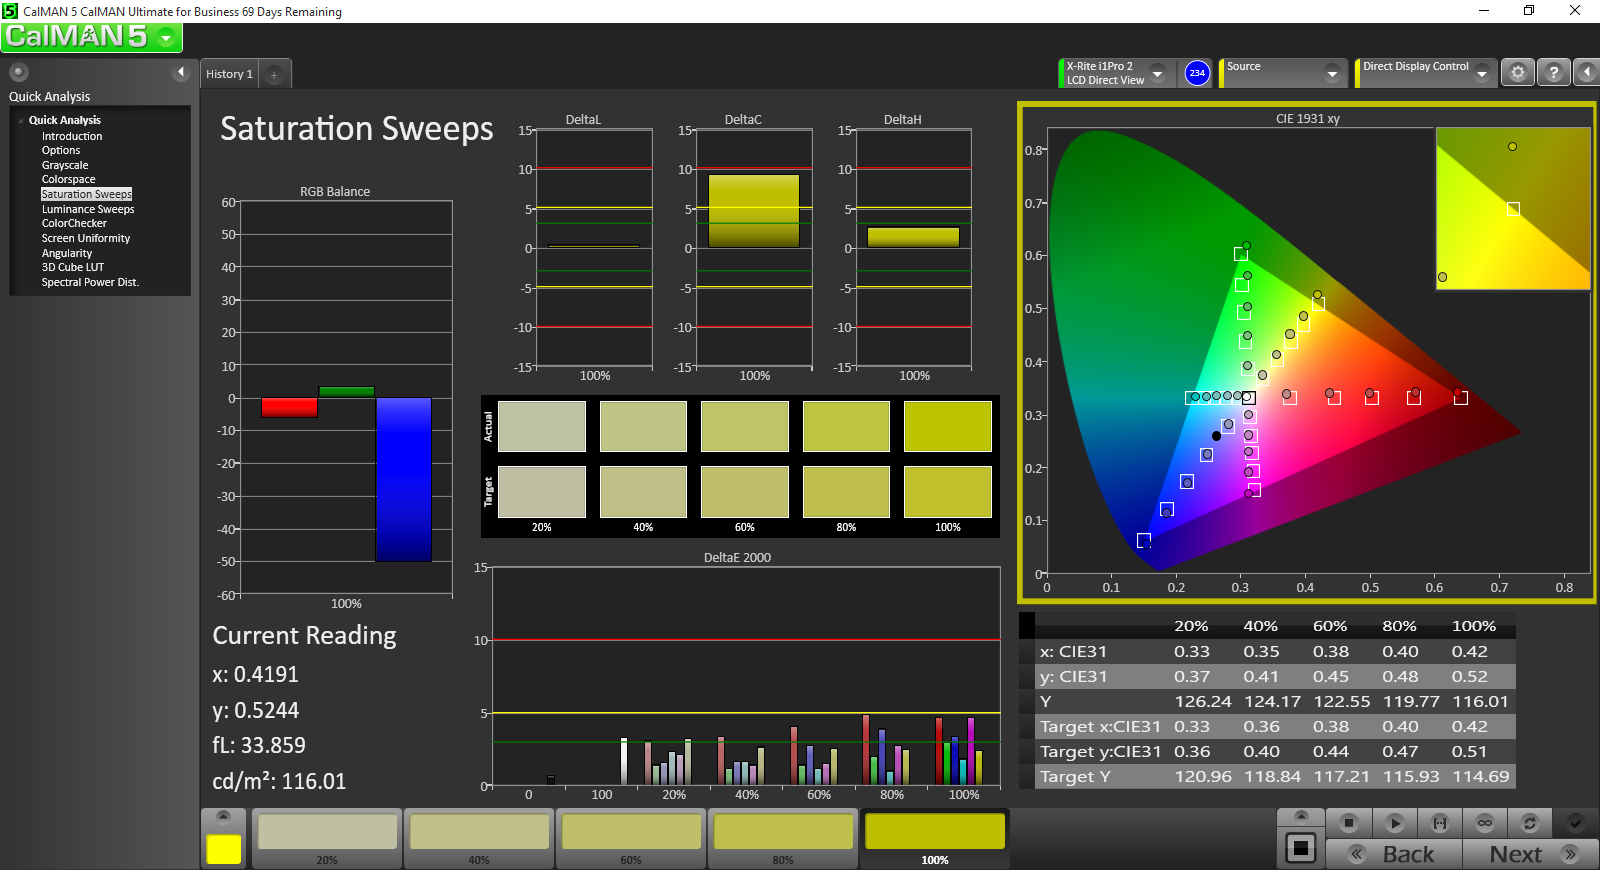
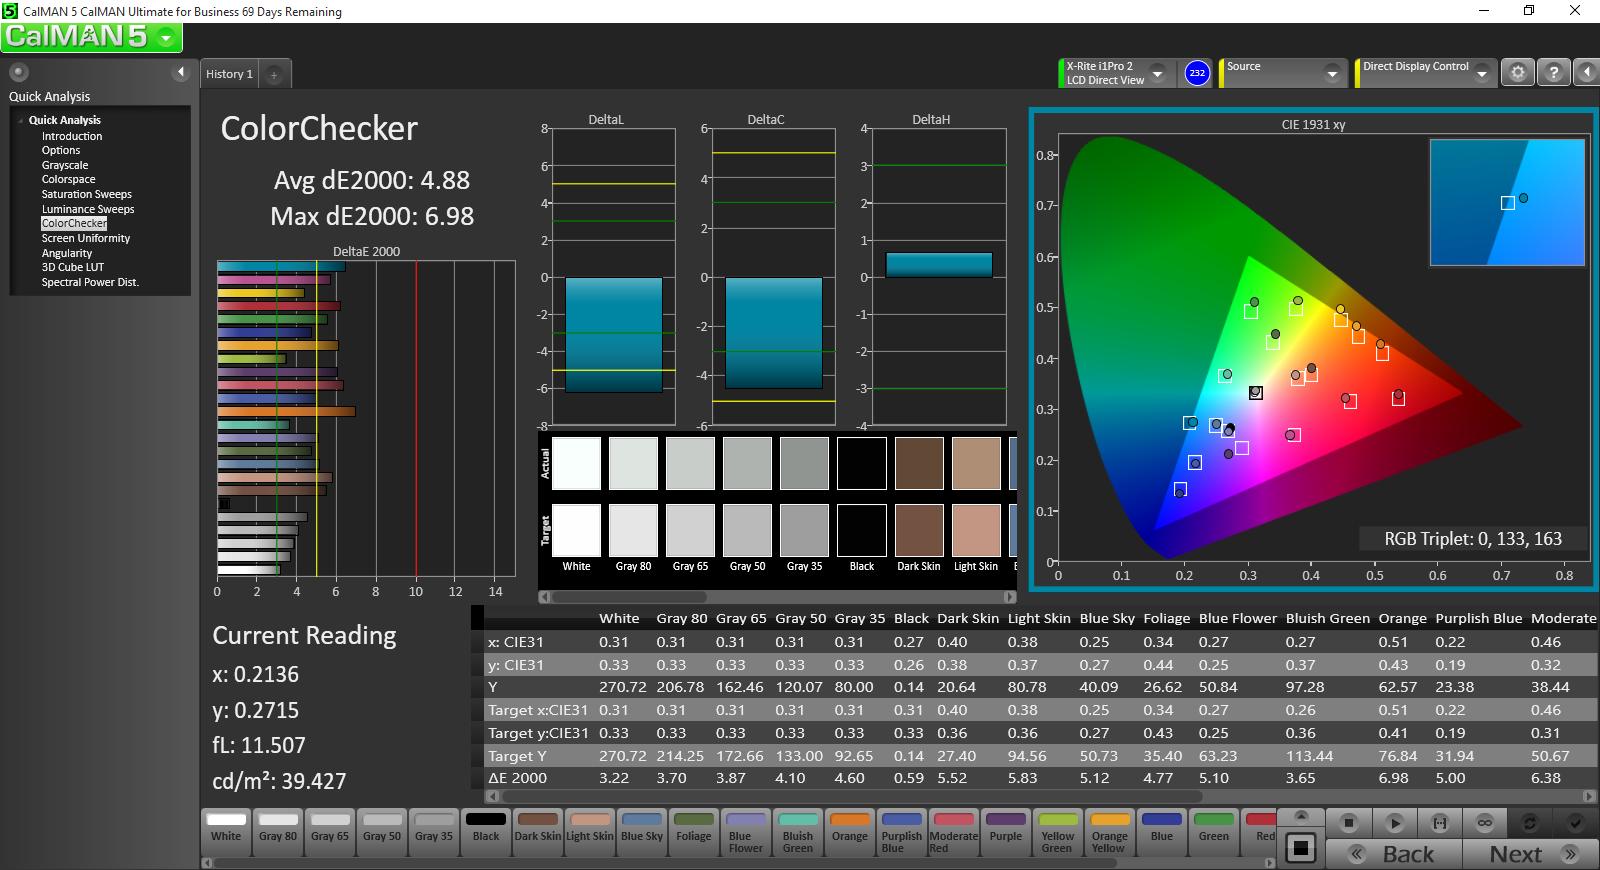
The XPS 13 sits in last place as its display is not nearly as bright despite the manufacturer's claim of 400 nits. Contrast is very good and users may prefer the matte panel, but colors are less accurate and gamut is significantly narrower than on the Surface Book or MacBook.
Winner: Tie -- Microsoft Surface Book
Apple MacBook Pro Retina 13

| Microsoft Surface Book | Dell XPS 13 InfinityEdge | Apple MacBook Pro Retina 13 | |
| Size | 13.5-inch IPS 3:2 | 13.3-inch IPS 16:9 | 13.3-inch IPS 16:10 |
| Native Resolution | 3000 x 2000 | 1920 x 1080 | 2560 x 1600 |
| Pixel Density | 267 PPI | 166 PPI | 227 PPI |
| Panel ID | Panasonic MEI96A2 | Sharp SHP1420 | Apple APPA02A |
| Panel | Glossy | Matte | Glossy |
| Microsoft Surface Book Core i5 | Dell XPS 13-9350 | Apple MacBook Pro Retina 13 inch 2015-03 | |
|---|---|---|---|
| Display | |||
| Display P3 Coverage (%) | 67 | 44.53 | 65.9 |
| sRGB Coverage (%) | 95.8 | 66.8 | 97 |
| AdobeRGB 1998 Coverage (%) | 68.9 | 45.97 | 67.4 |
| Response Times | |||
| Response Time Grey 50% / Grey 80% * (ms) | 48.4 ? | ||
| Response Time Black / White * (ms) | 32.8 ? | ||
| PWM Frequency (Hz) | |||
| Screen | |||
| Brightness middle (cd/m²) | 430.9 | 277.5 | 361 |
| Brightness (cd/m²) | 410 | 276 | 342 |
| Brightness Distribution (%) | 93 | 88 | 81 |
| Black Level * (cd/m²) | 0.254 | 0.191 | 0.361 |
| Contrast (:1) | 1696 | 1453 | 1000 |
| Colorchecker dE 2000 * | 2.06 | 4.88 | 1.82 |
| Greyscale dE 2000 * | 2.22 | 4.26 | 1.8 |
| Gamma | 2.13 103% | 2.59 85% | 2.49 88% |
| CCT | 6520 100% | 6562 99% | 6417 101% |
| Color Space (Percent of AdobeRGB 1998) (%) | 64 | 41.6 | 61.9 |
| Color Space (Percent of sRGB) (%) | 96 | 65.79 | 96.9 |
| Colorchecker dE 2000 max. * | 3.26 | ||
| Total Average (Program / Settings) |
* ... smaller is better
Performance
CPU Performance
Microsoft, Dell, and Apple all offer multiple CPU options beyond what we have here, so this comparison is only between the configurations on hand.
All three notebooks show strikingly similar raw CPU power despite the generation and TDP differences between the Broadwell core in the Apple and Skylake cores in the Surface and XPS 13. Apple still comes out marginally ahead due to its slightly faster Turbo Boost (3.1 GHz vs. 2.9 GHz and 2.8 GHz on the i5-6300U and i5-6200U, respectively). Home users will not notice any tangible advantages or disadvantages during everyday workloads.
See our dedicated CPU page on the i5-6200U, i5-6300U, and i5-5257U for more comparisons and benchmarks.
| Microsoft Surface Book | Dell XPS 13 InfinityEdge | Apple MacBook Pro Retina 13 | |
| CPU | 2.4 GHz Core i5-6300U | 2.3 GHz Core i5-6200U | 2.7 GHz Core i5-5257U |
| TDP | 15 W | 15 W | 28 W |
| RAM | 8 GB DDR3 1066.7 MHz, Dual-channel, Soldered | 8 GB LPDDR3 1867 MHz, Dual-channel, Soldered | 8 GB LPDDR3, Dual-channel, Soldered |
| GPU | Custom Nvidia GPU + Intel HD Graphics 520 | Intel HD Graphics 520 | Intel Iris Graphics 6100 |
| Cinebench R10 | |
| Rendering Single CPUs 64Bit (sort by value) | |
| Microsoft Surface Book Core i5 | |
| Dell XPS 13-9350 | |
| Apple MacBook Pro Retina 13 inch 2015-03 | |
| Rendering Multiple CPUs 64Bit (sort by value) | |
| Microsoft Surface Book Core i5 | |
| Dell XPS 13-9350 | |
| Apple MacBook Pro Retina 13 inch 2015-03 | |
| wPrime 2.10 | |
| 1024m (sort by value) | |
| Microsoft Surface Book Core i5 | |
| Dell XPS 13-9350 | |
| 32m (sort by value) | |
| Microsoft Surface Book Core i5 | |
| Dell XPS 13-9350 | |
| Super Pi Mod 1.5 XS 32M - 32M (sort by value) | |
| Microsoft Surface Book Core i5 | |
| Dell XPS 13-9350 | |
| Apple MacBook Pro Retina 13 inch 2015-03 | |
| 3DMark | |
| 1280x720 offscreen Ice Storm Unlimited Physics (sort by value) | |
| Microsoft Surface Book Core i5 | |
| Apple MacBook Pro Retina 13 inch 2015-03 | |
| 1920x1080 Ice Storm Extreme Physics (sort by value) | |
| Microsoft Surface Book Core i5 | |
| Apple MacBook Pro Retina 13 inch 2015-03 | |
| 1280x720 Cloud Gate Standard Physics (sort by value) | |
| Microsoft Surface Book Core i5 | |
| Dell XPS 13-9350 | |
| Apple MacBook Pro Retina 13 inch 2015-03 | |
| 1920x1080 Fire Strike Physics (sort by value) | |
| Microsoft Surface Book Core i5 | |
| Dell XPS 13-9350 | |
| Apple MacBook Pro Retina 13 inch 2015-03 | |
| Fire Strike Extreme Physics (sort by value) | |
| Microsoft Surface Book Core i5 | |
| Apple MacBook Pro Retina 13 inch 2015-03 | |
| PCMark 8 | |
| Storage Score (sort by value) | |
| Microsoft Surface Book Core i5 | |
| Dell XPS 13-9350 | |
| Apple MacBook Pro Retina 13 inch 2015-03 | |
| Work Score Accelerated v2 (sort by value) | |
| Microsoft Surface Book Core i5 | |
| Dell XPS 13-9350 | |
| Apple MacBook Pro Retina 13 inch 2015-03 | |
| Creative Score Accelerated v2 (sort by value) | |
| Microsoft Surface Book Core i5 | |
| Dell XPS 13-9350 | |
| Apple MacBook Pro Retina 13 inch 2015-03 | |
| Home Score Accelerated v2 (sort by value) | |
| Microsoft Surface Book Core i5 | |
| Dell XPS 13-9350 | |
| Apple MacBook Pro Retina 13 inch 2015-03 | |
* ... smaller is better
GPU Performance
Unlike the nearly identical CPUs, Microsoft has the clear lead in graphics performance. Its customized Nvidia Maxwell CPU is essentially a GeForce GT 940M for a healthy 30 percent advantage over the Iris Graphics 6100 and 40 percent advantage over the HD Graphics 520 according to 3DMark 11.
Dell loses this round as the Iris Graphics is roughly 20 percent faster in 3DMark 11 and 10 percent faster in 3DMark Fire Strike.
| 3DMark 11 - 1280x720 Performance GPU (sort by value) | |
| Microsoft Surface Book Core i5 | |
| Dell XPS 13-9350 | |
| Apple MacBook Pro Retina 13 inch 2015-03 | |
| 3DMark | |
| 1280x720 offscreen Ice Storm Unlimited Graphics Score (sort by value) | |
| Microsoft Surface Book Core i5 | |
| Apple MacBook Pro Retina 13 inch 2015-03 | |
| 1920x1080 Ice Storm Extreme Graphics (sort by value) | |
| Microsoft Surface Book Core i5 | |
| Apple MacBook Pro Retina 13 inch 2015-03 | |
| 1280x720 Cloud Gate Standard Graphics (sort by value) | |
| Microsoft Surface Book Core i5 | |
| Dell XPS 13-9350 | |
| Apple MacBook Pro Retina 13 inch 2015-03 | |
| 1920x1080 Fire Strike Graphics (sort by value) | |
| Microsoft Surface Book Core i5 | |
| Dell XPS 13-9350 | |
| Apple MacBook Pro Retina 13 inch 2015-03 | |
| Fire Strike Extreme Graphics (sort by value) | |
| Microsoft Surface Book Core i5 | |
| Apple MacBook Pro Retina 13 inch 2015-03 | |
| Cinebench R11.5 - OpenGL 64Bit (sort by value) | |
| Microsoft Surface Book Core i5 | |
| Dell XPS 13-9350 | |
| Apple MacBook Pro Retina 13 inch 2015-03 | |
| Apple MacBook Pro Retina 13 inch 2015-03 | |
| Cinebench R15 - OpenGL 64Bit (sort by value) | |
| Microsoft Surface Book Core i5 | |
| Dell XPS 13-9350 | |
| Apple MacBook Pro Retina 13 inch 2015-03 | |
Gaming Performance
The MacBook's Intel Iris consistently outperforms the HD 520 in synthetic benchmarks. In real-world gaming, however, the difference is much more marginal according to our single test with Bioshock Infinite. Meanwhile, the dedicated Nvidia GPU in the Surface Book far exceeds both to provide the better gaming experience.
See our dedicated GPU pages for the Surface Book GPU, HD 520, and Iris Pro 6100 for more comparisons and benchmarks.
| BioShock Infinite | |
| 1920x1080 Ultra Preset, DX11 (DDOF) (sort by value) | |
| Microsoft Surface Book Core i5 | |
| Dell XPS 13-9350 | |
| Apple MacBook Pro Retina 13 inch 2015-03 | |
| 1366x768 High Preset (sort by value) | |
| Microsoft Surface Book Core i5 | |
| Dell XPS 13-9350 | |
| Apple MacBook Pro Retina 13 inch 2015-03 | |
| 1366x768 Medium Preset (sort by value) | |
| Microsoft Surface Book Core i5 | |
| Dell XPS 13-9350 | |
| Apple MacBook Pro Retina 13 inch 2015-03 | |
| 1280x720 Very Low Preset (sort by value) | |
| Microsoft Surface Book Core i5 | |
| Dell XPS 13-9350 | |
| Apple MacBook Pro Retina 13 inch 2015-03 | |
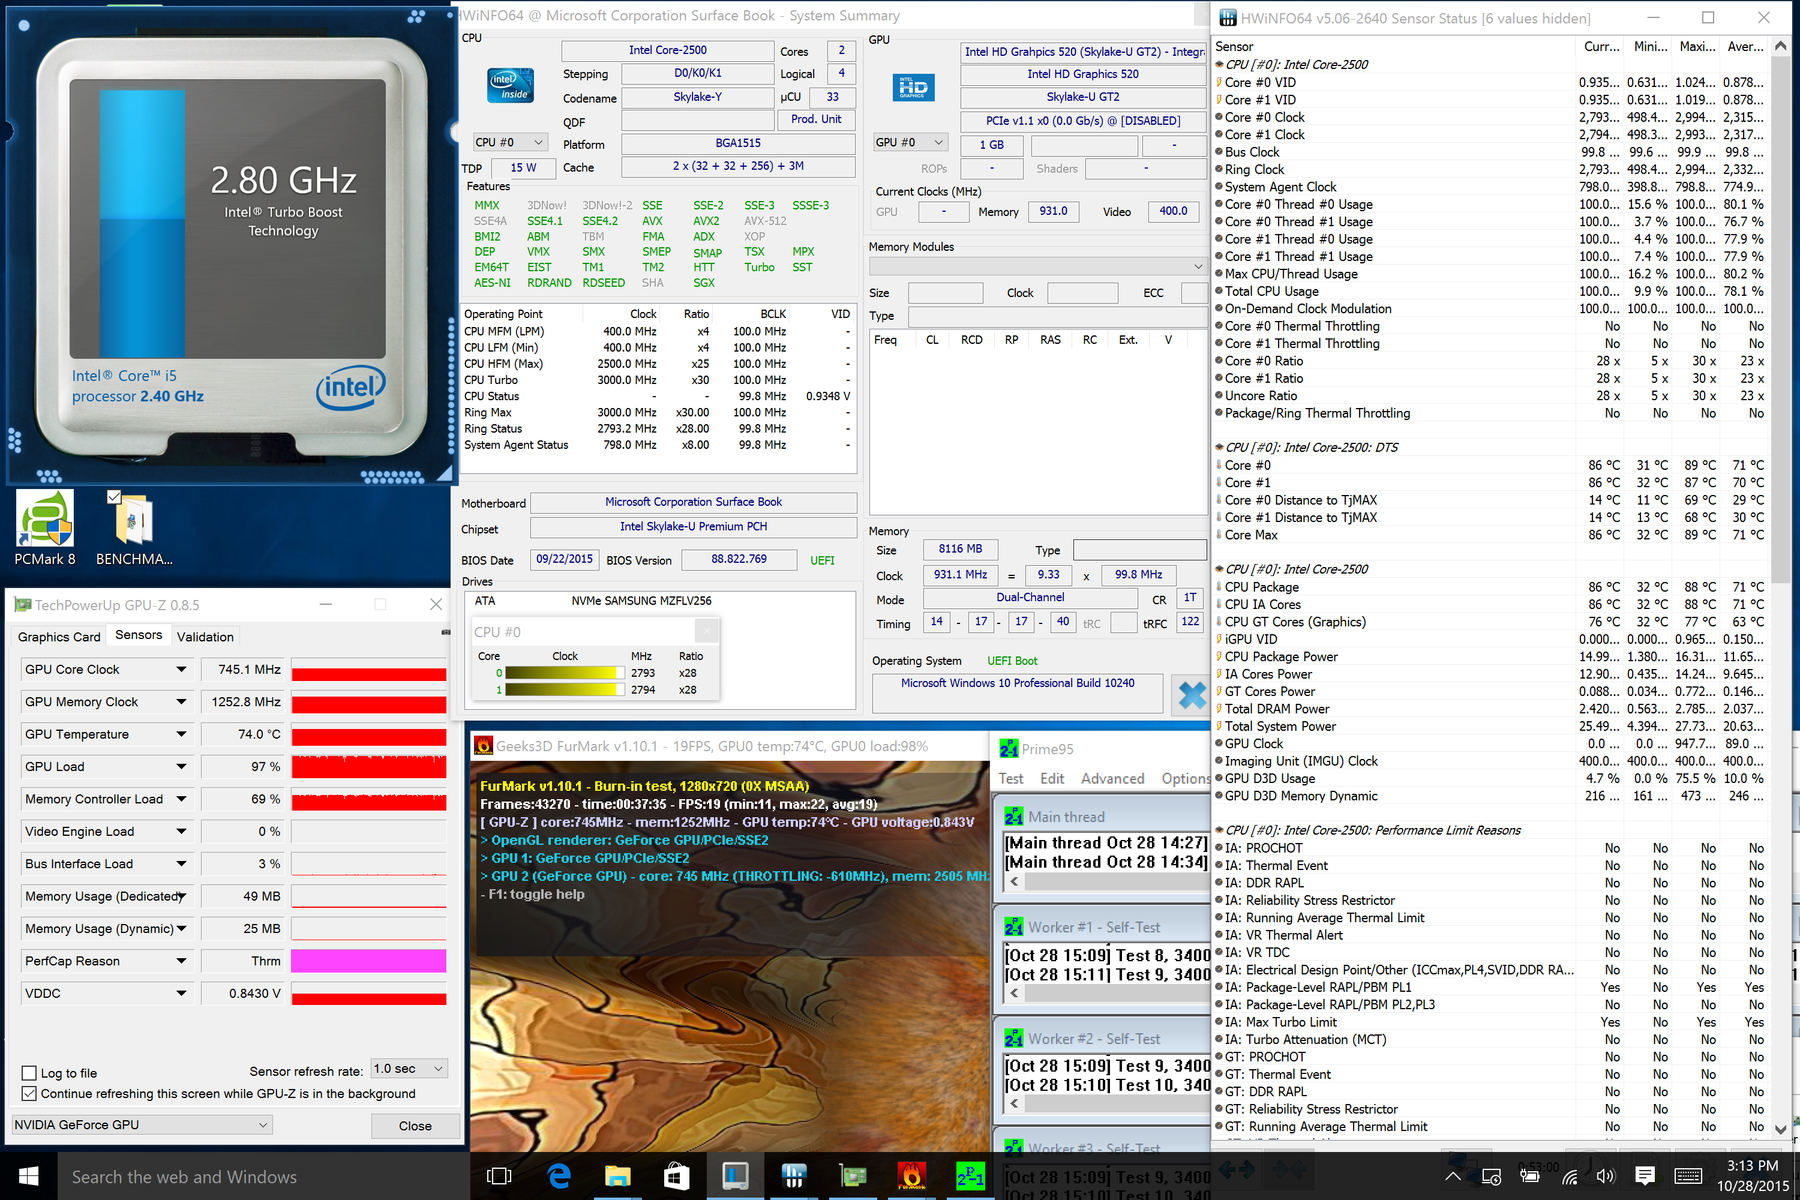
Stress Test
To test system stability, we run both Prime95 and FurMark to simulate maximum stress. These unrealistic conditions do not represent daily workloads, but are instead meant to put both the CPU and GPU at 100 percent capacity.
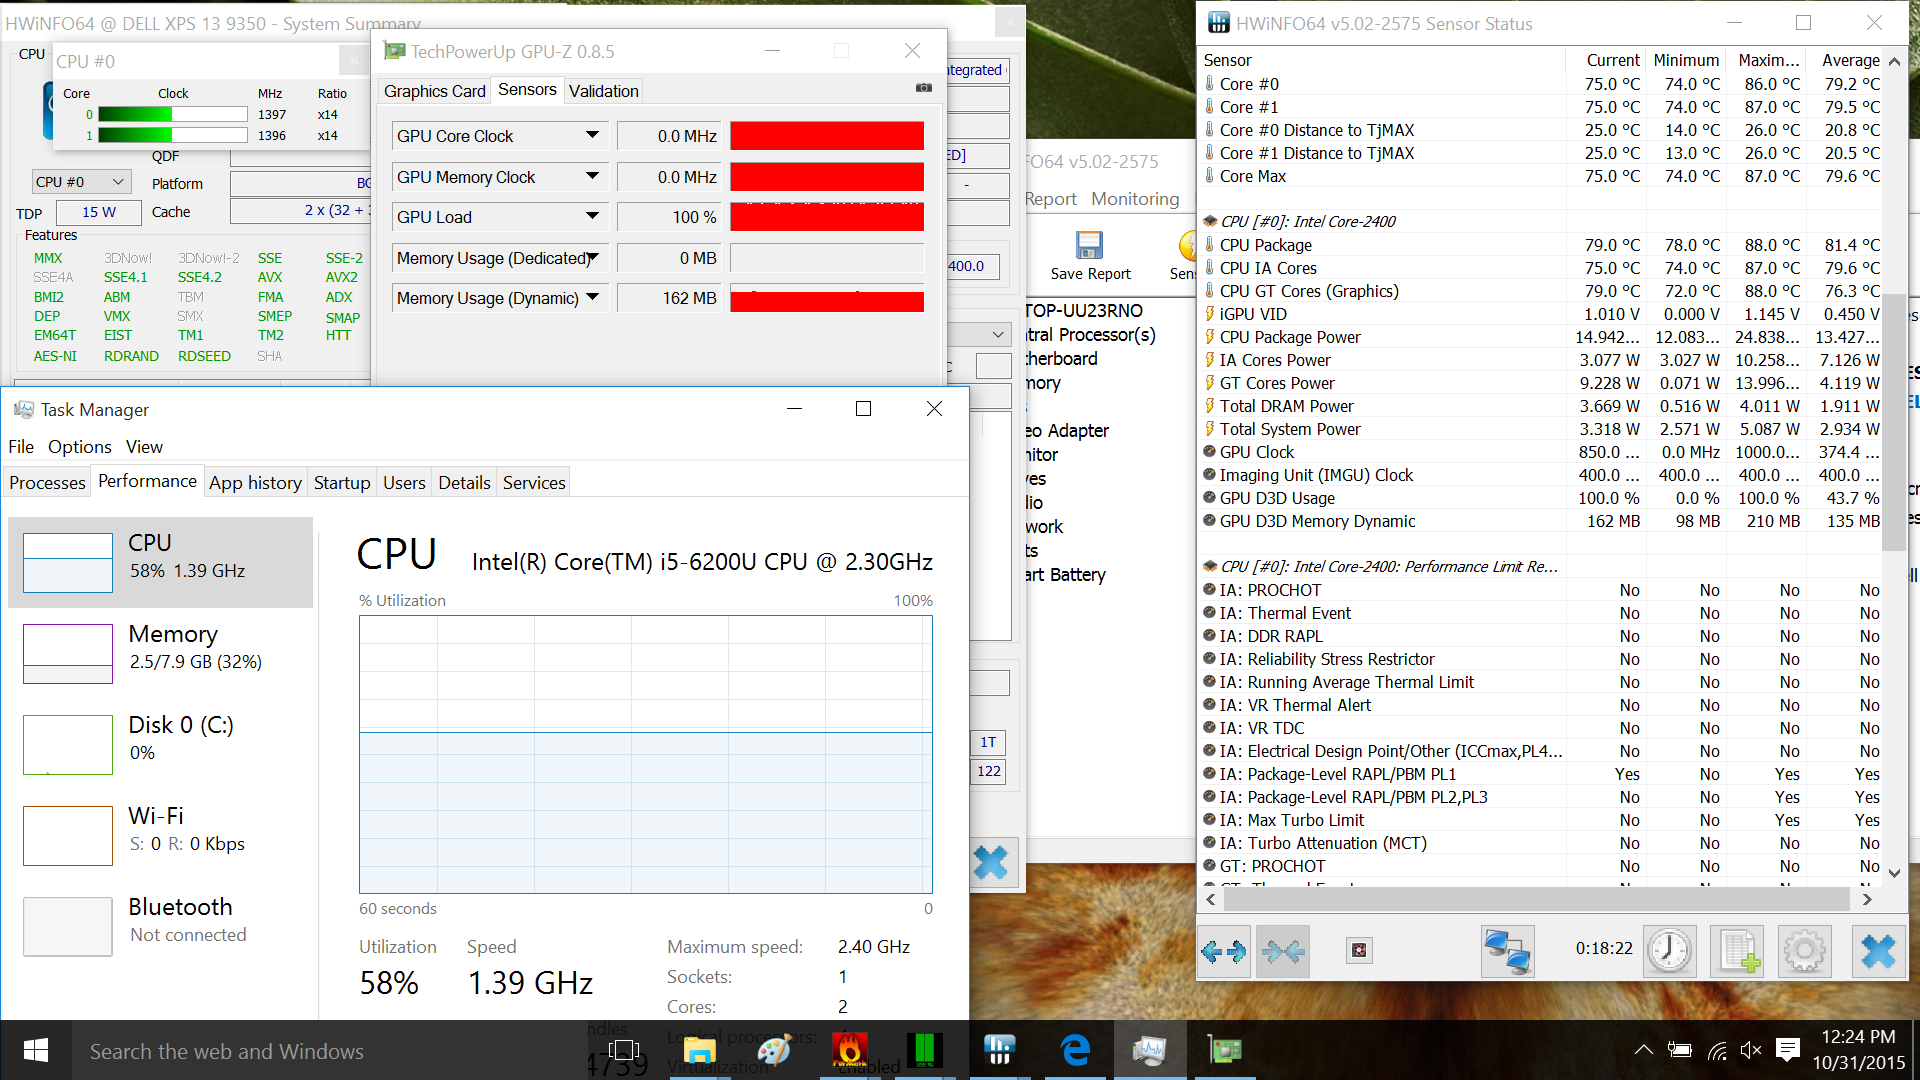
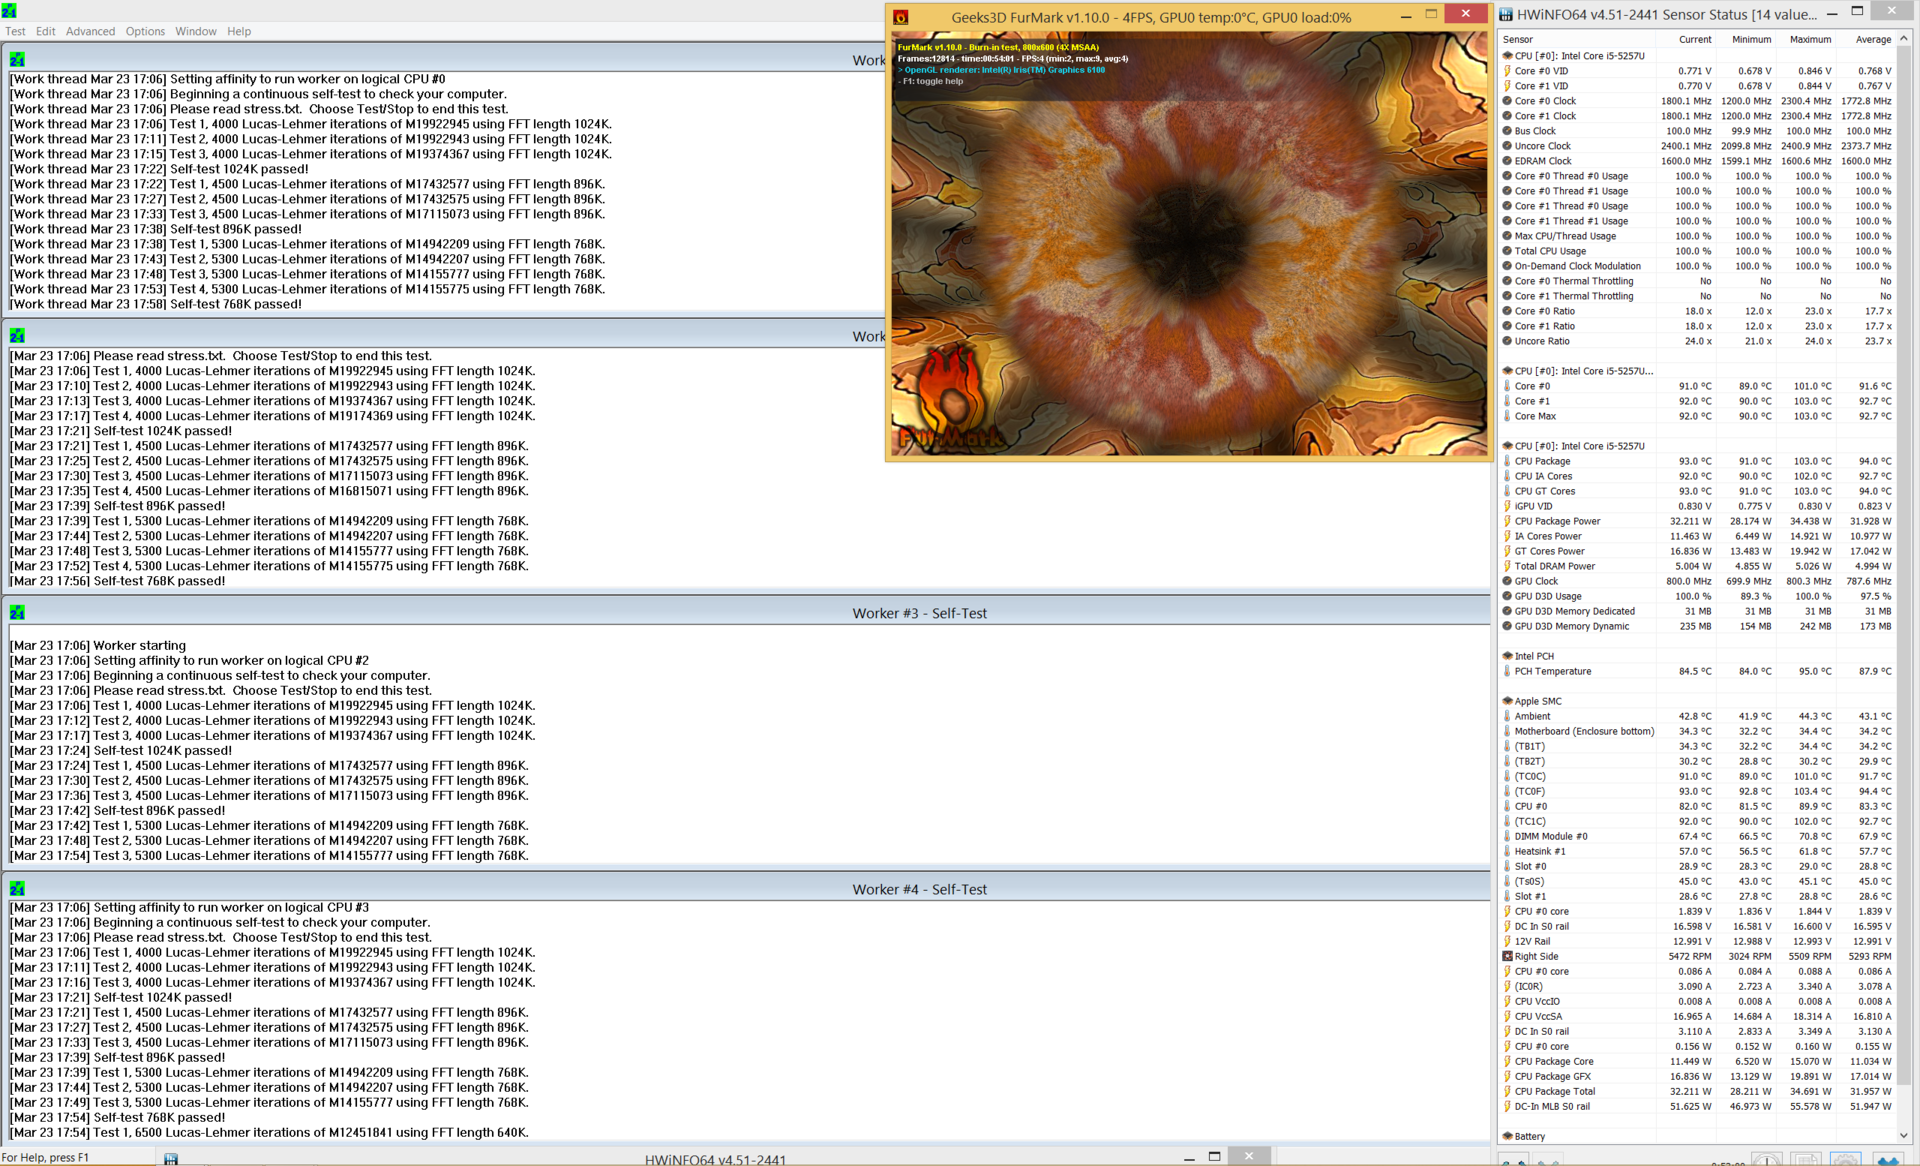
First, the Surface Book performs very well under stress. The CPU is able to maintain Turbo Boost while the GPU stabilizes at just below its base clock rate. Comparatively, the Dell and Apple notebooks will significantly throttle their CPUs down to 1.4 GHz and 1.8 GHz, respectively, which are far below their base clock rates. GPU clock rates hold up quite well in comparison, so the CPUs are taking the brunt of the throttling on the Dell and Apple.
CPU temperature in the MacBook reaches an alarmingly high >100 C compared to just 87 C and 89 C on the Dell and Surface Book, respectively.
Winner: Microsoft Surface Book
| Microsoft Surface Book | Dell XPS 13 InfinityEdge | Apple MacBook Pro Retina 13 | |
| Rated GPU Core Clock (MHz) | 954 | 300 | 300 - 1050 |
| Stable GPU Core Clock on FurMark (MHz) | 745 - 823 | 850 | 800 |
| Rated CPU Core Clock (GHz) | 2.4 | 2.3 | 2.7 |
| Stable CPU Core Clock on Prime95 (GHz) | 2.8 - 2.9 | 1.4 | 1.8 |
| Maximum CPU temperature | 89 C | 87 C | 90 - 100 C |
| Maximum GPU temperature | 76 C | -- | -- |
Emissions
System Noise & Temperature
Fan noise is essentially non-existent on all three models during low processing loads. The Dell notebook in particular is very quiet even under extreme loads at just over 30 dB(A) compared to >40 db(A) on both the Surface Book and MacBook. Fan speed on the Microsoft and Apple notebooks will pick up much more quickly during 3D applications.
Surface temperatures are surprisingly similar between the notebooks when idling and under load. We were able to measure a temperature of about 45 C on the bottom base of each notebook when under high processing loads. The keyboard on the XPS 13 will become warmer than on the Surface Book or MacBook during moderate-to-heavy use. In general, however, it's impressive how the Dell notebook can manage similar surface temperatures despite its lower fan noise and smaller size. The Surface Book GPU is completely split from the main CPU motherboard for a wider heat spread.
Winner: Dell XPS 13 InfinityEdge
| Microsoft Surface Book | Dell XPS 13 InfinityEdge | Apple MacBook Pro Retina 13 | |
| Fan Noise when idling | 29.6 dB(A) | 28.3 dB(A) | 29.0 dB(A) |
| Fan Noise under high loads | 37.5 - 40.9 dB(A) | 30.2 dB(A) | 42 - 45 dB(A) |
| Average surface temperature when idling | 23.8 C (Keyboard base) | 27.3 C | 27.6 C |
| Average surface temperature under high loads | 33.3 C (Keyboard base) | 34.3 C | 33.8 C |
| Ambient temperature | 20.5 C | 20.5 C | 20.0 C |
Battery Life
Runtimes are generally shorter on the Surface Book even with the keyboard dock attached. This may simply be due to the lack of Optimus as the dGPU is automatically activated when connected. The MacBook has the larger battery capacity and consequently longer runtimes under WLAN load. Battery life under maximum load, however, is shorter due in part to the more demanding CPU.
The data below is represented in minutes before automatic shutdown.
Winner: Apple MacBook Pro Retina 13
| Microsoft Surface Book Core i5 69 Wh | Dell XPS 13-9350 56 Wh | Apple MacBook Pro Retina 13 inch 2015-03 75 Wh | |
|---|---|---|---|
| Battery runtime | |||
| Reader / Idle (h) | 17.8 | 13 | 28.2 |
| WiFi v1.3 (h) | 6.7 | 7.5 | 9 |
| Load (h) | 2.6 | 2.5 | 1.6 |
Verdict
The pros and cons of each notebook do not necessarily overlap one another, so we cannot objectively suggest one model over the other. The XPS 13 has the substantial weight and size advantages, but we're a bit disappointed that display brightness is not as high as the manufacturer is claiming for our 1080p SKU. The unique Surface Book is attractive for its 2-in-1 functionality and provides surprisingly strong performance for a detachable, though its limited connectivity options make it less flexible than what one would expect. The 3:2 aspect ratio may not be optimal for everyone, either.
The Apple MacBook gets all the core basics done right from its bright display and accurate colors to its full-size HDMI port and longer runtimes. While it's far from being too large or heavy, the XPS 13 offers USB 3.1 Type-C with Thunderbolt 3 in a much smaller package. With build quality and longevity not divisive factors between these notebooks, we believe that users can comfortably choose between the three based on user preferences.
| Microsoft Surface Book | Dell XPS 13 InfinityEdge | Apple MacBook Pro Retina 13 |
|---|---|---|
+ Aluminum alloy chassis; Excellent build quality + Detachable with Surface Pen + Good performance under stress + Discrete Nvidia GPU option | + Aluminum alloy and carbon fiber chassis; Excellent build quality + Much lighter with a smaller footprint + Matte display options + USB 3.1 Type-C Gen. 2 with Thunderbolt 3 + Lower fan noise + Upgradeable M.2 SSD | + Aluminum alloy chassis; Excellent build quality + Bright display with more accurate colors + Force Touch trackpad + HDMI and dual Thunderbolt 2 ports + Longer battery life + Upgradeable M.2 SSD |
- Heavier - Thicker - Fewer connectivity options - Poor accessibility and repairability - Shorter battery life | - CPU throttling under extreme stress - Dimmer display backlight; Less accurate colors - Shallower keyboard travel | - Heavier - No touchscreen options - CPU throttling under extreme stress - Higher core temperatures - Higher fan noise |
Microsoft Surface Book
Price comparison
Dell XPS 13 InfinityEdge
Price comparison
Apple MacBook Pro Retina 13
Price comparison
See more quick comparisons in our Face Off series:
- Dell XPS 15 vs. Apple MacBook Pro 15 vs. Asus ZenBook Pro UX501
- Aorus X3 Plus vs. Gigabyte P34W vs. Razer Blade 14
- Dell XPS 13 vs. Apple MacBook Pro 13 vs. Asus ZenBook UX305
- HP EliteBook 820 G2 vs. Lenovo ThinkPad X250 vs. Dell Latitude 12 E7250
- Asus ROG G751 vs. Dell Alienware 17 vs. MSI GT72 Dominator
- Lenovo ThinkPad T450 vs. Acer TravelMate P645 vs. Dell Latitude 14 E5450
- Dell Alienware 15 vs. Clevo P751ZM vs. MSI GE62
- Acer Aspire V17 Nitro vs. Asus N751 vs. HP Envy 17
- Samsung Galaxy Tab S 8.4 vs. Sony Xperia Z3 Compact vs. Dell Venue 8 7000
- Asus EeeBook X205TA vs. Lenovo S20 vs. Acer Aspire ES1
- Microsoft Surface Pro 3 vs. Asus Transformer Book T300 Chi vs. Toshiba Portege Z20t
- Lenovo ThinkPad Edge E550 vs. Acer Aspire E5 vs. HP ProBook 450 G2
- HP Pavilion 15 vs. Lenovo IdeaPad Z50 vs. Toshiba Satellite S50
- Apple MacBook Air 13 2015 vs. Samsung ATIV Book 9 900X3G vs. Asus ZenBook UX303
- Asus ROG G501 vs. Lenovo Y50 vs. Acer Aspire V15 Nitro
- OnePlus 2 vs. Honor 6 Plus vs. Motorola Moto X Play
- Lenovo Yoga 500 vs. Dell Inspiron 15 7000 vs. Toshiba Satellite Radius 15
- Apple iPhone 6S Plus vs. Huawei Mate S vs. LG G4
- Dell Inspiron 15 5558 vs. Lenovo Z51 vs. Acer Aspire V3 574G
- MSI GT72S vs. Asus G752 vs. Clevo P870DM
