

Intel Xeon E-2186M vs Intel Core i5-11500B
Intel Xeon E-2186M
► remove from comparison
The Intel Xeon E-2186M is a high-end processor for professional laptops with six cores based on the Coffee Lake architecture. The processor clocks at between 2.9 - 4.8 GHz (4.3 GHz with 6 cores) and can execute up to twelve threads simultaneously thanks to Hyper-Threading. The 4.8 GHz can only be reached using the "Thermal Velocity Boost" which allows one core to boost to 4.8 GHz (+200 MHz) as long as the CPU temperature is below 50°C. Multiple cores can be boosted +100 MHz below 50°C.
According to Intel, the CPU is manufactured in an improved 14nm (14nm++) process. Together with the Core i9-8950HK, the E-2186M is the fastest mobile processor in early 2018. Compared to the similar consumer Core i9, the mobile Xeon offers support for ECC main memory but has a locked multiplicator (no overclocking).
The Coffee Lake architecture is similar to Kaby Lake and differs only in the amount of cores (now six cores for the high end versions) and the improved 14nm process (14nm++ according to Intel).
Performance
Due to the two additional cores, performance has increased by almost 50% compared to a similar clocked Kaby Lake processor.
Graphics
The integrated Intel UHD Graphics 630 iGPU is supposed to offer a slightly higher performance as its clock rate has been increased by 50 MHz. The architecture is identical to that of the Intel HD Graphics 630. We do expect a performance improvement, but as a low-end solution it will probably only display current games smoothly at reduced details - if at all.
Power Consumption
Intel specifies the TDP with 45 watts and therefore the i9 is only suited for big laptops with good cooling solutions.
Intel Core i5-11500B
► remove from comparison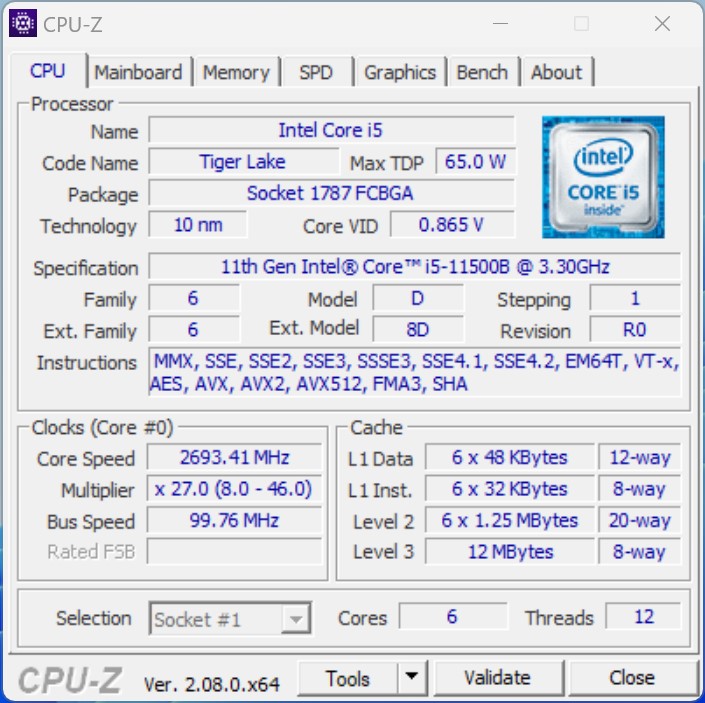
The Intel Core i5-11500B is a hexa-core processor for desktops and mini PCs. It is based on the Tiger Lake architecture (H45) and was presented in Q2 2021. The chip offers a TDP of 65 watts (configurable). The six processor cores can clock from 3.3 to 4.6 GHz (single-core turbo). The processor offers 12 MB level 3 cache and supports DDR4 RAM with up to 3,200 MT/s. The integrated graphics are based on the Xe architecture and are named UHD Graphics (32 EUs). In the 11500B it clocks from 350 to 1,450 MHz. The chip is manufactured using the 10 nm SuperFin process.
Performance
The performance of the Intel Core i5-11500B depends primarily on the performance of the installed cooling unit. The TDP of the SoC can also be lowered. In principle, however, the Intel Core i5-11500B should offer slightly more performance than an Intel Core i5-11400H (6 cores 2.7 - 4.5 GHz).
Features
As with the smaller Tiger Lake chips, Wi-Fi (Wi-Fi 6E) and Thunderbolt 4 / USB 4 are (partially) integrated into the chip for faster, cheaper and space-saving implementations in desktops and mini-PCs. The i5-11500B also offers 20 PCIe 4.0 lanes.
| Model | Intel Xeon E-2186M | Intel Core i5-11500B | ||||||||||||||||||||||||||||||||||||||||||||||||||||||||||||||||||||||||||||||||||||||||||||||||||||||||
| Codename | Coffee Lake-H | Tiger Lake-H | ||||||||||||||||||||||||||||||||||||||||||||||||||||||||||||||||||||||||||||||||||||||||||||||||||||||||
| Series | Intel Coffee Lake | Intel Tiger Lake | ||||||||||||||||||||||||||||||||||||||||||||||||||||||||||||||||||||||||||||||||||||||||||||||||||||||||
| Series: Tiger Lake Tiger Lake-H |
|
| ||||||||||||||||||||||||||||||||||||||||||||||||||||||||||||||||||||||||||||||||||||||||||||||||||||||||
| Clock | 2900 - 4800 MHz | 3300 - 4600 MHz | ||||||||||||||||||||||||||||||||||||||||||||||||||||||||||||||||||||||||||||||||||||||||||||||||||||||||
| L1 Cache | 384 KB | 480 KB | ||||||||||||||||||||||||||||||||||||||||||||||||||||||||||||||||||||||||||||||||||||||||||||||||||||||||
| L2 Cache | 1.5 MB | 7.5 MB | ||||||||||||||||||||||||||||||||||||||||||||||||||||||||||||||||||||||||||||||||||||||||||||||||||||||||
| L3 Cache | 12 MB | 12 MB | ||||||||||||||||||||||||||||||||||||||||||||||||||||||||||||||||||||||||||||||||||||||||||||||||||||||||
| Cores / Threads | 6 / 12 | 6 / 12 | ||||||||||||||||||||||||||||||||||||||||||||||||||||||||||||||||||||||||||||||||||||||||||||||||||||||||
| TDP | 45 Watt | 65 Watt | ||||||||||||||||||||||||||||||||||||||||||||||||||||||||||||||||||||||||||||||||||||||||||||||||||||||||
| Technology | 14 nm | 10 nm | ||||||||||||||||||||||||||||||||||||||||||||||||||||||||||||||||||||||||||||||||||||||||||||||||||||||||
| max. Temp. | 100 °C | 100 °C | ||||||||||||||||||||||||||||||||||||||||||||||||||||||||||||||||||||||||||||||||||||||||||||||||||||||||
| Features | Dual-Channel DDR4 Memory Controller, HyperThreading, AVX, AVX2, Quick Sync, Virtualization, AES-NI | DDR4-3200 RAM, PCIe 4, 8 GT/s bus, DL Boost, GNA, MMX, SSE, SSE2, SSE3, SSSE3, SSE4.1, SSE4.2, AVX, AVX2, AVX-512, BMI2, ABM, FMA, ADX, VMX, SMEP, SMAP, EIST, TM1, TM2, HT, Turbo, SST, AES-NI, RDRAND, RDSEED, SHA | ||||||||||||||||||||||||||||||||||||||||||||||||||||||||||||||||||||||||||||||||||||||||||||||||||||||||
| iGPU | Intel UHD Graphics 630 (350 MHz) | Intel UHD Graphics Xe 32EUs (Tiger Lake-H) (350 - 1450 MHz) | ||||||||||||||||||||||||||||||||||||||||||||||||||||||||||||||||||||||||||||||||||||||||||||||||||||||||
| Architecture | x86 | x86 | ||||||||||||||||||||||||||||||||||||||||||||||||||||||||||||||||||||||||||||||||||||||||||||||||||||||||
| Announced | ||||||||||||||||||||||||||||||||||||||||||||||||||||||||||||||||||||||||||||||||||||||||||||||||||||||||||
| Socket | BGA1787 |

Benchmarks
Average Benchmarks Intel Xeon E-2186M → 100% n=3
Average Benchmarks Intel Core i5-11500B → 127% n=3
* Smaller numbers mean a higher performance
1 This benchmark is not used for the average calculation