

Intel Pentium B980 vs Intel Core i5-520M vs Intel Core i5-520UM
Intel Pentium B980
► remove from comparison
The Intel Pentium B980 is a dual core processor for entry-level laptops. It is based on the Sandy Bridge architecture but many of the features like Turbo Boost for the CPU part, HyperThreading, AES, Virtualization (VT-x and VT-d), Trusted Execution or Intel Quick Sync are deactivated. The Pentium B980 integrates a graphics card called Intel HD Graphics that is based on the desktop HD Graphics 2000 clocked at 650 / 1150 (with Turbo Boost).
The performance of the Pentium B980 should be clearly faster than a similar clocked Arrandale Pentium CPU. Due to the high clock speed, the missing HyperThreading and smaller last level cache should be equalized and therefore, the performance should be similar to a Intel Core i3-2310M with 2.1 GHz.
The 35W TDP rating includes the integrated GPU and DDR3-1333 memory controller.
Intel Core i5-520M
► remove from comparison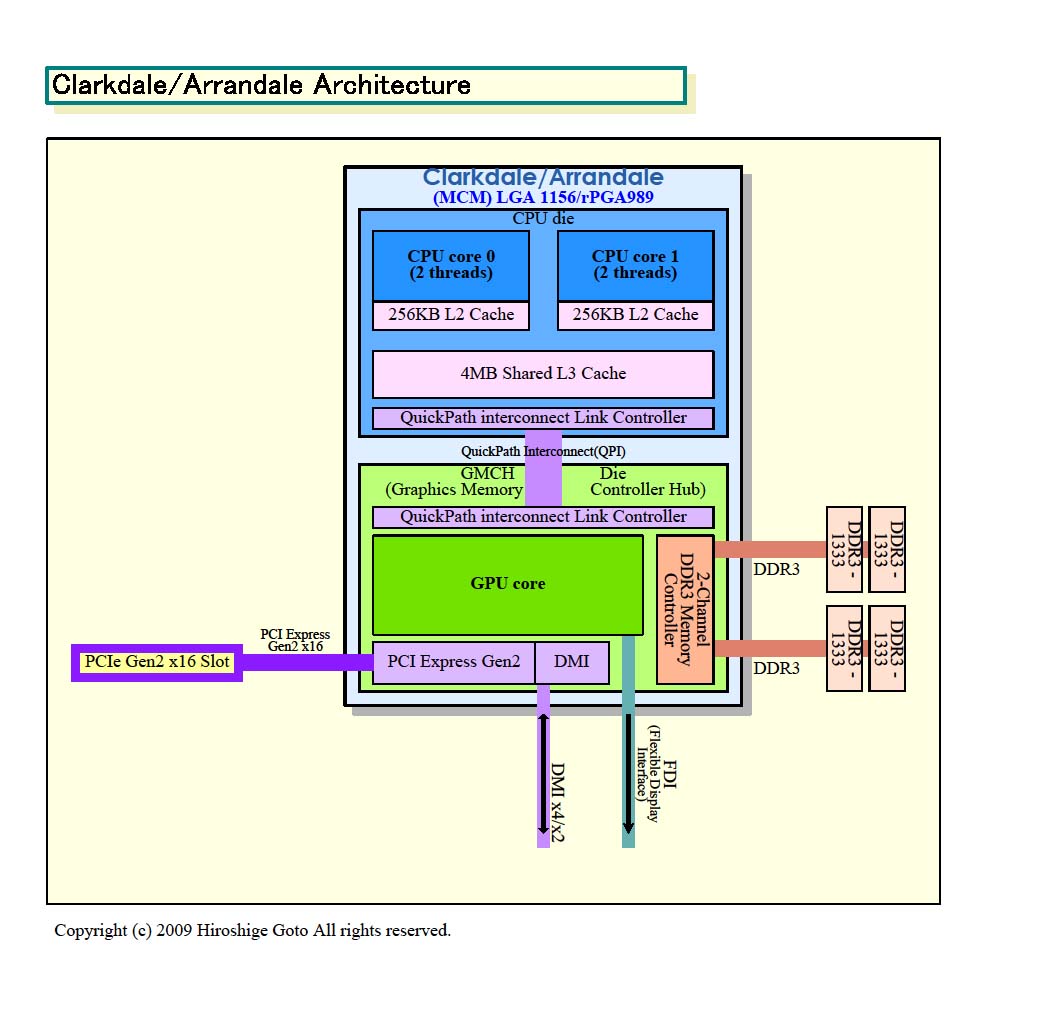
The Intel Core i5-520M is a dual core CPU for laptops and clocks (due to the Turbo Mode) from 2.4 to 2.93 GHz. Each core is based on the Nehalem (Westmere) micro-architecture. Hyperthreading enables the Dual Core CPU to handle 4 threads at once (for a better usage of the pipeline). Compared to the faster Core i7-620M, the 520M features only 3 MB Level 3 Cache and a lower clock speed (CPU and GPU).
A feature of the new Core i5-520M is the integrated graphics card called GMA HD and memory controller. Both are on a separate die that is still manufactured in 45nm whereas the CPU die is already manufactured in the new 32nm process.
The performance of the i5 520M is on average faster than a Core 2 Duo T9500 and due to the Turbo Boost, single threaded applications run even better. Therefore, the Core i5-520M is as fast as high clocked Core 2 Duo CPUs and should handle most gaming and multimedia tasks well.
The 32nm cpu cores of the Westmere generation can also process some new instructions to accelerate AES encryptions.
The integrated Intel Graphics Media Accelerator HD (GMA HD) graphics card is known to be clocked up to 500-766 MHz and should be clearly faster than the old GMA 4500MHD. A GeForce 9400M (ION) should still be a faster (especially as Nvidia and ATI cards have a better driver support than Intel up to now). According to rumors, the GMA core will also use the Turbo Mode regulate the clock speed.
The power consumption of 35 Watt TDP (max.) counts for the whole package and therefore it is clearly better than the 35 Watt TDP of the Core 2 Duo T-series (CPU alone). Due to the Turbo Boost, the Core i5 more likely uses the TDP under load than the older Core 2 Duo CPUs. Without any load, the i5 uses noticable less power.
Intel Core i5-520UM
► remove from comparison
The Intel Core i5-520UM is a Ultra Low Voltage dual-core processor for small and light laptops. It is clocked with 1.06 - 1.86 GHz (if Turbo Boost is enabled). Each core is based on the Nehalem (Westmere) micro-architecture. Hyperthreading enables the Dual Core CPU to handle 4 threads at once (for a better usage of the pipeline). Compared to the Core i7-620UM, the i5 offers only 3MB Level 3 cache (i7 4MB) and a lower maximum Turbo Boost frequency. Other Core i5 CPUs (withouth the U in the name) are faster due to the higher clock speed, but need more power.
A feature of the new Core i5-520UM is the integrated graphics card (called Intel HD Graphics) and memory controller. Both are on a separate die that is still manufactured in 45nm whereas the CPU die is already manufactured in the new 32nm process.
Due to the integrated memory controller, the HyperThreading and Turbo Boost, the Core i5-520UM is faster than a similar clocked Core 2 Duo (1.2 GHz) in all (us known) applications and benchmarks. Still the Turbo Boost may not trigger very often (sometimes it is even not activated in the BIOS) and therefore the maximum of 1.86 GHz is not very important.
The 32nm cpu cores of the Westmere generation can also process some new instructions to accelerate AES encryptions. Modern applications that support AES encoding can profit significantly using the new instructions (e.g. the Communications Suite test in the PCMark Vantage boosts up to 70% using AES in the faster Core i5-520M).
The integrated Intel Graphics Media Accelerator HD (GMA HD) graphics card is between 166-500 MHz (Turbo Boost) and therefore the base speed is clearly below the non low voltage versions. The performance should still be faster than the old GMA 4500MHD.
The power consumption of 18 Watt TDP (max.) counts for the whole package and therefore it is clearly better than the 17 Watt TDP of the Core 2 Duo SL-series (CPU alone).
| Model | Intel Pentium B980 | Intel Core i5-520M | Intel Core i5-520UM | ||||||||||||||||||||||||||||||||||||||||||||||||||||||||||||||||||||||||||||||||||||||||||||||||||||||||||||||||||||||||||||||||||||||||||||||||
| Codename | Sandy Bridge | Arrandale | Arrandale | ||||||||||||||||||||||||||||||||||||||||||||||||||||||||||||||||||||||||||||||||||||||||||||||||||||||||||||||||||||||||||||||||||||||||||||||||
| Series | Intel Pentium | Intel Core i5 | Intel Core i5 | ||||||||||||||||||||||||||||||||||||||||||||||||||||||||||||||||||||||||||||||||||||||||||||||||||||||||||||||||||||||||||||||||||||||||||||||||
| Series: Core i5 Arrandale |
|
|
| ||||||||||||||||||||||||||||||||||||||||||||||||||||||||||||||||||||||||||||||||||||||||||||||||||||||||||||||||||||||||||||||||||||||||||||||||
| Clock | 2400 MHz | 2400 - 2933 MHz | 1060 - 1866 MHz | ||||||||||||||||||||||||||||||||||||||||||||||||||||||||||||||||||||||||||||||||||||||||||||||||||||||||||||||||||||||||||||||||||||||||||||||||
| L1 Cache | 128 KB | 128 KB | |||||||||||||||||||||||||||||||||||||||||||||||||||||||||||||||||||||||||||||||||||||||||||||||||||||||||||||||||||||||||||||||||||||||||||||||||
| L2 Cache | 512 KB | 512 KB | 512 KB | ||||||||||||||||||||||||||||||||||||||||||||||||||||||||||||||||||||||||||||||||||||||||||||||||||||||||||||||||||||||||||||||||||||||||||||||||
| L3 Cache | 2 MB | 3 MB | 3 MB | ||||||||||||||||||||||||||||||||||||||||||||||||||||||||||||||||||||||||||||||||||||||||||||||||||||||||||||||||||||||||||||||||||||||||||||||||
| Cores / Threads | 2 / 2 | 2 / 4 | 2 / 4 | ||||||||||||||||||||||||||||||||||||||||||||||||||||||||||||||||||||||||||||||||||||||||||||||||||||||||||||||||||||||||||||||||||||||||||||||||
| TDP | 35 Watt | 35 Watt | 18 Watt | ||||||||||||||||||||||||||||||||||||||||||||||||||||||||||||||||||||||||||||||||||||||||||||||||||||||||||||||||||||||||||||||||||||||||||||||||
| Transistors | 624 Million | 382+177 Million | 382+177 Million | ||||||||||||||||||||||||||||||||||||||||||||||||||||||||||||||||||||||||||||||||||||||||||||||||||||||||||||||||||||||||||||||||||||||||||||||||
| Technology | 32 nm | 32 nm | 32 nm | ||||||||||||||||||||||||||||||||||||||||||||||||||||||||||||||||||||||||||||||||||||||||||||||||||||||||||||||||||||||||||||||||||||||||||||||||
| Die Size | 149 mm2 | 81+114 mm2 | 81+114 mm2 | ||||||||||||||||||||||||||||||||||||||||||||||||||||||||||||||||||||||||||||||||||||||||||||||||||||||||||||||||||||||||||||||||||||||||||||||||
| max. Temp. | 85 °C | 105 °C | 105 °C | ||||||||||||||||||||||||||||||||||||||||||||||||||||||||||||||||||||||||||||||||||||||||||||||||||||||||||||||||||||||||||||||||||||||||||||||||
| Socket | rPGA988B | BGA1288, PGA988 | BGA1288 | ||||||||||||||||||||||||||||||||||||||||||||||||||||||||||||||||||||||||||||||||||||||||||||||||||||||||||||||||||||||||||||||||||||||||||||||||
| Features | HD Graphics, DDR3 Memory Controller | Turbo Boost, Hyper Threading, Enhanced Speedstep, integrierte GMA HD 733MHz, | Turbo Boost (1.86 GHz max), Hyper Threading, Enhanced Speedstep, integrated GMA HD 166-500MHz | ||||||||||||||||||||||||||||||||||||||||||||||||||||||||||||||||||||||||||||||||||||||||||||||||||||||||||||||||||||||||||||||||||||||||||||||||
| iGPU | Intel HD Graphics (Sandy Bridge) (650 - 1100 MHz) | ||||||||||||||||||||||||||||||||||||||||||||||||||||||||||||||||||||||||||||||||||||||||||||||||||||||||||||||||||||||||||||||||||||||||||||||||||
| Architecture | x86 | x86 | x86 | ||||||||||||||||||||||||||||||||||||||||||||||||||||||||||||||||||||||||||||||||||||||||||||||||||||||||||||||||||||||||||||||||||||||||||||||||
| $125 U.S. | $225 U.S. | $241 U.S. | |||||||||||||||||||||||||||||||||||||||||||||||||||||||||||||||||||||||||||||||||||||||||||||||||||||||||||||||||||||||||||||||||||||||||||||||||
| Announced | |||||||||||||||||||||||||||||||||||||||||||||||||||||||||||||||||||||||||||||||||||||||||||||||||||||||||||||||||||||||||||||||||||||||||||||||||||
| FSB | 2500 | 2500 | |||||||||||||||||||||||||||||||||||||||||||||||||||||||||||||||||||||||||||||||||||||||||||||||||||||||||||||||||||||||||||||||||||||||||||||||||
| Manufacturer | ark.intel.com | ark.intel.com |

Benchmarks

Average Benchmarks Intel Pentium B980 → 100% n=13
Average Benchmarks Intel Core i5-520M → 118% n=13
Average Benchmarks Intel Core i5-520UM → 70% n=13
* Smaller numbers mean a higher performance
1 This benchmark is not used for the average calculation