Apple iPad (2017) Tablet Review

For the original German review, see here.
If you wanted to spend a maximum of 400 Euros for an Apple iPad so far, it had to be one of the Mini models. However, the current generation iPad Mini 4 costs at least 480 Euros ($399) – because you can only get the 128 GB model right now. Apple now launches a new tablet for price-conscious users. The name: iPad. The price: starting at 400 Euros ($329). This will get you a 9.7-inch tablet with Wi-Fi, 32 GB storage and somewhat dated components. The A9 SoC, which debuted in the iPhone 6S, is already 1.5 years old. Apple also uses the same camera modules for quite a while now. Potential buyers also have to make two more compromises: Apple does not equip its latest tablet with a fully laminated panel, so you can expect reflections. The 2017 iPad is not compatible with the Apple Pencil, either. This feature is still reserved for the Pro models. There are no visual changes compared to the "predecessor" iPad Air 2, which has already been removed from the Apple Store. This is where we bought our test model; it is the high-end SKU with 128 GB storage + Cellular for 659 Euros ($559).
We will call the new tablet from Cupertino Apple iPad (2017) to avoid mix-ups.
Case
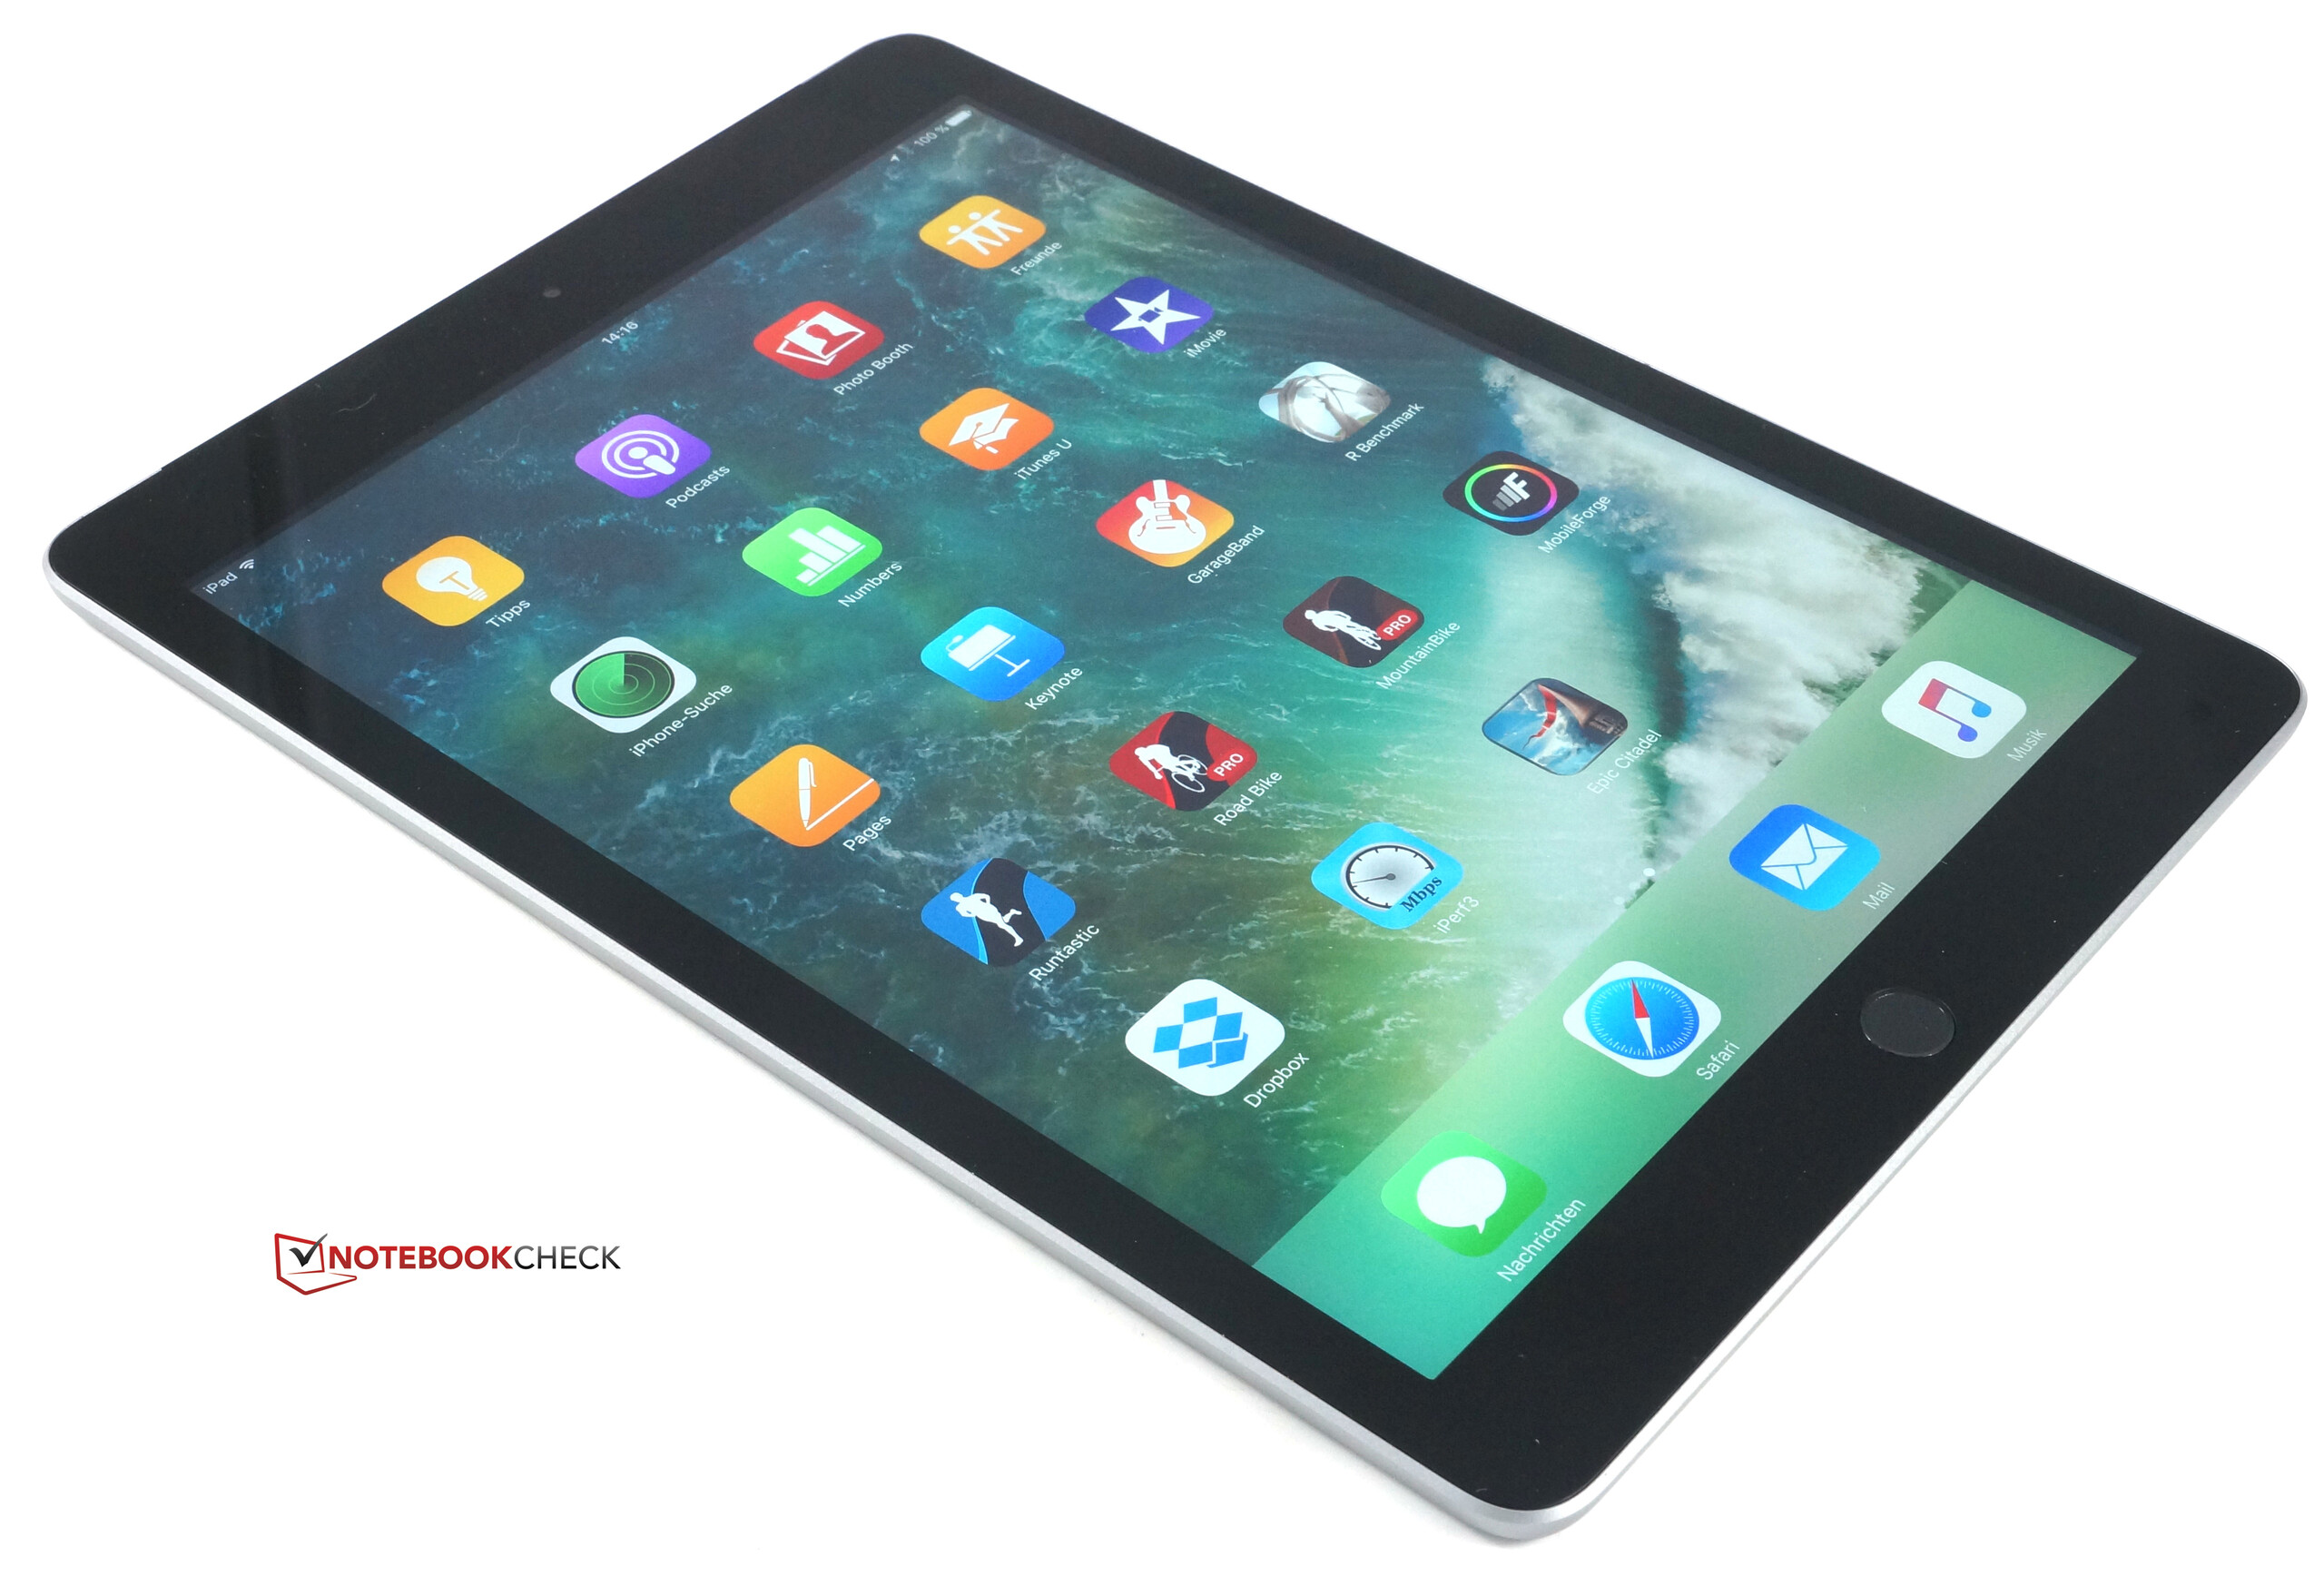
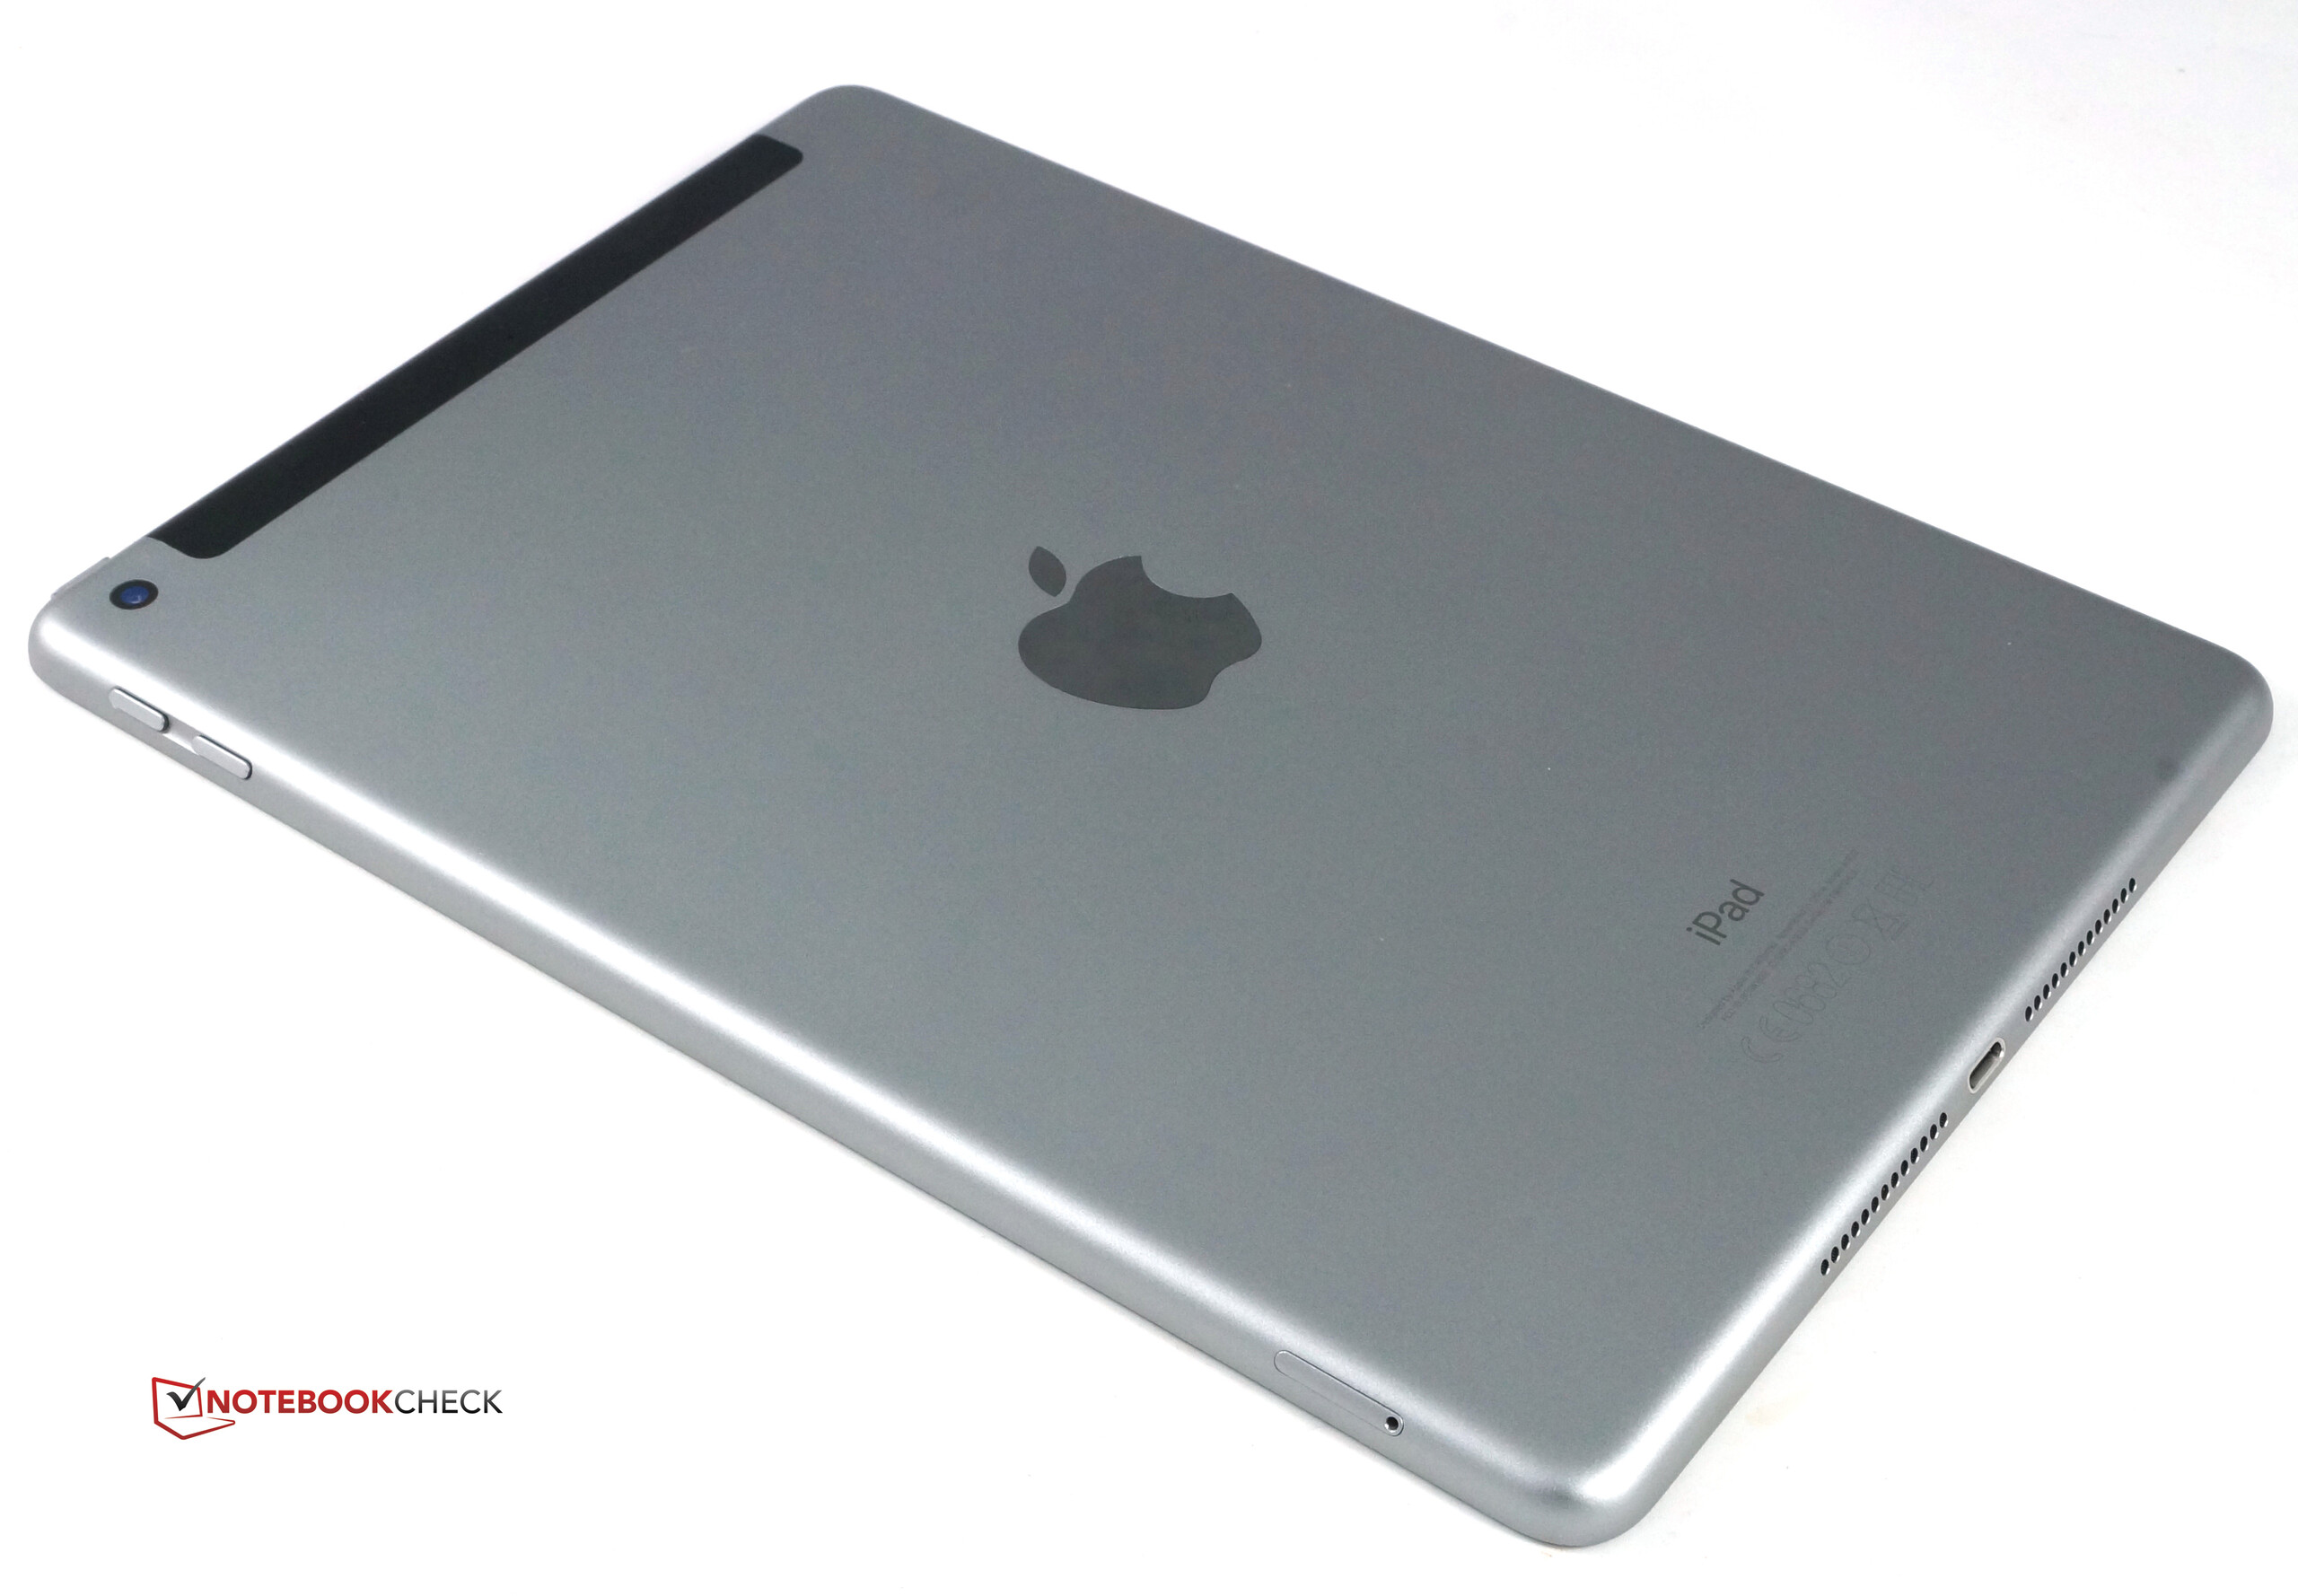
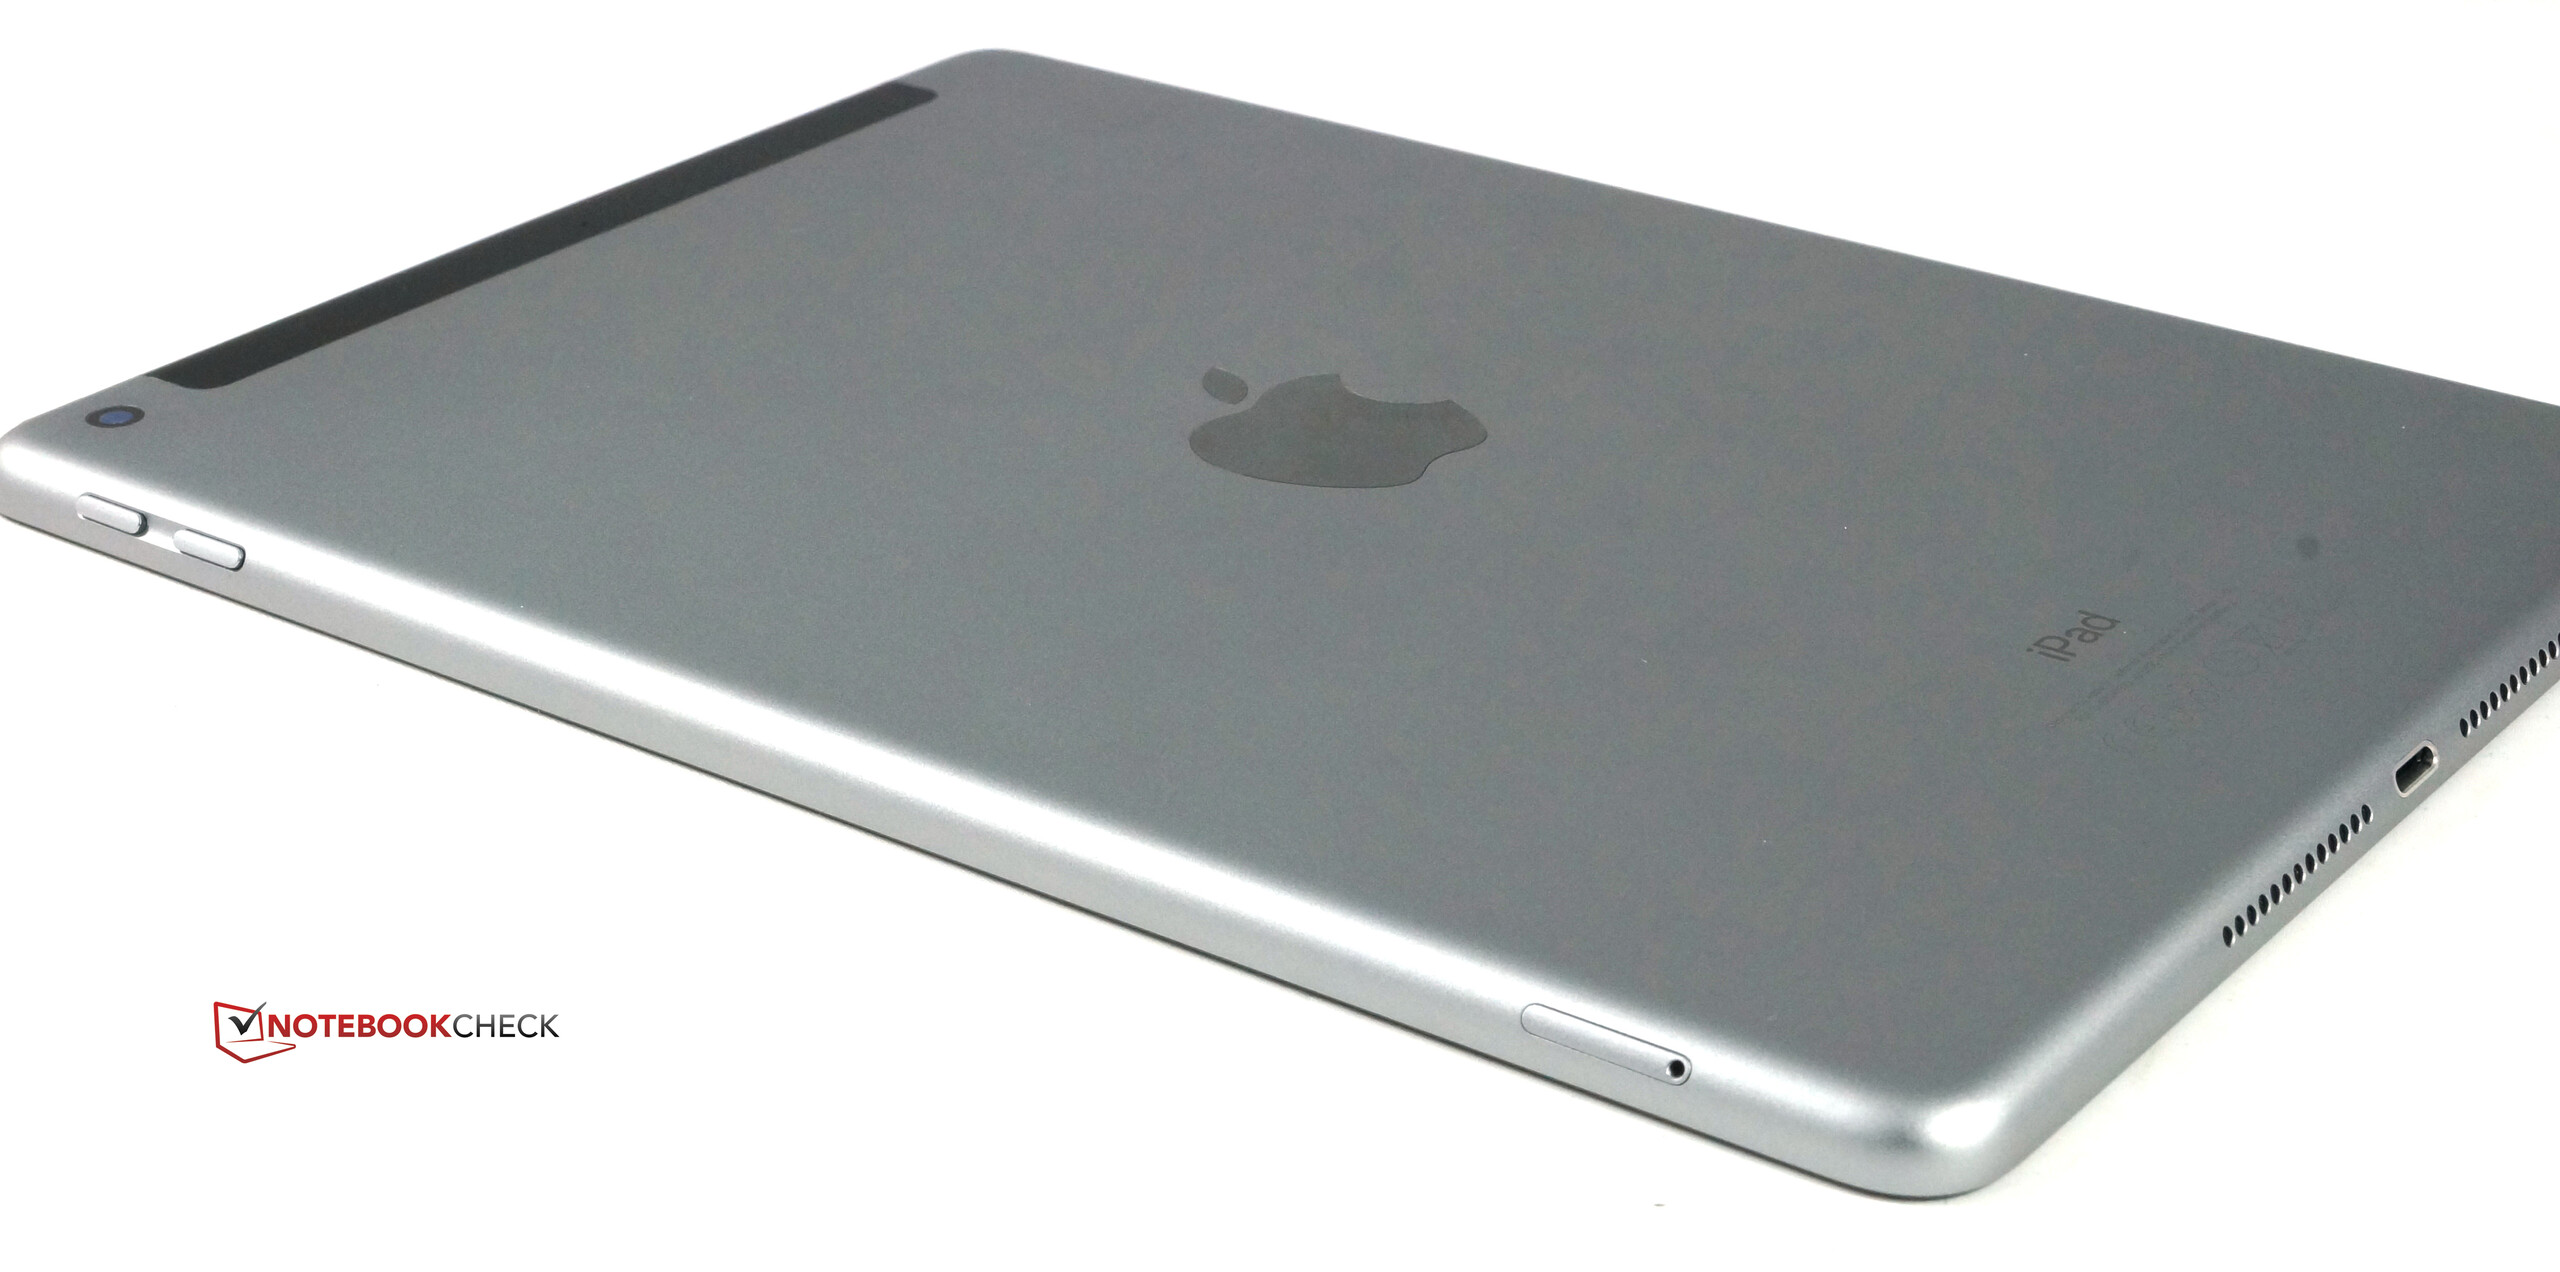
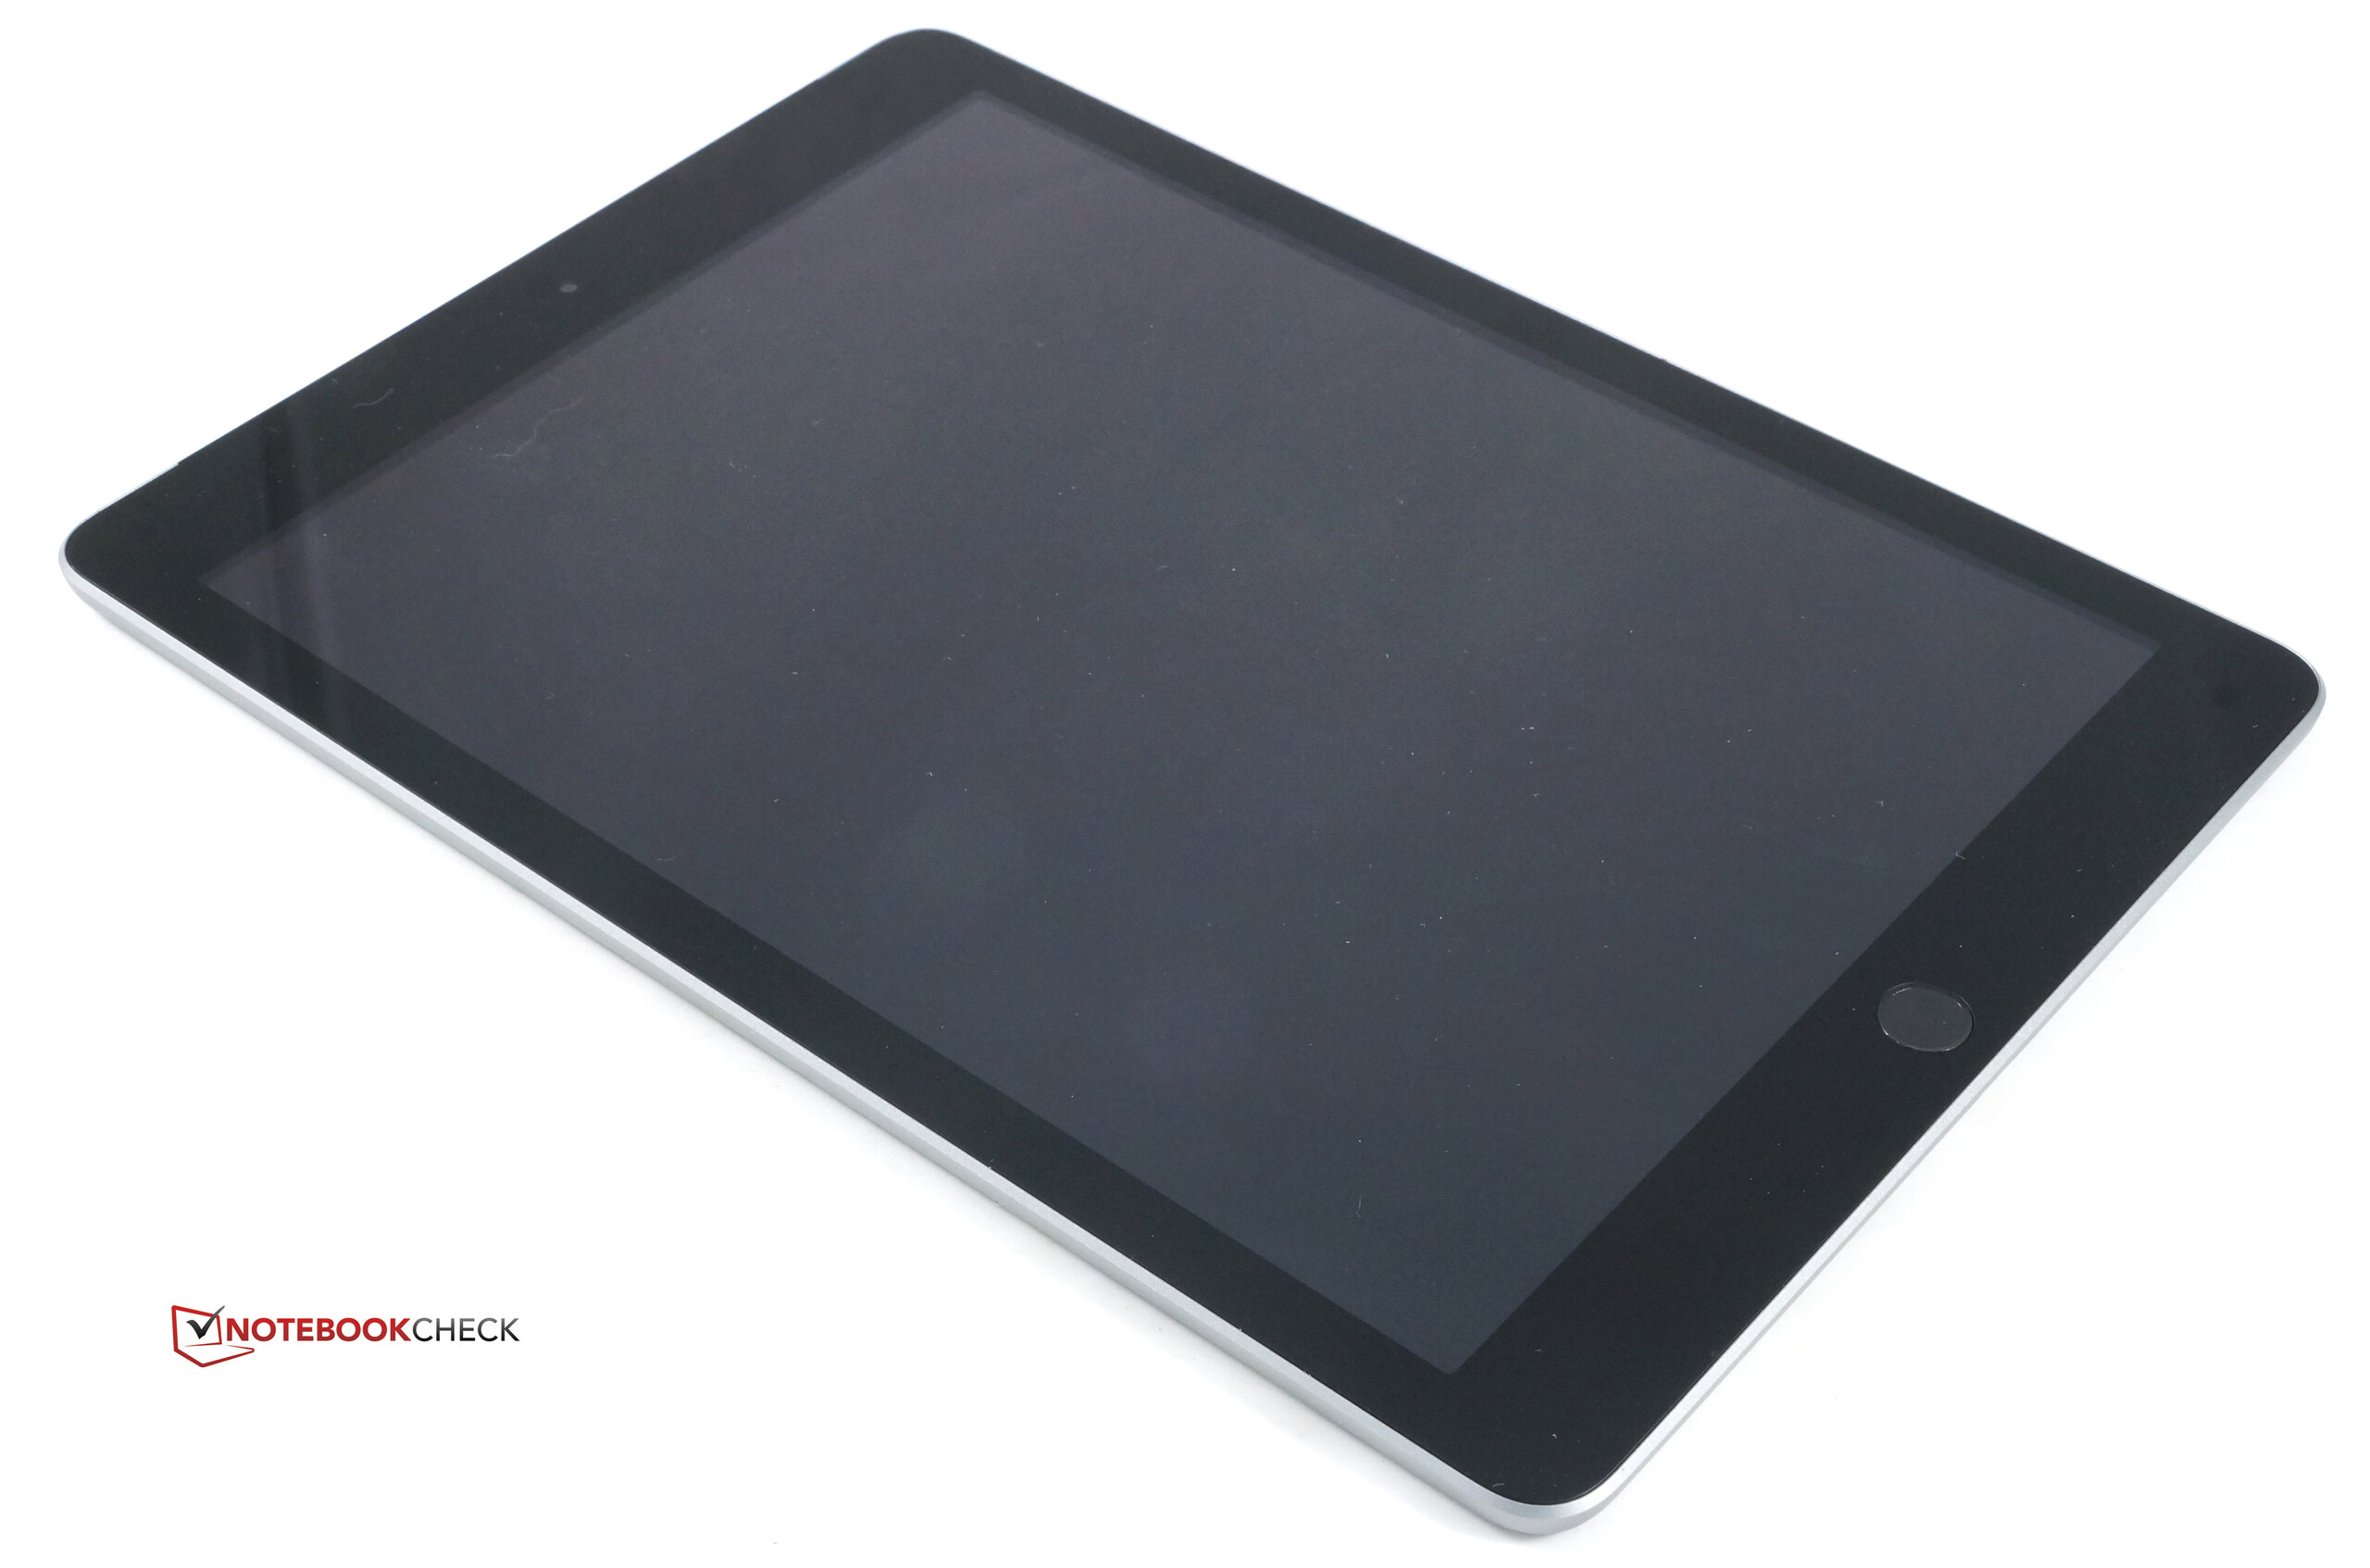
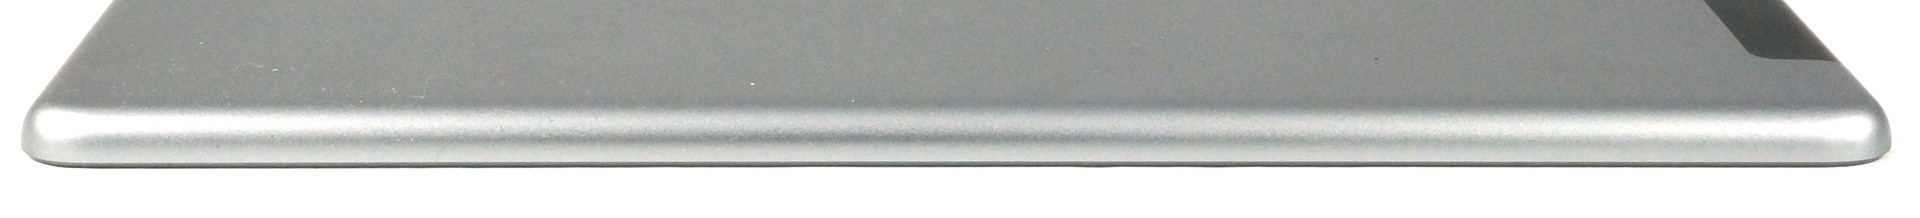
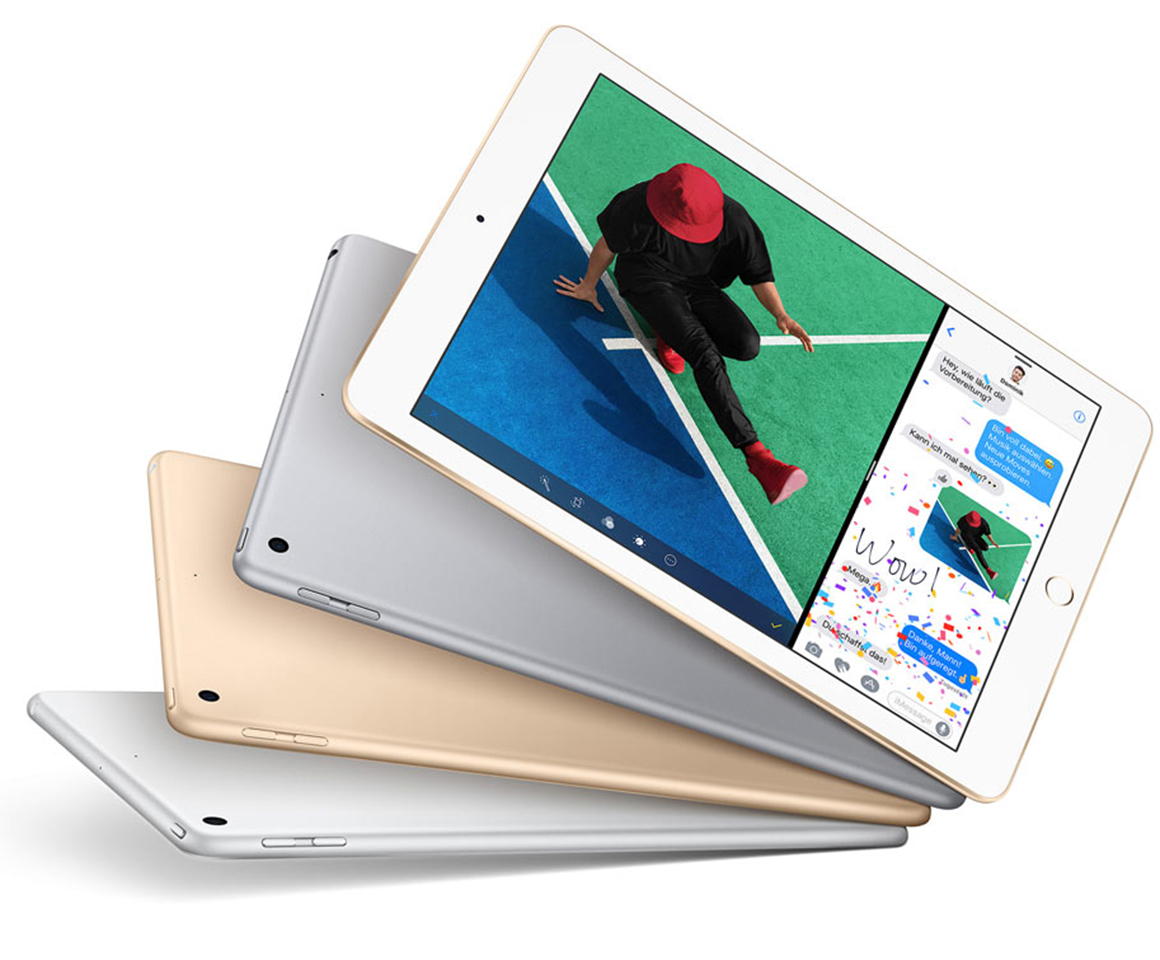
The latest Apple iPad has a 9.7-inch screen and looks … just like its two predecessors, the iPad Air & iPad Air 2. To make it short: It is the case of the first-generation iPad Air. We cannot see any changes even if there are any. Our colleagues from iFixit share this opinion and give the new iPad a better reparability score compared to the models with fully laminated panels. The case dimensions are also identical to the iPad Air at 7.5 x 240 x 169.5 millimeters (~0.3 x 9.4 x 6.7 in). The slightly higher weight (additional 5 grams/~0.18 oz) is probably a result of the fingerprint scanner Touch ID – one of the few new features on the iPad (2017). Otherwise, the chassis characteristics are identical to the first iPad Air: It is still one of the slimmest and lightest tablets without making compromises in terms of stability or build quality. Quite the contrary: Materials and build quality are still top-notch, even though the aluminum unibody design is almost four years old. There is no criticism for the stability, either. Only a lot of pressure will warp the case, and the liquid crystal display shows ripples only when you twist the device.
Connectivity
Apple sells the new iPad for a comparatively low price, so we should notice some "shortcuts" in this section. It already starts with the SoC. Instead of the current A10 or at least the most powerful iPad chip right now, the A9X, Apple only equips its new "budget tablet" with the Apple A9 – it debuted in autumn 2015 and powered the iPhone 6S and 6S Plus. This means the iPad will not be able to compete with the performance of the iPad Pros and the iPhone 7 models, but the power of the A9 chip should still ensure a good spot in the tablet performance ranking. This is also the case for the graphics adapter PowerVR GT7600.
Customers can choose between 32 and 128 GB storage. As per usual, it is not possible to expand the internal storage. You also have to choose whether you need LTE or not, because the new iPad is available as "Wi-Fi" or "Wi-Fi + Cellular". The additional price is fair at 100 Euros ($100) for the larger storage and hefty at 160 Euros ($130) for the LTE module.
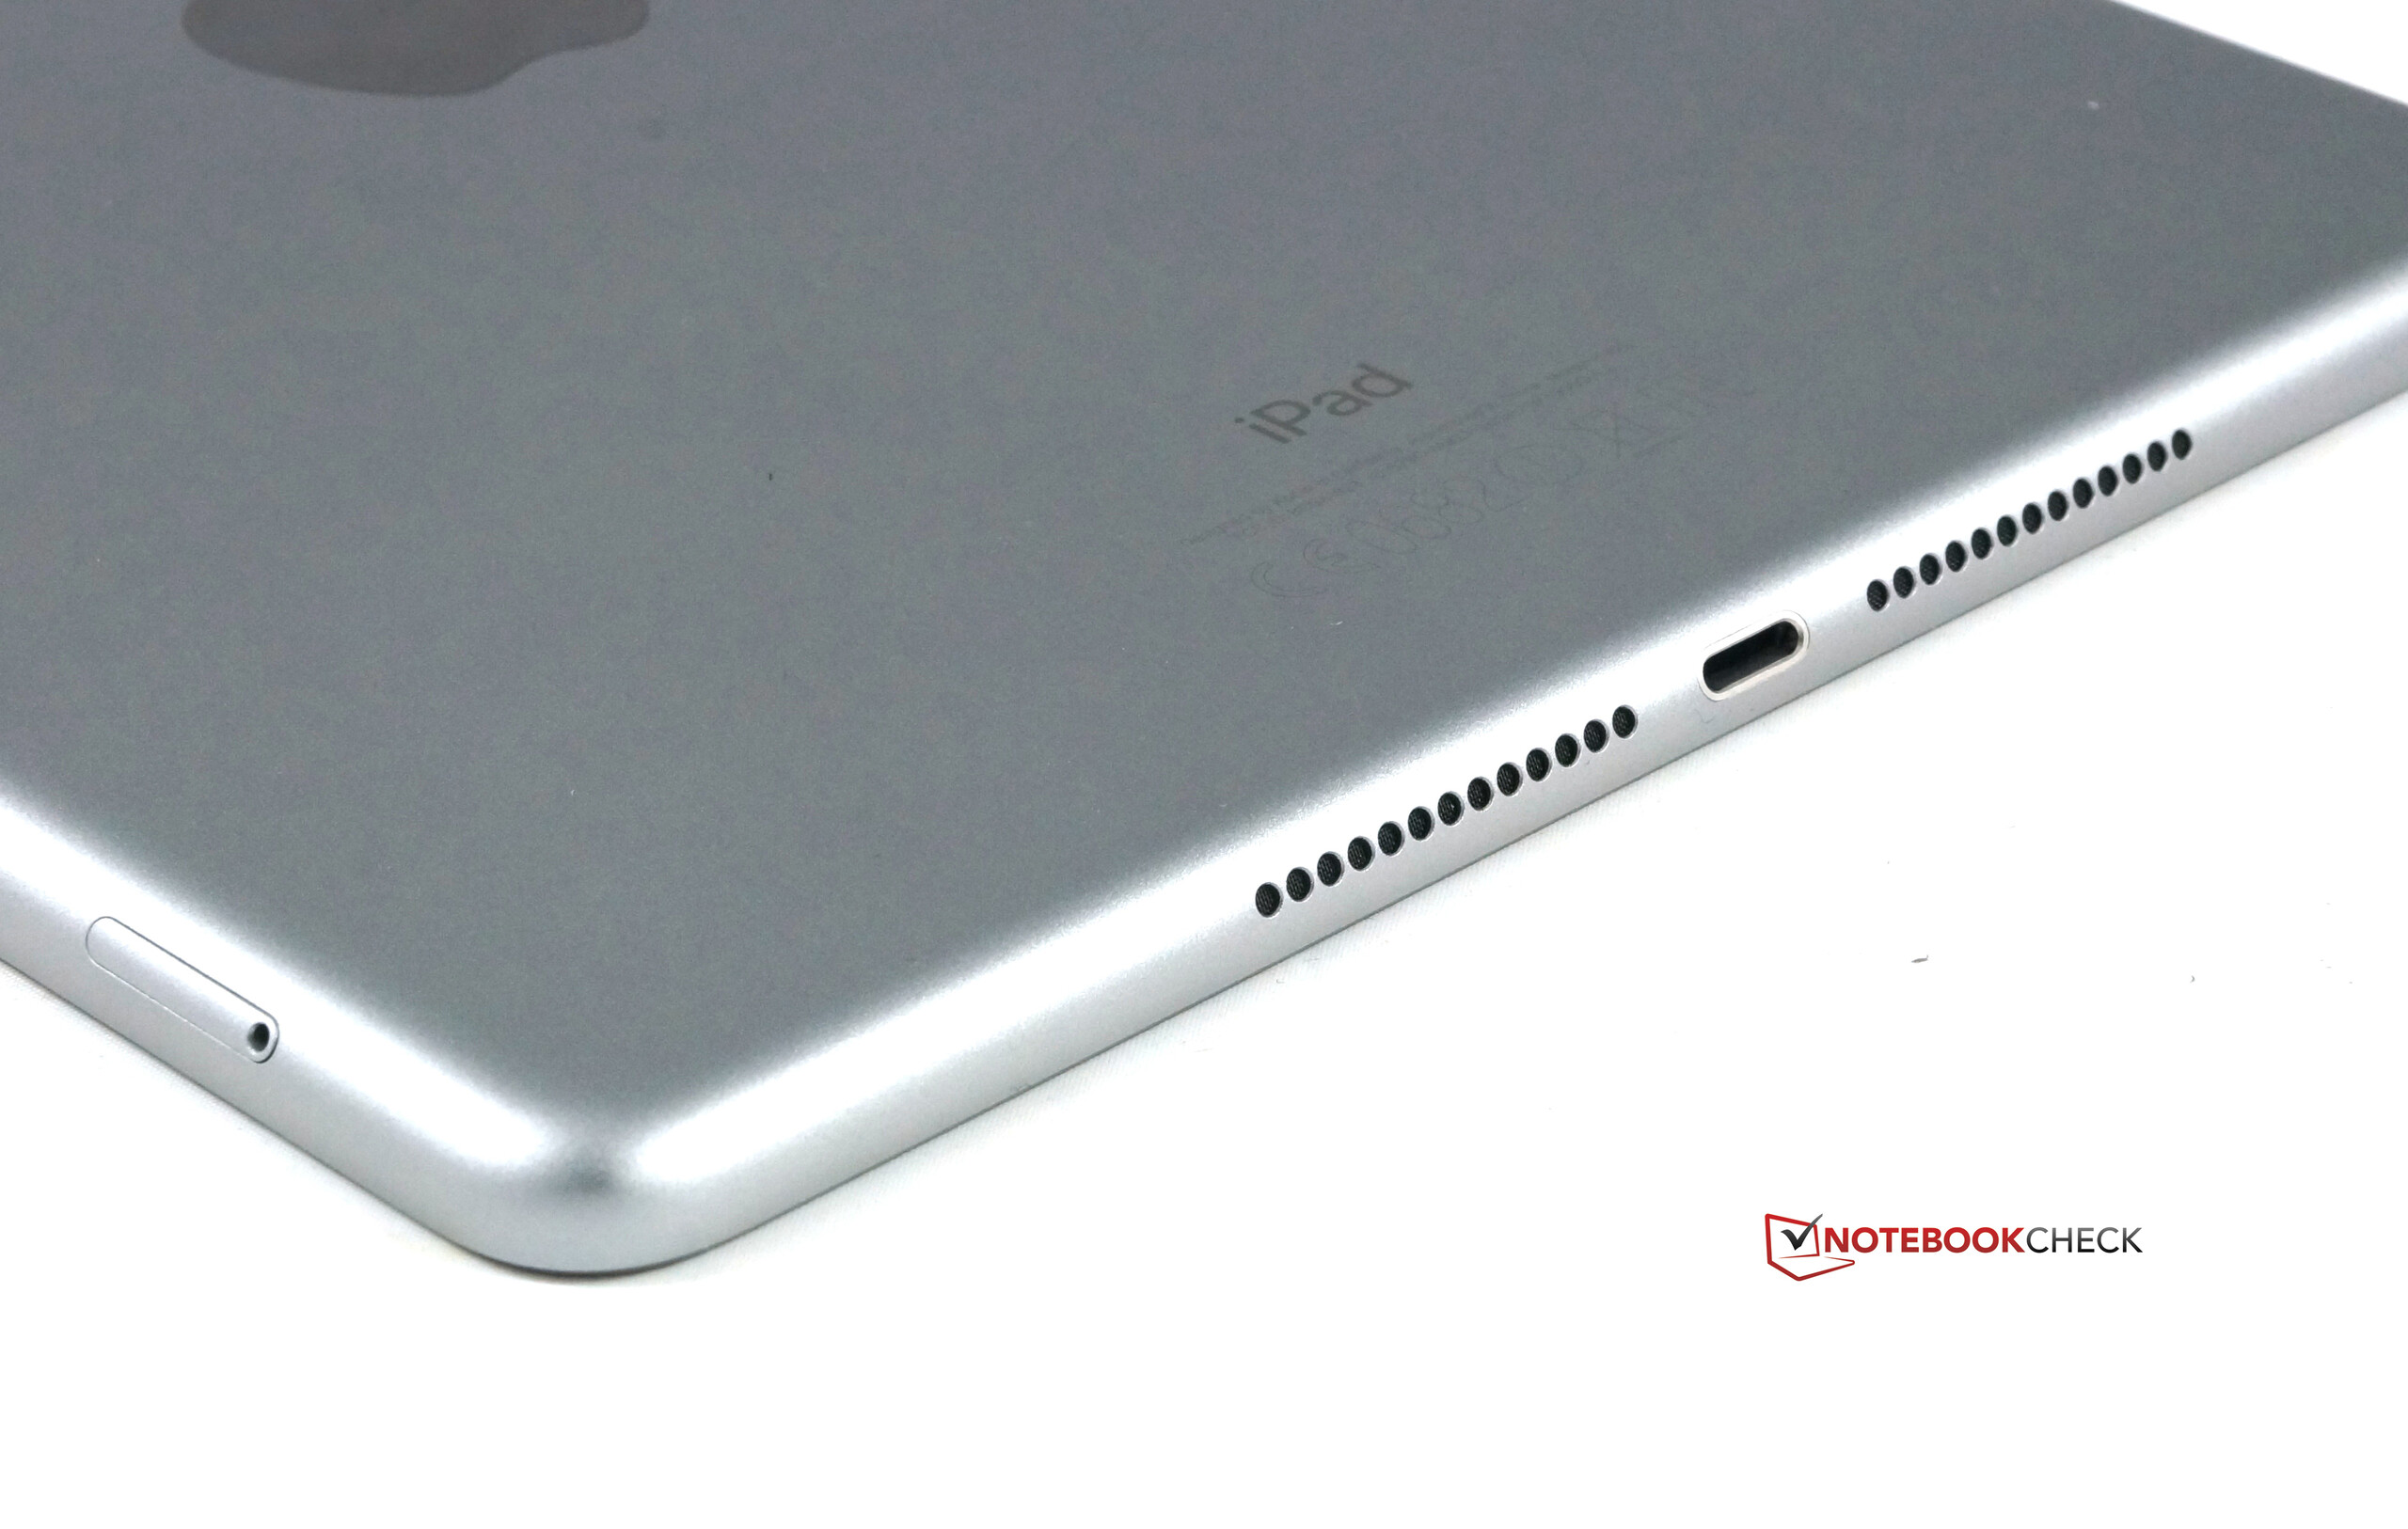
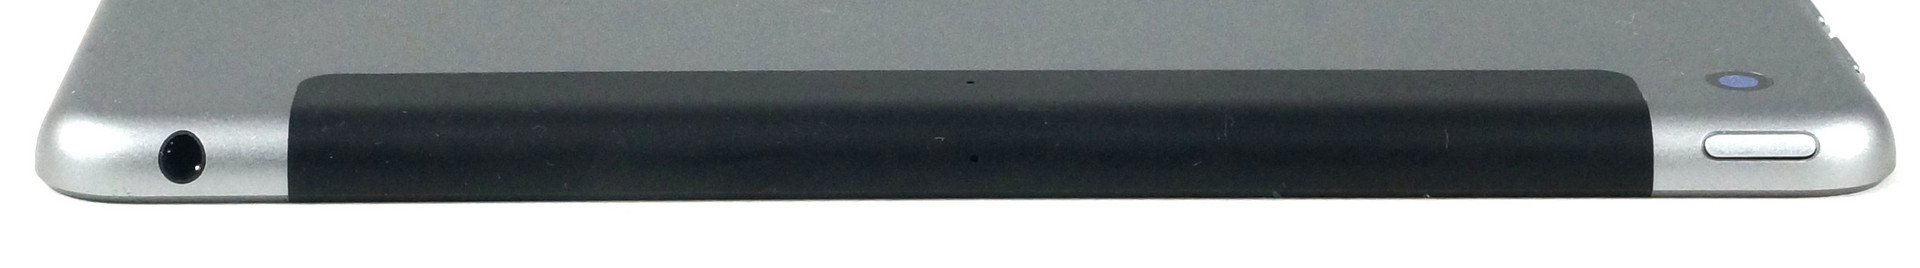
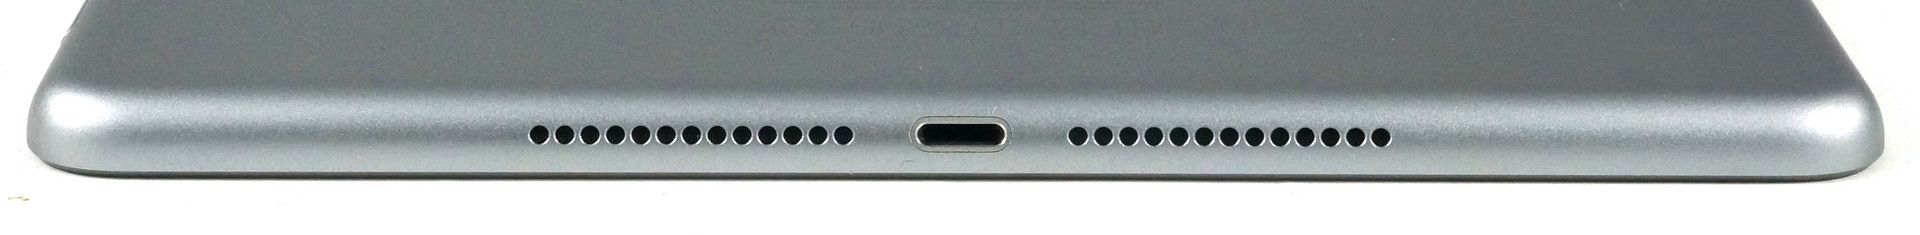
The iPad (2017) is obviously equipped with a Lightning connector to charge the tablet and transfer data. However, Apple still uses USB 2.0 in 2017. The iPad is at least still equipped with a 3.5 mm stereo jack.

Software
The current Apple operating system is iOS 10, which was launched on September 13, 2016. The iPad (2017) is obviously shipped with this version as well, and the minor release now carries the number 10.3 and was launched on March 27th. The focus of the latest update is the new Apple file system APFS, which is already used for the installation of iOS 10.3, so the internal storage is reformatted. You should therefore not forget to create a backup before the update. The new file system, which will be used on all Apple devices, replaces HFS+ or HFS, respectively, which is already 30 years old. The new system is optimized for fast flash storage according to the manufacturer, and it is supposed to improve the handling with encrypted files.
Reports also speculated about a theater mode, which is already available on the Apple Watch. It will stop the activation of the screen when you lift the device and mute all sources of noise. It is unfortunately not included in iOS 10.3, but you get modifiable app symbols in return. Developers of third-party software can change the symbols of their apps or offer a collection of alternative symbols. 10.3 will most likely be the last major release for iOS 10. Apple launched a small update to 10.3.1 during the review period, but iOS 11 is already in the works. However, some models will once again be left out. The minimum requirement for iOS 11 is a 64-bit processor, which is the case for all iPhones since the 5S. This will probably rule out the original iPad Air as well as the predecessors.
The first devices with iOS 10 were the Apple iPhone 7 and 7 Plus, so we refer to these reviews for more information about the current iOS release. There is not much to add for the 2017 iPad, except: iOS 10 also runs smoothly on the latest tablet from Cupertino and does not affect the workflow.
Communication and GPS
The wireless communication modules are still up to date, despite their somewhat old technology. The dual-band Wi-Fi module supports the 802.11 standards a/b/g/n/ac as well as the MIMO technology, so the theoretical maximum transfer rate is 866 Mbps. The cellular connection is not quite as fast. LTE at up to 300 Mbps downstream and 50 Mbps upstream, respectively, should still be more than sufficient for Internet on the go, though, especially since these transfer rates are still not common among mobile carriers. The number of bands is more important, and the iPad does not cause any criticism with 21 bands. The Apple SIM is supported as well. The SIM card standard is – as per usual – "nano". Bluetooth 4.2 is still up to date, even though the successor Bluetooth 5 was already announced a couple of months ago.
We check the performance of the Wi-Fi module with our reference router Linksys EA8500. The performance of the iPad is very good, but cannot quite keep up with the iPhone 7. 465 Mbps receive and 389 Mbps send is still clearly ahead of the Samsung Galaxy S7. The new iPad can therefore benefit from very fast Internet connections and will usually not be the bottleneck.
| Networking | |
| iperf3 transmit AX12 | |
| Apple iPhone 7 (Klaus I211) | |
| Apple iPad (2017) | |
| Samsung Galaxy S7 | |
| iperf3 receive AX12 | |
| Apple iPhone 7 (Klaus I211) | |
| Apple iPad (2017) | |
| Samsung Galaxy S7 | |
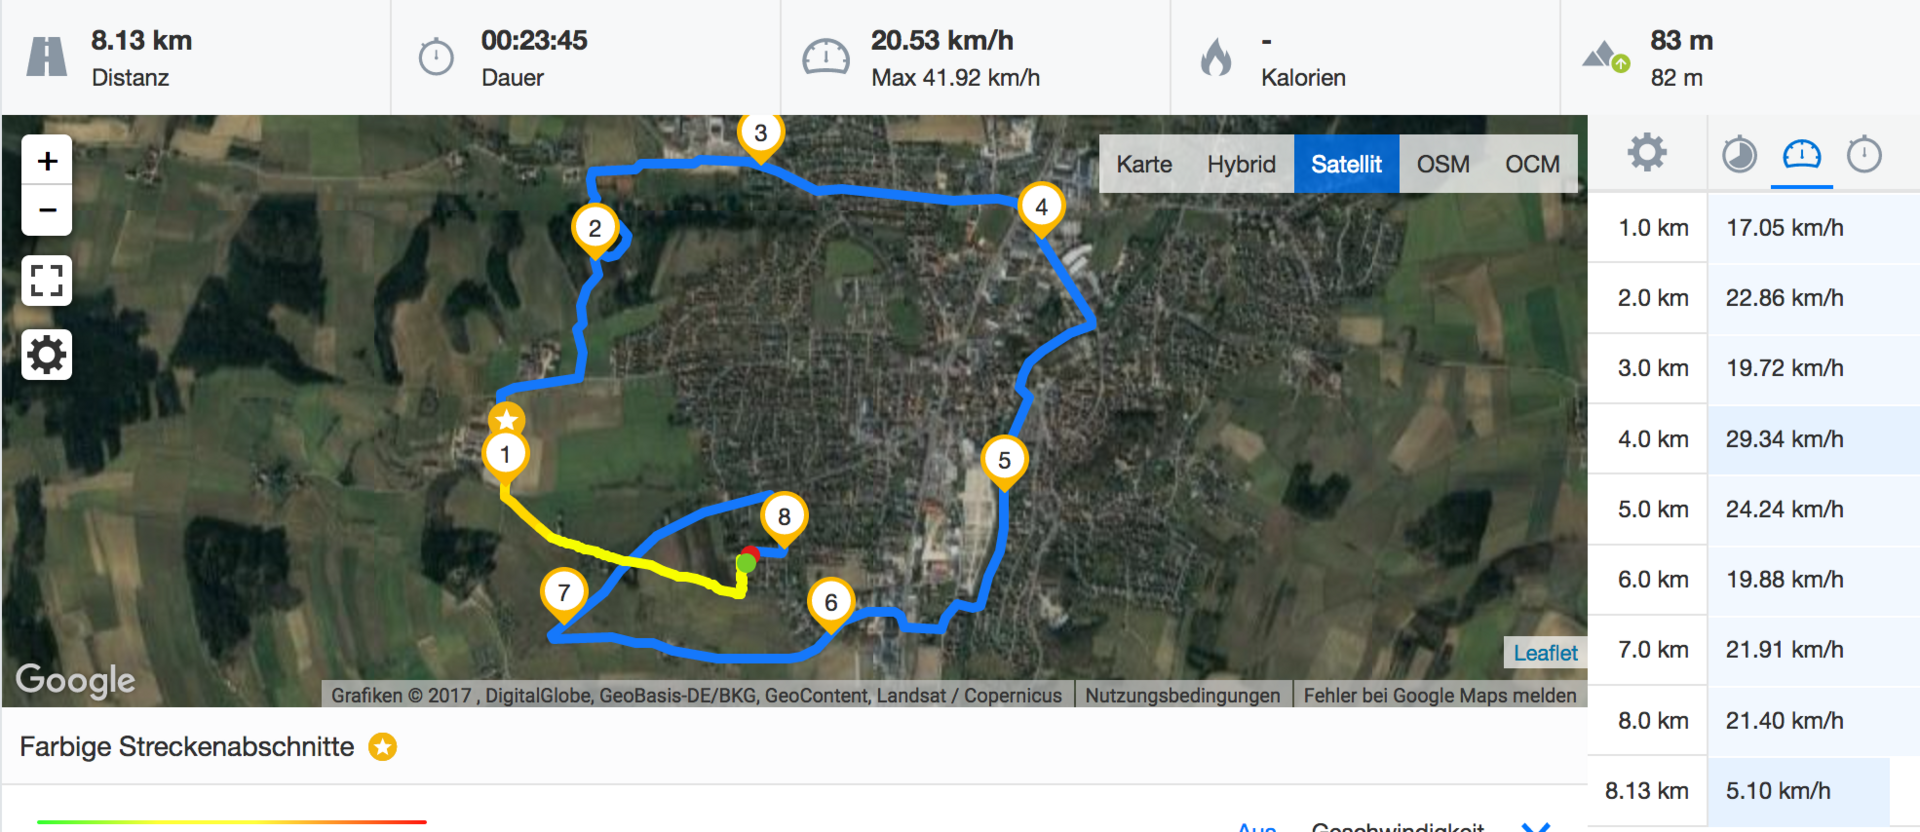
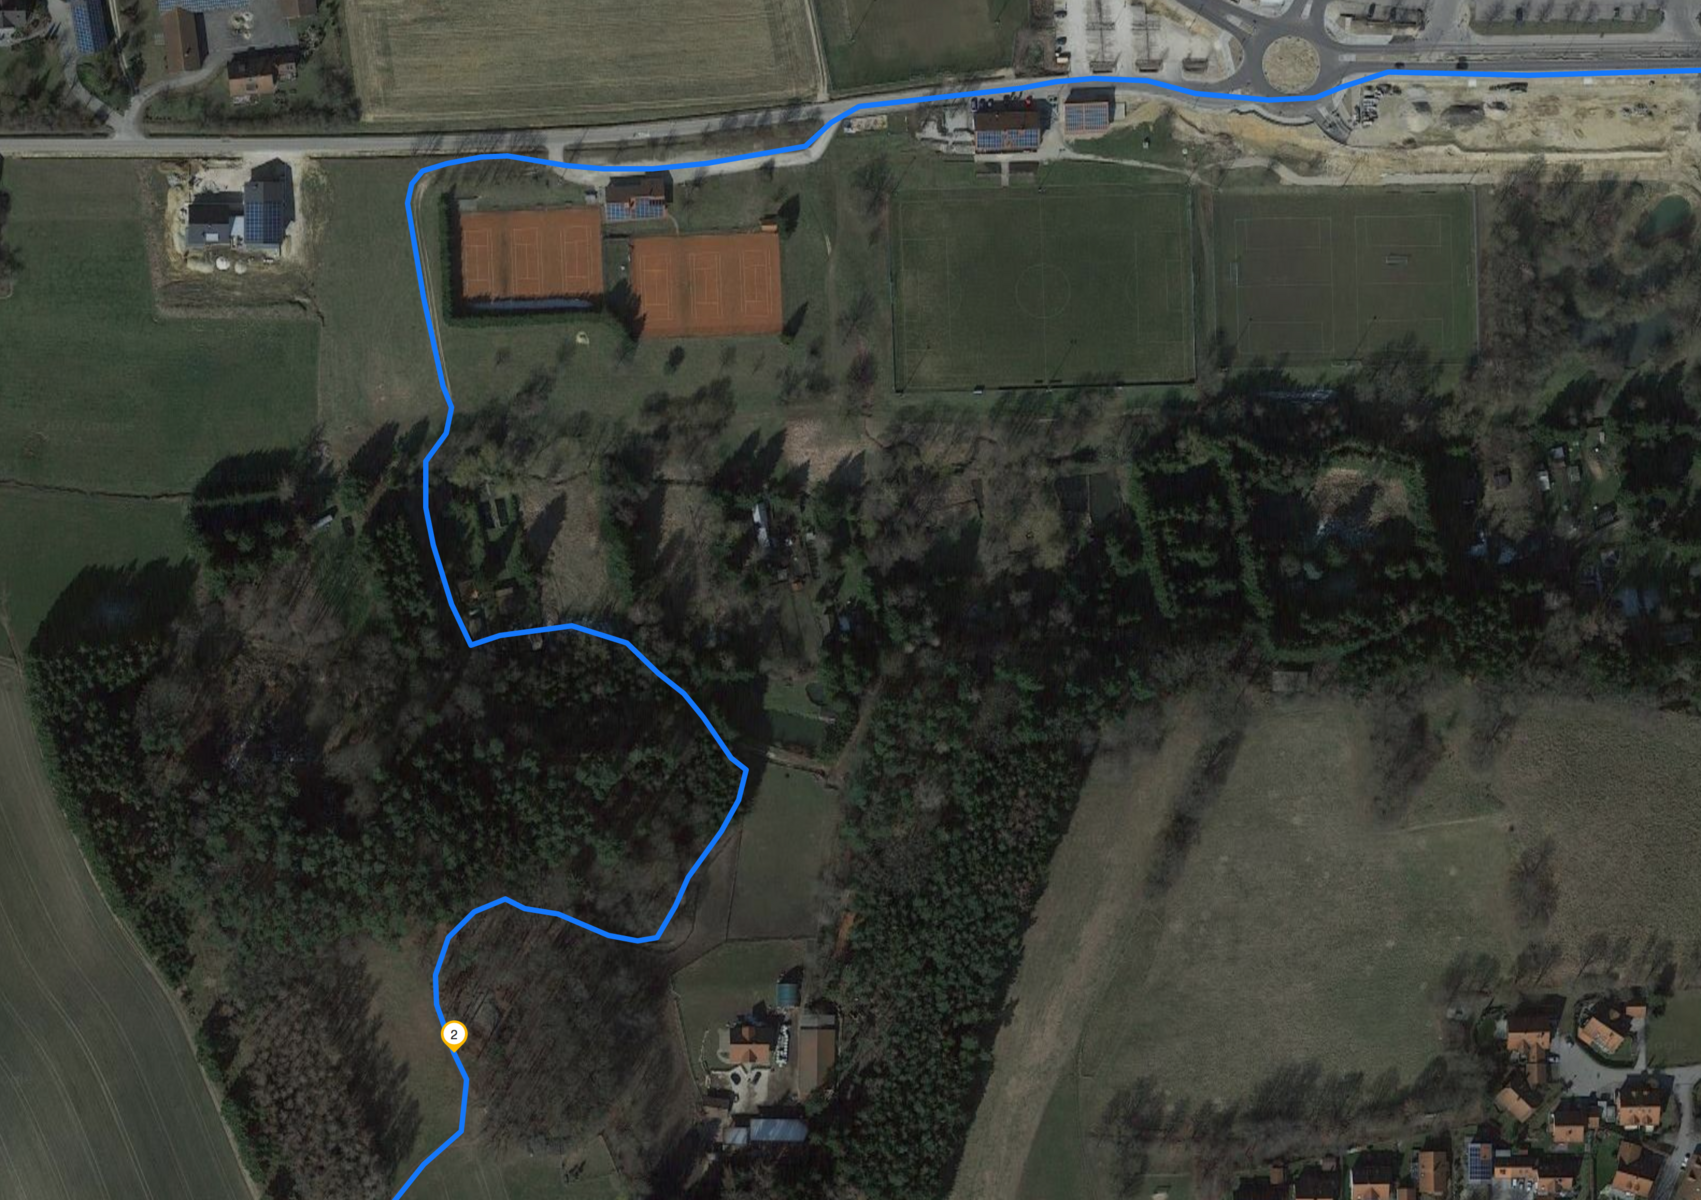
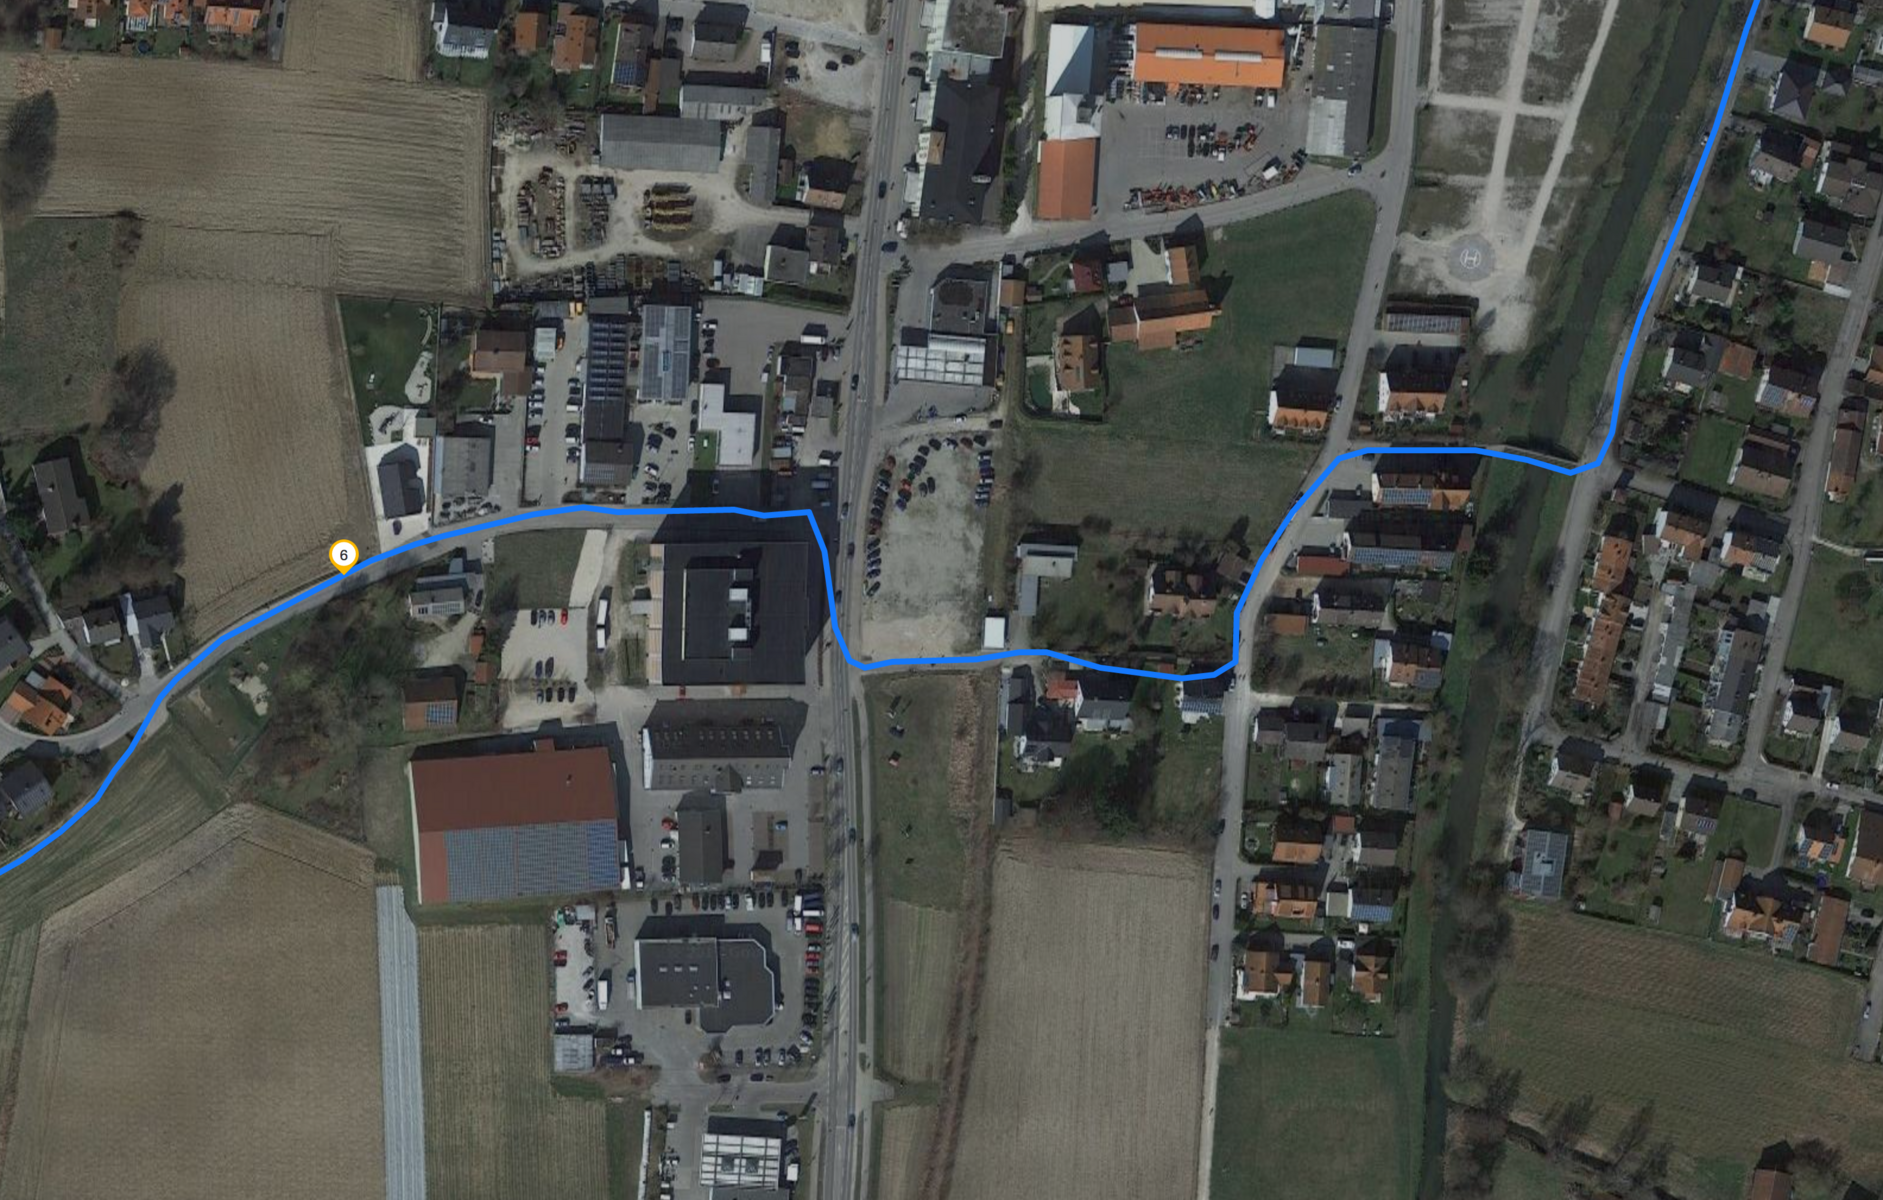
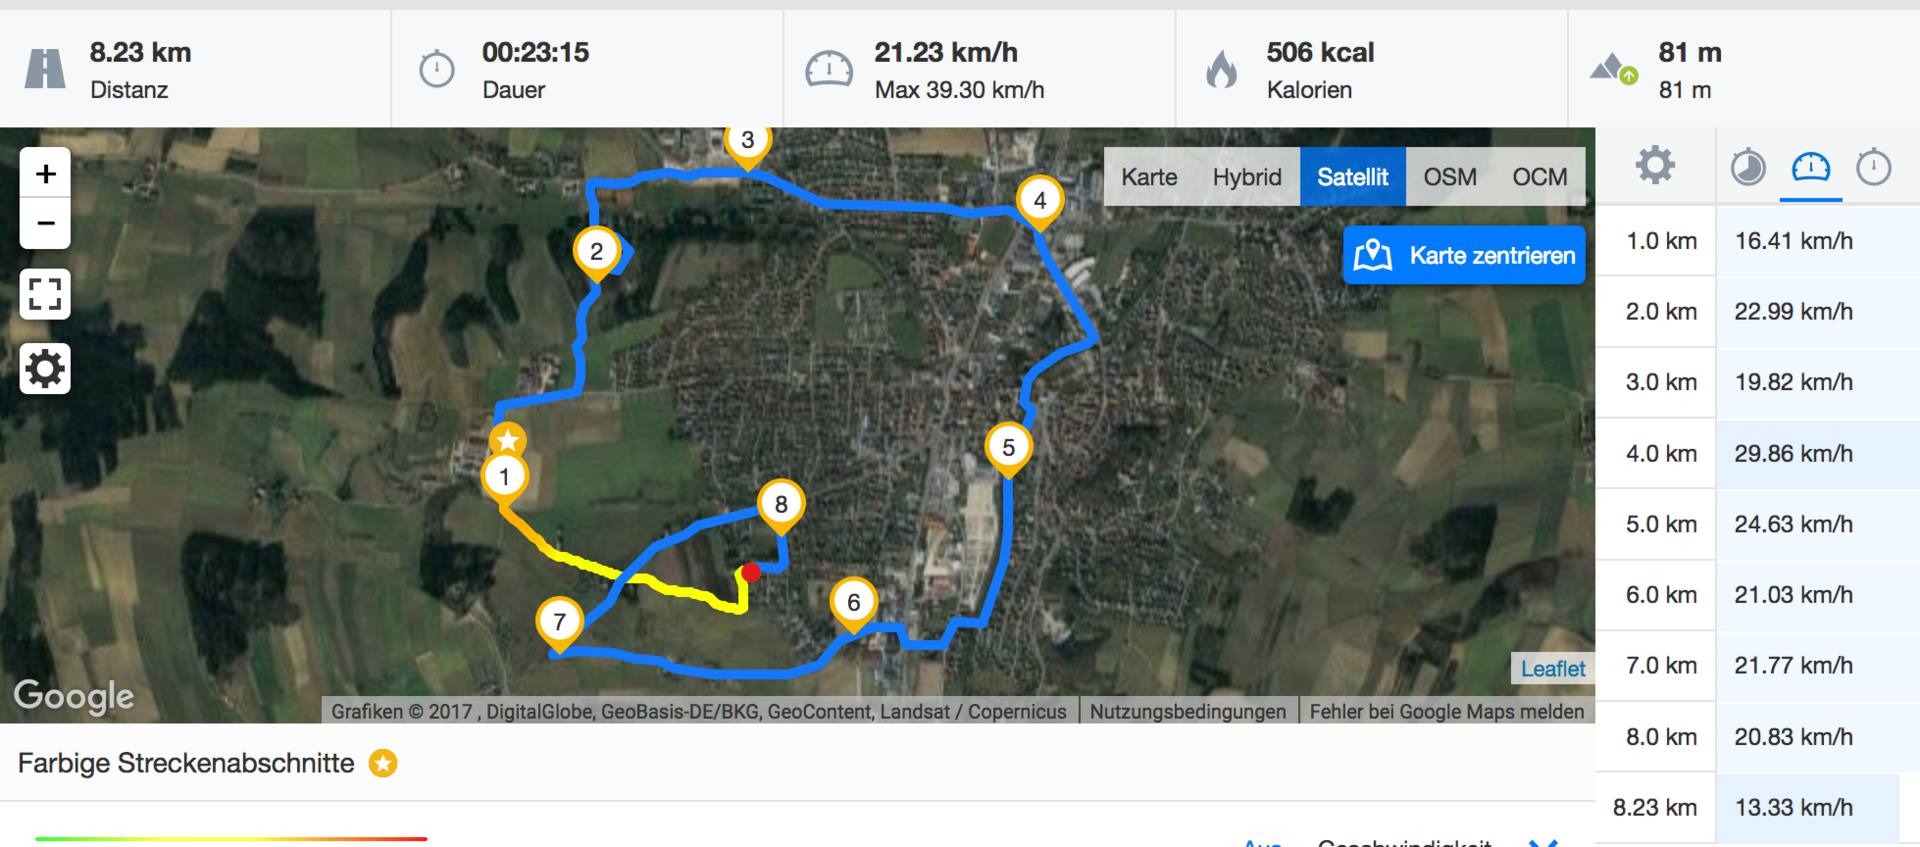
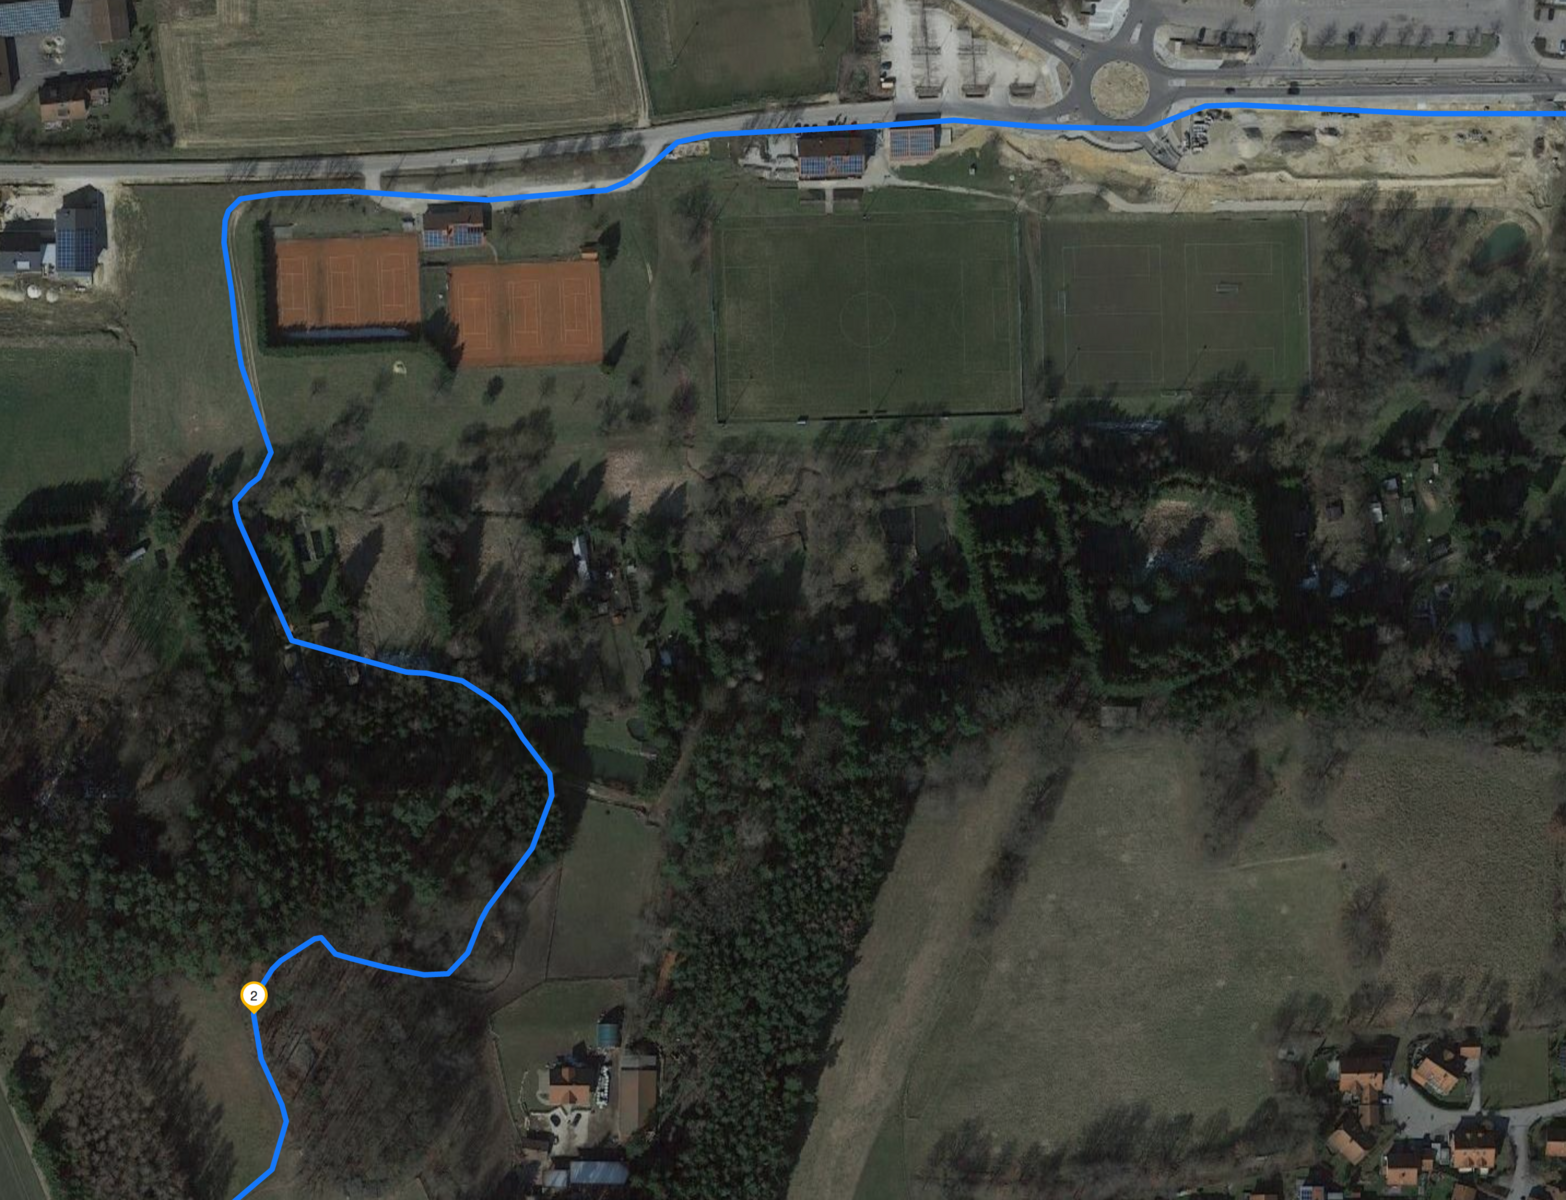
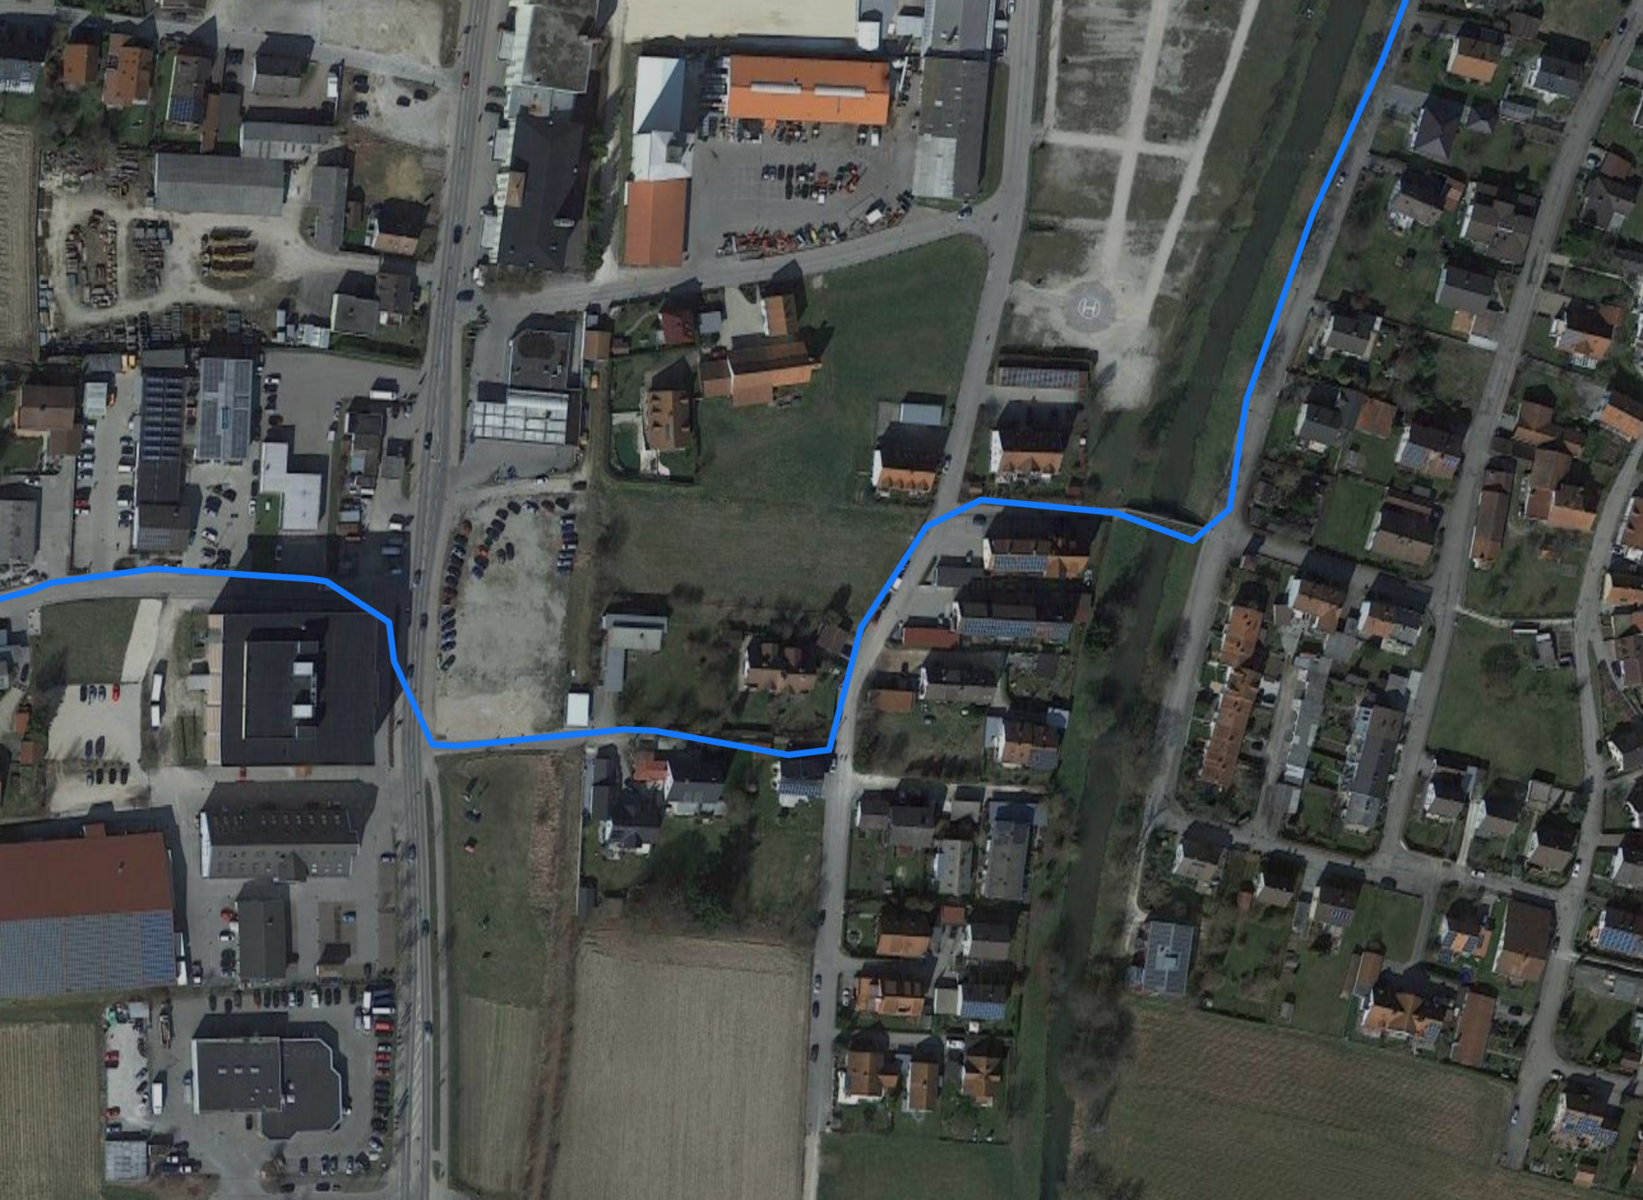
Our test model of the Apple iPad is equipped with an LTE module. Only this SKU is also equipped with a receiver for GPS & GLONASS signals. We compare the quality on an 8 km (~5 mile) long mountain bike ride through a mixed terrain. We also have the reference navigation device Garmin Edge 500 with us. The new iPad performs – similar to so many other iOS devices before – very well. The whole track length is just 100 meters (~328 feet) shorter on the Apple tablet, which is a very small difference. The forest section in particular shows that the iPad only takes minor "shortcuts" compared to the special navigation system. The initial satellite connection is also established within seconds, even indoors (but only close to a window). All in all, the Apple iPad 2017 is an excellent choice for navigation purposes, both on-road and off-road.
Cameras

No changes for the camera modules: We already know the two sensors from the iPad Mini 4, iPad Pro 12.9, and iPad Air 2. The main camera takes pictures at 8 MP and has a maximum aperture of f/2.4. This is nothing special anymore, not even for a tablet. This is even more the case for the front camera, which is called FaceTime HD camera by Apple. Nobody will be impressed by the 1.2 MP sensor, but the results are actually decent in good lighting conditions. Colors appear vivid, but it lacks details and sharpness. The front camera works well for video calls – which is also supported by experiences with other iOS products. This is also the case for the new iPad. Only low-light situations will quickly show the limitations of the sensor and videos suffer from a lot of picture noise.
You can take much better pictures with the main camera. This sensor provides vivid colors as well, but the contrast range is superior to the FaceTime camera. The higher resolution (8 MP) also ensures crisper results, but you will also notice weaknesses when you start to zoom in: Details like leafs, roof tiles and the like are very blurry. The new iPad still has one of the best tablet cameras.


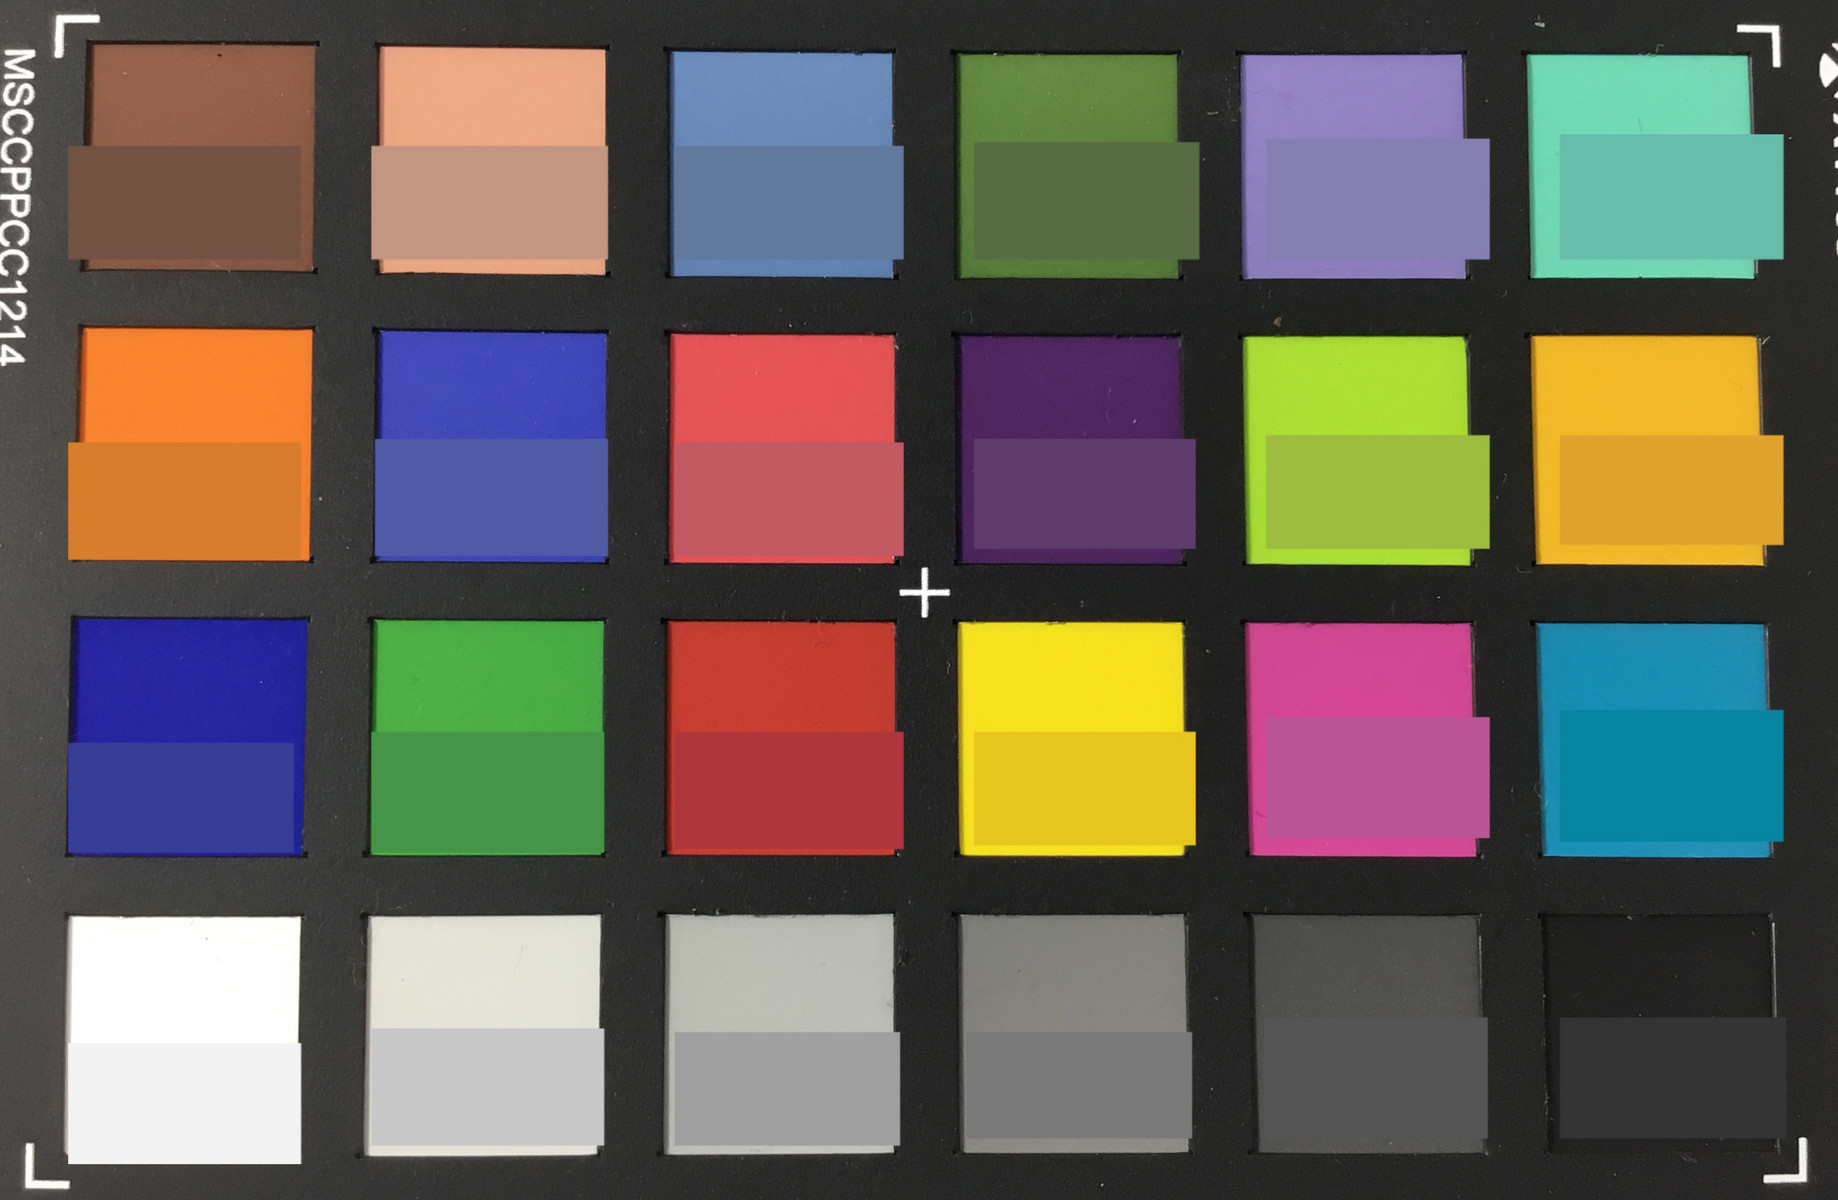
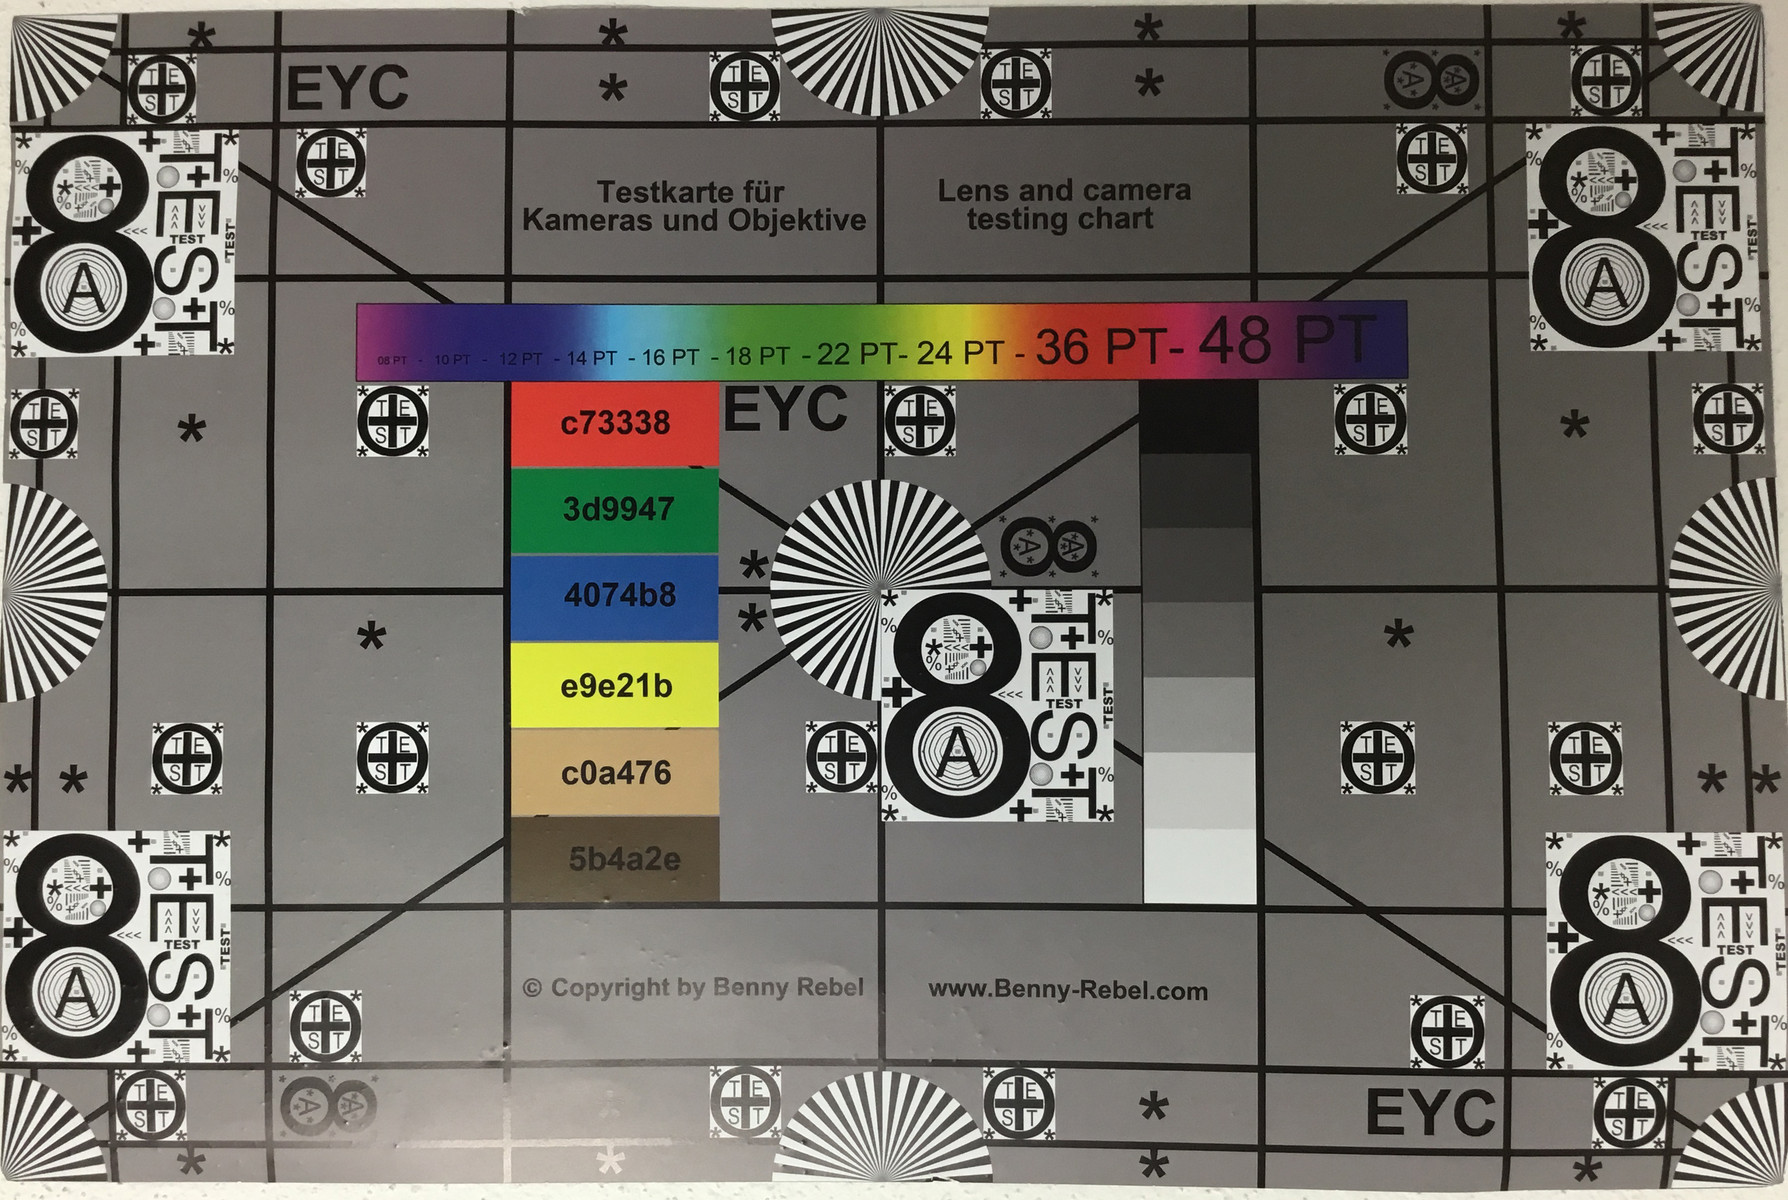
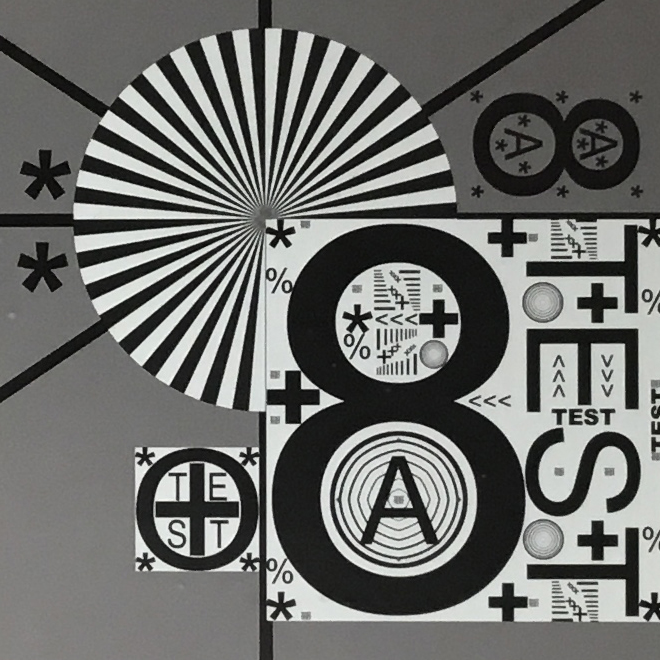
A comparison between the CalMAN Passport and our pictures shows that the camera of the new iPad records colors slightly too saturated. This results in very vivid pictures, but does not represent reality. Overall, however, the colors are close to their respective references, and we cannot notice a color cast. That 8 MP do not necessarily ensure a very sharp result is evident when you see the picture of the reference chart. The edges in particular are a bit blurry, and we can see frayed edges at the numbers and letters. The central segment confirms this impression.
Accessories and Warranty
The scope of delivery does not offer any surprises, but we did not expect any to begin with. Besides the mandatory power adapter (10 W) and the Lightning-to-USB cable, the LTE model is also shipped with the typical Apple SIM-card tool. You also get some service brochures.
The Apple Store offers many optional accessories. You can find almost everything starting with covers, cases, cables, and adapters all the way up to wall mounts.
Apple only grants a 12-month warranty, but offers an additional hardware protection called AppleCare+ for 99 Euros ($99), which must be added within 60 days of the purchase. It will extend the service period to two years and covers two accidental repairs, each subject to a 49 Euros ($49) service fee. 24 months phone support is included as well.
Please see our Guarantees, Return Policies and Warranties FAQ for country-specific information.
Input Devices and Handling
This is probably the section with the least amount of new information. The input devices, more precisely the touchscreen and the physical buttons, hardly changed on the iPad models over the last couple of years. The Apple iPad (2017) does not support the Apple Pencil, so we cannot say anything about that, either. The touchscreen of the new iPad works as usual: quick, reliable, precise. The physical buttons are carefully implemented and provide a good pressure point. The fingerprint scanner Touch ID is also available for the 2017 iPad and works flawlessly.
Display
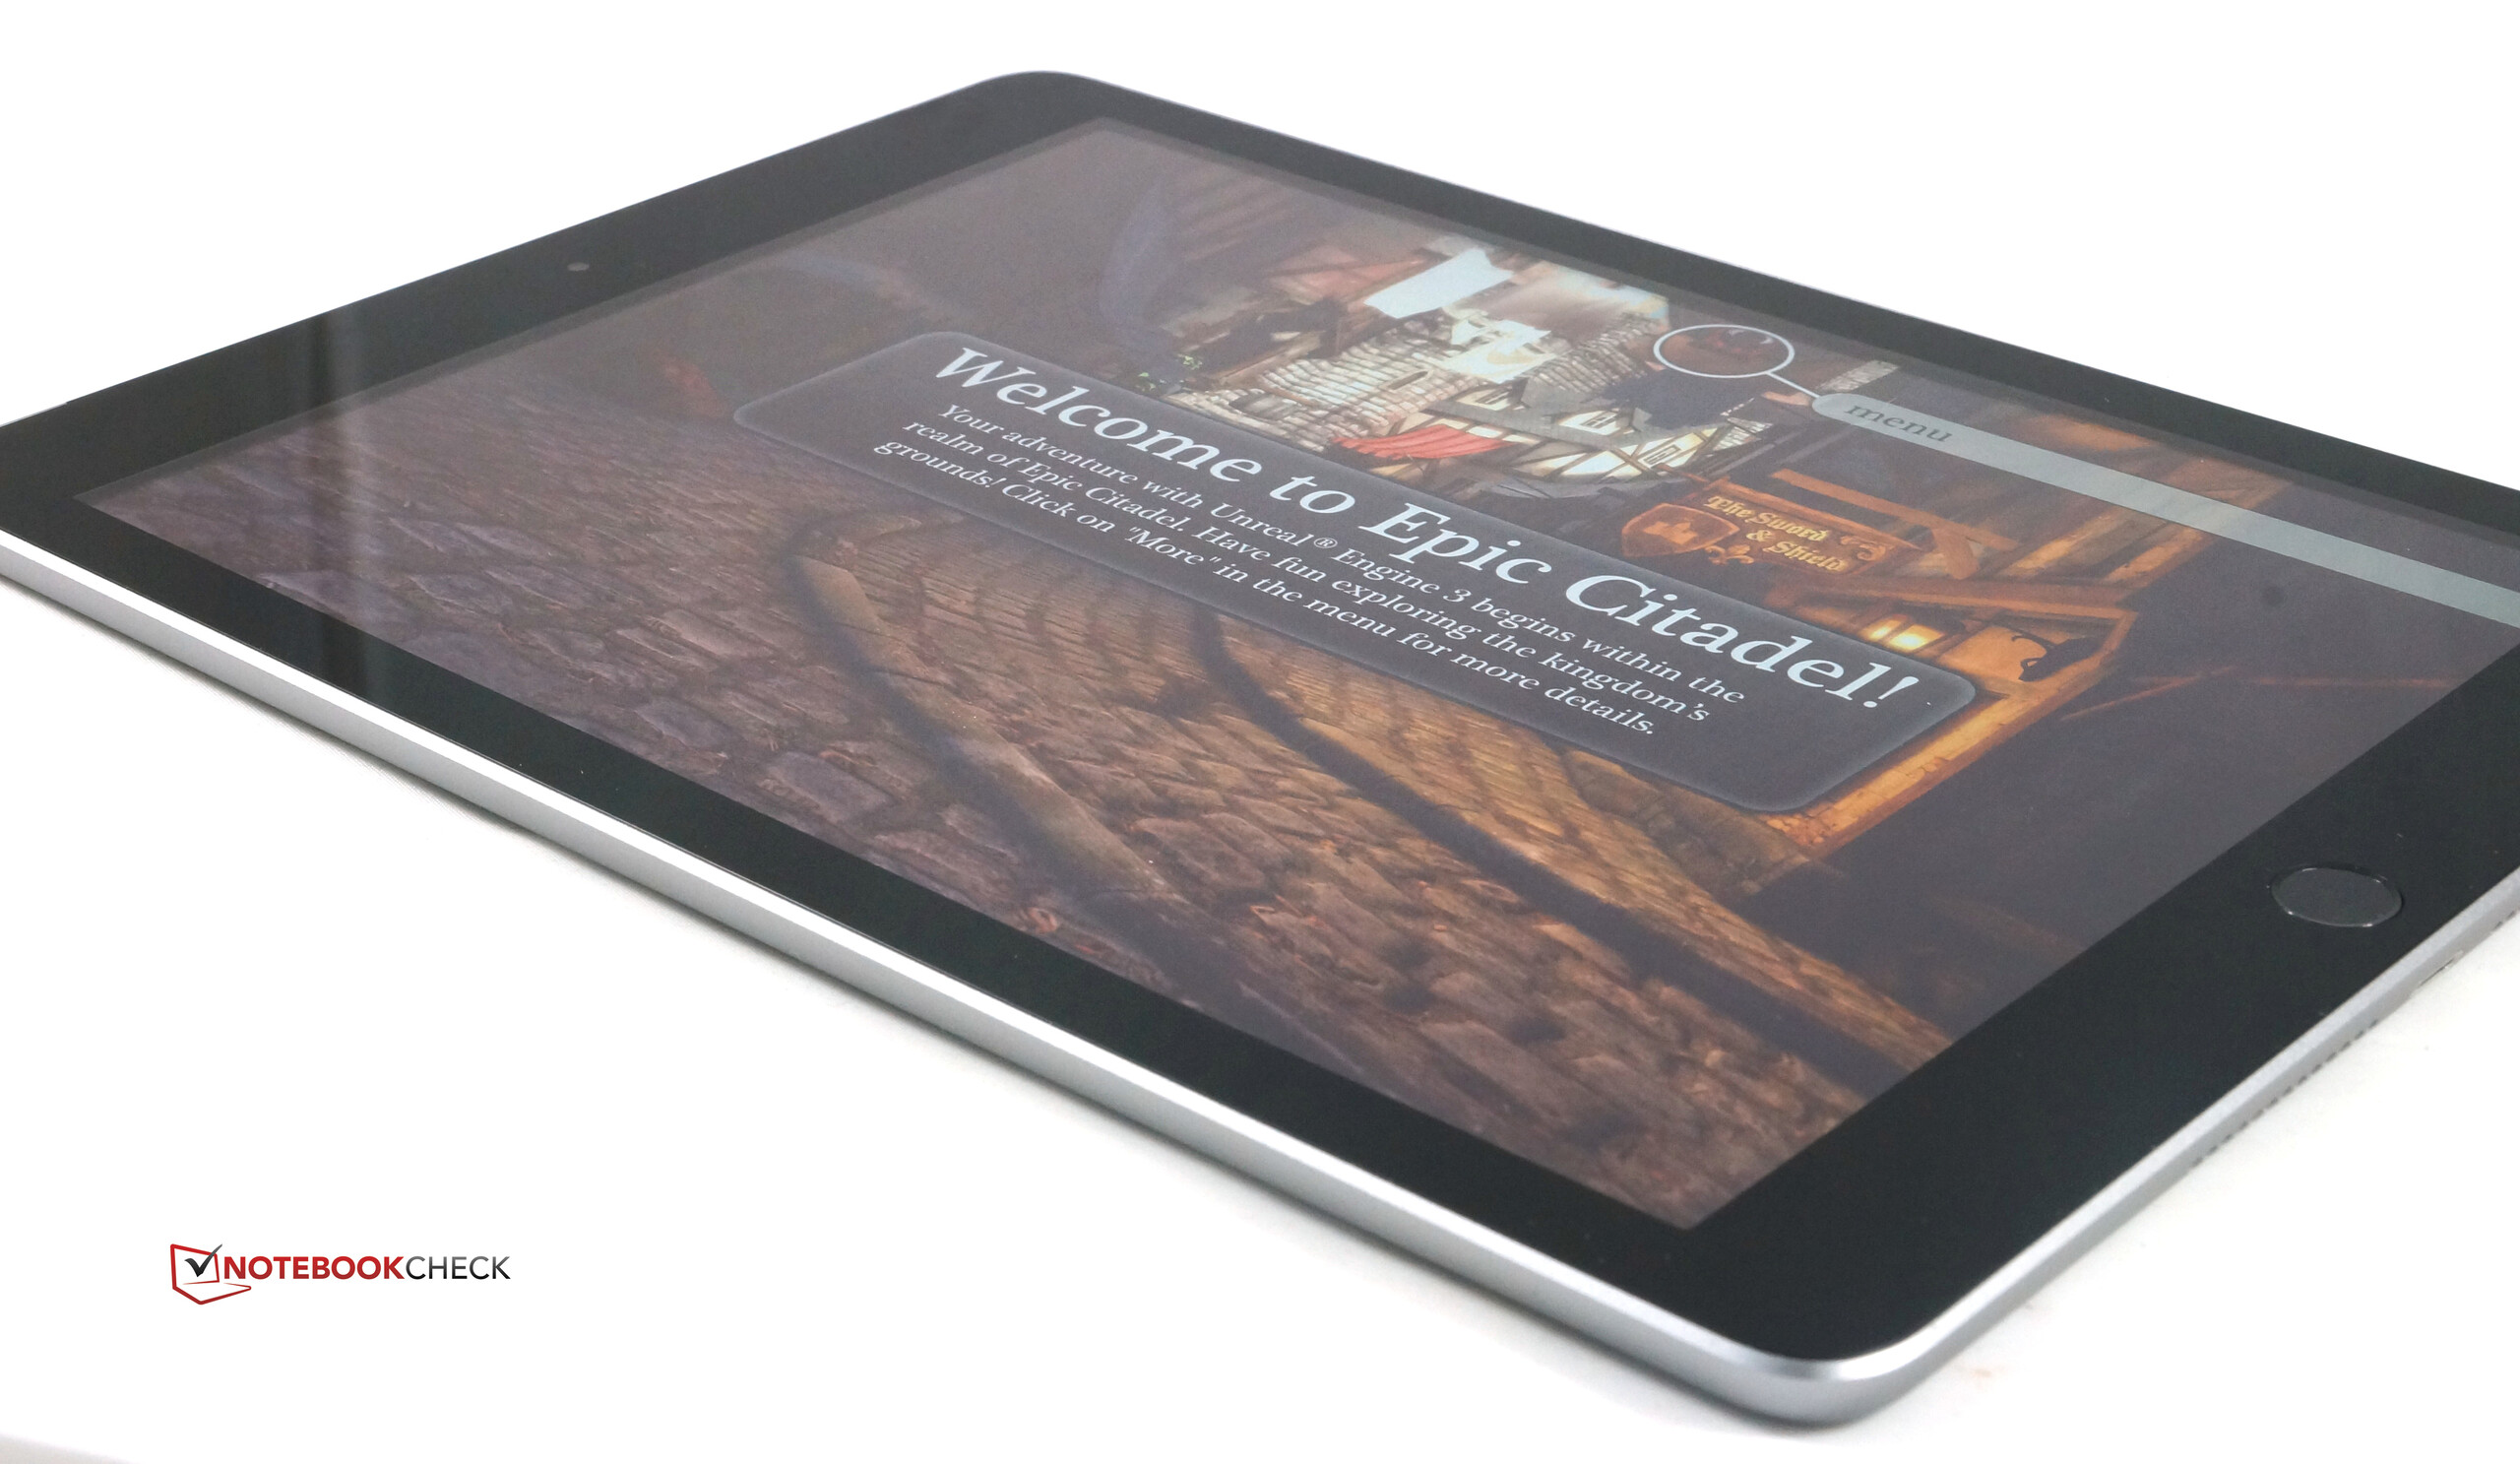
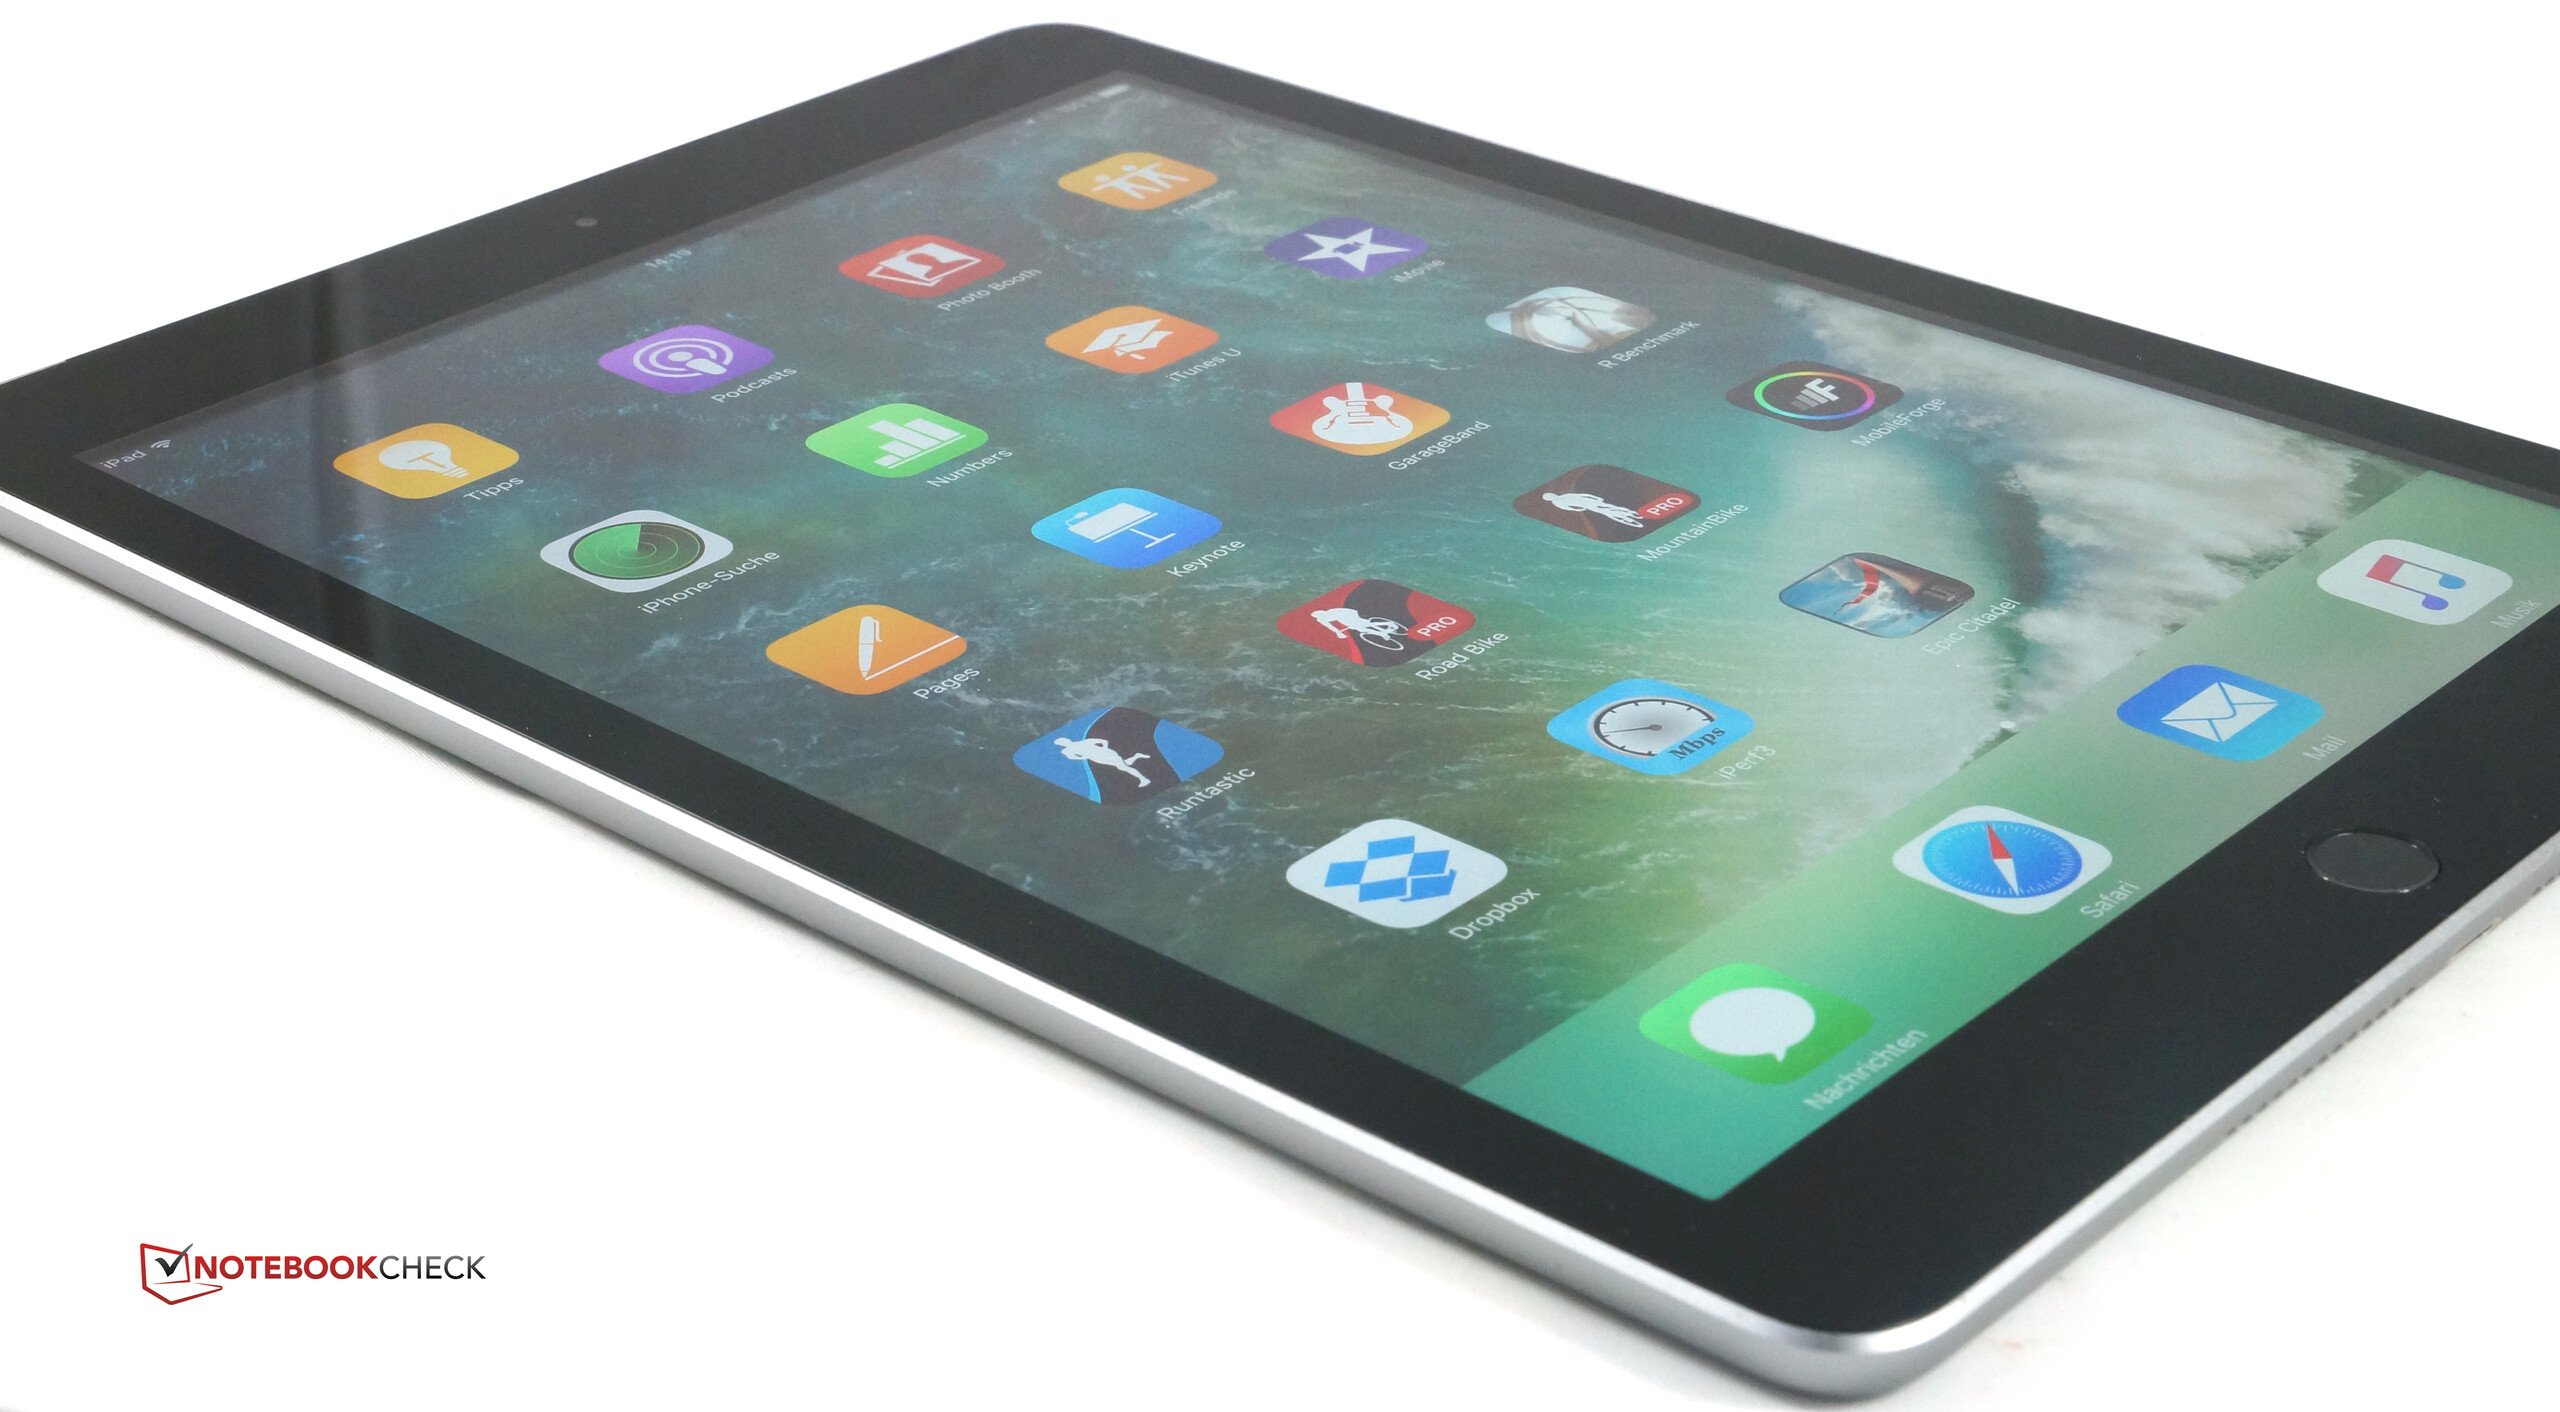
Neither the size nor the resolution – once again – changed compared to the previous models, but Apple still claims they have changed or improved it, respectively. The new screen is primarily supposed to be brighter compared to the iPad Air & iPad Air 2. Not a bad idea in general, but it seems Apple wants to use the higher luminance to hide a drawback compared to the current generation: The display of the new iPad is not fully laminated, which was still the case for the iPad Air 2. Apple could reduce annoying reflections to a minimum with this technology, and it was one of the big advantages over the competition. The wide color gamut from the iPad Air 2 and the Pro model is also gone, although this is probably not a deal-breaker for most users, especially considering the affordable price.
But let's get back to the measurement results for the 9.7-inch screen with the 4:3 aspect ratio. The panel is based on the IPS technology, but we did not expect anything else at this price point. The resolution is also unchanged at 2048x1536 pixels, which results in a pixel density of 264 PPI. This does not set any records anymore, but it is still sufficient for crisp contents. We cannot confirm the supposedly grease repellant display coating; it did not really work for the predecessors, either.
One thing that works is the increased luminance compared to the iPad Air, just as Apple promised. The maximum luminance is now 514 nits vs. 473 nits on the Air. The average luminance for the new model is still 485 nits – about 10 percent more compared to the previous model. The brightness distribution took a small hit, but 88 percent is still a decent result, just like the contrast ratio (1117:1), which is also just beaten by the iPad Air. This is due to the slightly increased black value (0.46); other devices perform better in this respect.
| |||||||||||||||||||||||||
Brightness Distribution: 88 %
Center on Battery: 514 cd/m²
Contrast: 1117:1 (Black: 0.46 cd/m²)
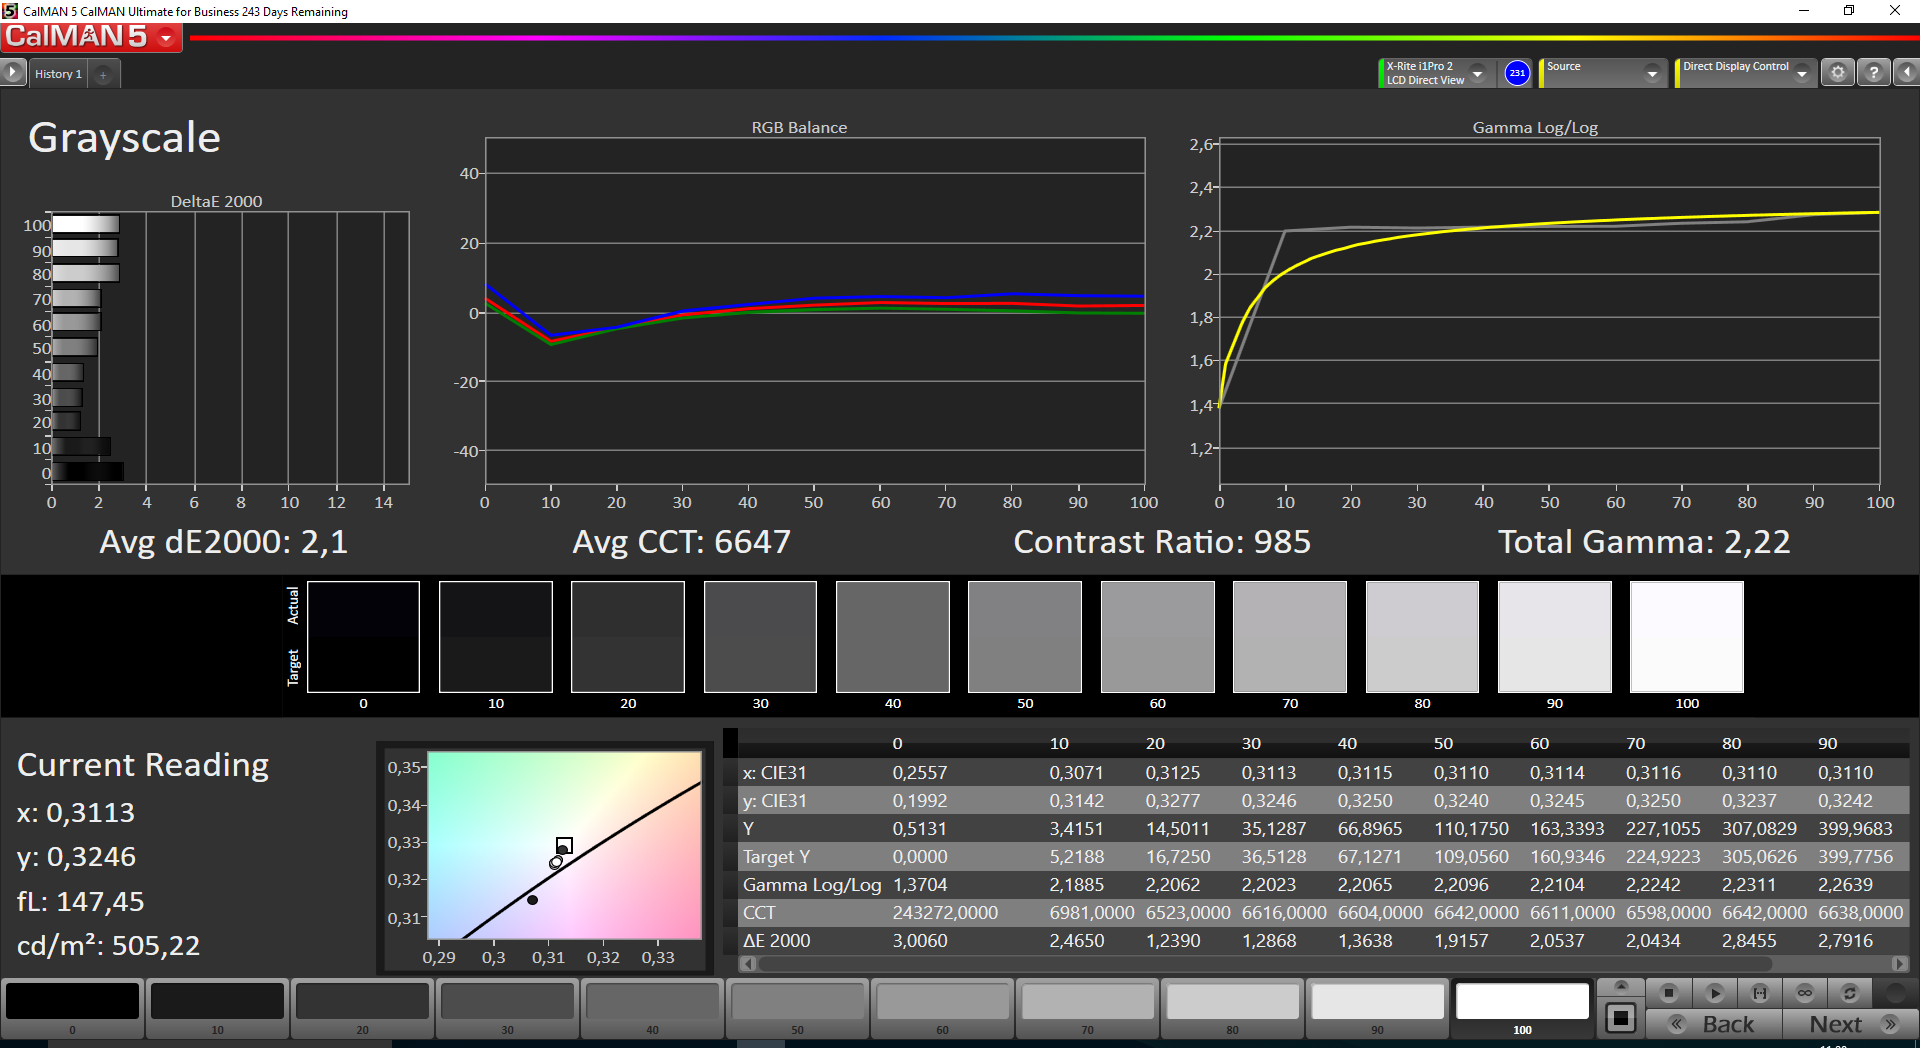
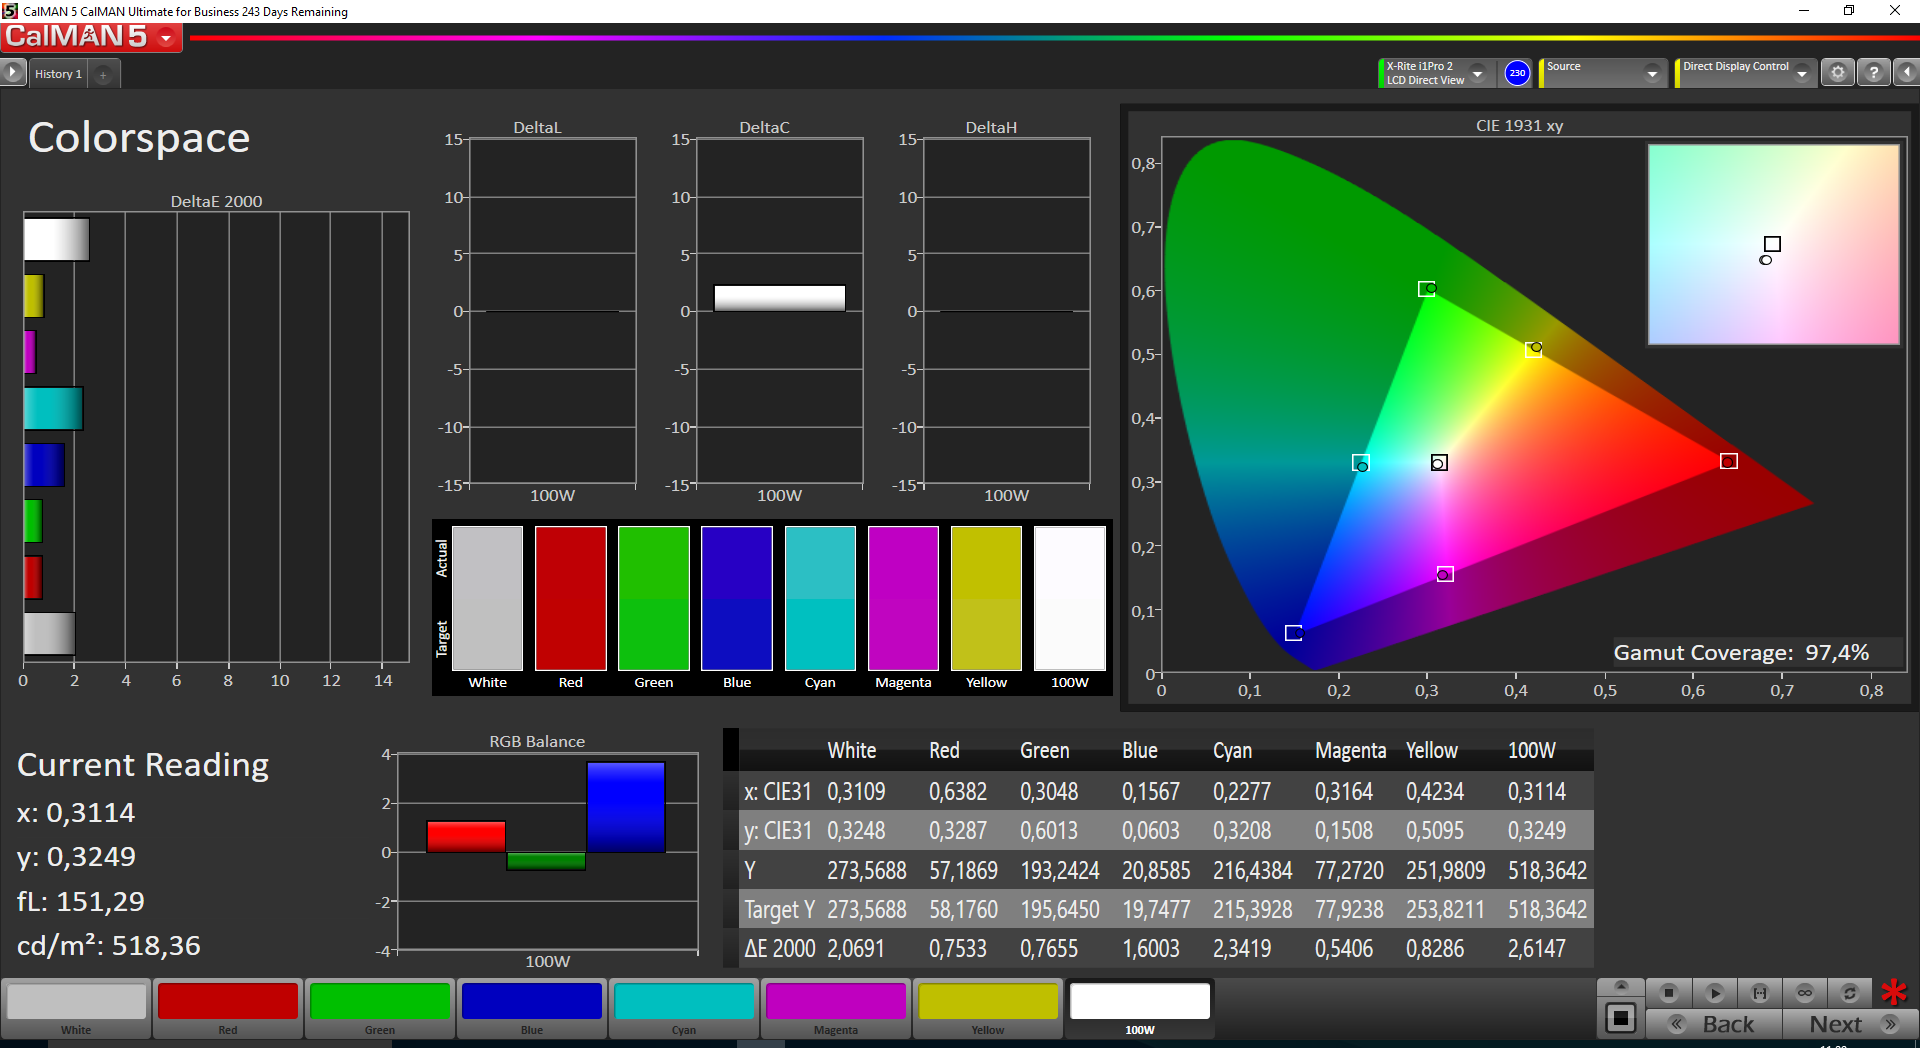
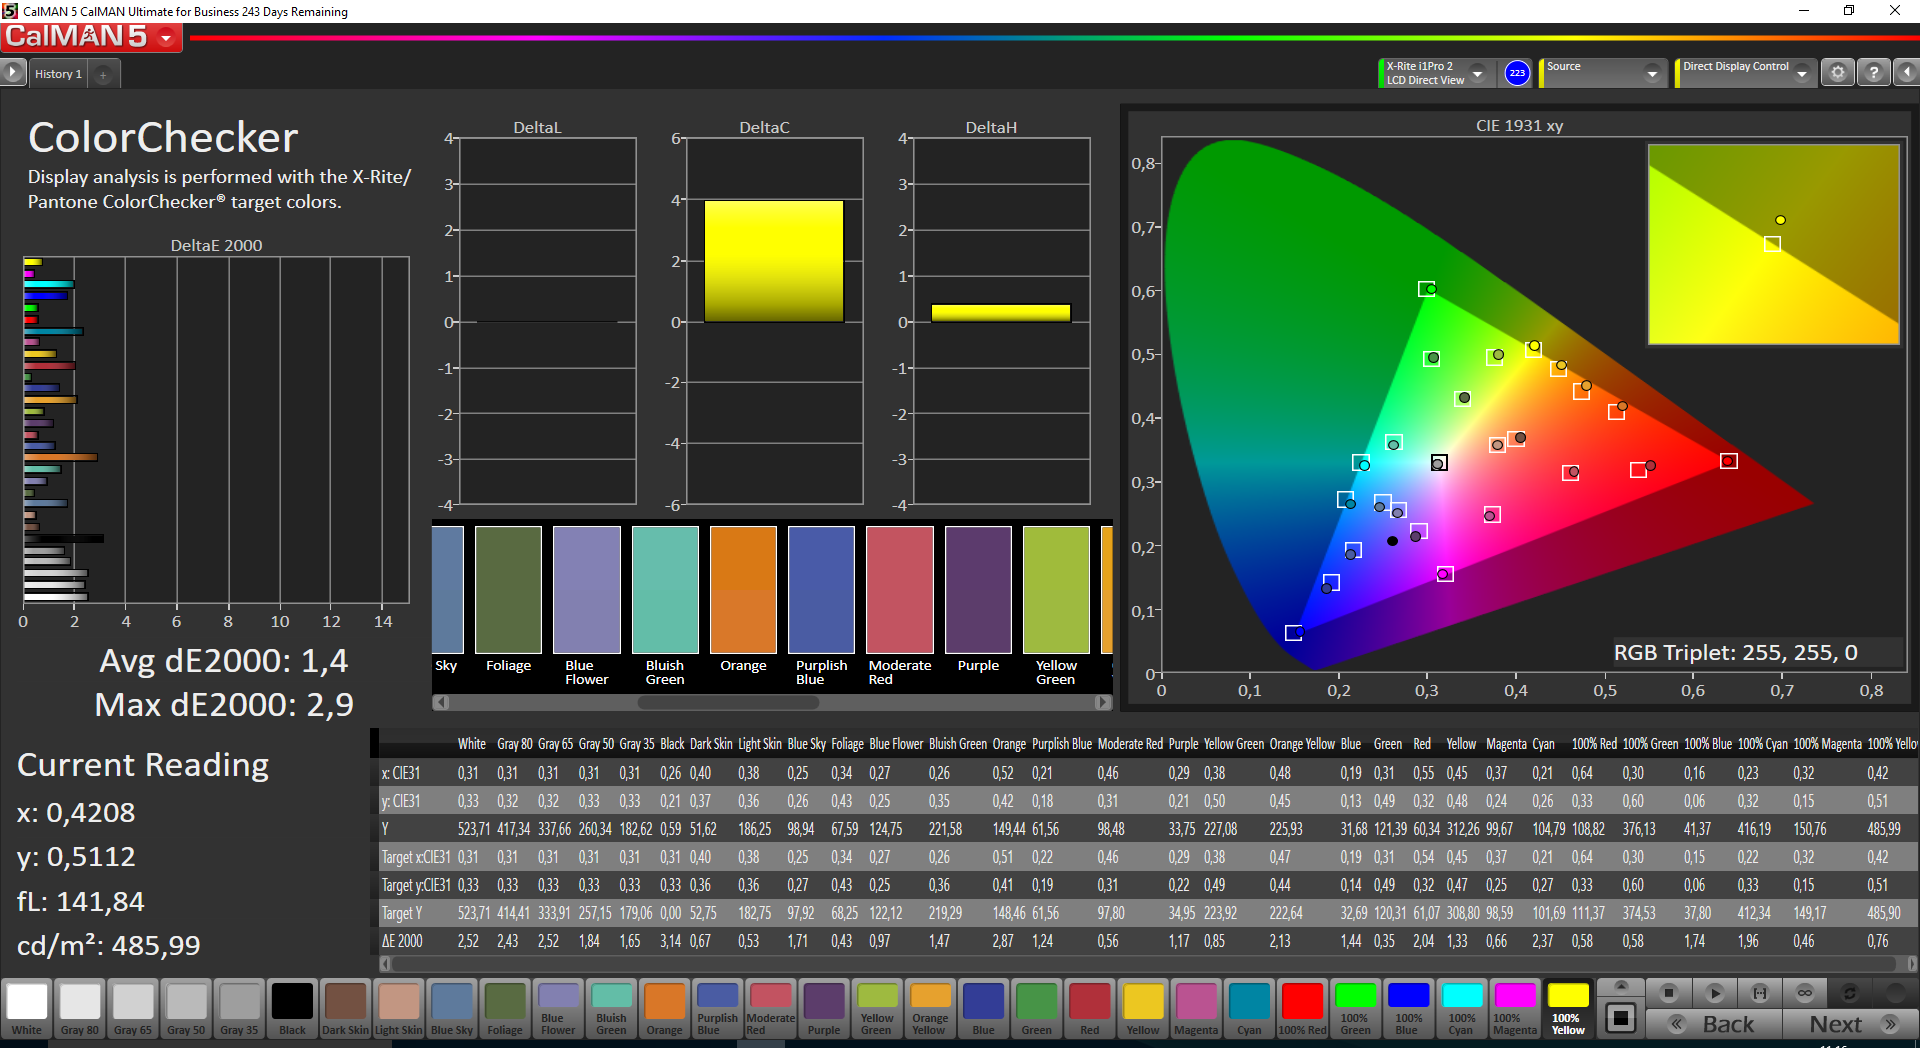
ΔE ColorChecker Calman: 1.4 | ∀{0.5-29.43 Ø4.71}
ΔE Greyscale Calman: 2.1 | ∀{0.09-98 Ø4.96}
97.4% sRGB (Calman 2D)
Gamma: 2.22
CCT: 6647 K
| Apple iPad (2017) IPS, 2048x1536, 9.7" | Apple iPad Air 1 2013 IPS, 2048x1536, 9.7" | Apple iPad Pro 9.7 IPS, 2048x1536, 9.7" | Apple iPad Pro 12.9 IPS, 2732x2048, 12.9" | Google Pixel C LTPS, 2560x1800, 10.2" | Huawei MediaPad T2 10.0 Pro IPS, 1920x1200, 10.1" | |
|---|---|---|---|---|---|---|
| Screen | -10% | 10% | -11% | -75% | -79% | |
| Brightness middle (cd/m²) | 514 | 473 -8% | 523 2% | 399 -22% | 487 -5% | 392 -24% |
| Brightness (cd/m²) | 485 | 442 -9% | 500 3% | 393 -19% | 510 5% | 385 -21% |
| Brightness Distribution (%) | 88 | 90 2% | 93 6% | 92 5% | 91 3% | 91 3% |
| Black Level * (cd/m²) | 0.46 | 0.41 11% | 0.52 -13% | 0.22 52% | 0.39 15% | 0.59 -28% |
| Contrast (:1) | 1117 | 1154 3% | 1006 -10% | 1814 62% | 1249 12% | 664 -41% |
| Colorchecker dE 2000 * | 1.4 | 2.82 -101% | 1.1 21% | 2.96 -111% | 5.24 -274% | 4.5 -221% |
| Colorchecker dE 2000 max. * | 2.9 | 1.9 34% | 7.8 -169% | |||
| Greyscale dE 2000 * | 2.1 | 1.45 31% | 1.4 33% | 3 -43% | 7.95 -279% | 4.8 -129% |
| Gamma | 2.22 99% | 2.47 89% | 2.11 104% | 2.21 100% | 2.16 102% | 2.47 89% |
| CCT | 6647 98% | 6768 96% | 6662 98% | 7049 92% | 6565 99% | 7426 88% |
| Color Space (Percent of AdobeRGB 1998) (%) | 62.97 | 71.15 | ||||
| Color Space (Percent of sRGB) (%) | 99.55 | 97.87 |
* ... smaller is better
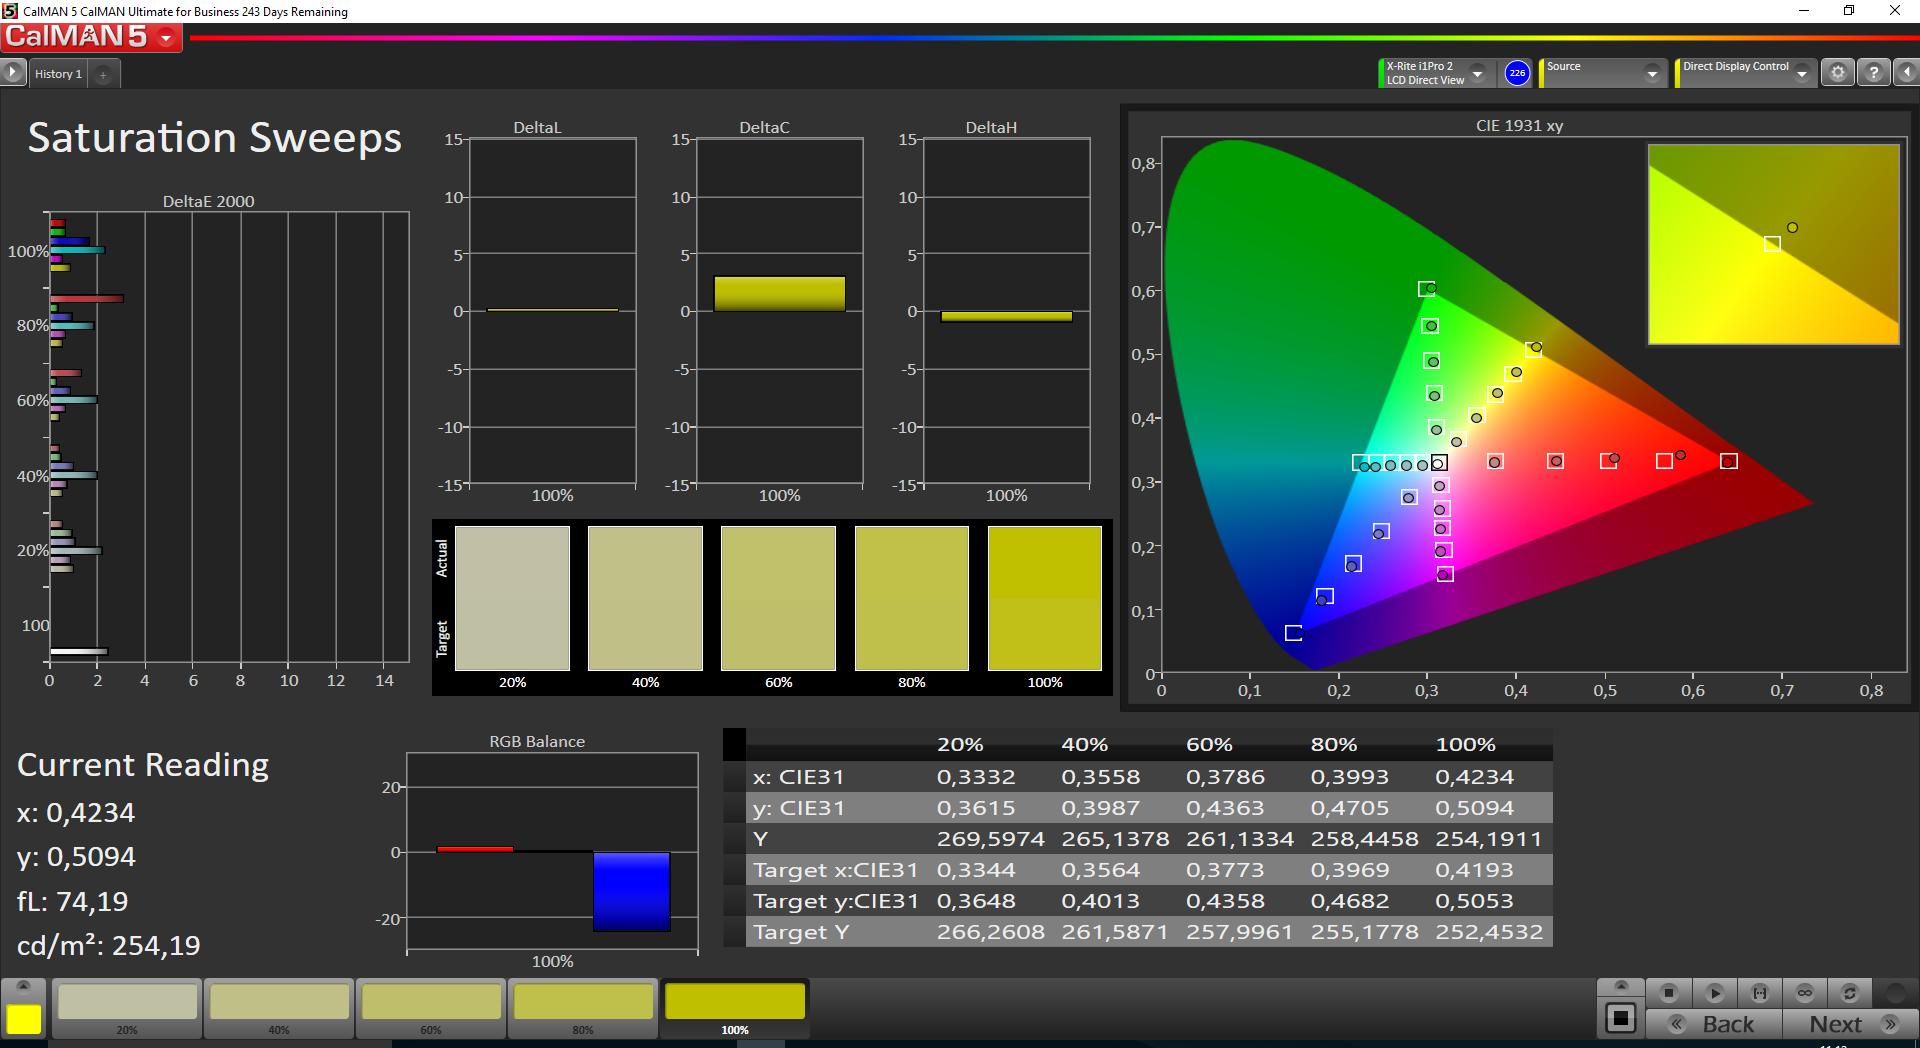
The slightly raised black value is one of the few criticisms we have for the display of the new iPad. Black contents have a gray hue at the full luminance, but there are no problems with the picture quality at practical brightness levels. This is the case for the grayscale as well as the colors. Apple waives the extended P3 color space, but sRGB is covered completely; color temperature and gamma value are also close to their respective ideal values. The deviations are not visible with the naked eye. One small drawback is the performance with orange/red colors, but you will still need a very trained eye to notice the deviations.
Screen Flickering / PWM (Pulse-Width Modulation)
| Screen flickering / PWM not detected | 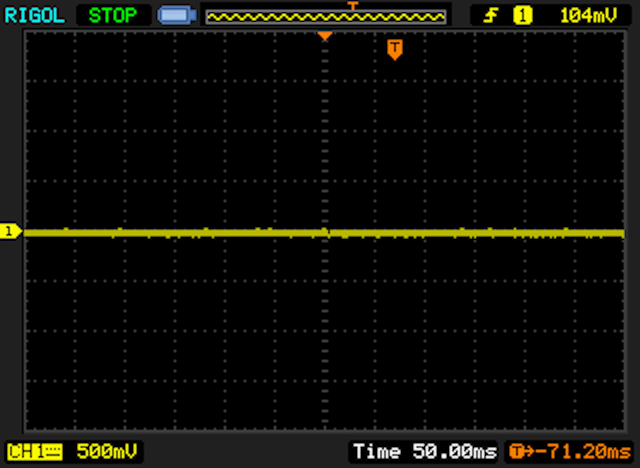 | ||
In comparison: 52 % of all tested devices do not use PWM to dim the display. If PWM was detected, an average of 7748 (minimum: 5 - maximum: 343500) Hz was measured. | |||
Display Response Times
| ↔ Response Time Black to White | ||
|---|---|---|
| 26 ms ... rise ↗ and fall ↘ combined | ↗ 15 ms rise | 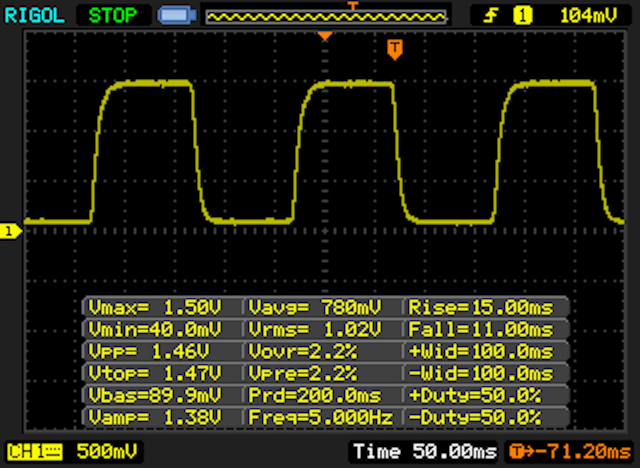 |
| ↘ 11 ms fall | ||
| The screen shows relatively slow response rates in our tests and may be too slow for gamers. In comparison, all tested devices range from 0.1 (minimum) to 240 (maximum) ms. » 63 % of all devices are better. This means that the measured response time is worse than the average of all tested devices (19.8 ms). | ||
| ↔ Response Time 50% Grey to 80% Grey | ||
| 40 ms ... rise ↗ and fall ↘ combined | ↗ 23 ms rise | 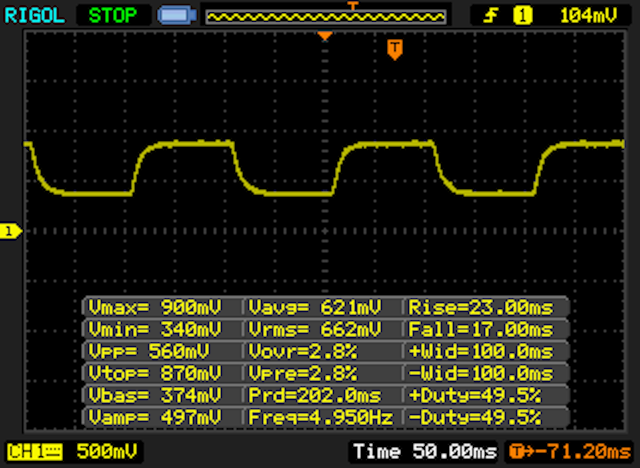 |
| ↘ 17 ms fall | ||
| The screen shows slow response rates in our tests and will be unsatisfactory for gamers. In comparison, all tested devices range from 0.165 (minimum) to 636 (maximum) ms. » 61 % of all devices are better. This means that the measured response time is worse than the average of all tested devices (30.9 ms). | ||
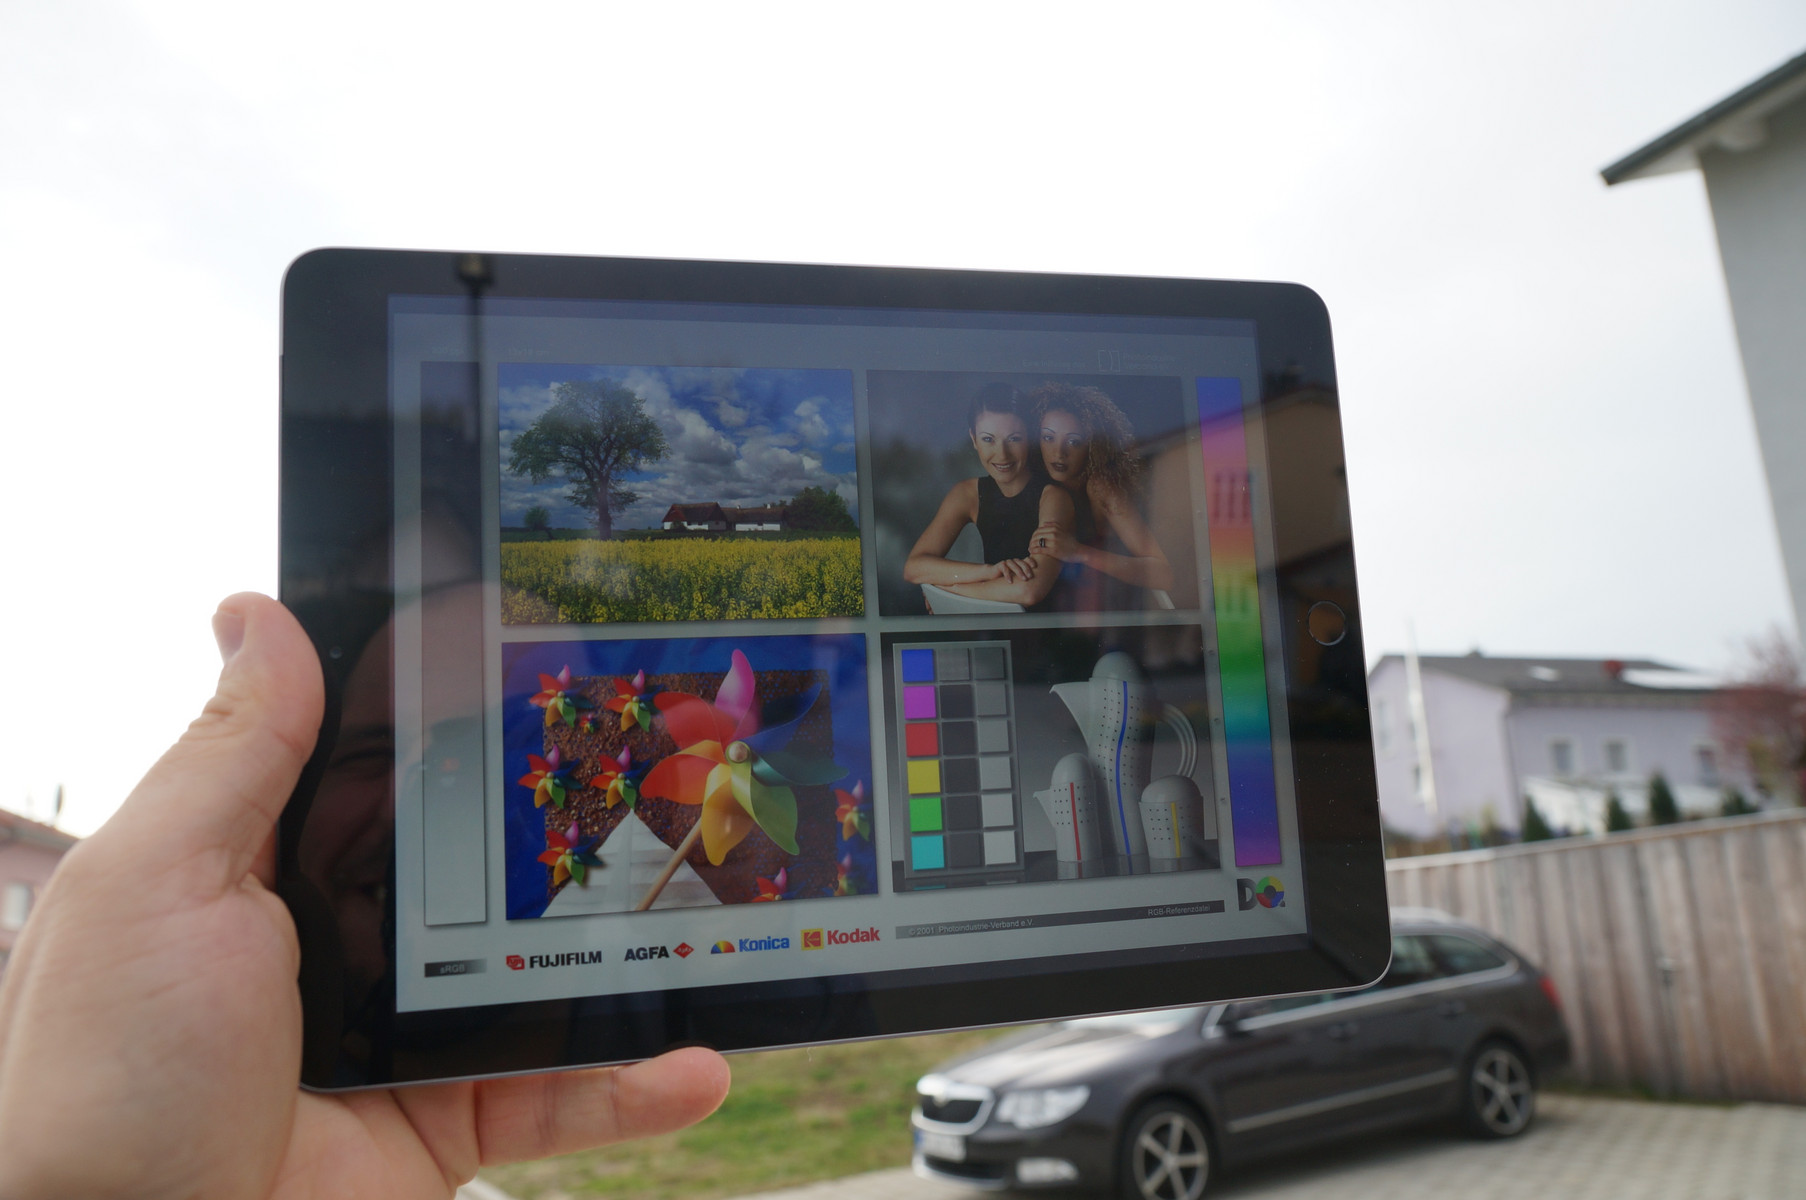
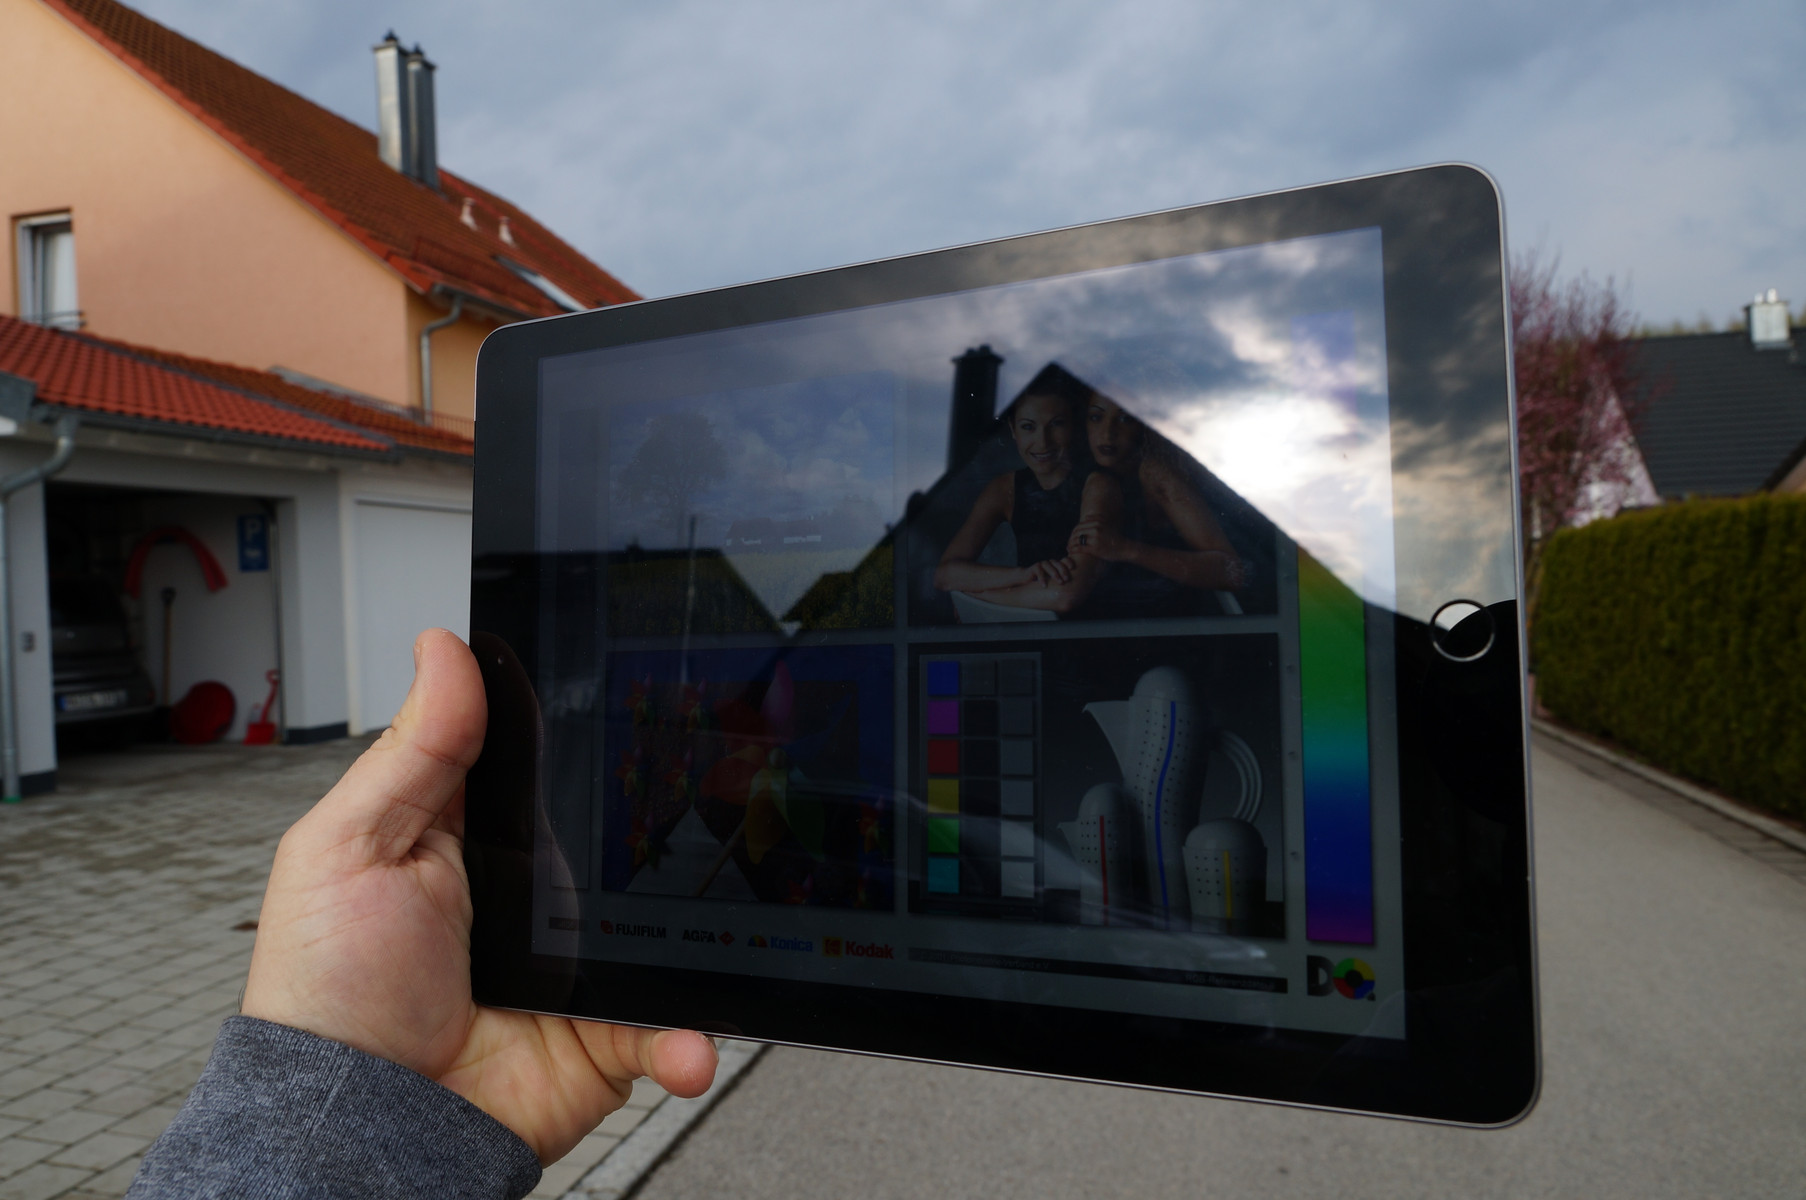
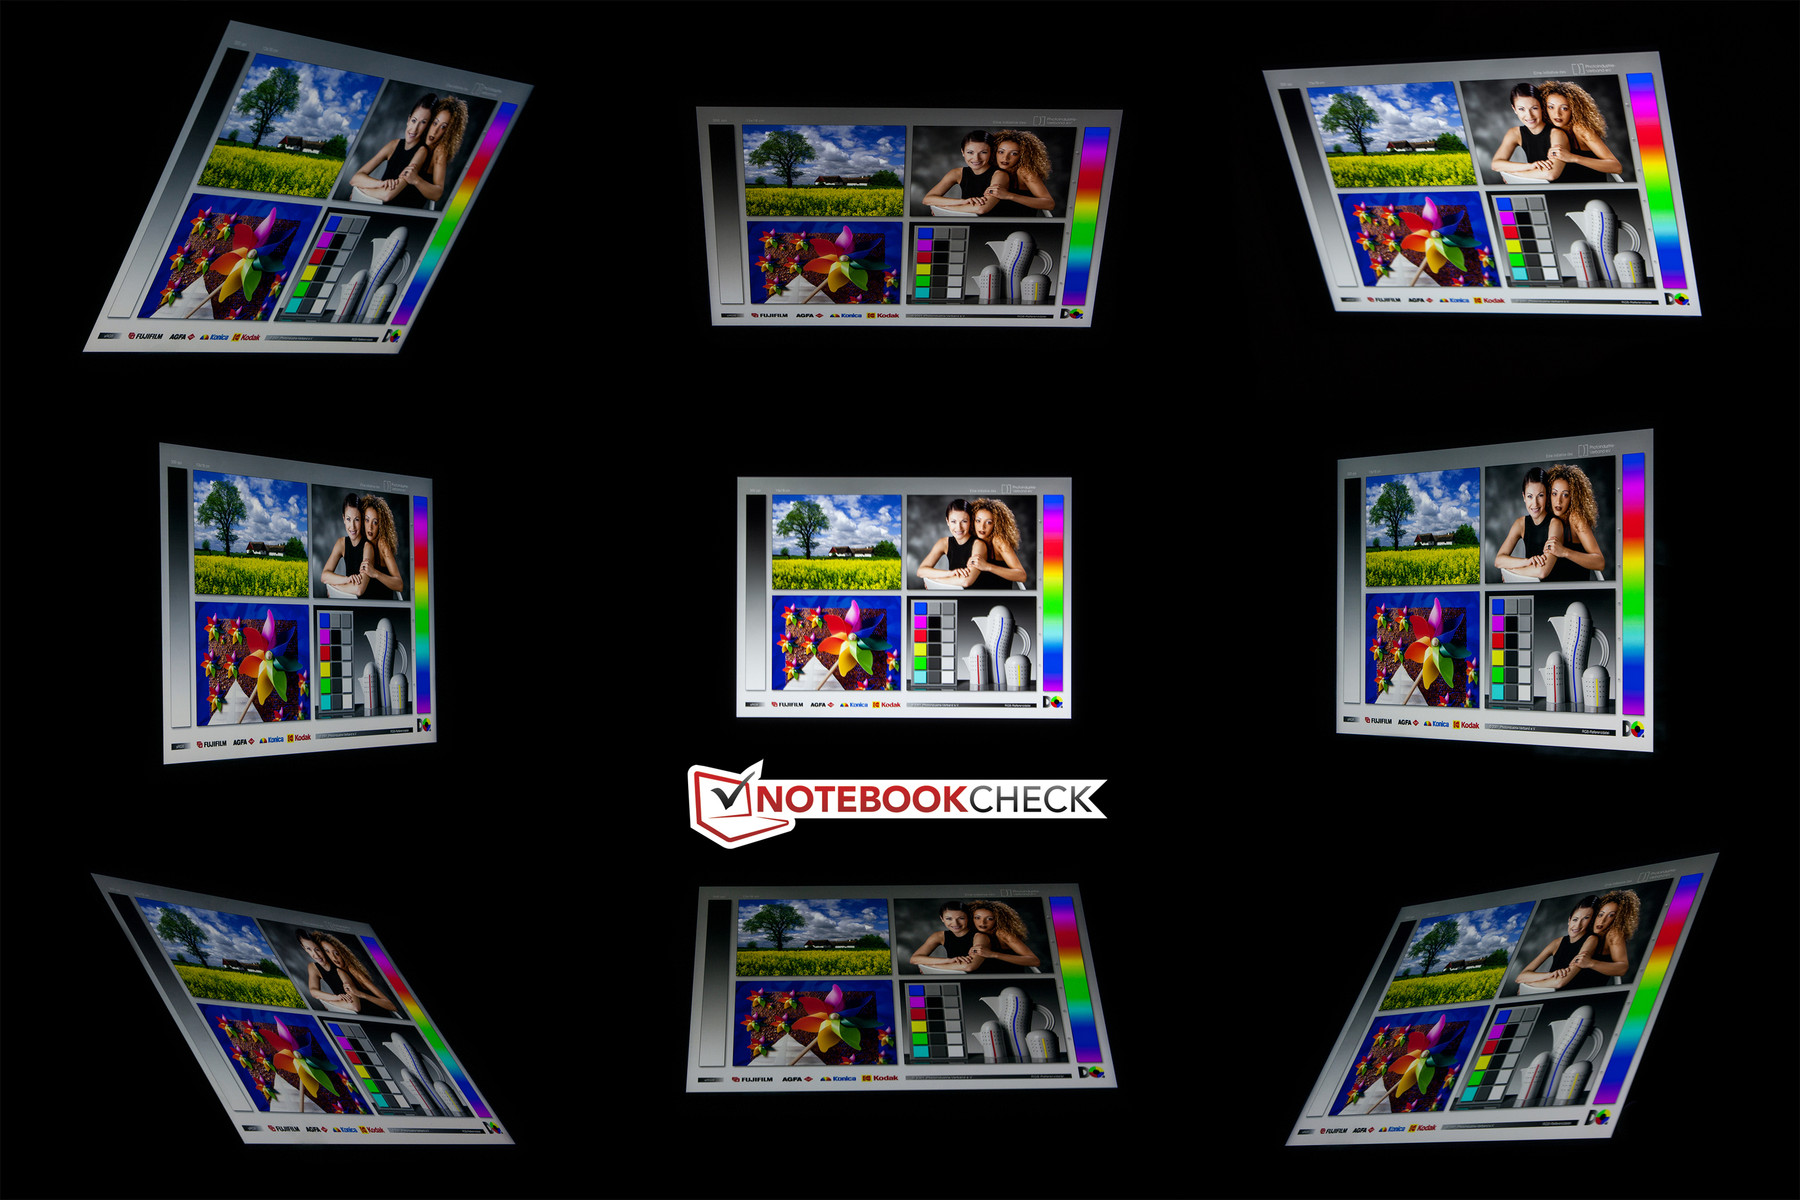
Reflections are another problem of the display on the new Apple iPad. This would be nothing special since we criticize this for pretty much every tablet. However, Apple managed this problem surprisingly well thanks to fully laminated tablet displays. We took some meaningful pictures during our review of the Apple iPad Mini 4. The shots of the iPad 2017 are just as meaningful and show the rediscovery of the "mirror talent" on the latest Apple device. At least the viewing angle stability is excellent.

Performance
Apple uses the A9 chip, so the iPad (2017) is not fully up to date in terms of hardware. The SoC was introduced with the iPhone 6S models back in 2015. The dual-core chip convinces with very good per-MHz performance figures and was the fastest mobile processor at its launch. This can also be said about the accompanying GPU. The PowerVR GT7600 should – just like the processor – still beat the majority of rivals or at least keep up with the best devices today. Memory is – as per usual for Apple – a limited resource: The new iPad is only shipped with 2 GB RAM.
The iPad 2017 performs very well, as expected. It is actually only beaten by its own Pro siblings and the latest Samsung tablet, the Galaxy Tab S3, in some tests. The Google Pixel C on the other hand falls behind in almost every benchmark; it only manages a new high-score in Passmark. Still, the new iPad performs very well across the board without any outliers in any direction.
| AnTuTu v6 - Total Score | |
| Apple iPad Pro 12.9 | |
| Apple iPad Pro 9.7 | |
| Samsung Galaxy Tab S3 SM-T825 | |
| Apple iPhone 7 | |
| Apple iPad (2017) | |
| Google Pixel C | |
| Huawei MediaPad T2 10.0 Pro | |
| GFXBench 3.0 | |
| on screen Manhattan Onscreen OGL | |
| Apple iPhone 7 | |
| Apple iPad Pro 9.7 | |
| Samsung Galaxy Tab S3 SM-T825 | |
| Apple iPad Pro 12.9 | |
| Apple iPad (2017) | |
| Google Pixel C | |
| Huawei MediaPad T2 10.0 Pro | |
| 1920x1080 1080p Manhattan Offscreen | |
| Apple iPad Pro 12.9 | |
| Apple iPhone 7 | |
| Apple iPad Pro 9.7 | |
| Samsung Galaxy Tab S3 SM-T825 | |
| Apple iPad (2017) | |
| Google Pixel C | |
| Huawei MediaPad T2 10.0 Pro | |
| GFXBench 3.1 | |
| on screen Manhattan ES 3.1 Onscreen | |
| Apple iPhone 7 | |
| Apple iPad Pro 12.9 | |
| Apple iPad Pro 9.7 | |
| Samsung Galaxy Tab S3 SM-T825 | |
| Apple iPad (2017) | |
| Google Pixel C | |
| 1920x1080 Manhattan ES 3.1 Offscreen | |
| Apple iPad Pro 12.9 | |
| Apple iPhone 7 | |
| Apple iPad Pro 9.7 | |
| Samsung Galaxy Tab S3 SM-T825 | |
| Google Pixel C | |
| Apple iPad (2017) | |
| Basemark ES 3.1 / Metal - offscreen Overall Score | |
| Apple iPad Pro 12.9 | |
| Apple iPhone 7 | |
| Apple iPhone 7 | |
| Apple iPad Pro 9.7 | |
| Apple iPad (2017) | |
| Google Pixel C | |
| Samsung Galaxy Tab S3 SM-T825 | |
iOS devices are usually the benchmark in terms of browser performance. Even older devices often beat the modern high-end rivals. The Apple iPad (2017) is powered by outdated hardware and therefore falls behind its more powerful siblings, but other tablets are not even close to the new iPad. This is noticed in practice: The iPad is – once again – a real browsing machine.
| Octane V2 - Total Score | |
| Apple iPhone 7 | |
| Apple iPad Pro 12.9 | |
| Apple iPad Pro 9.7 | |
| Apple iPad (2017) | |
| Samsung Galaxy Tab S3 SM-T825 | |
| Google Pixel C | |
| Apple iPad Air 1 2013 | |
| Huawei MediaPad T2 10.0 Pro | |
| Mozilla Kraken 1.1 - Total | |
| Huawei MediaPad T2 10.0 Pro | |
| Apple iPad Air 1 2013 | |
| Google Pixel C | |
| Samsung Galaxy Tab S3 SM-T825 | |
| Apple iPad Pro 9.7 | |
| Apple iPad Pro 12.9 | |
| Apple iPad (2017) | |
| Apple iPhone 7 | |
| JetStream 1.1 - 1.1 Total | |
| Apple iPhone 7 | |
| Apple iPad Pro 9.7 | |
| Apple iPad Pro 12.9 | |
| Apple iPad (2017) | |
| Google Pixel C | |
| Samsung Galaxy Tab S3 SM-T825 | |
| Huawei MediaPad T2 10.0 Pro | |
| WebXPRT 2015 - Overall | |
| Apple iPad Pro 9.7 | |
| Apple iPad Pro 12.9 | |
| Apple iPad (2017) | |
| Apple iPhone 7 | |
| Samsung Galaxy Tab S3 SM-T825 | |
| Google Pixel C | |
| Huawei MediaPad T2 10.0 Pro | |
* ... smaller is better
We cannot use AndroBench, which we use on Android devices, on iOS tablets. We therefore rely on Passmark Performance Mobile as well as Basemark OS II to check the performance of the NVMe storage. Both determine a storage score, which indicates the performance. The new iPad is once again beaten by its more powerful siblings, but most rivals fall behind.
| PassMark PerformanceTest Mobile V1 - Disk Tests | |
| Apple iPad Pro 12.9 | |
| Apple iPad Pro 9.7 | |
| Apple iPad (2017) | |
| Apple iPhone 7 | |
| Apple iPad Air 1 2013 | |
| Google Pixel C | |
| BaseMark OS II - Memory | |
| Apple iPad Pro 9.7 | |
| Apple iPad Pro 12.9 | |
| Samsung Galaxy Tab S3 SM-T825 | |
| Apple iPad (2017) | |
| Apple iPhone 7 | |
| Google Pixel C | |
| Huawei MediaPad T2 10.0 Pro | |
Games
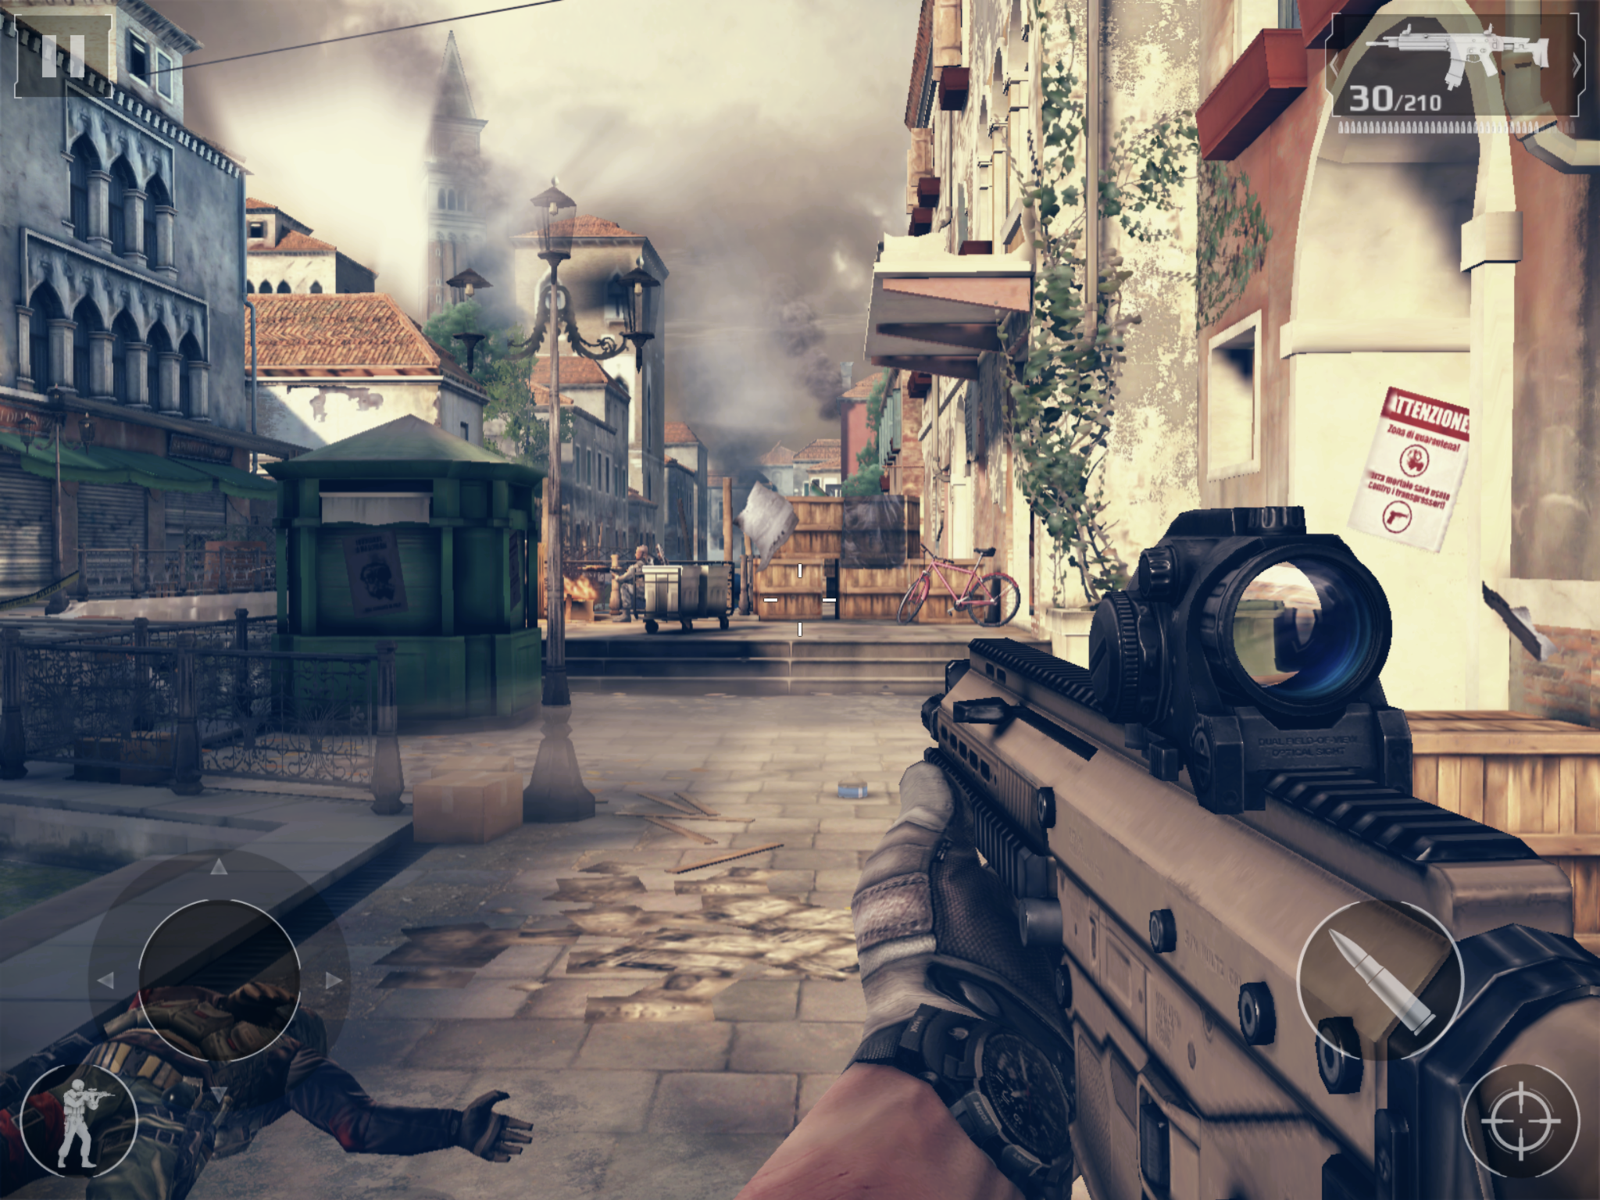
Apple has one advantage: Hardware and software are provided by the same company, and Apple also controls the access to the App Store. This means that even demanding apps and games will run smoothly on slightly outdated systems. The new iPad has no problems in this regard, either. The A9 chip and the GT7600 in particular are more than powerful enough for every game from the App Store. We tested the racing game Asphalt 8: Airborne and the first-person shooter Modern Combat 5. Both titles run completely smoothly. The iPad also convinces with a very responsive touchscreen and a sensitive position sensor. Gaming on the inexpensive iPad is a joy.

Emissions
Temperature
The A9 chip is manufactured in a significantly smaller process compared to the A7 SoC from the original Apple iPad Air. This increases the performance, but is also supposed to reduce the power consumption and the temperature development. At least the latter is definitely the case for the new iPad. All the temperatures are lower compared to the predecessor. There is a small hotspot at the center of the right edge, but even this spot is hardly more than lukewarm – even after one hour maximum load that we test with the Relative Benchmark. There is still some criticism for Apple: At around 47 °C (~117 °F), the power adapter is getting almost inconveniently warm, but there is no risk of burns or the like. For the sake of completeness: We measure up to 33.3 °C (~92 °F) while idling with an average of about 31 °C (~88 °F). The power adapter is once again comparatively warm at almost 40 °C (104 °F).
(+) The maximum temperature on the upper side is 35.2 °C / 95 F, compared to the average of 33.7 °C / 93 F, ranging from 20.7 to 53.2 °C for the class Tablet.
(+) The bottom heats up to a maximum of 37.7 °C / 100 F, compared to the average of 33.2 °C / 92 F
(+) In idle usage, the average temperature for the upper side is 31 °C / 88 F, compared to the device average of 30 °C / 86 F.
Speakers
The two speakers at the bottom edge of the fifth Apple iPad are at the same position compared to the original iPad Air and the sound experience is very familiar as well. The position is not perfect, but you will at least rarely cover both modules at the same time in landscape mode.
The quality of the components, however, is surprisingly good. Mids and highs are very linear, but there is slightly too much emphasis on the high tones. The result is a slightly harsh sound with a focus on voices. There is hardly any bass, which is no surprise. The speakers are also quite loud at up to 86 dB(A) and they work well for media playback at average volume levels.
Subjectively, the stereo jack provides a clear and noise-free signal.
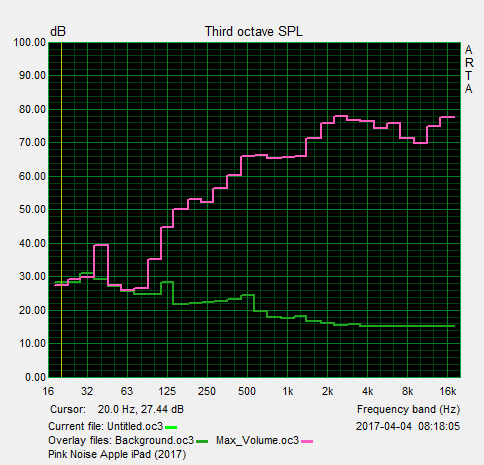
Apple iPad (2017) audio analysis
(+) | speakers can play relatively loud (86.1 dB)
Bass 100 - 315 Hz
(-) | nearly no bass - on average 17.5% lower than median
(±) | linearity of bass is average (10.8% delta to prev. frequency)
Mids 400 - 2000 Hz
(+) | balanced mids - only 2.8% away from median
(+) | mids are linear (5.3% delta to prev. frequency)
Highs 2 - 16 kHz
(±) | higher highs - on average 8.5% higher than median
(+) | highs are linear (3.9% delta to prev. frequency)
Overall 100 - 16.000 Hz
(±) | linearity of overall sound is average (19% difference to median)
Compared to same class
» 52% of all tested devices in this class were better, 5% similar, 43% worse
» The best had a delta of 7%, average was 20%, worst was 129%
Compared to all devices tested
» 45% of all tested devices were better, 7% similar, 47% worse
» The best had a delta of 4%, average was 23%, worst was 134%
Apple iPad Pro 9.7 audio analysis
(+) | speakers can play relatively loud (90.6 dB)
Bass 100 - 315 Hz
(-) | nearly no bass - on average 23.2% lower than median
(±) | linearity of bass is average (8.6% delta to prev. frequency)
Mids 400 - 2000 Hz
(+) | balanced mids - only 4.7% away from median
(+) | mids are linear (4.9% delta to prev. frequency)
Highs 2 - 16 kHz
(+) | balanced highs - only 4.6% away from median
(+) | highs are linear (4.1% delta to prev. frequency)
Overall 100 - 16.000 Hz
(±) | linearity of overall sound is average (16.8% difference to median)
Compared to same class
» 41% of all tested devices in this class were better, 4% similar, 55% worse
» The best had a delta of 7%, average was 20%, worst was 129%
Compared to all devices tested
» 30% of all tested devices were better, 7% similar, 63% worse
» The best had a delta of 4%, average was 23%, worst was 134%
Frequency Comparison (Checkboxes select/deselectable!)
Energy Management
Power Consumption
The smaller manufacturing process of the A9 compared to the A7 is also supposed to reduce the power consumption. We cannot confirm this. However, there are more factors in play here, like the processor clocks, the brighter panel and other components. This also explains why the new iPad (2017) consumes between 5-20% more than the original iPad Air in every situation. It is not very efficient compared to other tablets, either.
| Off / Standby | |
| Idle | |
| Load |
|
Key:
min: | |
| Apple iPad (2017) 8.827 mAh | Apple iPad Pro 9.7 7306 mAh | Apple iPad Pro 12.9 10307 mAh | Apple iPad Air 1 2013 mAh | Google Pixel C mAh | Huawei MediaPad T2 10.0 Pro 6600 mAh | |
|---|---|---|---|---|---|---|
| Power Consumption | 5% | -31% | 15% | 16% | 34% | |
| Idle Minimum * (Watt) | 2.06 | 1.71 17% | 2.69 -31% | 1.8 13% | 1.82 12% | 1.58 23% |
| Idle Average * (Watt) | 7.42 | 7.55 -2% | 10.95 -48% | 5.9 20% | 4.26 43% | 4.12 44% |
| Idle Maximum * (Watt) | 7.47 | 7.62 -2% | 11.14 -49% | 7.1 5% | 4.33 42% | 4.15 44% |
| Load Average * (Watt) | 9.45 | 8.39 11% | 11.54 -22% | 7.5 21% | 9.82 -4% | 6.2 34% |
| Load Maximum * (Watt) | 12.31 | 12.08 2% | 12.8 -4% | 10.4 16% | 13.99 -14% | 9.27 25% |
* ... smaller is better
Battery Runtime
The capacity of the lithium-polymer battery did not change compared to the iPad Air and is still 32.4 Wh. This is a very generous capacity compared to similarly sized rivals, which is also evident when we look at the runtime figures. The iPad Air is also beaten here. The 2017 model lasts for almost 13 hours in the Wi-Fi browsing test, so it is much more enduring than the iPad Air and roughly on par with the iPad Pro 9.7. How is this possible considering the higher consumption and the identical battery size? The explanation is simple: The Wi-Fi test is performed at an adjusted luminance (150 nits), so the increased power consumption of the brighter display does not affect the result. We also test video playback (FHD, H.264) at the same luminance, and the new iPad is once again pretty enduring: Almost 14 hours is a great result. The load test at the highest luminance suffers a bit from the high power consumption. 3:45 hours is reasonable, but the pre-predecessor lasted half an hour longer.
| Apple iPad (2017) 8.827 mAh | Apple iPad Pro 9.7 7306 mAh | Apple iPad Pro 12.9 10307 mAh | Apple iPad Air 1 2013 mAh | Samsung Galaxy Tab S3 SM-T825 6000 mAh | Google Pixel C mAh | Huawei MediaPad T2 10.0 Pro 6600 mAh | |
|---|---|---|---|---|---|---|---|
| Battery runtime | -2% | -5% | -5% | 15% | 10% | -22% | |
| Reader / Idle (h) | 24.9 | 30.8 24% | 32.2 29% | 23.8 -4% | 31.7 27% | 34.8 40% | 20.5 -18% |
| H.264 (h) | 14.1 | 11.8 -16% | 10.5 -26% | 10.7 -24% | 9.2 -35% | 12.3 -13% | 9.9 -30% |
| WiFi v1.3 (h) | 12.7 | 13 2% | 11.6 -9% | 12.7 0% | 10.6 -17% | 6.9 -46% | |
| Load (h) | 3.8 | 3.1 -18% | 3.3 -13% | 4.3 13% | 6.3 66% | 4.9 29% | 4.1 8% |
| WiFi (h) | 9.2 |
Pros
Cons
Verdict
Old wine in new bottles – we hear this quite often when a manufacturer refreshes a supposedly old product. Especially when it is equipped with dated technology. This is also the case for Apple's latest iPad. The iOS tablet from 2017 is just that: recycled, dated hardware in an even older chassis. However, the entry-level version only costs 400 Euros ($329) in return, almost a bargain for Apple tablets. The verdict could theoretically end at this point when you look at it from a superficial point of view.
A closer look, however, will quickly remove a lot of the eye-catching initial criticism. Yes, the SoC is old, but the performance is still very good for the tablet segment. And yes, the chassis has been around for a couple of years and it was already replaced by a slimmer version. However, build quality and materials are still top-notch. We think nobody would crave for a slimmer or lighter iPad if not for the iPad Air 2 or the iPad Pro 9.7.
Apple also improved some aspects of the new iPad compared to the original iPad Air. The first thing is the faster chip. The display is also much brighter, and the battery runtimes are even longer. Combined with the fast Wi-Fi, numerous LTE bands, an excellent GPS receiver and usable camera, the old wine suddenly looks a lot more appealing.
There are still some drawbacks though. The lack of a fully laminated display brings back an old tablet problem: Direct sunlight will transform the tablet into a mirror. This is an annoying step back for everybody who already used an iPad Mini 4 or Air 2. That the new iPad "only" covers the sRGB color space – is not a deal breaker. And that you don't get support for the Apple Pencil at 400 Euros – well, that is what the more expensive Pro models are for.
Let's sum it up: The new Apple iPad is almost boringly good. There is hardly any competition in terms of performance except for other Apple tablets, despite the dated hardware. The overall rating is almost dreamlike for the "underdog", but this is in part also a result of the weak tablet competition.
Apple iPad (2017)
- 03/31/2018 v6 (old)
Patrick Afschar Kaboli
Price comparison

