Notebookcheck Logo

Qualcomm Snapdragon 850 vs Intel Core i3-7100U

Qualcomm Snapdragon 850

► remove from comparison Qualcomm SD 850

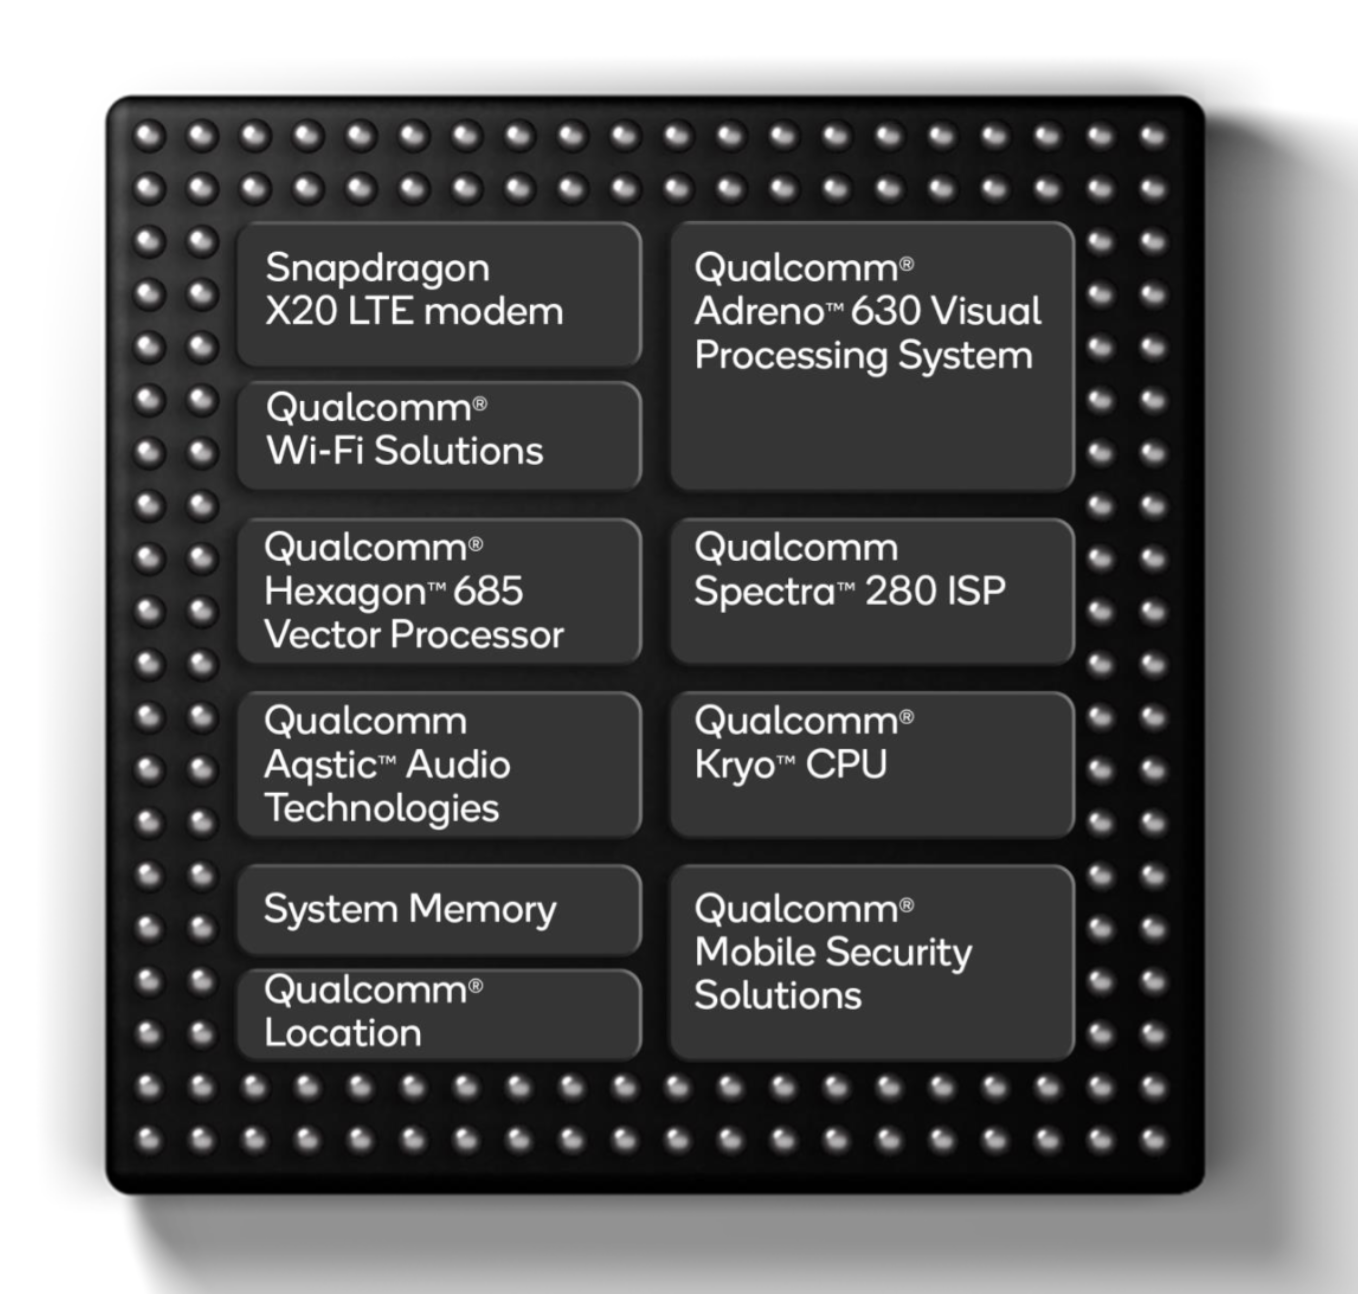
The Qualcomm Snapdragon 850 Mobile Compute Platform (or SD850) is a ARM based SoC for Windows laptops. It is a higher clocked version (3 versus 2.8 GHz) of the Snapdragon 845 for smartphones and also manufactured in 10 nm LPP FinFET at TSMC. It integrates 4x Kryo 385 cores (Cortex-A75) at up to 2.95 GHz (max) for performance and 4x Kryo 385 (at 1.8 GHz?) for efficiency. Furthermore offers an X20 LTE modem (Cat. 18 1.2 Gbps downlink, Cat 13 150 Mbps uplink), ac-WiFi and a dual-channel 32-Bit 1866 MHz LPDDR4x memory controller.

The performance of the Snapdragon 850 in Windows is in theory similar to a Intel Core i5 of the Y-series (e.g. Core i5-7y54). However, this is only the case for native ARM64 compiled applications and games. 32-bit applications that are not compiled for the ARM architecture only run in an emulation and perform much worse (e.g. see Cinebench R11.5 benchmark). 64-bit Intel/AMD apps are not supported at all.

The chip is very power efficient as its produced at TSMC in the modern 10nm LPP process. Therefore, laptops using the Snapdragon 850 can be passively cooled (no fan) and should not throttle under constant load.

Intel Core i3-7100U

► remove from comparison Intel i3-7100U

The Intel Core i3-7100U is a dual-core processor of the Kaby Lake architecture. It offers two CPU cores clocked at 2.4 GHz (without Turbo Boost) and integrates HyperThreading to work with up to 4 threads at once. The architectural differences are rather small compared to the Skylake generation, therefore the performance per MHz should be very similar. The SoC includes a dual channel DDR4 memory controller and Intel HD Graphics 620 graphics card (clocked at 300 - 1000 MHz). It is manufactured in an improved 14nm FinFET process at Intel. Compare to the old Skylake Core i3-6100U, the i3-7100U offers a 100 MHz improved clock speed.

 Architecture

Intel basically uses the same micro architecture compared to Skylake, so the per-MHz performance does not differ. The manufacturer only reworked the Speed Shift technology for faster dynamic adjustments of voltages and clocks, and the improved 14nm process allows much higher frequencies combined with better efficiency than before.

ModelQualcomm Snapdragon 850Intel Core i3-7100U
SeriesQualcomm SnapdragonIntel Kaby Lake
CodenameCortex-A75 / A55 (Kryo 385)Kaby Lake
Series: Kaby Lake Kaby Lake
Qualcomm Snapdragon 850 « 2.75 - 2.96 GHz8 / 8 cores2 MB L3 Cortex-A75 / A55 (Kryo 385)
Qualcomm Snapdragon 845 compare2.8 GHz8 / 8 cores2 MB L3 Cortex-A75 / A55 (Kryo 385)
Intel Core i7-7700K compare4.2 - 4.5 GHz4 / 8 cores8 MB L3
Intel Core i7-7700 compare3.6 - 4.2 GHz4 / 8 cores8 MB L3
Intel Xeon E3-1535M v6 compare3.1 - 4.2 GHz4 / 8 cores8 MB L3
Intel Core i7-7920HQ compare3.1 - 4.1 GHz4 / 8 cores8 MB L3
Intel Core i7-7700T compare2.9 - 3.8 GHz4 / 8 cores8 MB L3
Intel Core i5-7600K compare3.8 - 4.2 GHz4 / 4 cores8 MB L3
Intel Xeon E3-1505M v6 compare3 - 4 GHz4 / 8 cores8 MB L3
Intel Core i7-7820HQ compare2.9 - 3.9 GHz4 / 8 cores8 MB L3
Intel Core i7-7820HK compare2.9 - 3.9 GHz4 / 8 cores8 MB L3
Intel Core i7-7700HQ compare2.8 - 3.8 GHz4 / 8 cores6 MB L3
Intel Core i5-7500 compare3.4 - 3.8 GHz4 / 4 cores6 MB L3
Intel Core i5-7440HQ compare2.8 - 3.8 GHz4 / 4 cores6 MB L3
Intel Core i7-7567U compare3.5 - 4 GHz2 / 4 cores4 MB L3
Intel Core i7-7660U compare2.5 - 4 GHz2 / 4 cores4 MB L3
Intel Core i7-7600U compare2.8 - 3.9 GHz2 / 4 cores4 MB L3
Intel Core i5-7300HQ compare2.5 - 3.5 GHz4 / 4 cores6 MB L3
Intel Core i5-7500T compare2.7 - 3.3 GHz4 / 4 cores6 MB L3
Intel Core i5-7287U compare3.3 - 3.7 GHz2 / 4 cores4 MB L3
Intel Core i7-7560U compare2.4 - 3.8 GHz2 / 4 cores4 MB L3
Intel Core i5-7267U compare3.1 - 3.5 GHz2 / 4 cores4 MB L3
Intel Core i5-7360U compare2.3 - 3.6 GHz2 / 4 cores4 MB L3
Intel Core i7-7500U compare2.7 - 3.5 GHz2 / 4 cores4 MB L3
Intel Core i5-7300U compare2.6 - 3.5 GHz2 / 4 cores3 MB L3
Intel Core i5-7260U compare2.2 - 3.4 GHz2 / 4 cores4 MB L3
Intel Core i5-7200U compare2.5 - 3.1 GHz2 / 4 cores3 MB L3
Intel Core i3-7100H compare3 GHz2 / 4 cores3 MB L3
Intel Core i3-7167U compare2.8 GHz2 / 4 cores3 MB L3
Intel Core i7-7Y75 compare1.3 - 3.6 GHz2 / 4 cores4 MB L3
Intel Core i5-7Y57 compare1.2 - 3.3 GHz2 / 4 cores4 MB L3
Intel Core i5-7Y54 compare1.2 - 3.2 GHz2 / 4 cores4 MB L3
Intel Core i3-7100U « 2.4 GHz2 / 4 cores3 MB L3
Intel Core m3-7Y32 compare1 - 3 GHz2 / 4 cores4 MB L3
Intel Pentium Gold 4415U compare2.3 GHz2 / 4 cores2 MB L3
Intel Core m3-7Y30 compare1 - 2.6 GHz2 / 4 cores4 MB L3
Intel Celeron 3965U compare2.2 GHz2 / 2 cores2 MB L3
Intel Core i3-7020U compare2.3 GHz2 / 4 cores3 MB L3
Intel Celeron 3867U compare1.8 GHz2 / 2 cores2 MB L3
Intel Celeron 3865U compare1.8 GHz2 / 2 cores2 MB L3
Intel Pentium Gold 4425Y compare1.7 GHz2 / 4 cores2 MB L3
Intel Pentium Gold 4415Y compare1.6 GHz2 / 4 cores2 MB L3
Intel Pentium Gold 4410Y compare1.5 GHz2 / 4 cores2 MB L3
Intel Celeron 3965Y compare1.5 GHz2 / 2 cores2 MB L3
Clock2750 - 2960 MHz2400 MHz
L1 Cache768 KB128 KB
L2 Cache1.5 MB512 KB
L3 Cache2 MB3 MB
Cores / Threads8 / 82 / 4
Technology10 nm14 nm
FeaturesX20 LTE Modem, Adreno 630 GPUDual-Channel DDR4 Memory Controller, HyperThreading, AVX, AVX2, Quick Sync, Virtualization, AES-NI
iGPUQualcomm Adreno 630Intel HD Graphics 620 (300 - 1000 MHz)
ArchitectureARMx86
Announced
Manufacturerwww.qualcomm.comark.intel.com
TDP15 Watt
max. Temp.100 °C
SocketBGA1356
$281 U.S.

Benchmarks

Cinebench R15 - Cinebench R15 CPU Multi 64 Bit
min: 256     avg: 257     median: 256.5 (2%)     max: 260 Points
Cinebench R15 - Cinebench R15 CPU Single 64 Bit
min: 86     avg: 94.3     median: 95 (29%)     max: 100 Points
Cinebench R11.5 - Cinebench R11.5 CPU Multi 64 Bit
2.9 Points (4%)
Cinebench R11.5 - Cinebench R11.5 CPU Single 64 Bit
1 Points (26%)
Cinebench R10 - Cinebench R10 Rend. Single (32bit)
1166 Points (7%)
min: 3871     avg: 3874     median: 3874 (23%)     max: 3877 Points
Cinebench R10 - Cinebench R10 Rend. Multi (32bit)
2284 Points (2%)
min: 8718     avg: 8758     median: 8757.5 (6%)     max: 8797 Points
wPrime 2.10 - wPrime 2.0 1024m *
1456 s (17%)
min: 635     avg: 640     median: 640 (8%)     max: 645 s
wPrime 2.10 - wPrime 2.0 32m *
37 s (7%)
min: 20.19     avg: 20.3     median: 20.2 (4%)     max: 20.3 s
WinRAR - WinRAR 4.0
100%
1 SD 850 +
4745 Points (8%)
X264 HD Benchmark 4.0 - x264 Pass 2
100%
1 SD 850 +
4.9 fps (2%)
X264 HD Benchmark 4.0 - x264 Pass 1
100%
1 SD 850 +
28 fps (6%)
R Benchmark 2.5 - R Benchmark 2.5 *
100%
1 SD 850 +
2.3 sec (51%)
Super Pi mod 1.5 XS 1M - Super Pi mod 1.5 XS 1M *
34 s (7%)
min: 14.06     avg: 14.9     median: 14.9 (3%)     max: 15.8 s
Super Pi mod 1.5 XS 2M - Super Pi mod 1.5 XS 2M *
75 s (3%)
min: 31.64     avg: 34     median: 34 (1%)     max: 36.3 s
Super Pi Mod 1.5 XS 32M - Super Pi mod 1.5 XS 32M *
1678 s (7%)
min: 712     avg: 765     median: 765 (3%)     max: 818 s
3DMark 11 - 3DM11 Performance Physics
min: 3121     avg: 3357     median: 3428 (9%)     max: 3595 Points
3DMark - 3DMark Ice Storm Physics
13397 Points (11%)
min: 19210     avg: 25168     median: 25167.5 (20%)     max: 31125 Points
3DMark - 3DMark Ice Storm Extreme Physics
12345 Points (10%)
19308 Points (16%)
3DMark - 3DMark Ice Storm Unlimited Physics
16059 Points (14%)
21164 Points (18%)
3DMark - 3DMark Cloud Gate Physics
1116 Points (3%)
min: 2366     avg: 2620     median: 2729 (7%)     max: 2765 Points
3DMark - 3DMark Fire Strike Standard Physics
2132 Points (4%)
min: 3845     avg: 3885     median: 3885 (7%)     max: 3925 Points
Geekbench 5.5 - Geekbench 5.1 - 5.4 64 Bit Single-Core
100%
1 SD 850 +
488 Points (21%)
Geekbench 5.5 - Geekbench 5.1 - 5.4 64 Bit Multi-Core
100%
1 SD 850 +
1923 Points (3%)
Geekbench 4.4 - Geekbench 4.1 - 4.4 64 Bit Single-Core
2269 Points (23%)
3016 Points (30%)
Geekbench 4.4 - Geekbench 4.1 - 4.4 64 Bit Multi-Core
7118 Points (8%)
5895 Points (6%)
Geekbench 4.0 - Geekbench 4.0 64 Bit Single-Core
2947 Points (40%)
Geekbench 4.0 - Geekbench 4.0 64 Bit Multi-Core
5636 Points (14%)
Geekbench 3 - Geekbench 3 32 Bit Multi-Core
5136 Points (9%)
Geekbench 3 - Geekbench 3 32 Bit Single-Core
2340 Points (46%)
Mozilla Kraken 1.1 - Kraken 1.1 Total Score *
2836 ms (3%)
1528 ms (2%)
Sunspider - Sunspider 1.0 Total Score *
341.3 ms (4%)
Octane V2 - Octane V2 Total Score
13947 Points (13%)
24098 Points (22%)

Average Benchmarks Qualcomm Snapdragon 850 → 100% n=16

Average Benchmarks Intel Core i3-7100U → 165% n=16

- Range of benchmark values for this graphics card
- Average benchmark values for this graphics card
* Smaller numbers mean a higher performance
1 This benchmark is not used for the average calculation

Add one or more devices and compare

In the following list you can select (and also search for) devices that should be added to the comparison. You can select more than one device.

restrict list:

show all (including archived), 2024, 2023
v1.26
log 01. 04:34:38

#0 checking url part for id 11391 +0s ... 0s

#1 checking url part for id 8153 +0s ... 0s

#2 not redirecting to Ajax server +0s ... 0s

#3 did not recreate cache, as it is less than 5 days old! Created at Fri, 31 May 2024 05:40:08 +0200 +0.001s ... 0.001s

#4 composed specs +0.031s ... 0.032s

#5 did output specs +0s ... 0.032s

#6 getting avg benchmarks for device 11391 +0.003s ... 0.035s

#7 got single benchmarks 11391 +0.009s ... 0.044s

#8 getting avg benchmarks for device 8153 +0.004s ... 0.048s

#9 got single benchmarks 8153 +0.062s ... 0.11s

#10 got avg benchmarks for devices +0s ... 0.11s

#11 min, max, avg, median took s +0.178s ... 0.288s

#12 return log +0.026s ... 0.314s

Please share our article, every link counts!
> Expert Reviews and News on Laptops, Smartphones and Tech Innovations > Benchmarks / Tech > Processor Comparison - Head 2 Head
Redaktion, 2017-09- 8 (Update: 2023-07- 1)