iBuyPower MSI GE62 Notebook Review
Nvidia have finally pulled the curtains off the inevitable GTX 960M and iBuyPower have provided us with a first look at what the GPU is capable of in their upcoming MSI GE62 2QD Optiboost model. The more powerful GTX 965M has been available for quite some time now and we recently checked out the MSI GE62 2QE equipped with the GPU. We definitely recommend checking out our GE62 2QE page for more details, pictures, and data as the two models are physically identical.
In this review, we will jump straight to the display and graphics performance of the GTX 960M. Compared to the 2QD configuration above, the 2QE is equipped with a more mainstream matte 1080p IPS display instead of the glossy and denser 4K (3840 x 2160) panel. Will this have noticeable gains in battery life? Is the 960M sufficient for 1080p gaming? How does it compare to the GTX 860M? We answer all this and more below.
Display
The FHD display on our model is free from defects and is very crisp, especially for a matte display. There are no grainy colors or noise as we have seen on some older Asus ROG models and no screen-door effect is noticeable when up close. Text and images are consistent from edge to edge as expected. Its Samsung 156HL01-102 display panel can also be found on a number of high-end 15.6-inch models including the Asus GL550 and MSI WS60 Workstation. When compared to the 4K panel in our GE62 2QE, we actually prefer the native 1080p resolution for general day-to-day use as there isn't much of a difference unless if you constantly work on multiple active windows simultaneously.
More notably, however, display brightness on our 1080p screen is much brighter than on our 4K model by over 100 nits while contrast is largely unaffected at slightly over 500:1. This means that movies and videos on the 1080p model can be brighter without sacrificing black level, at least compared to the 4K model. Other 15.6-inch gaming models like the Alienware 15 and HP Omen show both higher contrast and more accurate colors to boot, though they are a step down in in terms of maximum display brightness.
| |||||||||||||||||||||||||
Brightness Distribution: 88 %
Center on Battery: 290.9 cd/m²
Contrast: 559:1 (Black: 0.646 cd/m²)
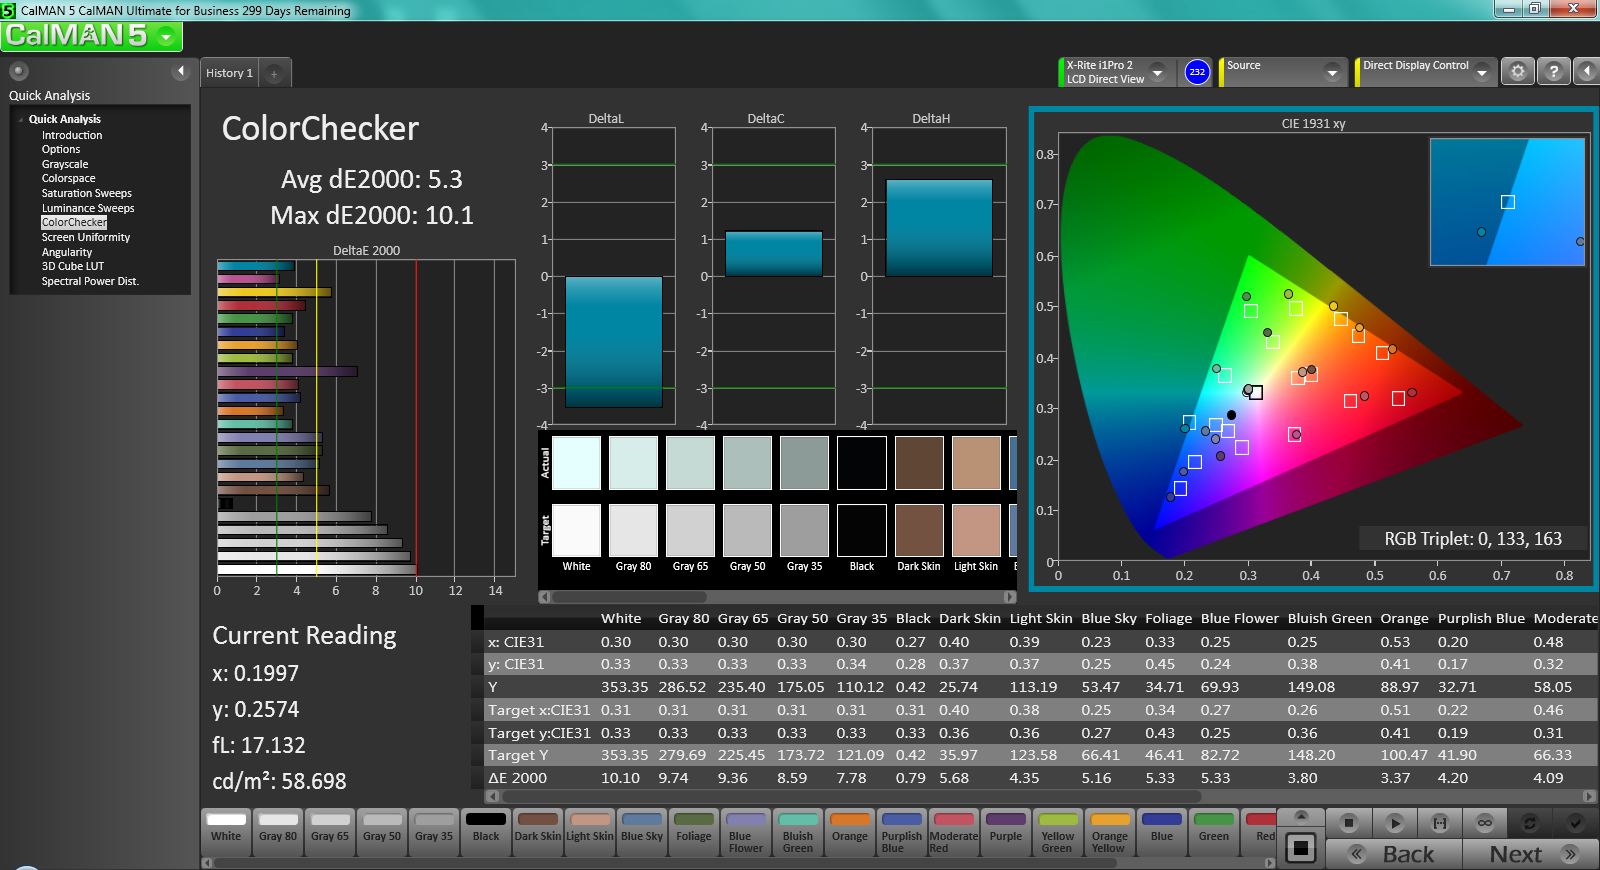
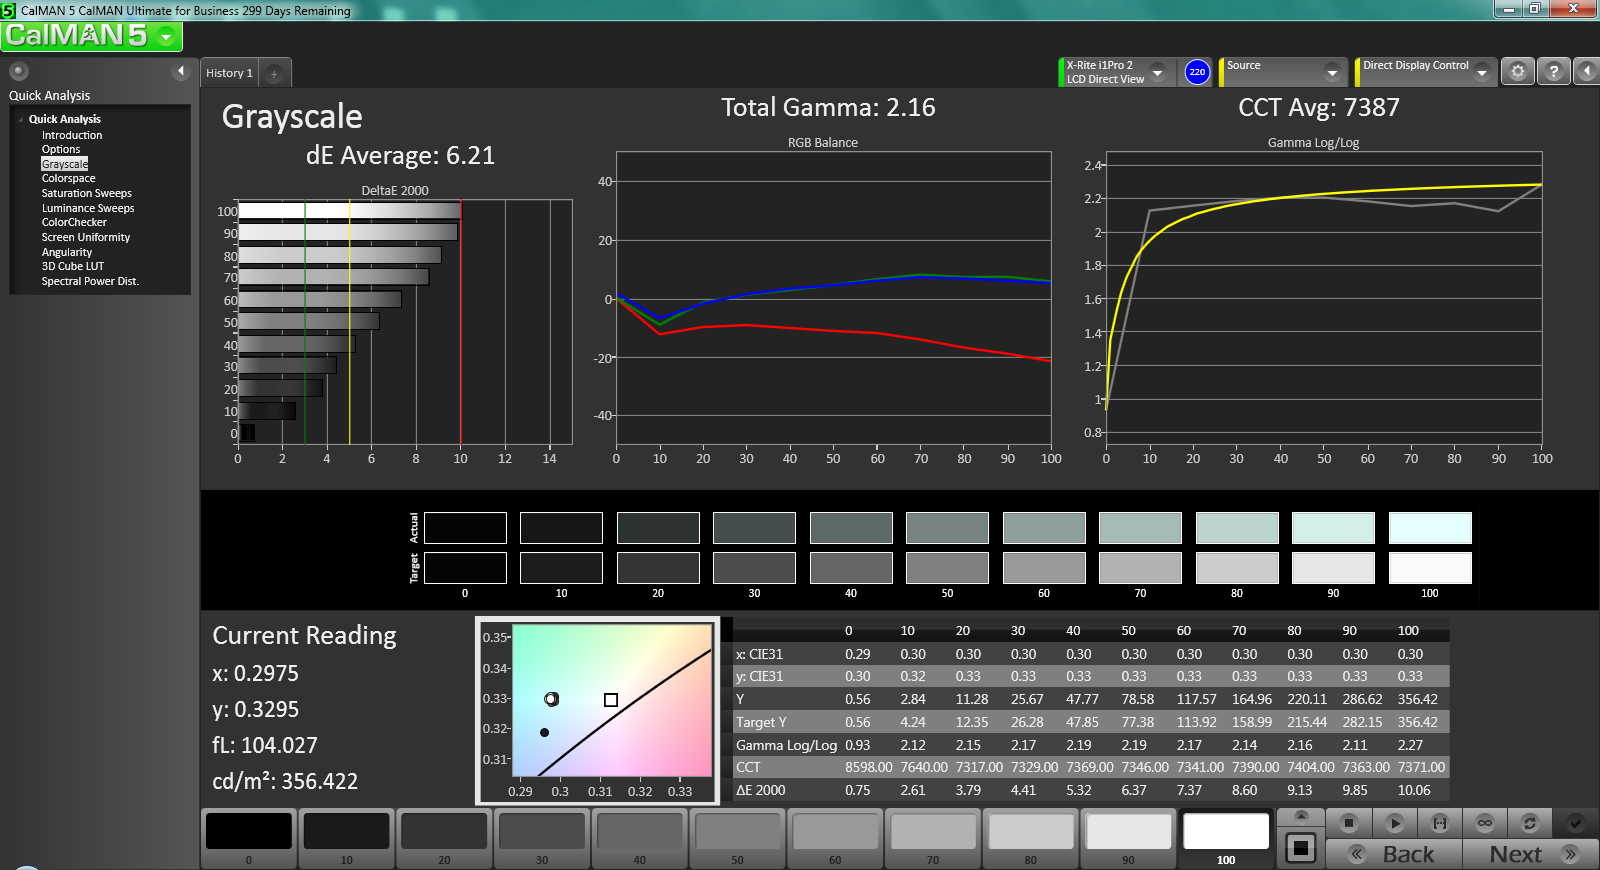
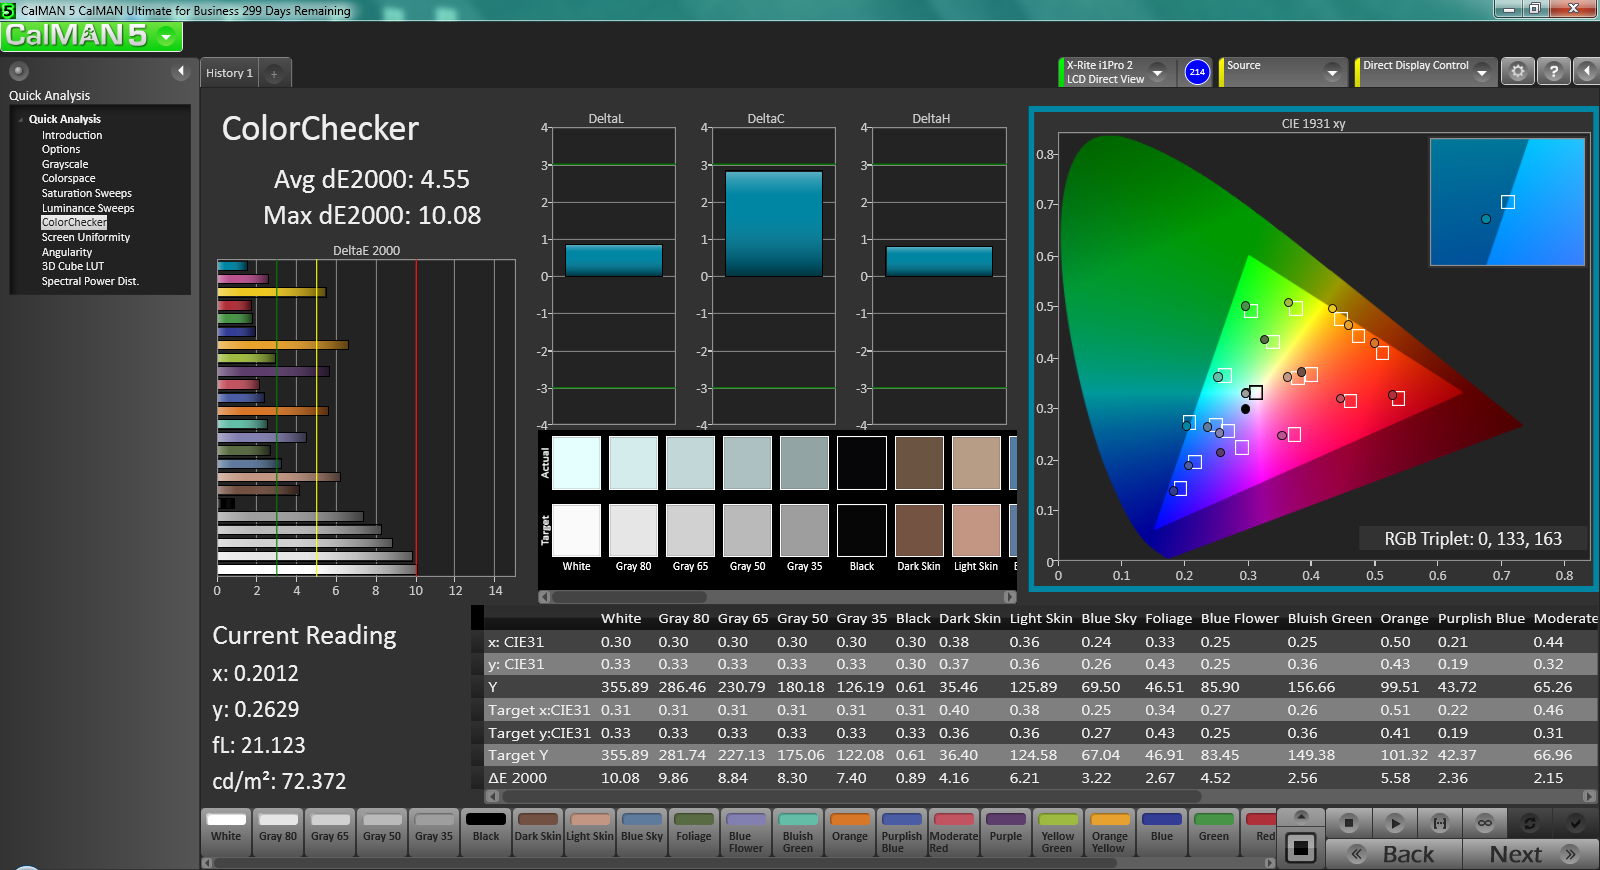
ΔE ColorChecker Calman: 5.3 | ∀{0.5-29.43 Ø4.77}
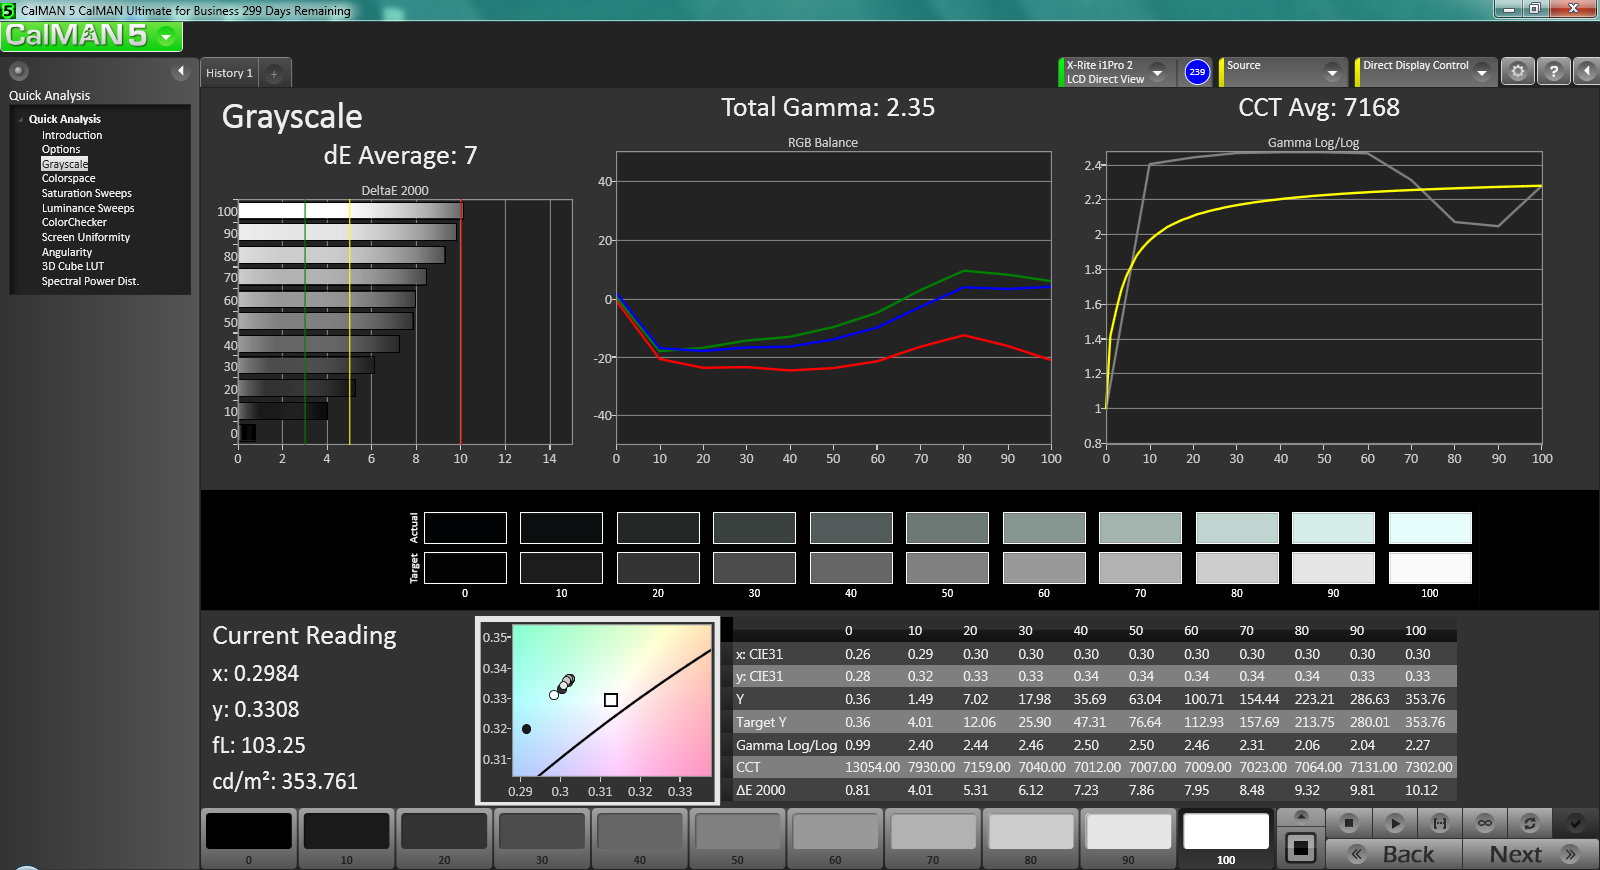
ΔE Greyscale Calman: 7 | ∀{0.09-98 Ø5}
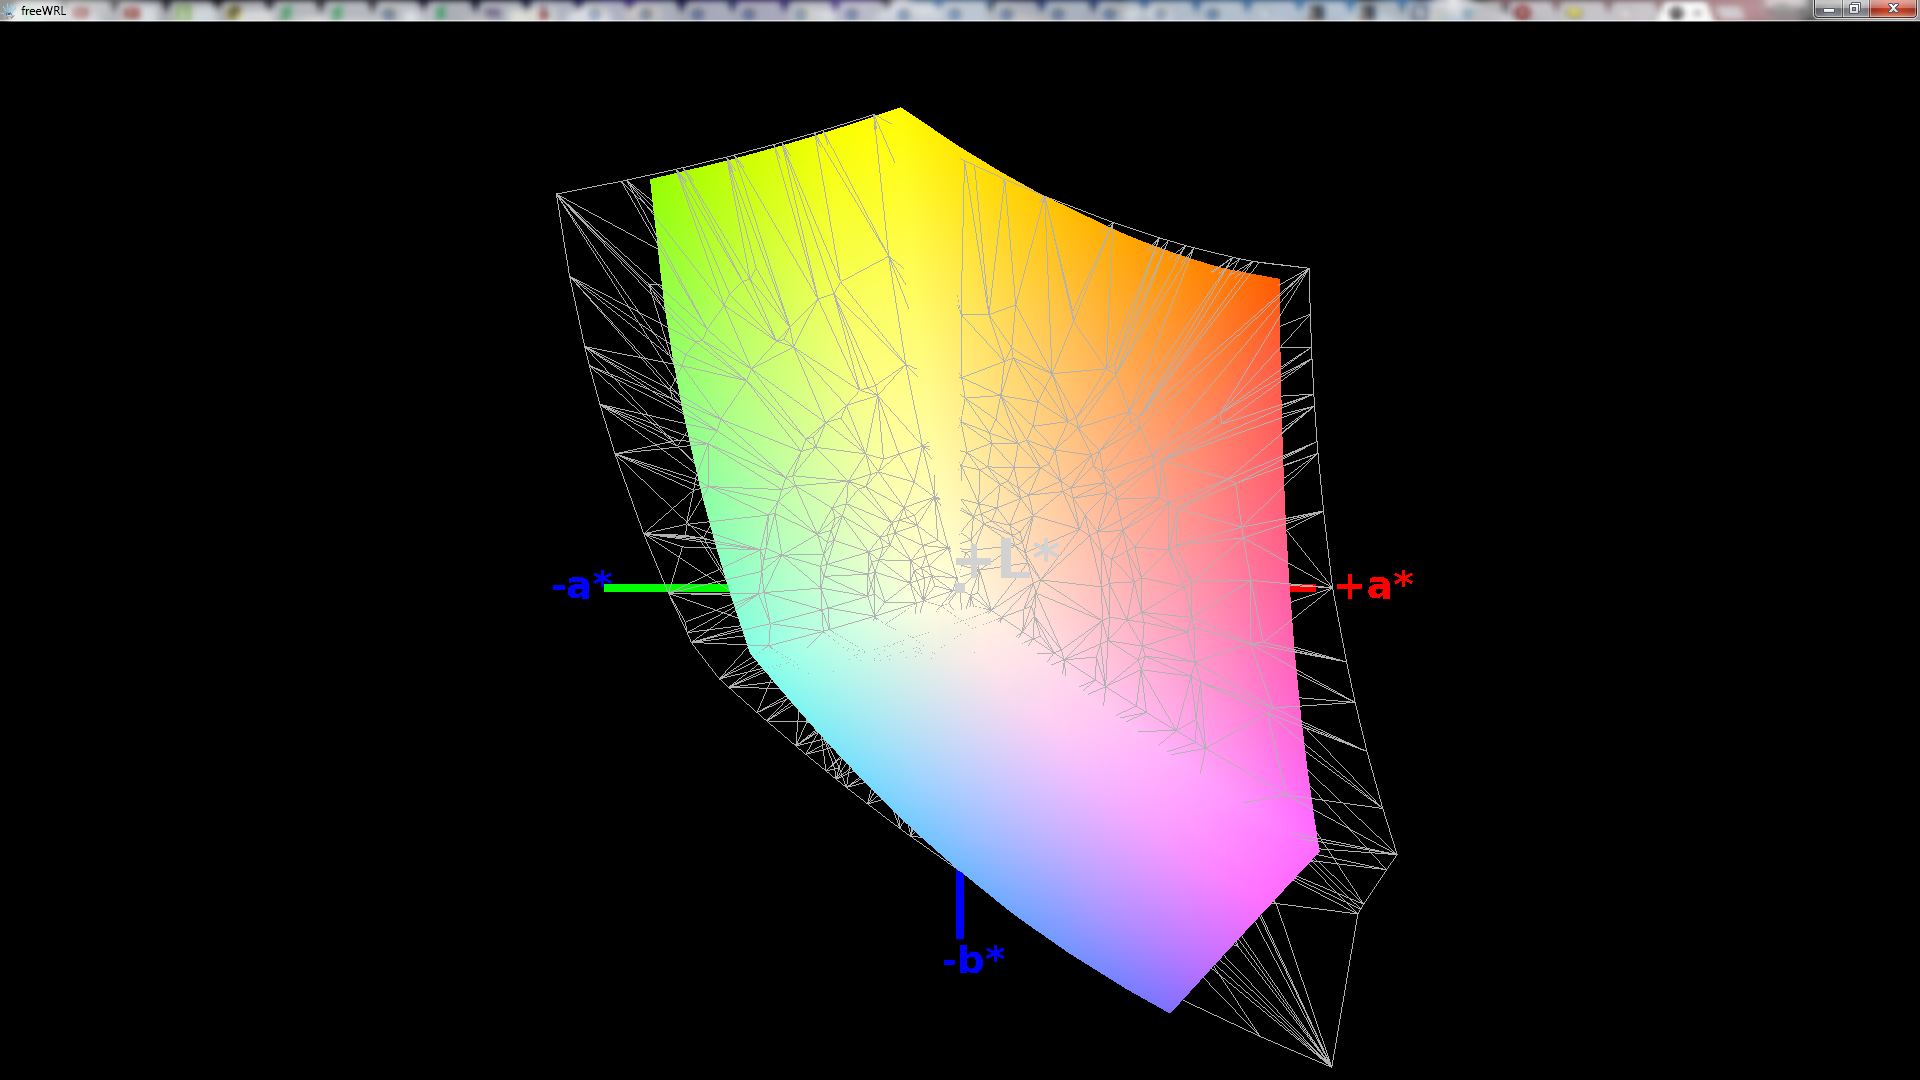
58.63% AdobeRGB 1998 (Argyll 1.6.3 3D)
66.2% AdobeRGB 1998 (Argyll 3D)
87% sRGB (Argyll 3D)
64.5% Display P3 (Argyll 3D)
Gamma: 2.35
CCT: 7168 K
| MSI GE62 2QD GeForce GTX 960M, 4720HQ, 2x ADATA SP900NS38 (RAID 0) | Ibuypower Chimera CX-9 GeForce GTX 860M, 4710HQ, 2x Plextor PX-256M6M (RAID 0) | Alienware 15 GeForce GTX 970M, 4710HQ, Samsung SSD PM851 M.2 2280 128GB | HP Omen GeForce GTX 860M, 4710HQ, SanDisk A110 SD6PP4M-256G-1006 | |
|---|---|---|---|---|
| Display | -21% | 3% | 2% | |
| Display P3 Coverage (%) | 64.5 | 50.1 -22% | 65.1 1% | 64.4 0% |
| sRGB Coverage (%) | 87 | 69.6 -20% | 93.3 7% | 92.6 6% |
| AdobeRGB 1998 Coverage (%) | 66.2 | 52 -21% | 66.2 0% | 65.5 -1% |
| Screen | -27% | 22% | 13% | |
| Brightness middle (cd/m²) | 361 | 385.3 7% | 308 -15% | 315 -13% |
| Brightness (cd/m²) | 345 | 352 2% | 292 -15% | 301 -13% |
| Brightness Distribution (%) | 88 | 88 0% | 83 -6% | 85 -3% |
| Black Level * (cd/m²) | 0.646 | 0.829 -28% | 0.28 57% | 0.38 41% |
| Contrast (:1) | 559 | 465 -17% | 1100 97% | 829 48% |
| Colorchecker dE 2000 * | 5.3 | 10.14 -91% | 4.28 19% | 4.37 18% |
| Greyscale dE 2000 * | 7 | 11.5 -64% | 4.54 35% | 5.46 22% |
| Gamma | 2.35 94% | 2.19 100% | 2.81 78% | 2.48 89% |
| CCT | 7168 91% | 13768 47% | 7497 87% | 7915 82% |
| Color Space (Percent of AdobeRGB 1998) (%) | 58.63 | 45 -23% | 60 2% | 60 2% |
| Color Space (Percent of sRGB) (%) | 92.9 | |||
| Total Average (Program / Settings) | -24% /
-25% | 13% /
17% | 8% /
10% |
* ... smaller is better
Color space reproduction is roughly 79 percent and 58 percent of the sRGB and AdobeRGB standards, respectively. Coverage of sRGB is high even for an IPS panel and certainly better than budget TN panels where 60 percent is the norm. Comparing the color profiles of the GE62 with the Alienware 15 and Asus N551 show an almost perfect overlap of more than 90 percent.
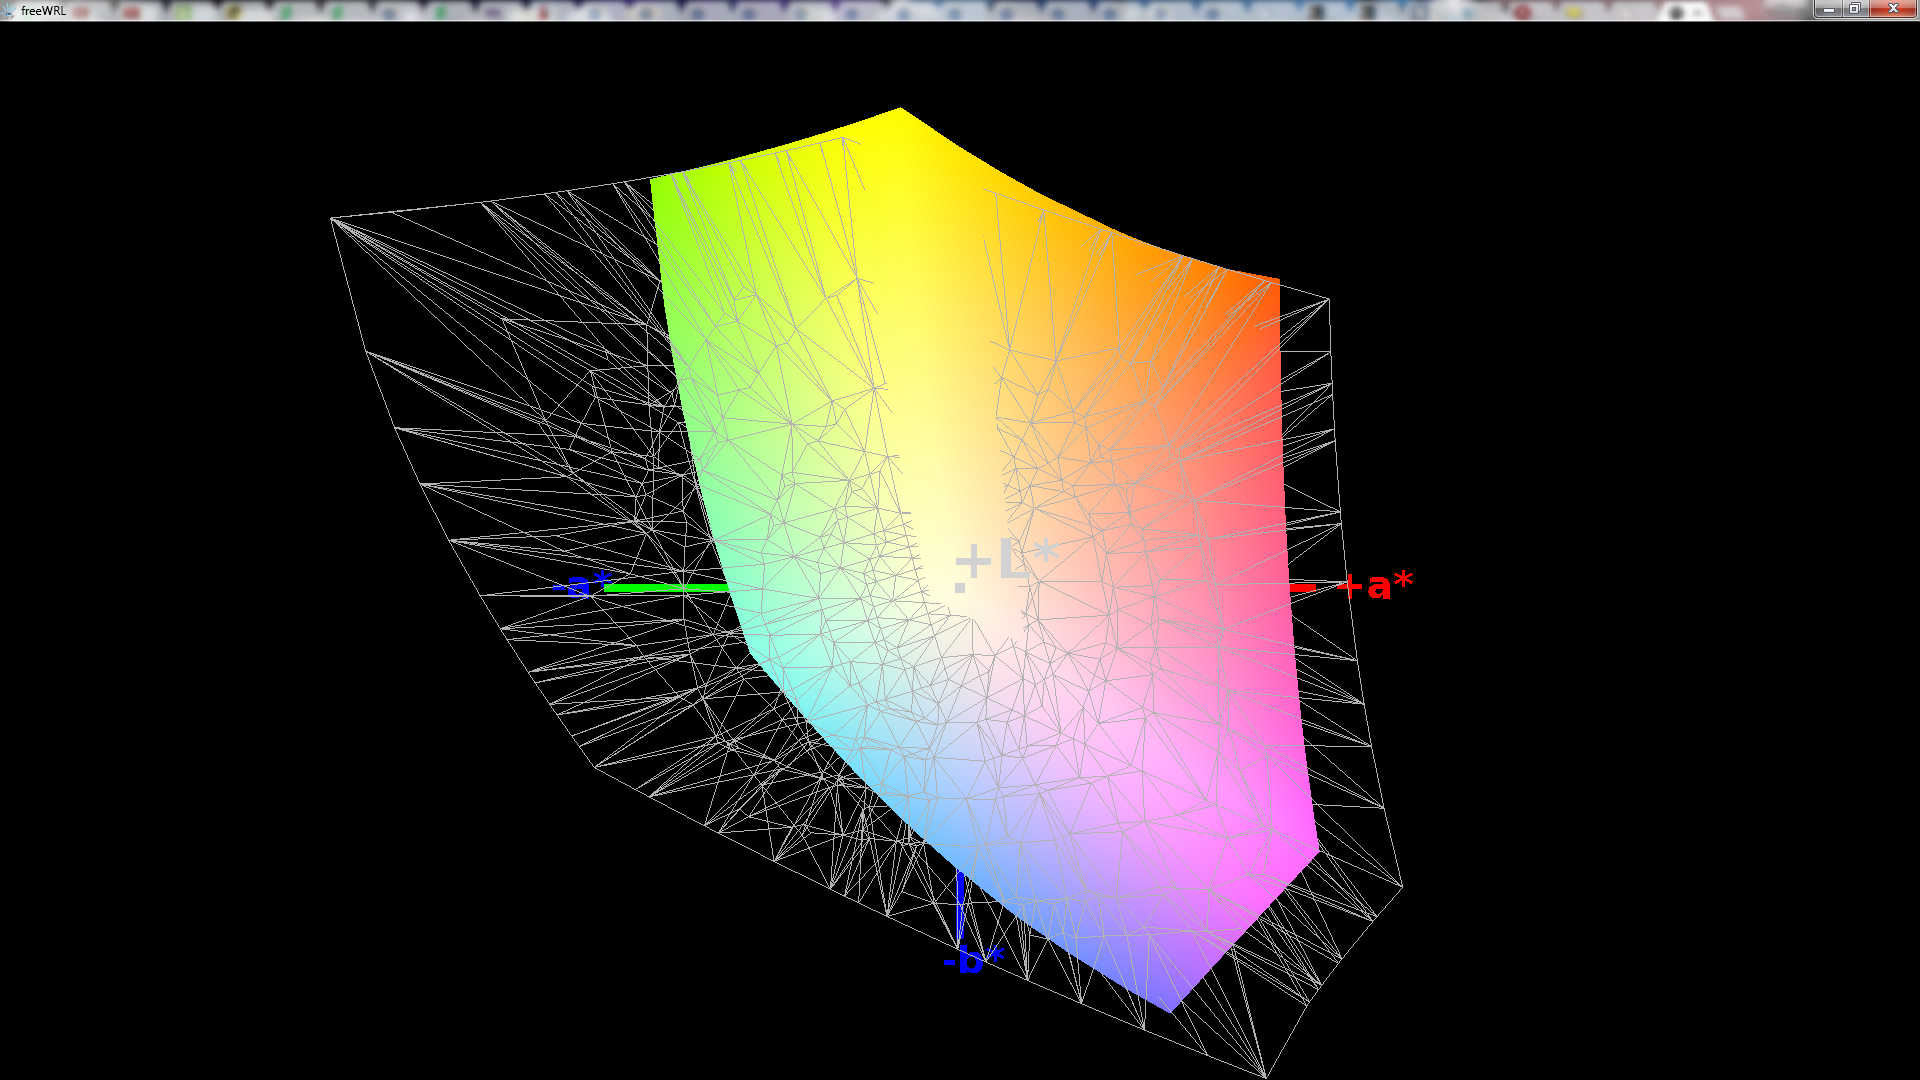

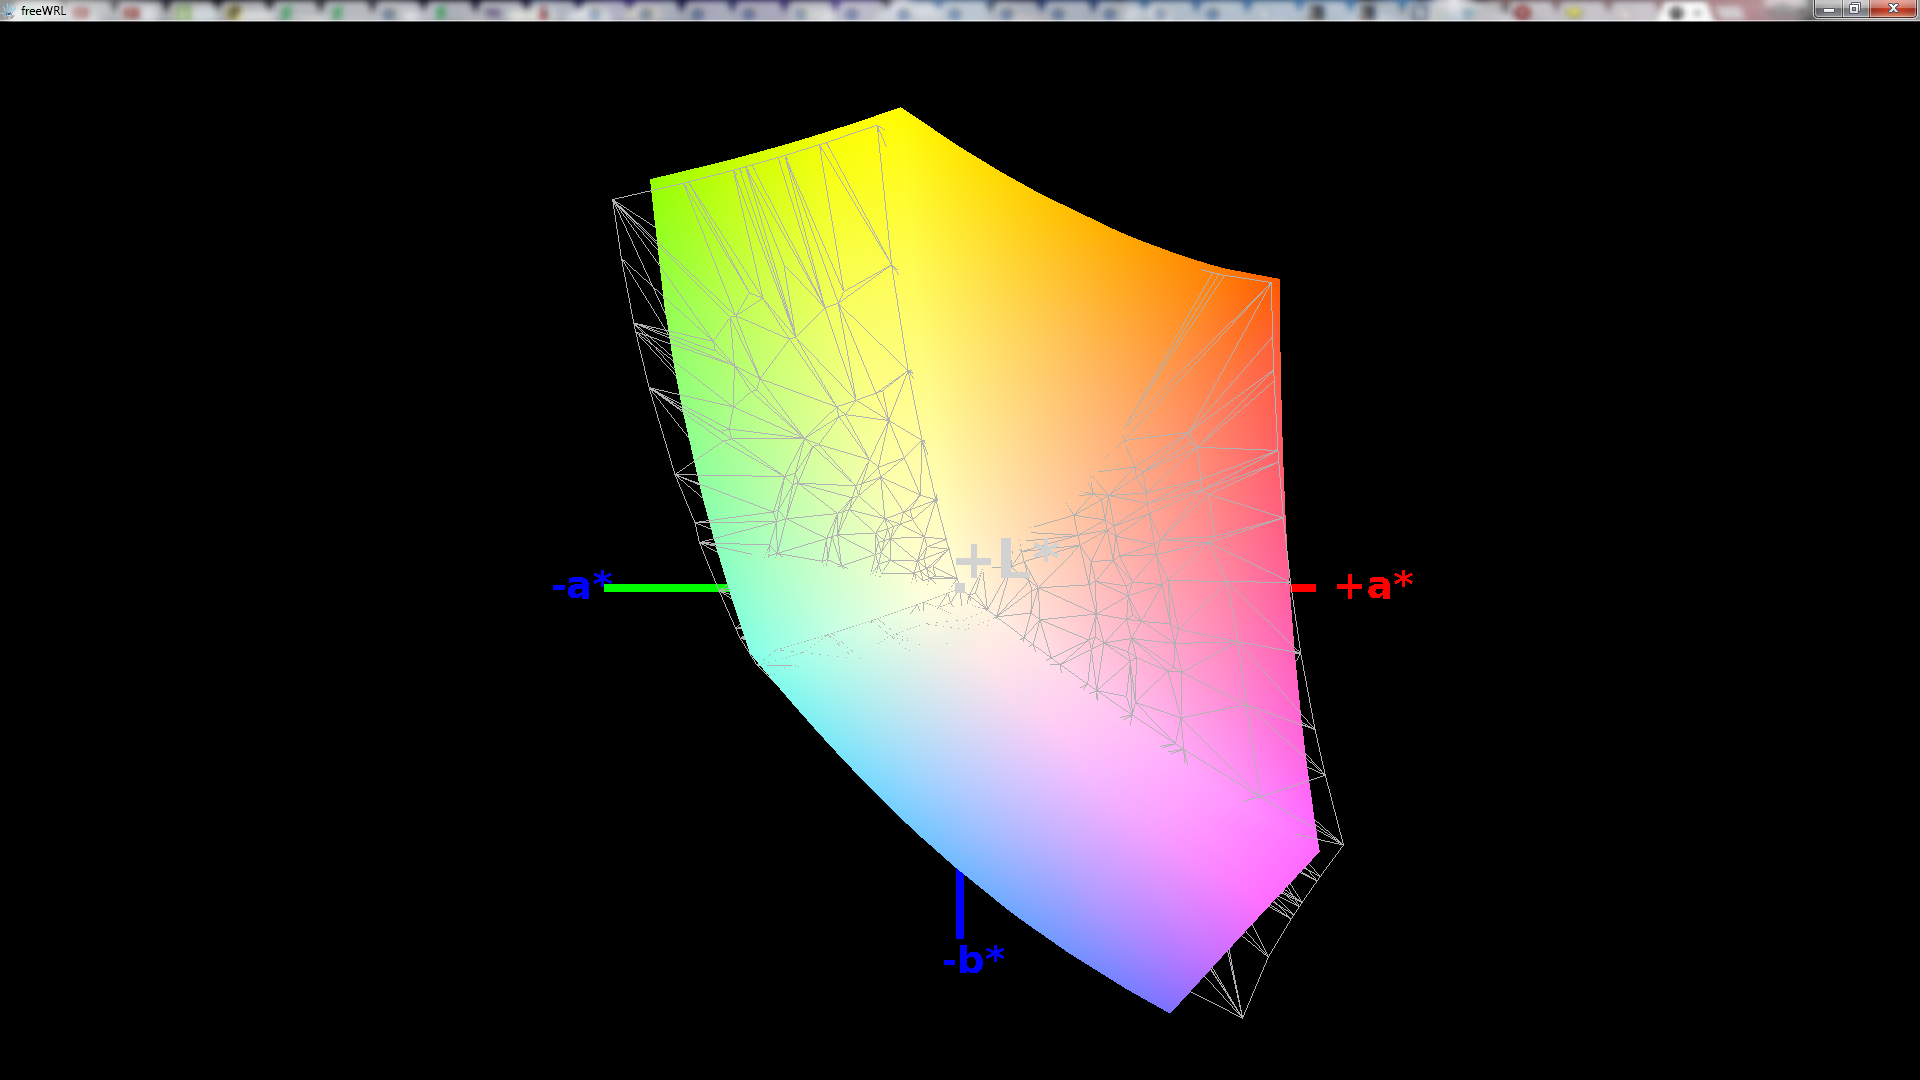
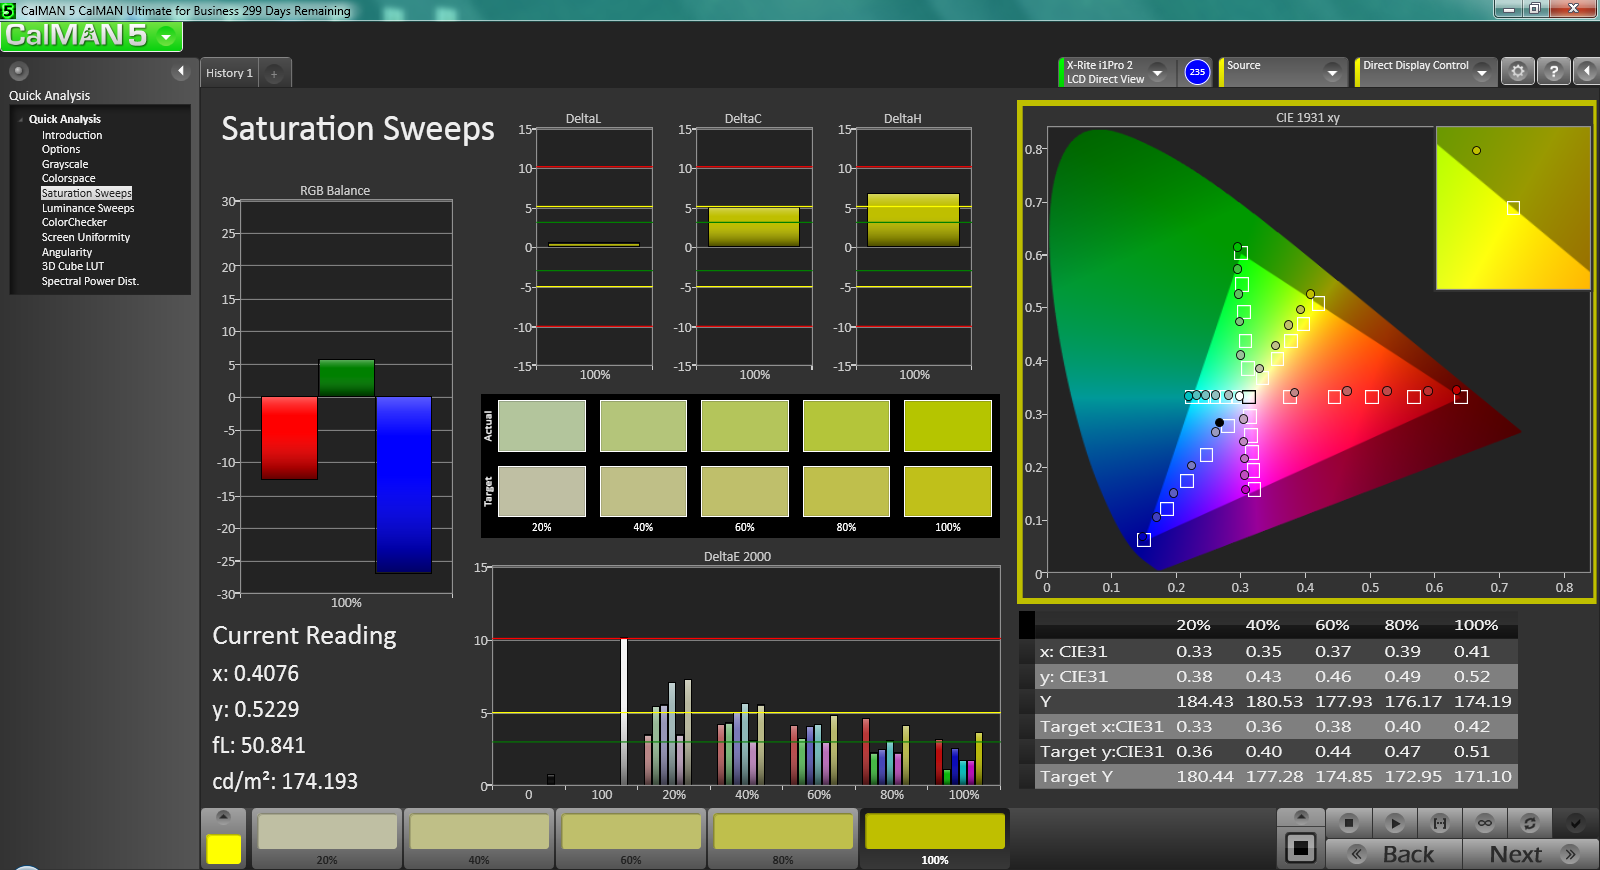
Further display analyses with an X-Rite spectrophotometer show generally accurate colors across all saturation levels with increasing accuracy at higher saturation. All colors are also well balanced relative to one another. Calibration results in only minimal improvements, though the display is still of much higher quality than on the Chimera CX-9.

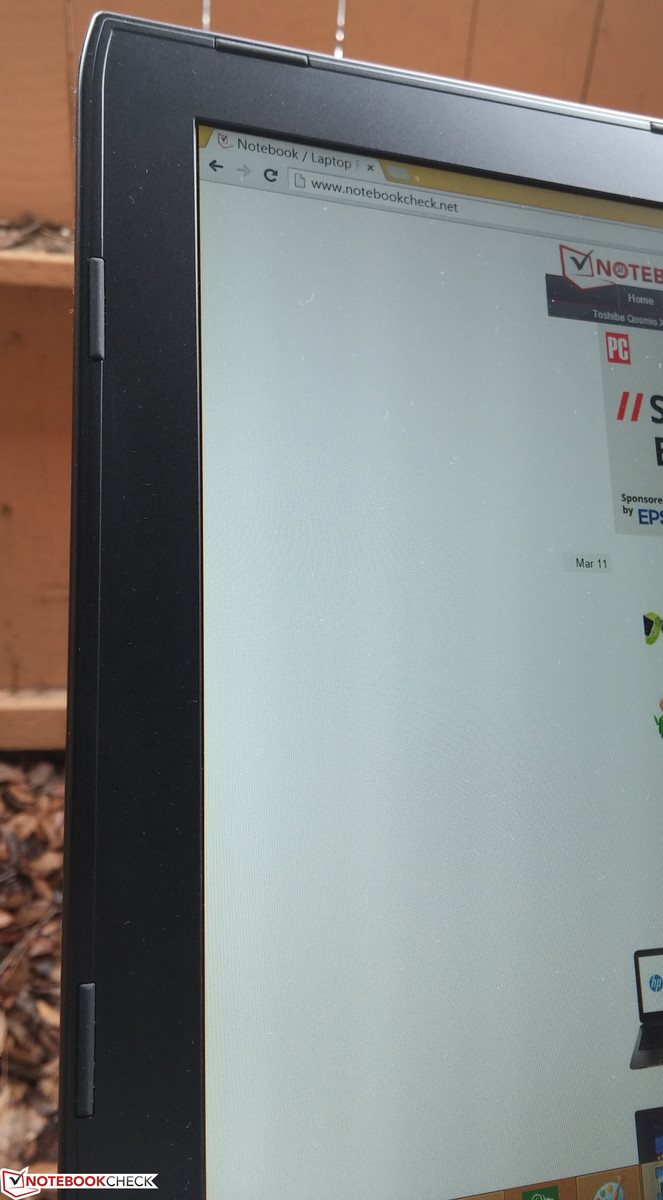
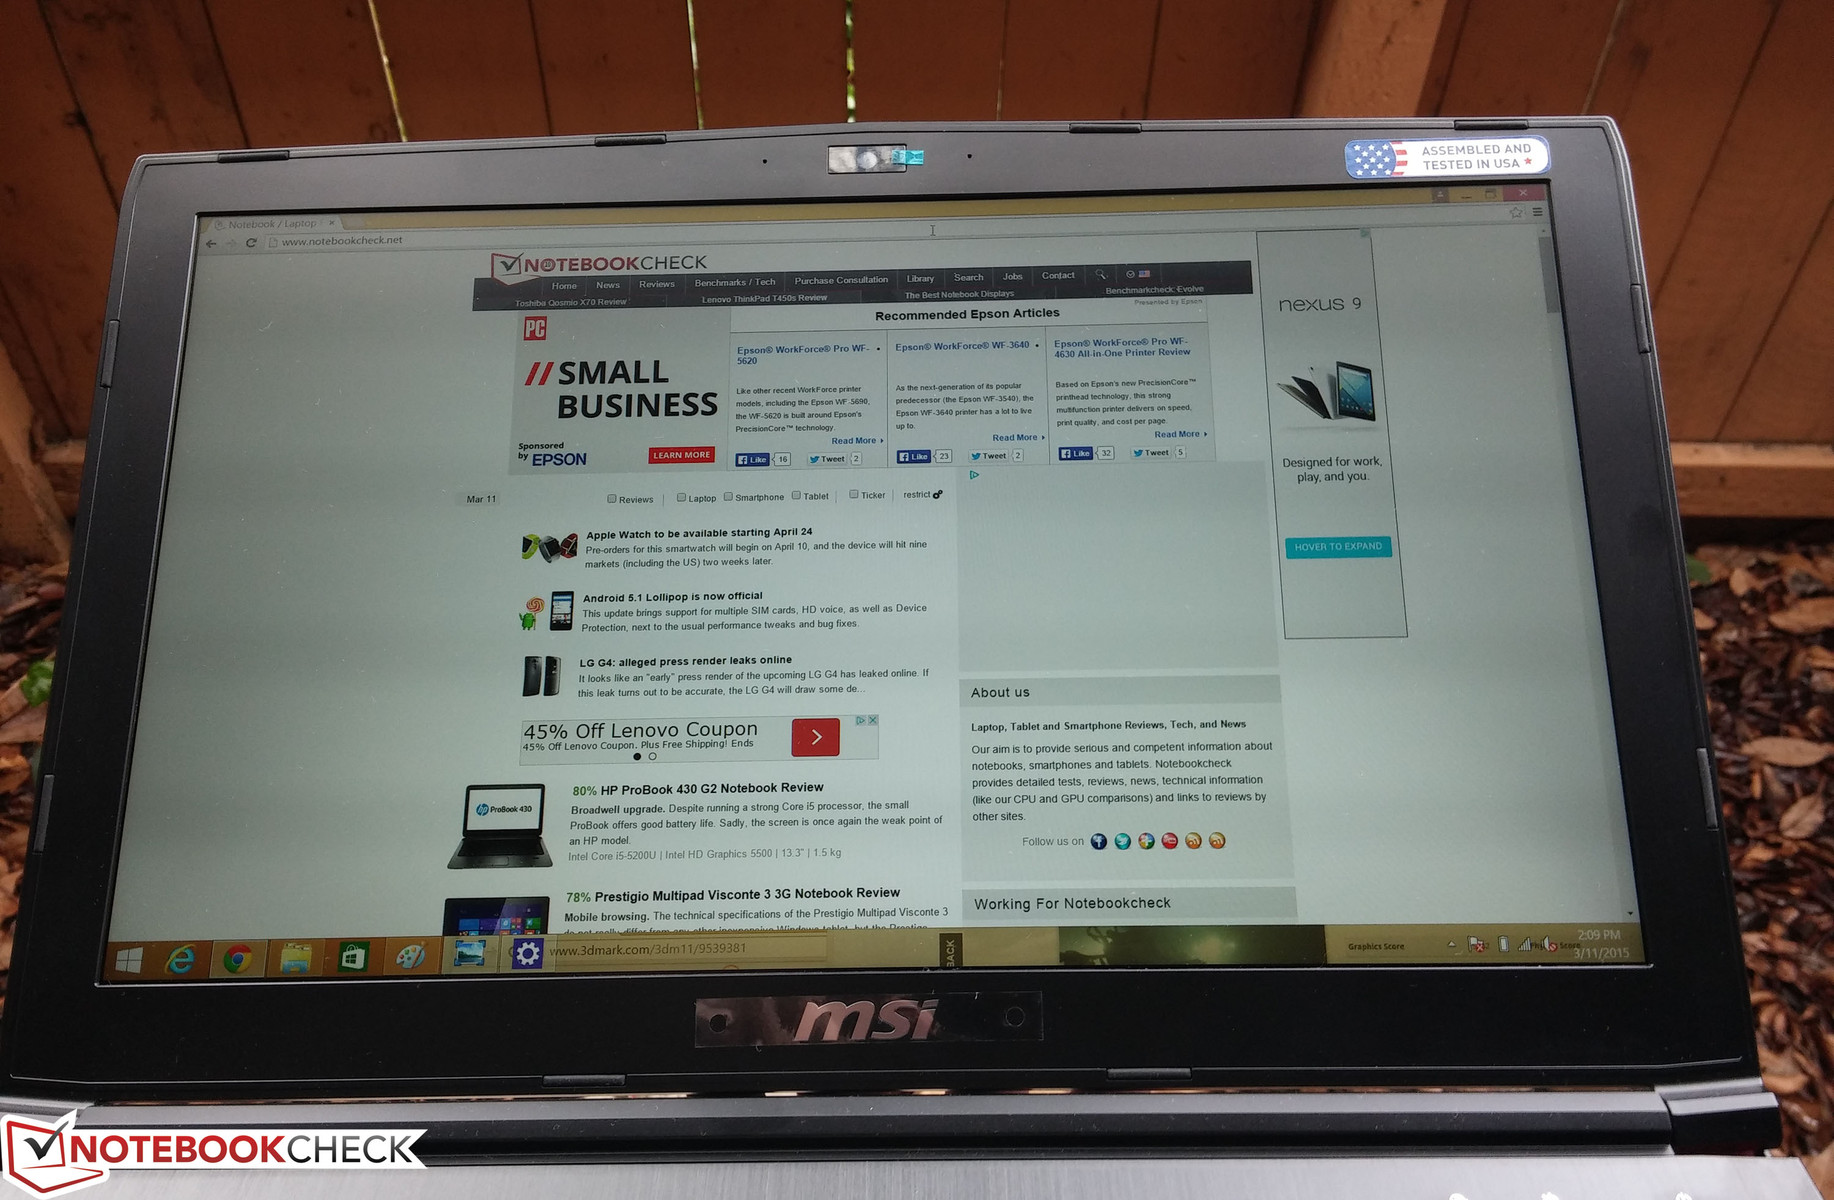
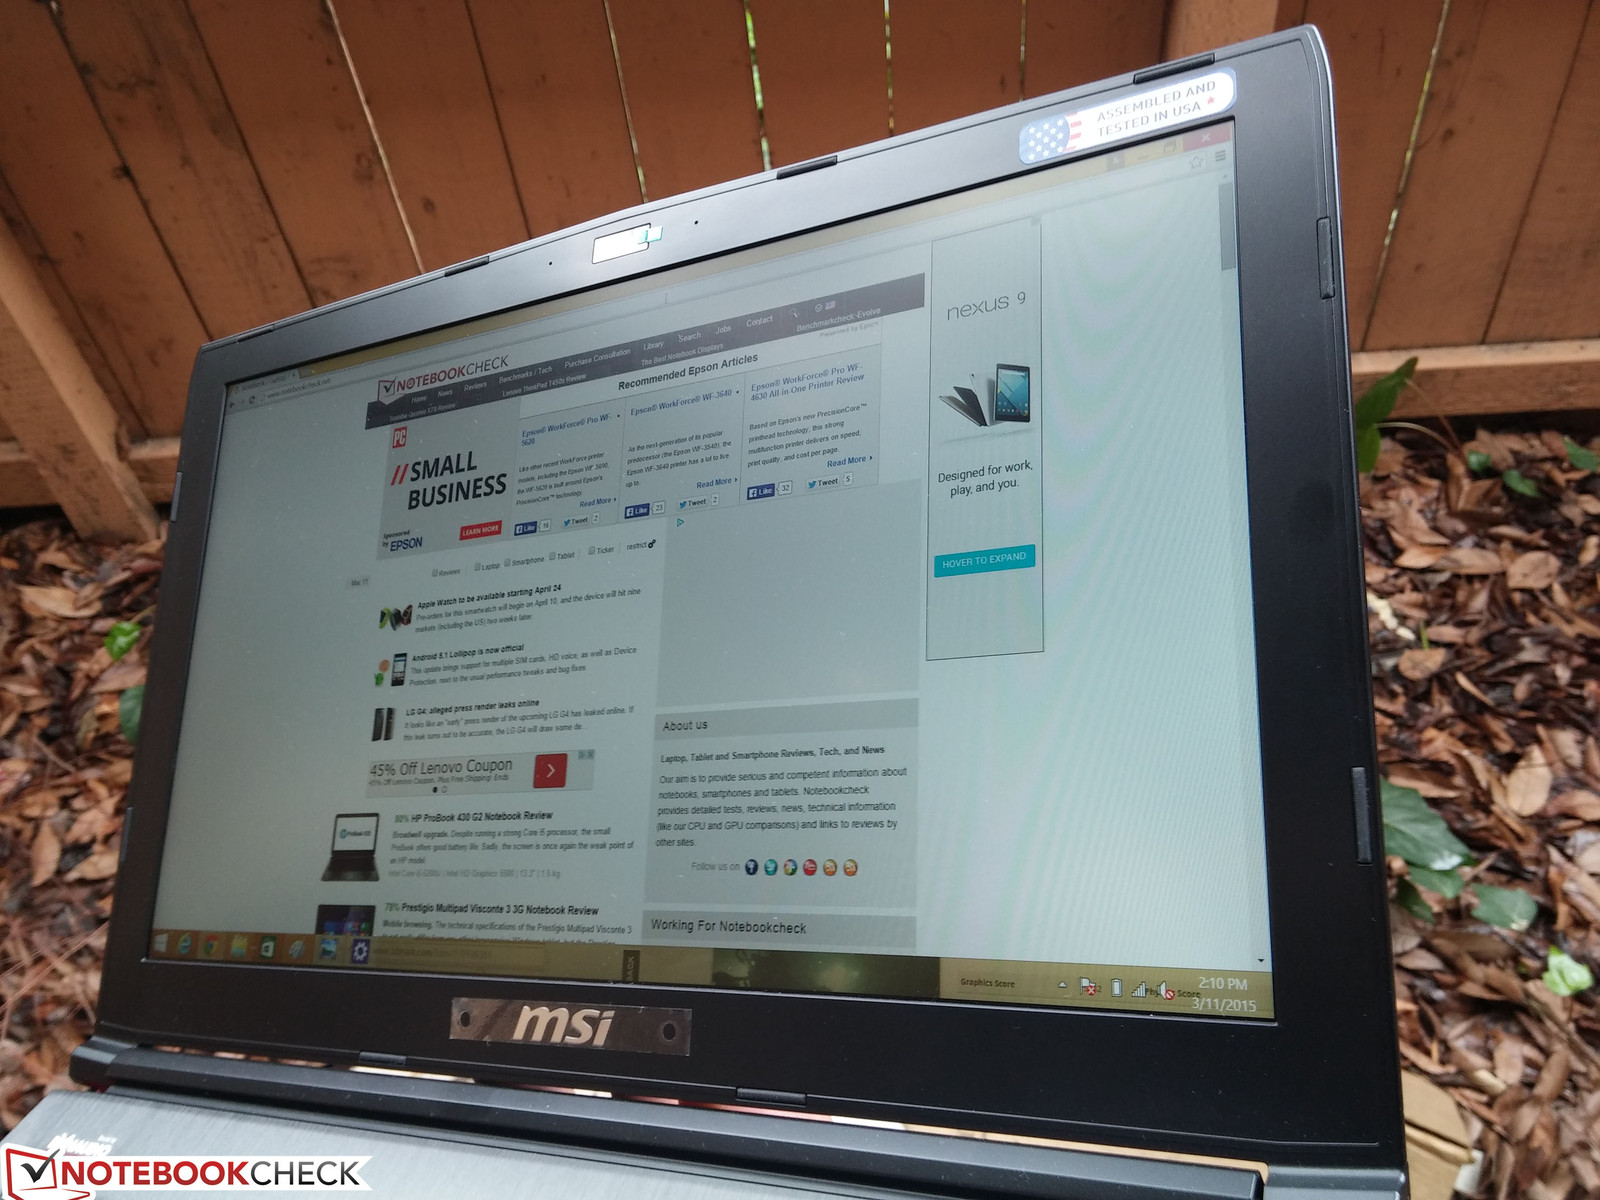
Outdoor usability is limited due to the weight and size. However, visibility is not bad at maximum display brightness due to the relatively strong backlight and matte panel to avoid intrusive glare. It's not nearly bright enough for use under direct sunlight, so working under shade is still recommended.


Viewing angles are excellent with no significant color or grayscale degradation at extreme angles. This is typical of IPS panels and is a significant advantage compared to gaming models with TN solutions.
Performance
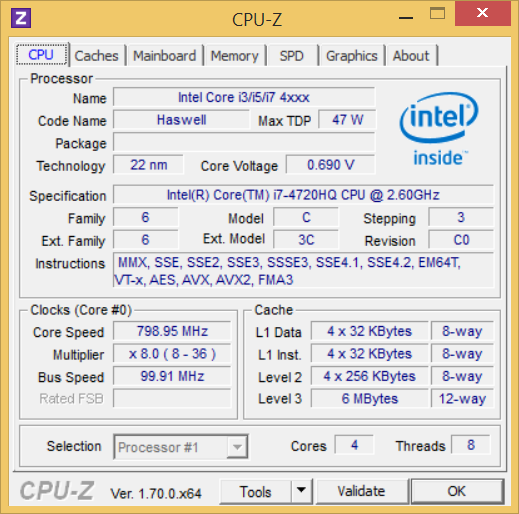
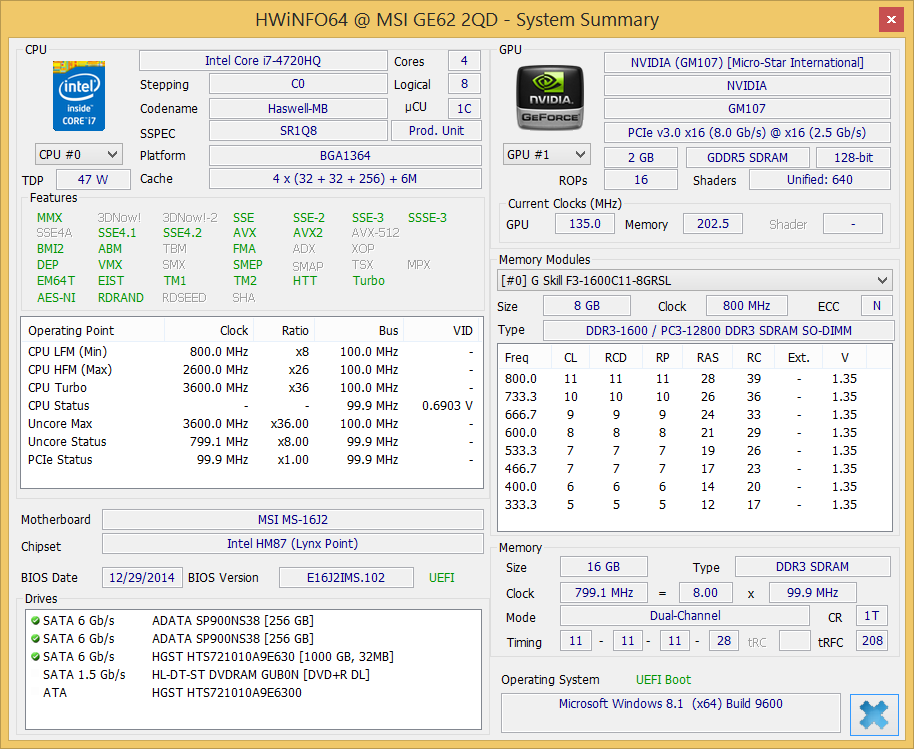
The Core i7-4720HQ is a high-end Haswell core comparable to the older Ivy Bridge i7-3840QM while operating at a slower base clock. Power Saver mode will reduce core clock to just 800 MHz to conserve power, while High Performance will run the core at up to 3.4 GHz or even 3.6 GHz for single-threaded tasks. The same i7-4720HQ CPU can be found on a growing number of dedicated gaming notebooks including the MSI GS70, Gigabyte P34W v3, and the Toshiba Satellite P70.
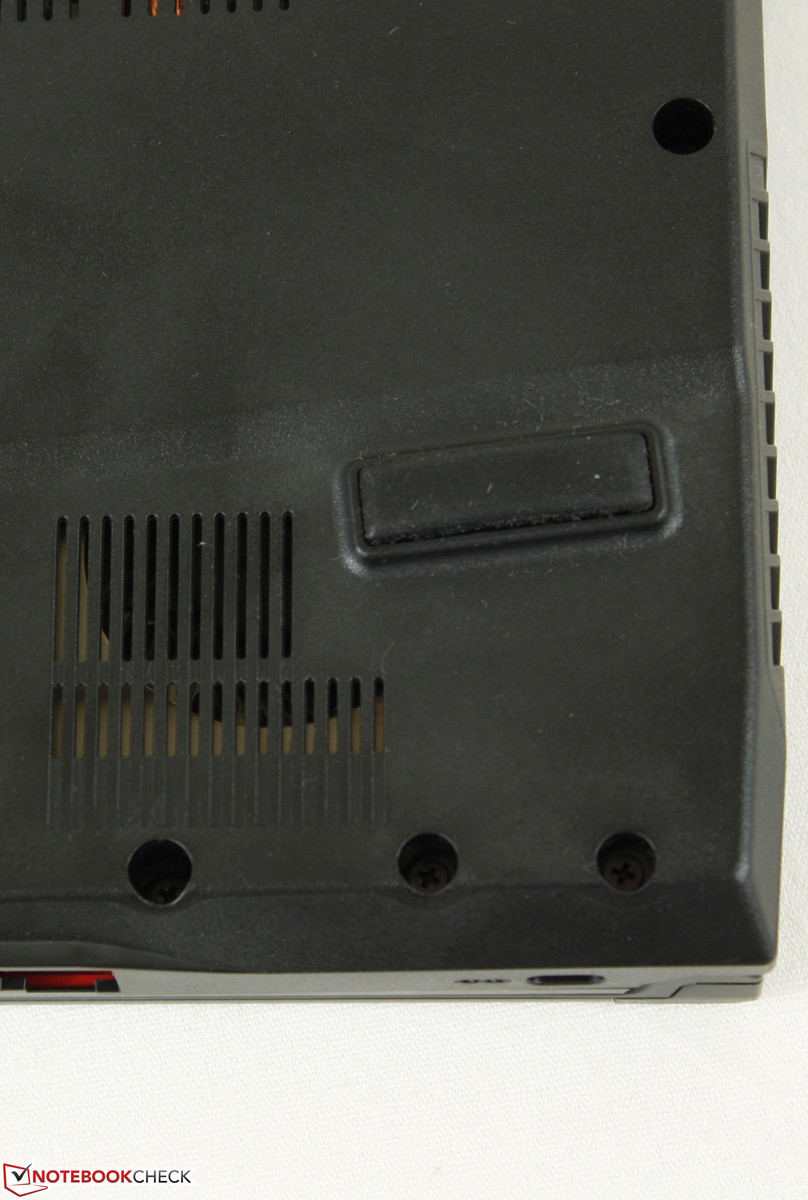
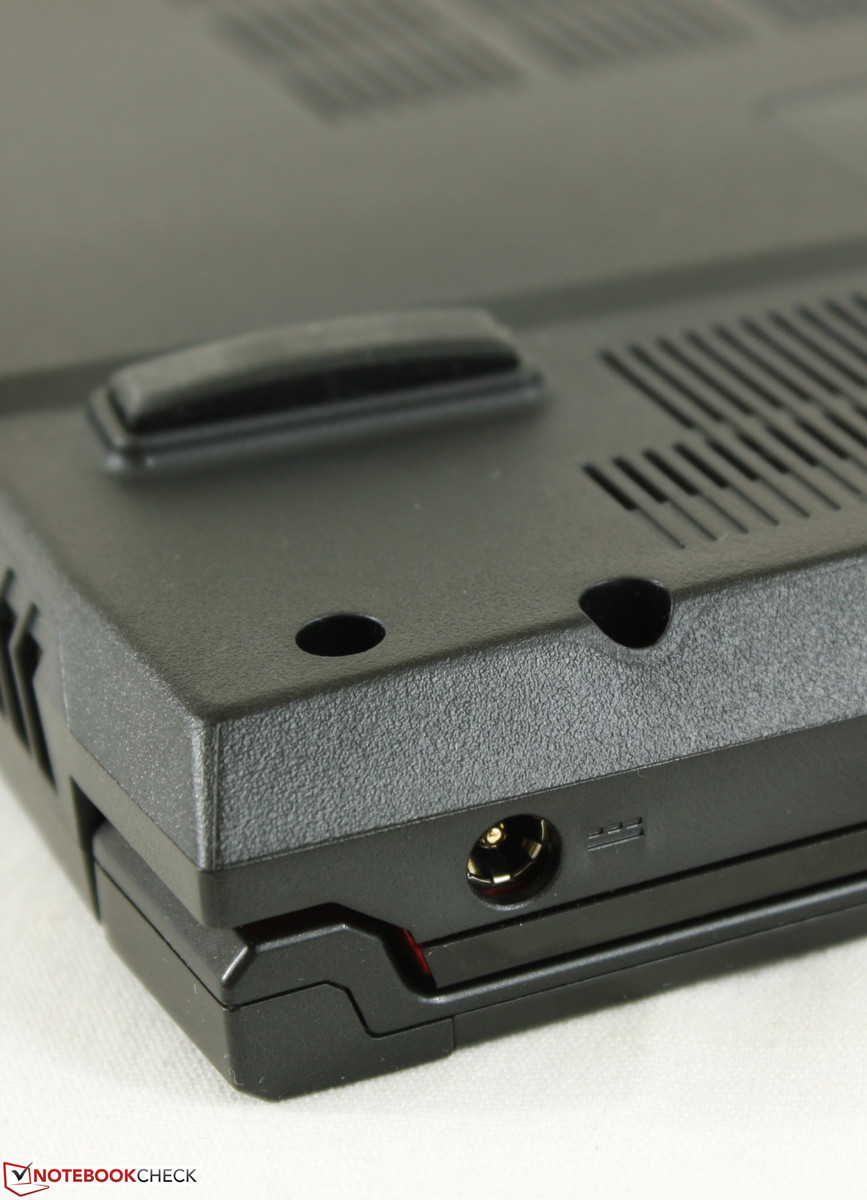
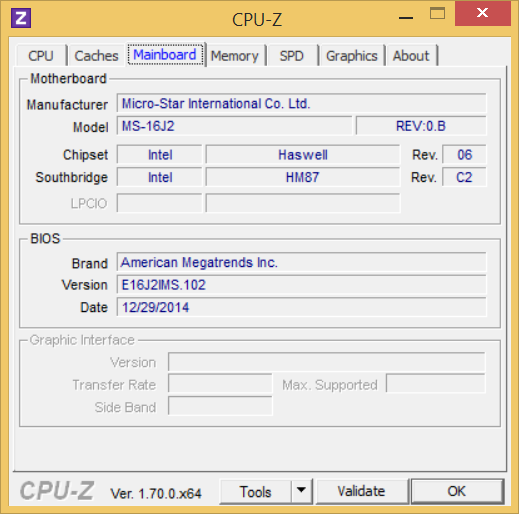
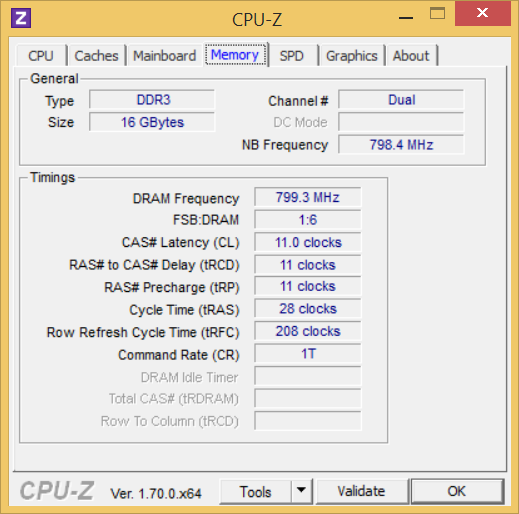
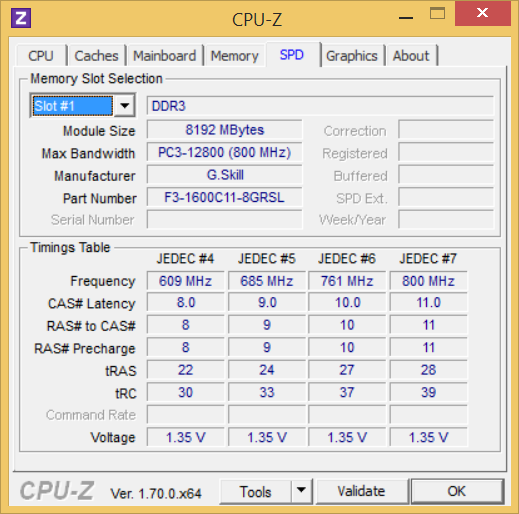
RAM is provided by 2x PC3-12800 G.Skill models for a total of 16 GB. The two SODIMM slots and other internal components are accessible from the bottom of the unit. Removing the panel is not difficult, but definitely not as straightforward as say on the Eurocom P5 Pro as there are more screws to remove and even a separate set of smaller screws around the optical drive.
Processor
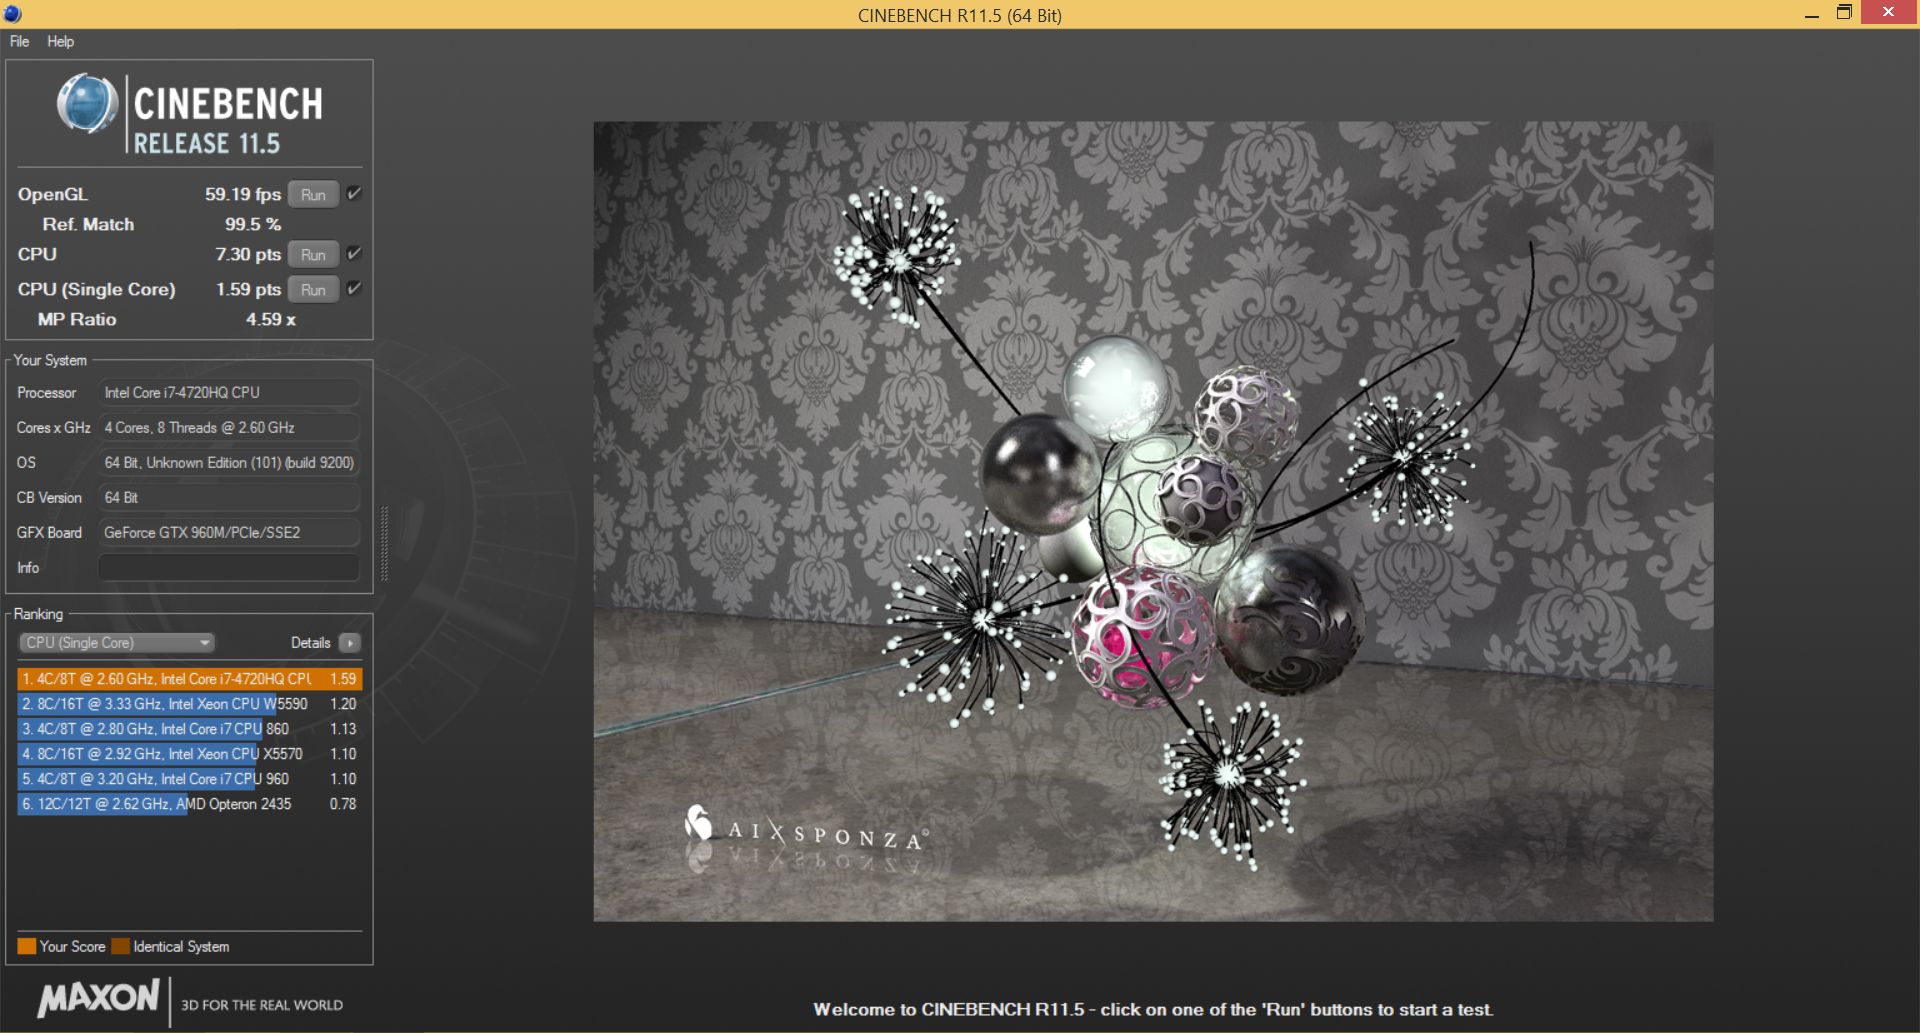
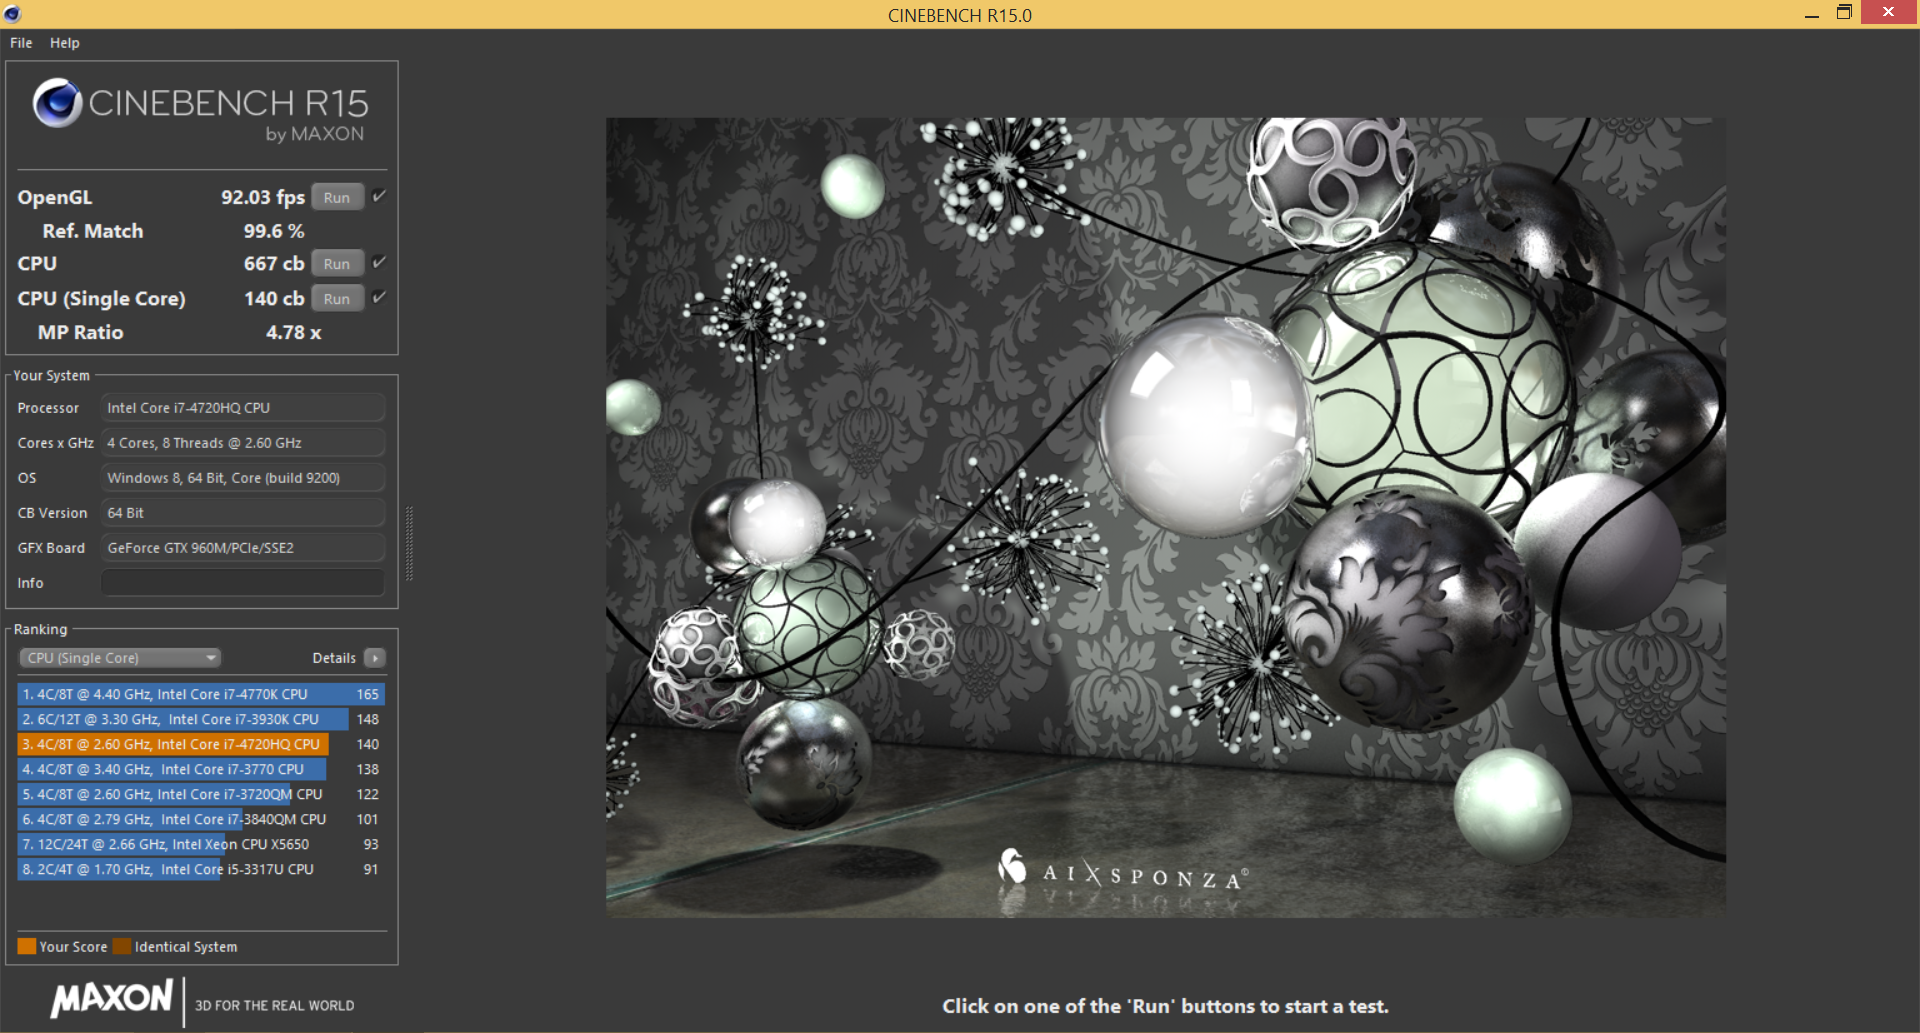
Both Multi-thread and single-thread performance according to CineBench R15 and Super Pi are similar to the popular desktop i7-2600K within just a couple of percentage points. When compared to the i7-4710HQ, however, performance is only marginally better. The performance gap against the i7-4700HQ is wider, but opting for the i7-4710HQ instead of the i7-4720HQ would hardly have an effect on gaming performance and may be worthwhile to save a few dollars.

| Cinebench R11.5 | |
| CPU Single 64Bit (sort by value) | |
| MSI GE62 2QD | |
| Alienware 15 | |
| Lenovo IdeaPad Y50 | |
| Eurocom P5 Pro Extreme | |
| CPU Multi 64Bit (sort by value) | |
| MSI GE62 2QD | |
| Alienware 15 | |
| Lenovo IdeaPad Y50 | |
| Eurocom P5 Pro Extreme | |
| OpenGL 64Bit (sort by value) | |
| MSI GE62 2QD | |
| Alienware 15 | |
| Lenovo IdeaPad Y50 | |
| Eurocom P5 Pro Extreme | |
| Cinebench R15 | |
| CPU Single 64Bit (sort by value) | |
| MSI GE62 2QD | |
| Alienware 15 | |
| Lenovo IdeaPad Y50 | |
| Eurocom P5 Pro Extreme | |
| CPU Multi 64Bit (sort by value) | |
| MSI GE62 2QD | |
| Alienware 15 | |
| Lenovo IdeaPad Y50 | |
| Eurocom P5 Pro Extreme | |
| Ref. Match 64Bit (sort by value) | |
| MSI GE62 2QD | |
| Lenovo IdeaPad Y50 | |
| Eurocom P5 Pro Extreme | |
| OpenGL 64Bit (sort by value) | |
| MSI GE62 2QD | |
| Alienware 15 | |
| Lenovo IdeaPad Y50 | |
| Eurocom P5 Pro Extreme | |
| wPrime 2.10 | |
| 1024m (sort by value) | |
| MSI GE62 2QD | |
| Lenovo IdeaPad Y50 | |
| Eurocom P5 Pro Extreme | |
| 32m (sort by value) | |
| MSI GE62 2QD | |
| Lenovo IdeaPad Y50 | |
| Eurocom P5 Pro Extreme | |
| Super Pi Mod 1.5 XS 32M - 32M (sort by value) | |
| MSI GE62 2QD | |
| Lenovo IdeaPad Y50 | |
| Eurocom P5 Pro Extreme | |
* ... smaller is better
System Performance
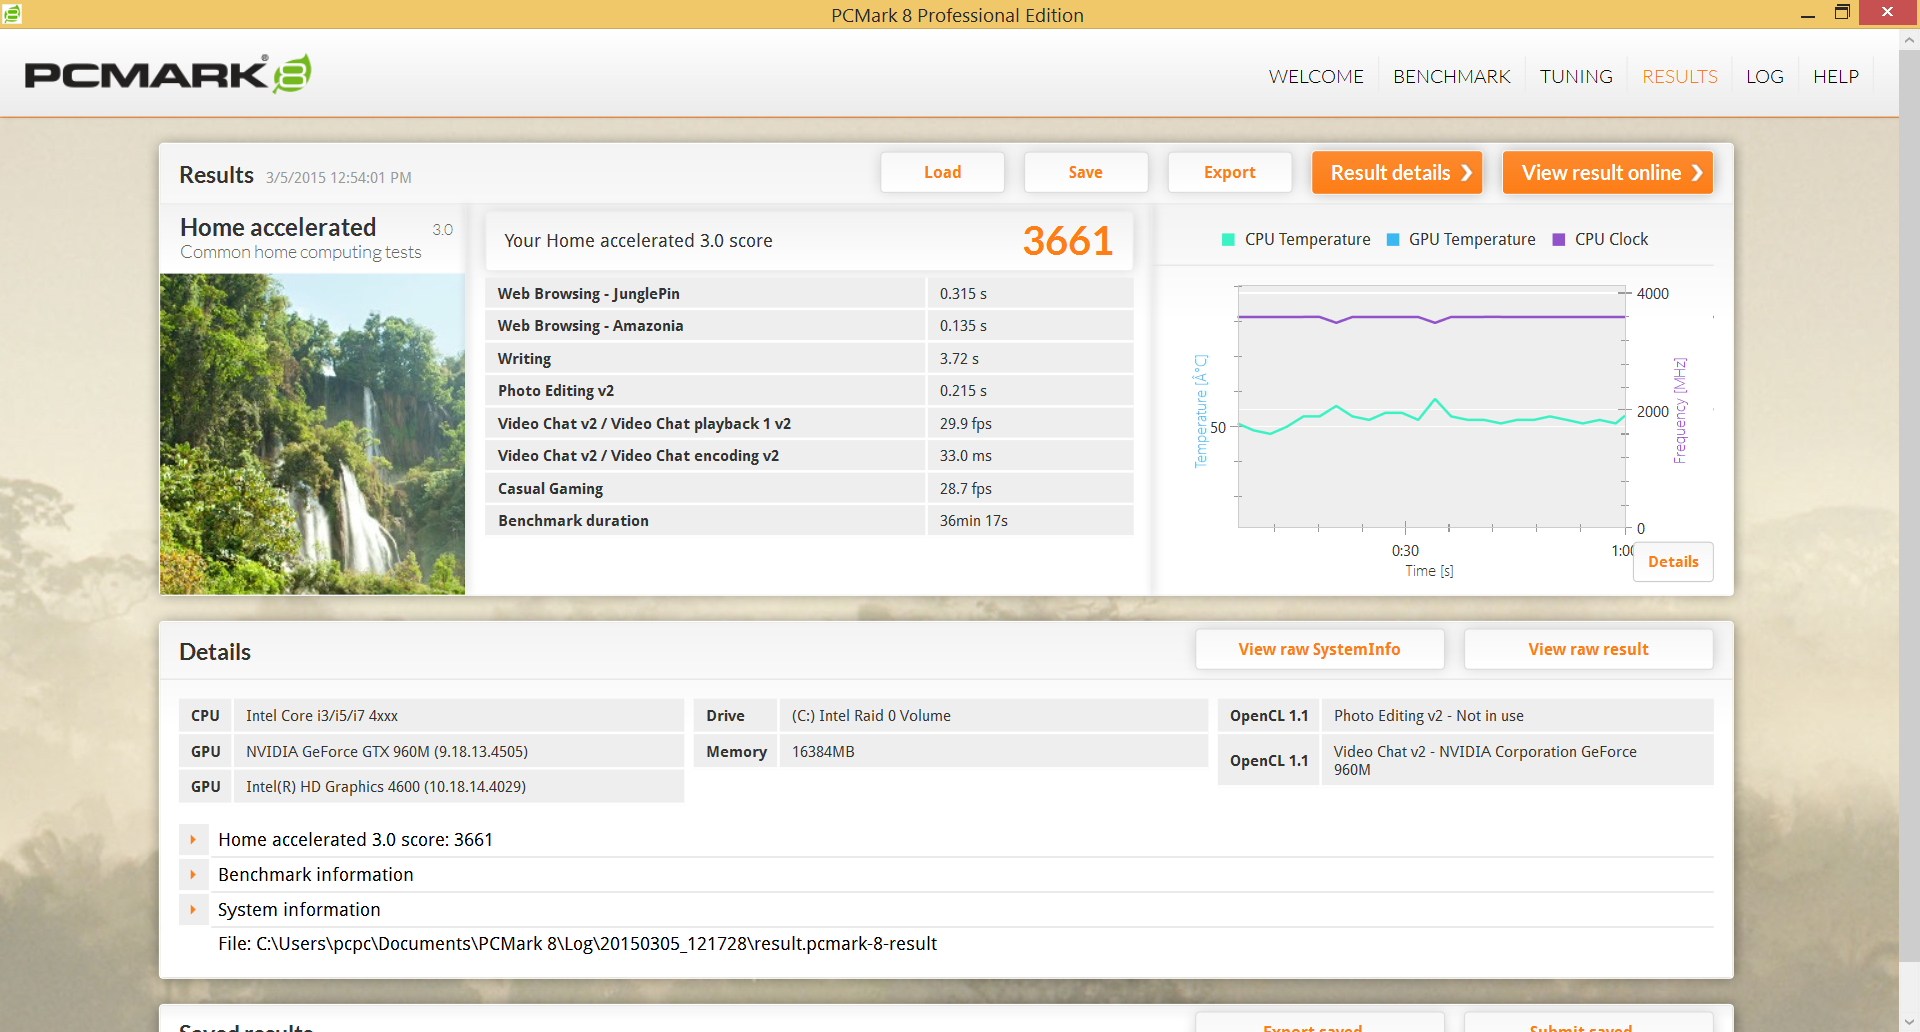
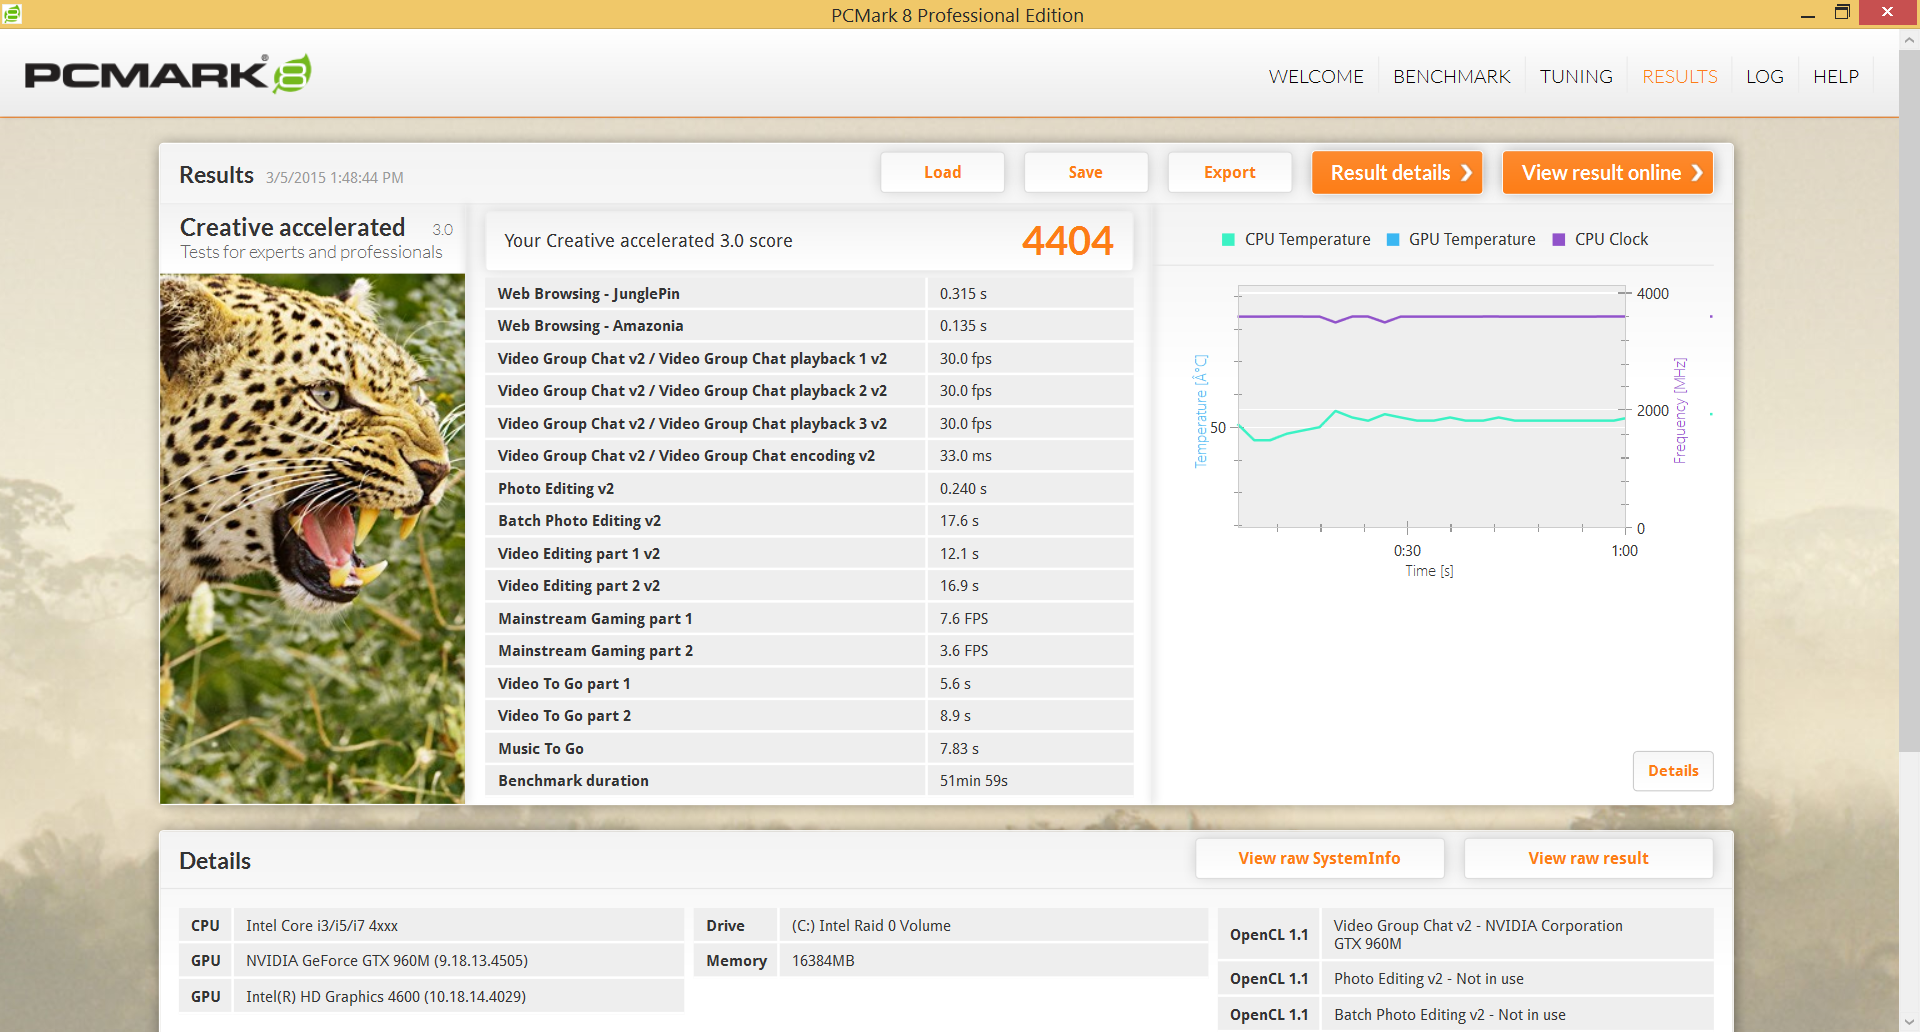
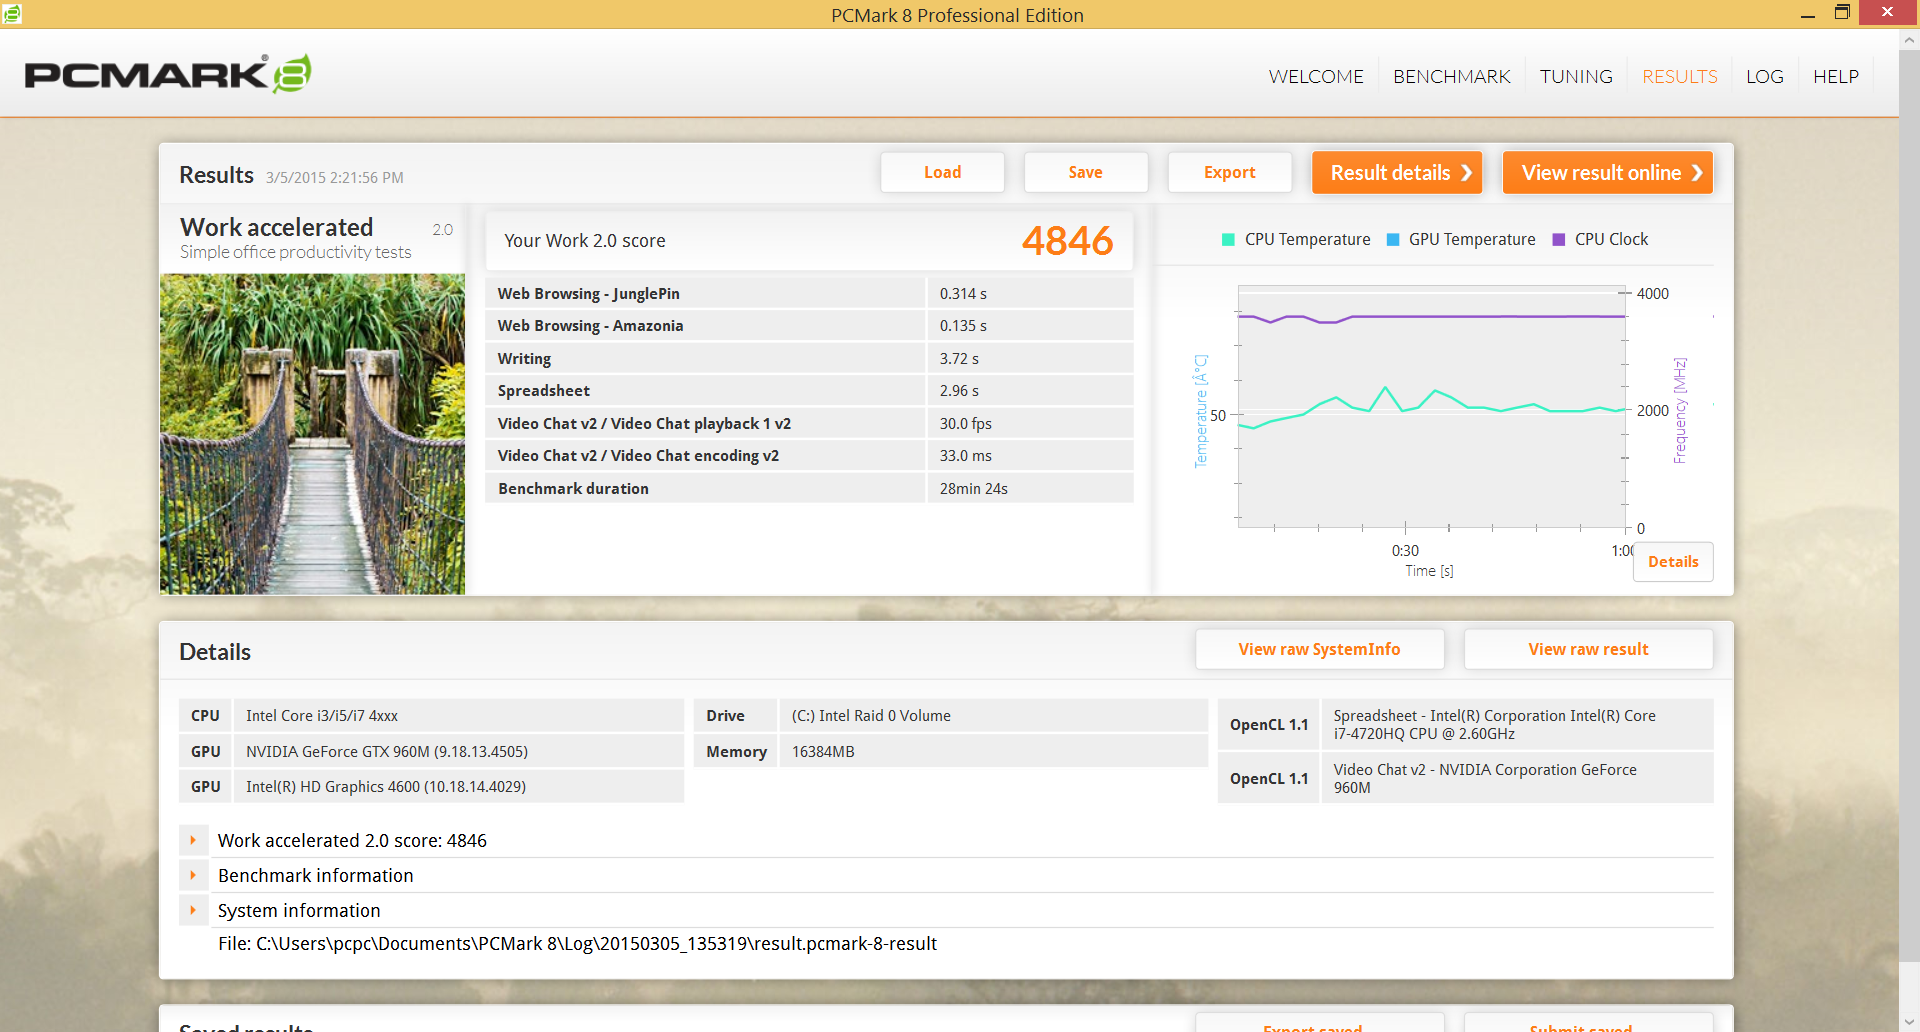
The SSD RAID 0 setup provides the iBuyPower GE62 with a major advantage in system benchmarks compared to systems with just a primary HDD. The PCMark 7 score of 6259 points sits alongside gaming systems with GTX 880M, 870M, and 970M GPUs. The praised Asus G751 and its GTX 980M GPU, for example, scores only about 60 points higher than our GE62. PCMark 8 scores reveal similar results.
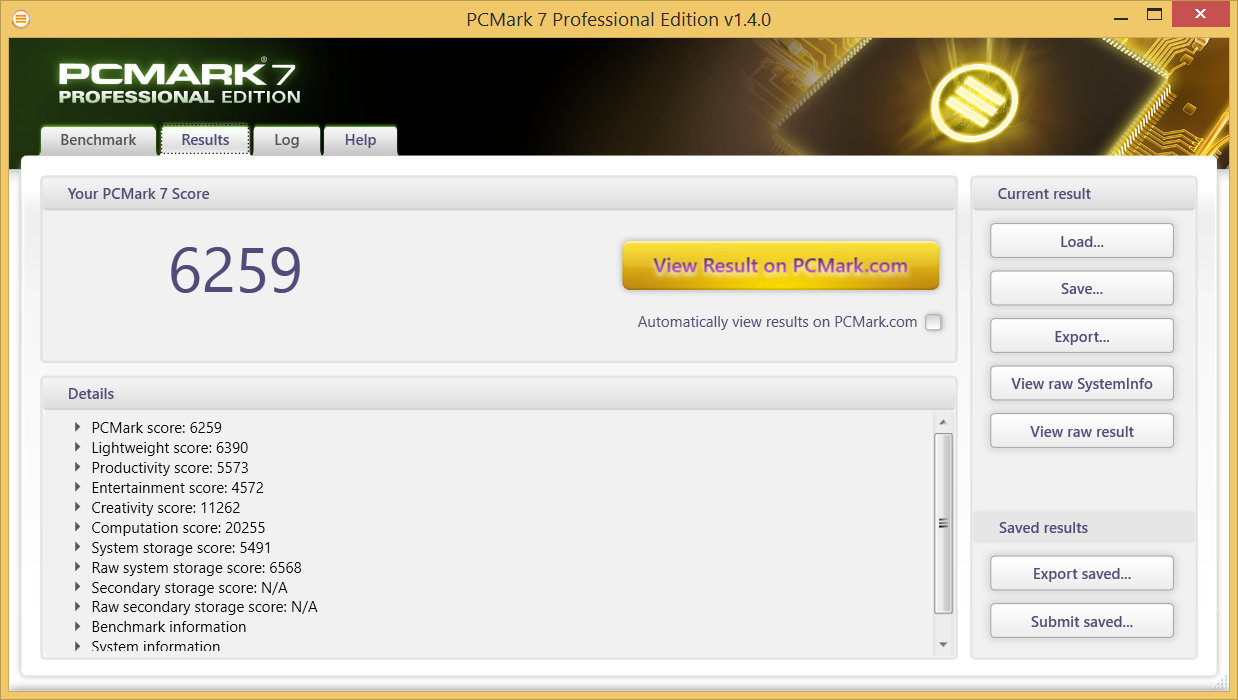
| PCMark 7 Score | 6259 points | |
| PCMark 8 Home Score Accelerated v2 | 3661 points | |
| PCMark 8 Creative Score Accelerated v2 | 4404 points | |
| PCMark 8 Work Score Accelerated v2 | 4846 points | |
Help | ||
Storage Devices
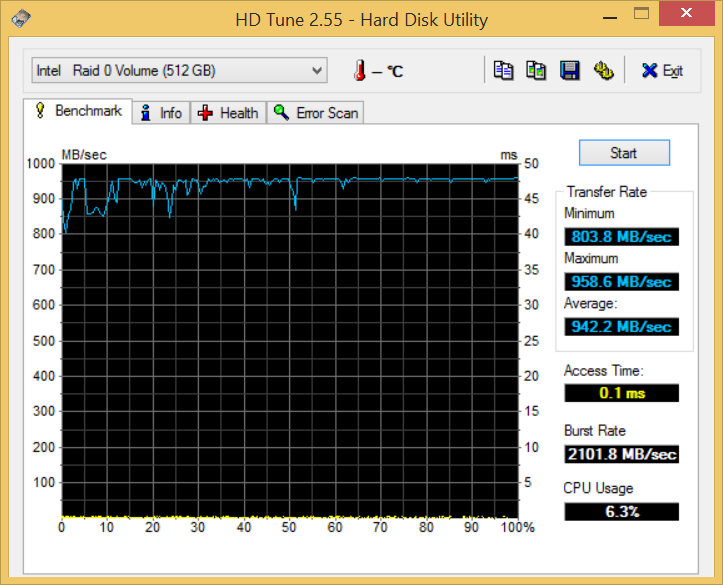
The GE62 houses a total of three storage bays: 2x M.2 slots and 1x 2.5-inch SATA III for either 7 mm or 9.5 mm thick drives. This is common for higher-end gaming models of this size class with the exception of the slimmer Lenovo Y50, which is only able to hold one drive. Our particular unit is equipped with 2x 256 GB ADATA SP900NS38 in RAID 0 and a separate 7200 RPM 1 TB Hitachi Travelstar 7K1000 HDD for additional storage space.
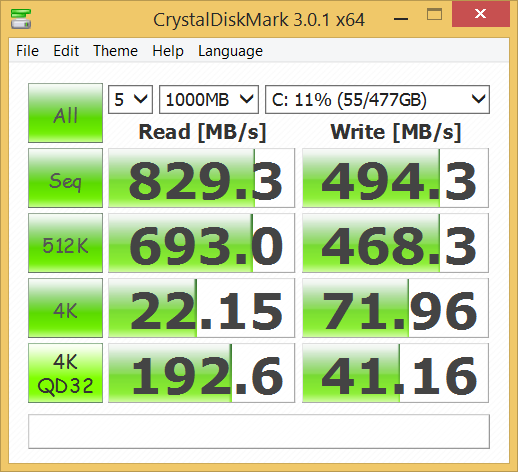
Read performance from the ADATA SSDs is normal for a RAID 0 setup, but sequential write speed is slightly lower than usual at just below 500 MB/s according to Crystal Disk Mark. Other RAID 0 SSDs such as the Intel SSD 510, Lite-On LMT-128L9M, and Samsung MZRPC512 clock in at well above 600 MB/s. On the other hand, Hitachi 7K1000 drives tend to perform better than the average 2.5-inch HDD and the one here shows a high transfer rate of 106 MB/s according to HD Tune. Inexpensive 5400 RPM drives tend to perform in the low 80 MB/s range in comparison.
For our growing list of HDD and SSD benchmarks, see our comparison table here.


Graphics Solution
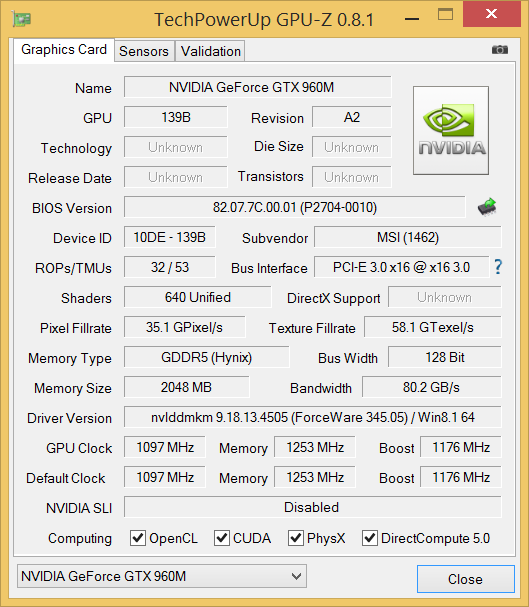
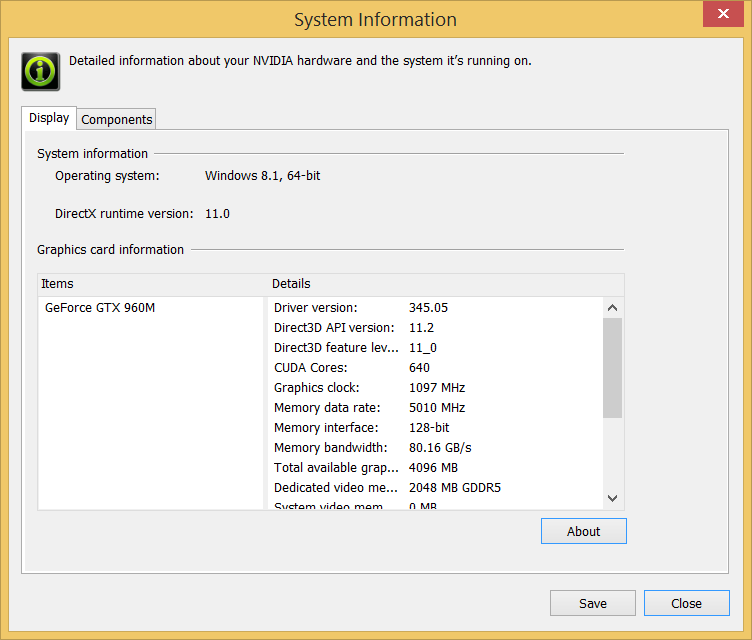
Unlike the confusingly split Kepler and Maxwell versions of the previous GTX 860M, all GTX 960M GPUs will be of the Maxwell generation. Beyond that, the 960M utilizes the same number of CUDA cores (640) with the same 2 GB of GDDR5 VRAM and 128-bit memory interface as its predecessor. Base clock and Turbo clock have been raised slightly to 1097 MHz and 1202 MHz, respectively, compared to 1029 MHz and 1097 MHz of a standard Maxwell GTX 860M. This makes the 960M nothing more than a refresh.
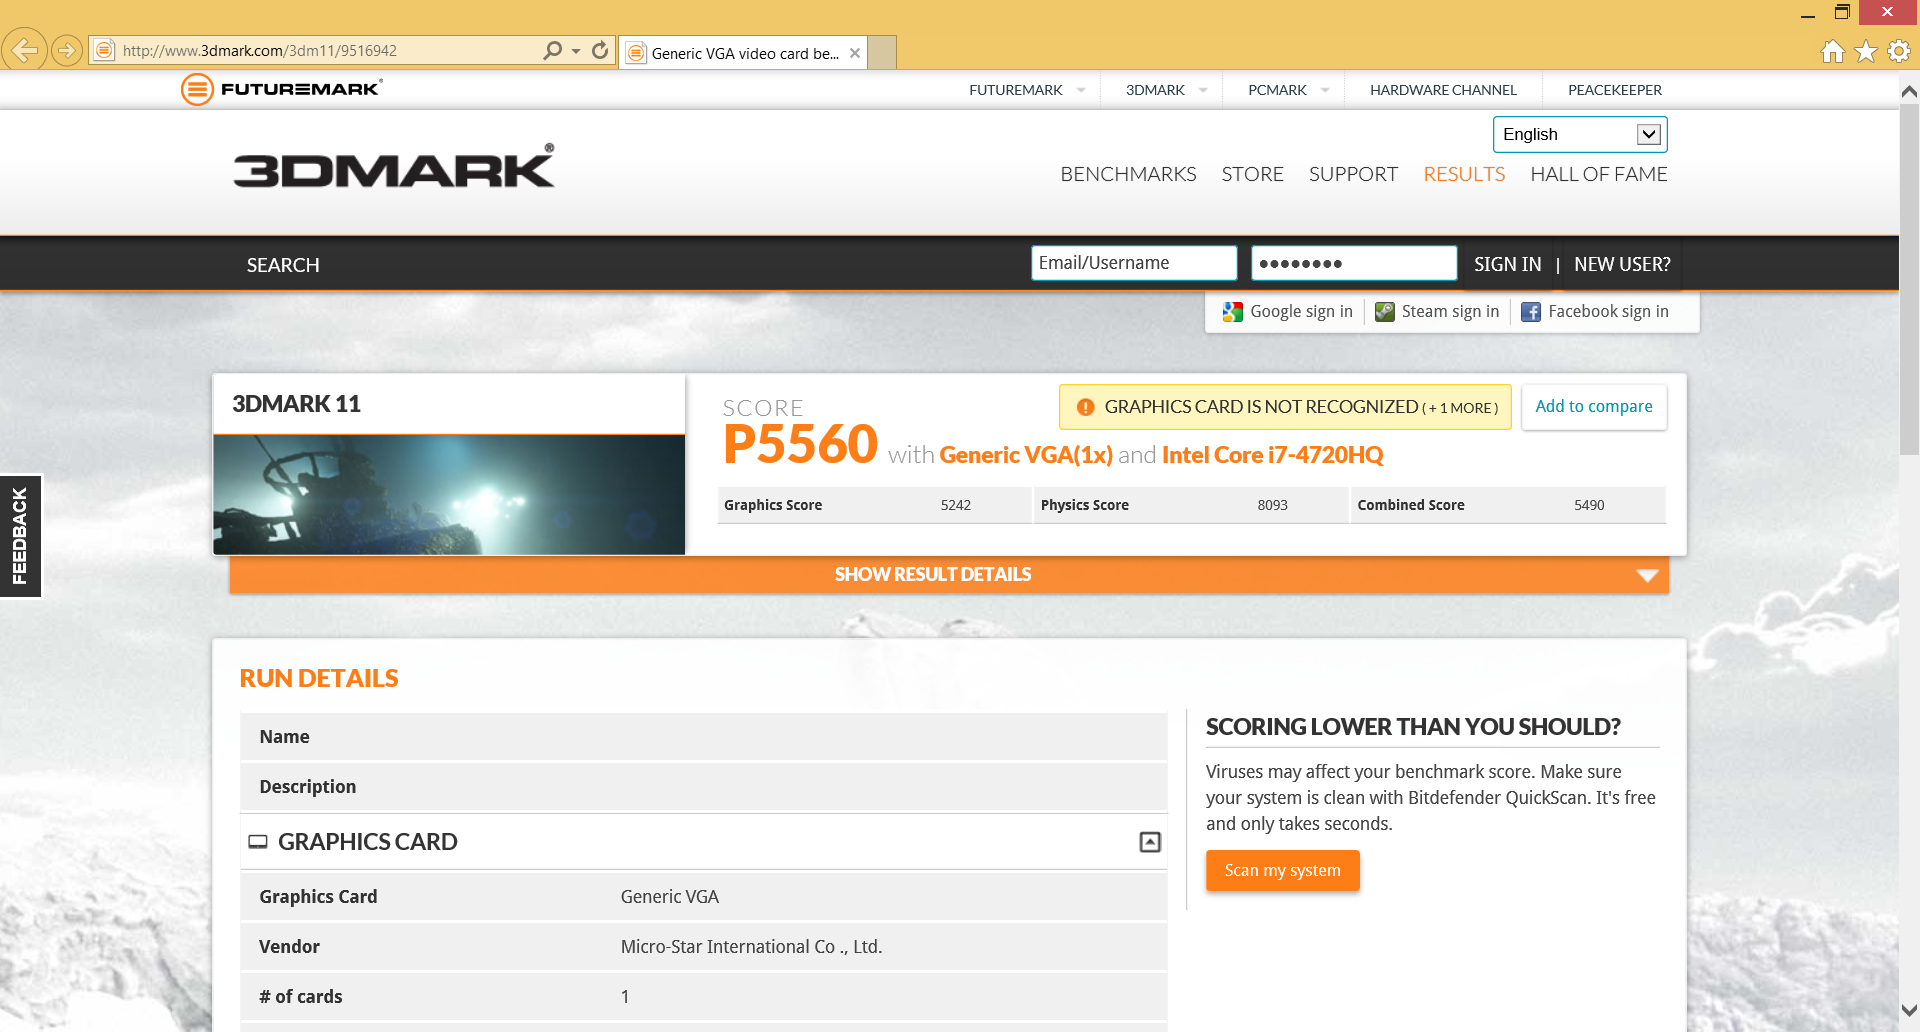
Unsurprisingly, 3DMark numbers are essentially identical to older notebooks such as the Asus G750 and its GTX 860M, the Alienware M18x and its GTX 580M SLI, and the Gigabyte P25W and its GTX 770M. The average GTX 970M scores 9598 points in 3DMark Fire Strike Standard while the 960M in our review model returns just 3825 points in the same benchmark. There's no question that Nvidia is keeping the performance of the 960M in check by cutting corners on the number of CUDA cores and VRAM, especially when compared to the 965M.
For more information and benchmarks on the GTX 960M, see our in-depth review here.
| 3DMark 06 Standard Score | 26126 points | |
| 3DMark 11 Performance | 5560 points | |
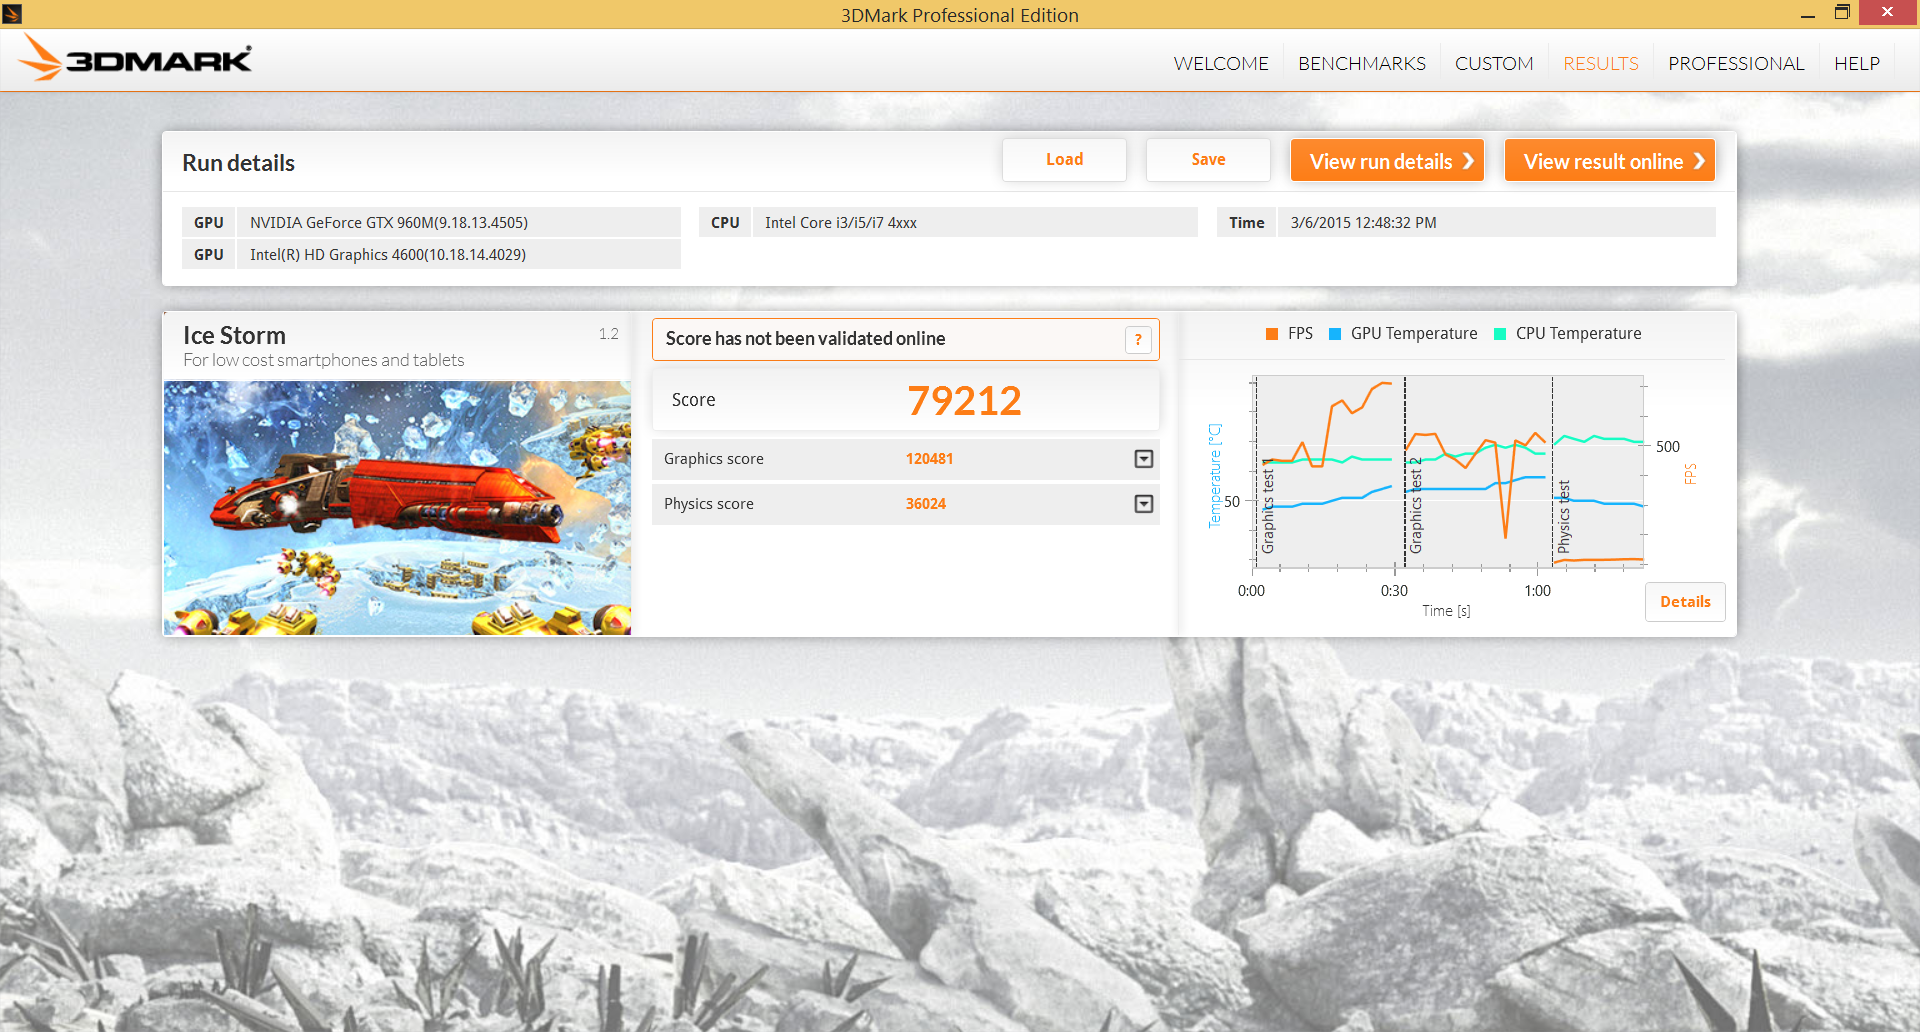
| 3DMark Ice Storm Standard Score | 79212 points | |
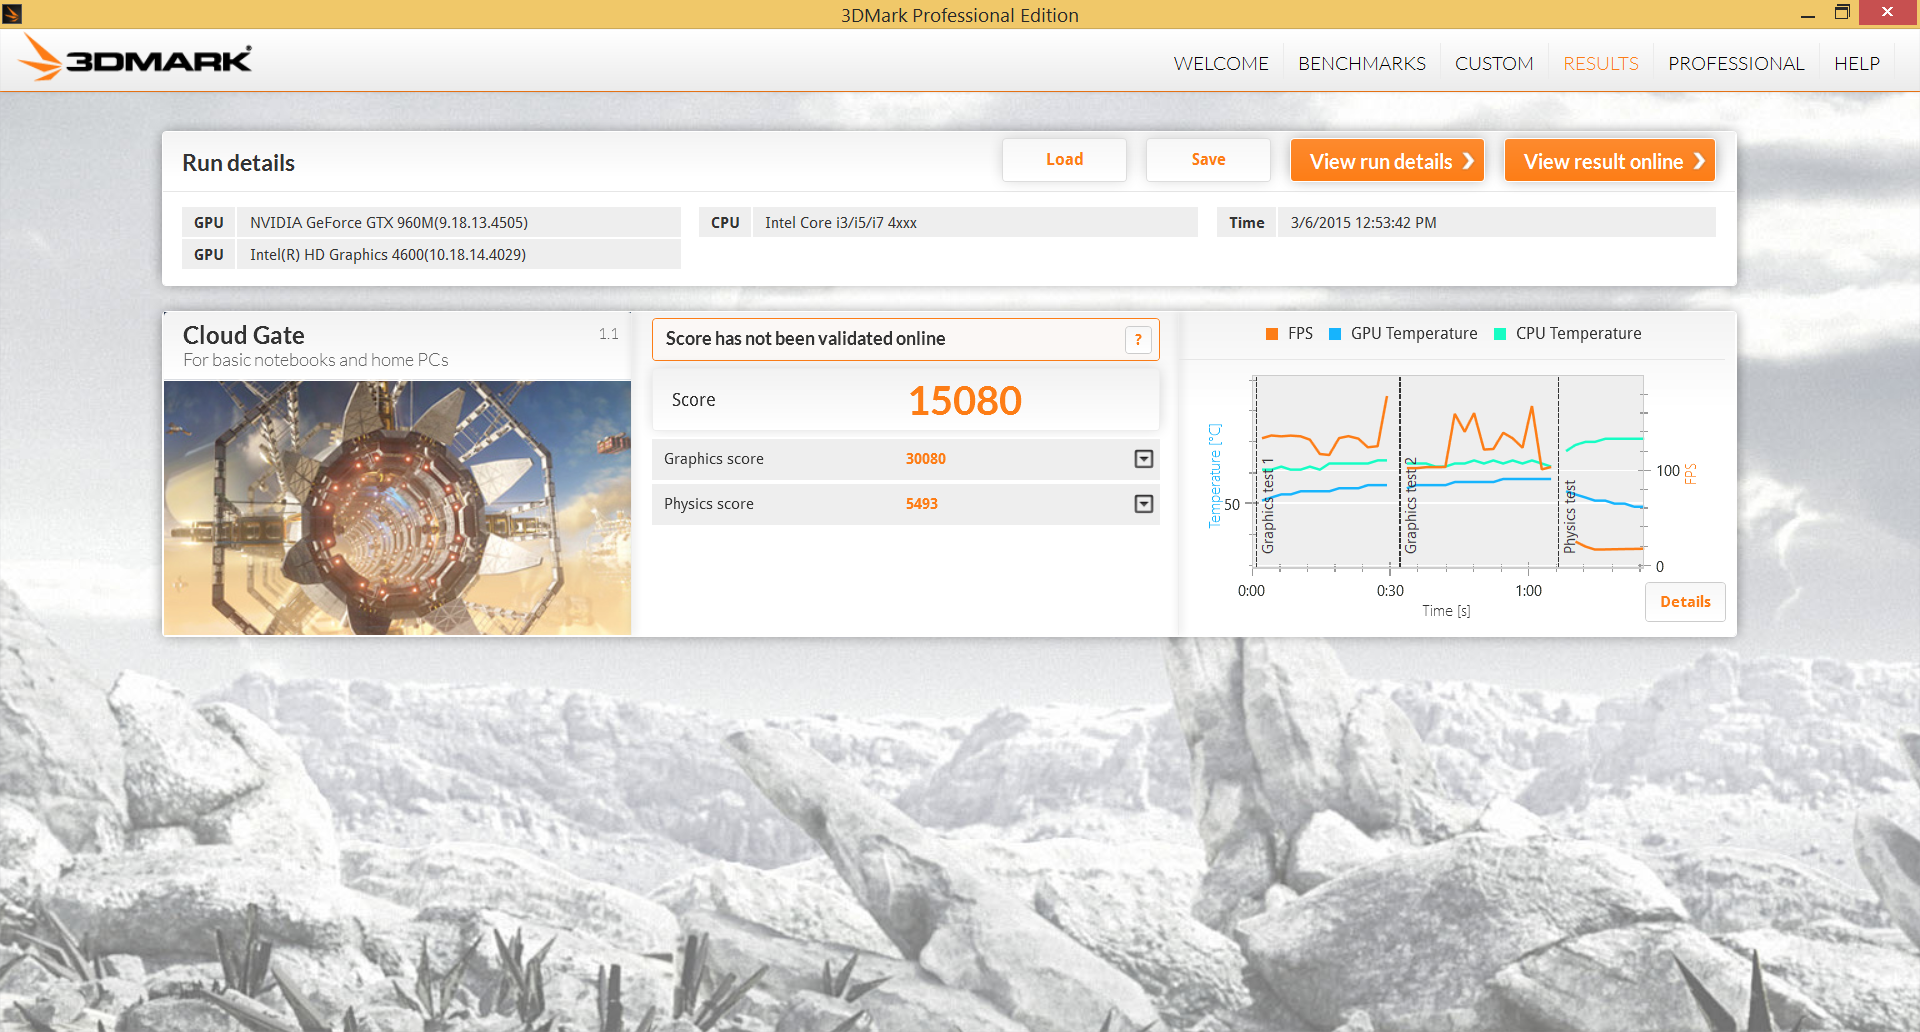
| 3DMark Cloud Gate Standard Score | 15080 points | |
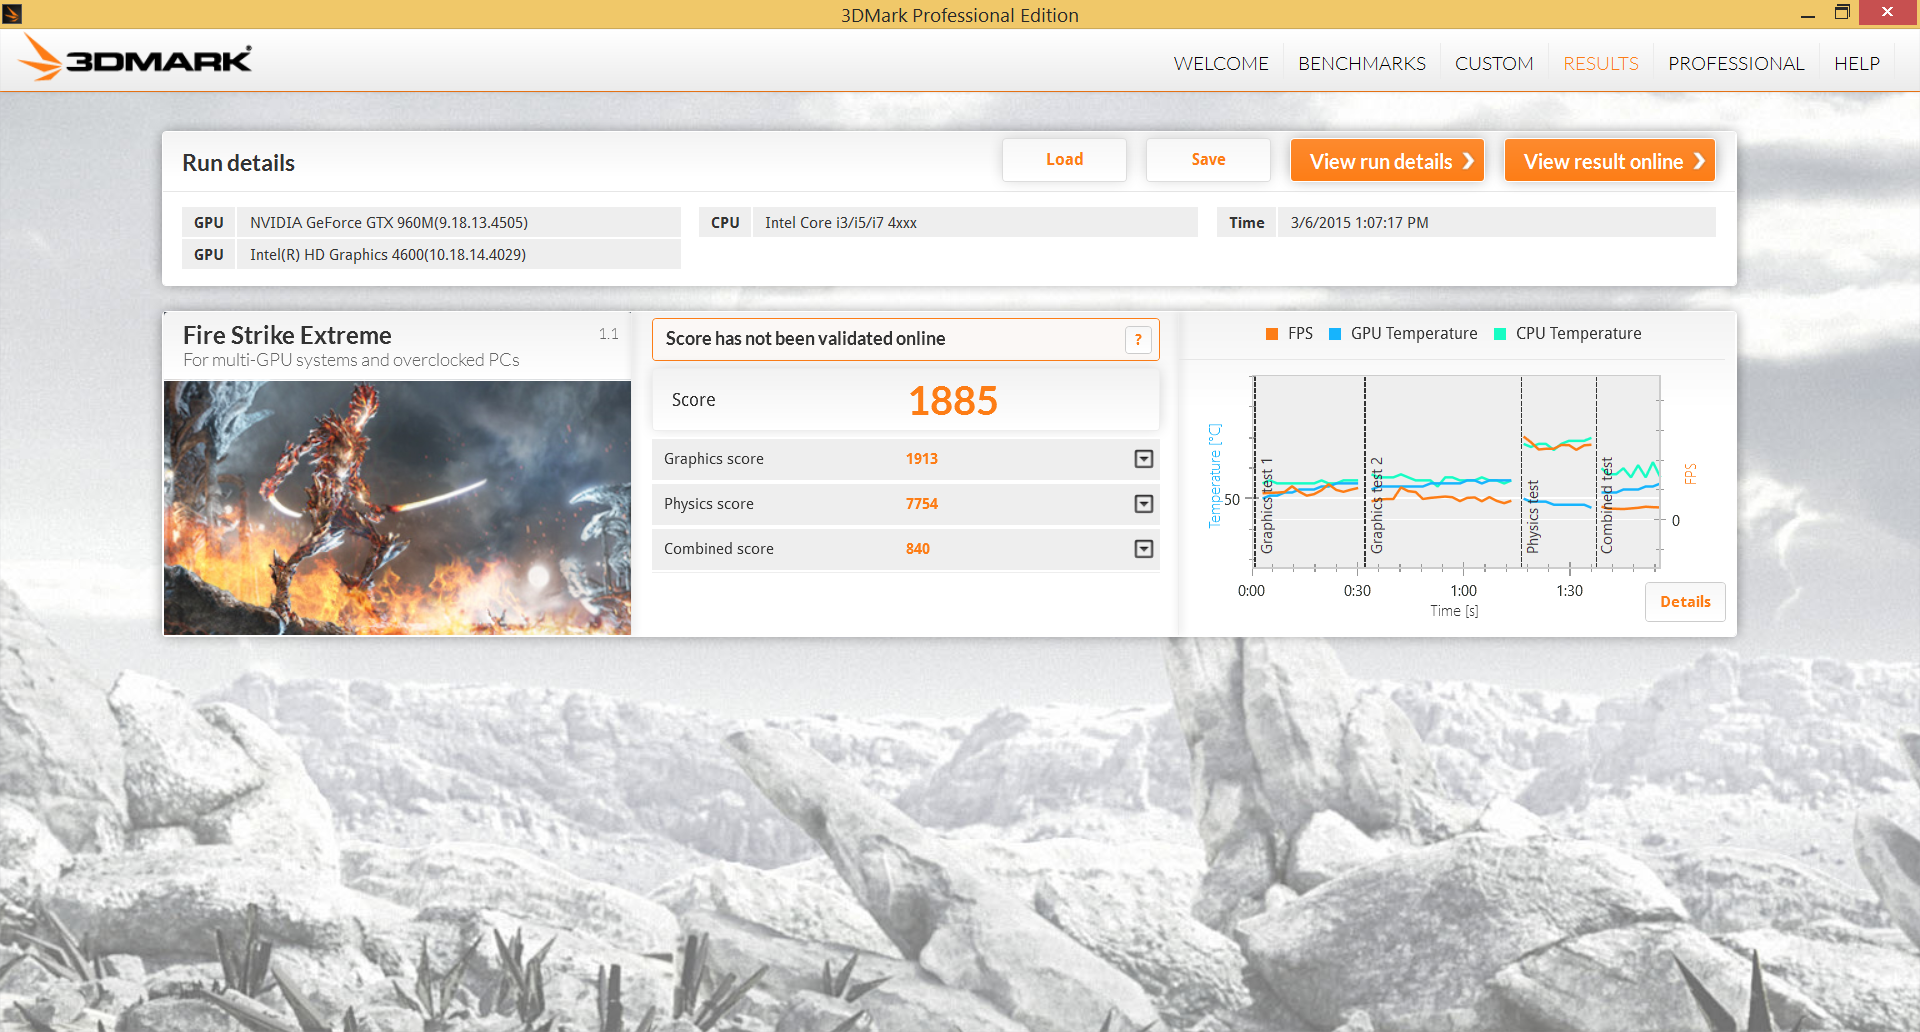
| 3DMark Fire Strike Score | 3825 points | |
| 3DMark Fire Strike Extreme Score | 1885 points | |
Help | ||
Gaming Performance
Is the 960M a worthy successor to the popular 860M in terms of performance? In practice, the differences are marginal. Most games see single digit increases in frame rate on high settings while the 970M blasts the 960M out of the water by as much as 50 percent or more depending on the title. By halving the CUDA cores and reducing the memory bus by 33 percent compared to a 970M, the 960M struggles when graphical features are turned up. The 965M, for example, runs at a slower clock rate than the 960M yet manages to outperform it by as much as 30 percent on Thief due largely to having a much wider rendering pipeline.


| low | med. | high | ultra | |
|---|---|---|---|---|
| Sleeping Dogs (2012) | 146.1 | 92.5 | 24.1 | |
| Guild Wars 2 (2012) | 57.8 | 33.8 | ||
| Tomb Raider (2013) | 166.6 | 111.7 | 48.9 | |
| StarCraft II: Heart of the Swarm (2013) | 120.7 | 106.9 | 54 | |
| BioShock Infinite (2013) | 131.9 | 119.4 | 45.5 | |
| Metro: Last Light (2013) | 91.3 | 58.5 | 30.3 | |
| Thief (2014) | 61.1 | 52.3 | 27 | |
| Middle-earth: Shadow of Mordor (2014) | 81.3 | 42.2 | 30.1 | |
| Ryse: Son of Rome (2014) | 64.7 | 30.1 | 27.7 | |
| F1 2014 (2014) | 112 | 108 | 88 | |
| Call of Duty: Advanced Warfare (2014) | 86.6 | 55.2 | 30.4 | |
| Dragon Age: Inquisition (2014) | 59.4 | 33.4 | 22.3 |
| Sleeping Dogs | |
| 1920x1080 Extreme Preset AA:Extreme (sort by value) | |
| MSI GE62 2QD | |
| Ibuypower Chimera CX-9 | |
| 1366x768 High Preset AA:High (sort by value) | |
| MSI GE62 2QD | |
| Ibuypower Chimera CX-9 | |
| 1366x768 Medium Preset AA:Normal (sort by value) | |
| MSI GE62 2QD | |
| Ibuypower Chimera CX-9 | |
| Guild Wars 2 | |
| 1920x1080 All Maximum / On AA:FX (sort by value) | |
| MSI GE62 2QD | |
| Ibuypower Chimera CX-9 | |
| Schenker XMG P505 | |
| 1366x768 Best Appearance Preset AA:FX (sort by value) | |
| MSI GE62 2QD | |
| Ibuypower Chimera CX-9 | |
| Schenker XMG P505 | |
| 1024x768 Best Performance Preset (sort by value) | |
| Schenker XMG P505 | |
| Tomb Raider | |
| 1920x1080 Ultra Preset AA:FX AF:16x (sort by value) | |
| MSI GE62 2QD | |
| Ibuypower Chimera CX-9 | |
| Schenker XMG P505 | |
| MSI GE62-2QEUi716H21BW | |
| 1366x768 High Preset AA:FX AF:8x (sort by value) | |
| MSI GE62 2QD | |
| Ibuypower Chimera CX-9 | |
| Schenker XMG P505 | |
| MSI GE62-2QEUi716H21BW | |
| 1366x768 Normal Preset AA:FX AF:4x (sort by value) | |
| MSI GE62 2QD | |
| Ibuypower Chimera CX-9 | |
| Schenker XMG P505 | |
| MSI GE62-2QEUi716H21BW | |
| 1024x768 Low Preset (sort by value) | |
| Schenker XMG P505 | |
| MSI GE62-2QEUi716H21BW | |
| StarCraft II: Heart of the Swarm | |
| 1920x1080 Ultra / Extreme AA:on (sort by value) | |
| MSI GE62 2QD | |
| Ibuypower Chimera CX-9 | |
| MSI GE62-2QEUi716H21BW | |
| 1366x768 High AA:on (sort by value) | |
| MSI GE62 2QD | |
| Ibuypower Chimera CX-9 | |
| MSI GE62-2QEUi716H21BW | |
| 1366x768 Medium (sort by value) | |
| MSI GE62 2QD | |
| Ibuypower Chimera CX-9 | |
| MSI GE62-2QEUi716H21BW | |
| 1024x768 Low (sort by value) | |
| MSI GE62-2QEUi716H21BW | |
| BioShock Infinite | |
| 1920x1080 Ultra Preset, DX11 (DDOF) (sort by value) | |
| MSI GE62 2QD | |
| Ibuypower Chimera CX-9 | |
| Schenker XMG P505 | |
| MSI GE62-2QEUi716H21BW | |
| 1366x768 High Preset (sort by value) | |
| MSI GE62 2QD | |
| Ibuypower Chimera CX-9 | |
| Schenker XMG P505 | |
| MSI GE62-2QEUi716H21BW | |
| 1366x768 Medium Preset (sort by value) | |
| MSI GE62 2QD | |
| Ibuypower Chimera CX-9 | |
| Schenker XMG P505 | |
| MSI GE62-2QEUi716H21BW | |
| 1280x720 Very Low Preset (sort by value) | |
| Schenker XMG P505 | |
| MSI GE62-2QEUi716H21BW | |
| Metro: Last Light | |
| 1920x1080 Very High (DX11) AF:16x (sort by value) | |
| MSI GE62 2QD | |
| Ibuypower Chimera CX-9 | |
| Asus G750JS-T4064H | |
| Schenker XMG P505 | |
| 1366x768 High (DX11) AF:16x (sort by value) | |
| MSI GE62 2QD | |
| Ibuypower Chimera CX-9 | |
| Asus G750JS-T4064H | |
| Schenker XMG P505 | |
| 1366x768 Medium (DX10) AF:4x (sort by value) | |
| MSI GE62 2QD | |
| Ibuypower Chimera CX-9 | |
| Asus G750JS-T4064H | |
| Schenker XMG P505 | |
| 1024x768 Low (DX10) AF:4x (sort by value) | |
| Asus G750JS-T4064H | |
| Schenker XMG P505 | |
| Thief | |
| 1920x1080 Very High Preset AA:FXAA & High SS AF:8x (sort by value) | |
| MSI GE62 2QD | |
| Ibuypower Chimera CX-9 | |
| Schenker XMG P505 | |
| MSI GE62-2QEUi716H21BW | |
| 1366x768 High Preset AA:FXAA & Low SS AF:4x (sort by value) | |
| MSI GE62 2QD | |
| Ibuypower Chimera CX-9 | |
| Schenker XMG P505 | |
| MSI GE62-2QEUi716H21BW | |
| 1366x768 Normal Preset AA:FX (sort by value) | |
| MSI GE62 2QD | |
| Ibuypower Chimera CX-9 | |
| Schenker XMG P505 | |
| MSI GE62-2QEUi716H21BW | |
| 1024x768 Very Low Preset (sort by value) | |
| Schenker XMG P505 | |
| MSI GE62-2QEUi716H21BW | |
| Middle-earth: Shadow of Mordor | |
| 1920x1080 Ultra Preset (HD Package) (sort by value) | |
| MSI GE62 2QD | |
| Schenker XMG P505 | |
| 1920x1080 High Preset (sort by value) | |
| MSI GE62 2QD | |
| Schenker XMG P505 | |
| 1344x756 Medium Preset (sort by value) | |
| MSI GE62 2QD | |
| Schenker XMG P505 | |
| 1280x720 Lowest Preset (sort by value) | |
| Schenker XMG P505 | |
| Ryse: Son of Rome | |
| 1920x1080 Very High Texture Res. + High Graphics Quality (Motion Blur & Temporal AA On, Rest Off/Disabled) AF:8x (sort by value) | |
| MSI GE62 2QD | |
| Ibuypower Chimera CX-9 | |
| Schenker XMG P505 | |
| 1920x1080 High Texture Res. + High Graphics Quality (Rest Off/Disabled) AF:8x (sort by value) | |
| MSI GE62 2QD | |
| Ibuypower Chimera CX-9 | |
| Schenker XMG P505 | |
| 1366x768 Medium Texture Res. + Normal Graphics Quality (Rest Off/Disabled) AF:4x (sort by value) | |
| MSI GE62 2QD | |
| Ibuypower Chimera CX-9 | |
| Schenker XMG P505 | |
| 1024x768 Low Texture Res. + Low Graphics Quality (Rest Off/Disabled) AF:2x (sort by value) | |
| Schenker XMG P505 | |
| F1 2014 | |
| 1920x1080 Ultra Preset AA:4x MS (sort by value) | |
| MSI GE62 2QD | |
| Ibuypower Chimera CX-9 | |
| 1920x1080 High Preset (sort by value) | |
| MSI GE62 2QD | |
| Ibuypower Chimera CX-9 | |
| 1366x768 Medium Preset (sort by value) | |
| MSI GE62 2QD | |
| Ibuypower Chimera CX-9 | |
| Call of Duty: Advanced Warfare | |
| 1920x1080 Extra / On (Cache Shadow Maps Off), 2x Supersampling AA:2x SM (sort by value) | |
| MSI GE62 2QD | |
| 1920x1080 High / On (Cache Shadow Maps Off) AA:FX (sort by value) | |
| MSI GE62 2QD | |
| 1366x768 Normal / On (Cache Shadow Maps Off) (sort by value) | |
| MSI GE62 2QD | |
| Dragon Age: Inquisition | |
| 1920x1080 Ultra Graphics Quality AA:2x MS (sort by value) | |
| MSI GE62 2QD | |
| 1920x1080 High Graphics Quality (sort by value) | |
| MSI GE62 2QD | |
| 1366x768 Medium Graphics Quality (sort by value) | |
| MSI GE62 2QD | |
Stress Test
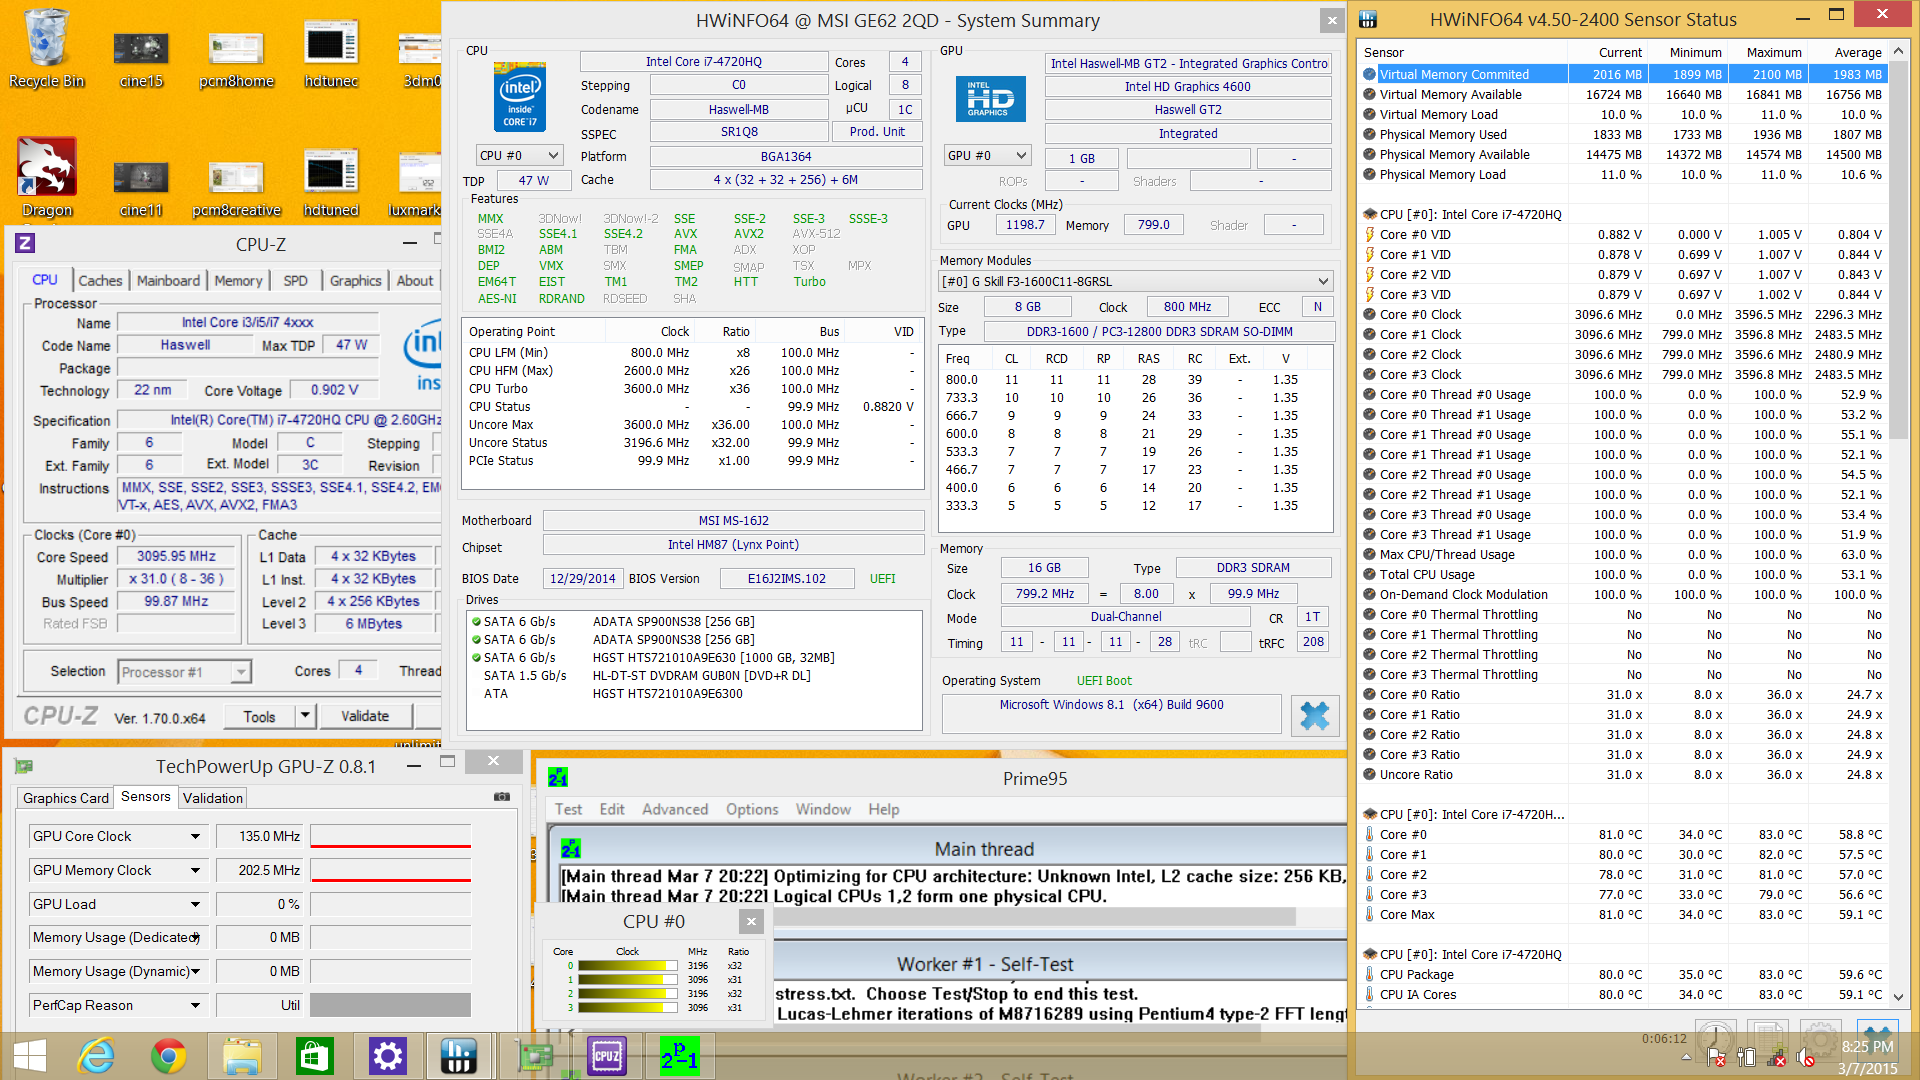
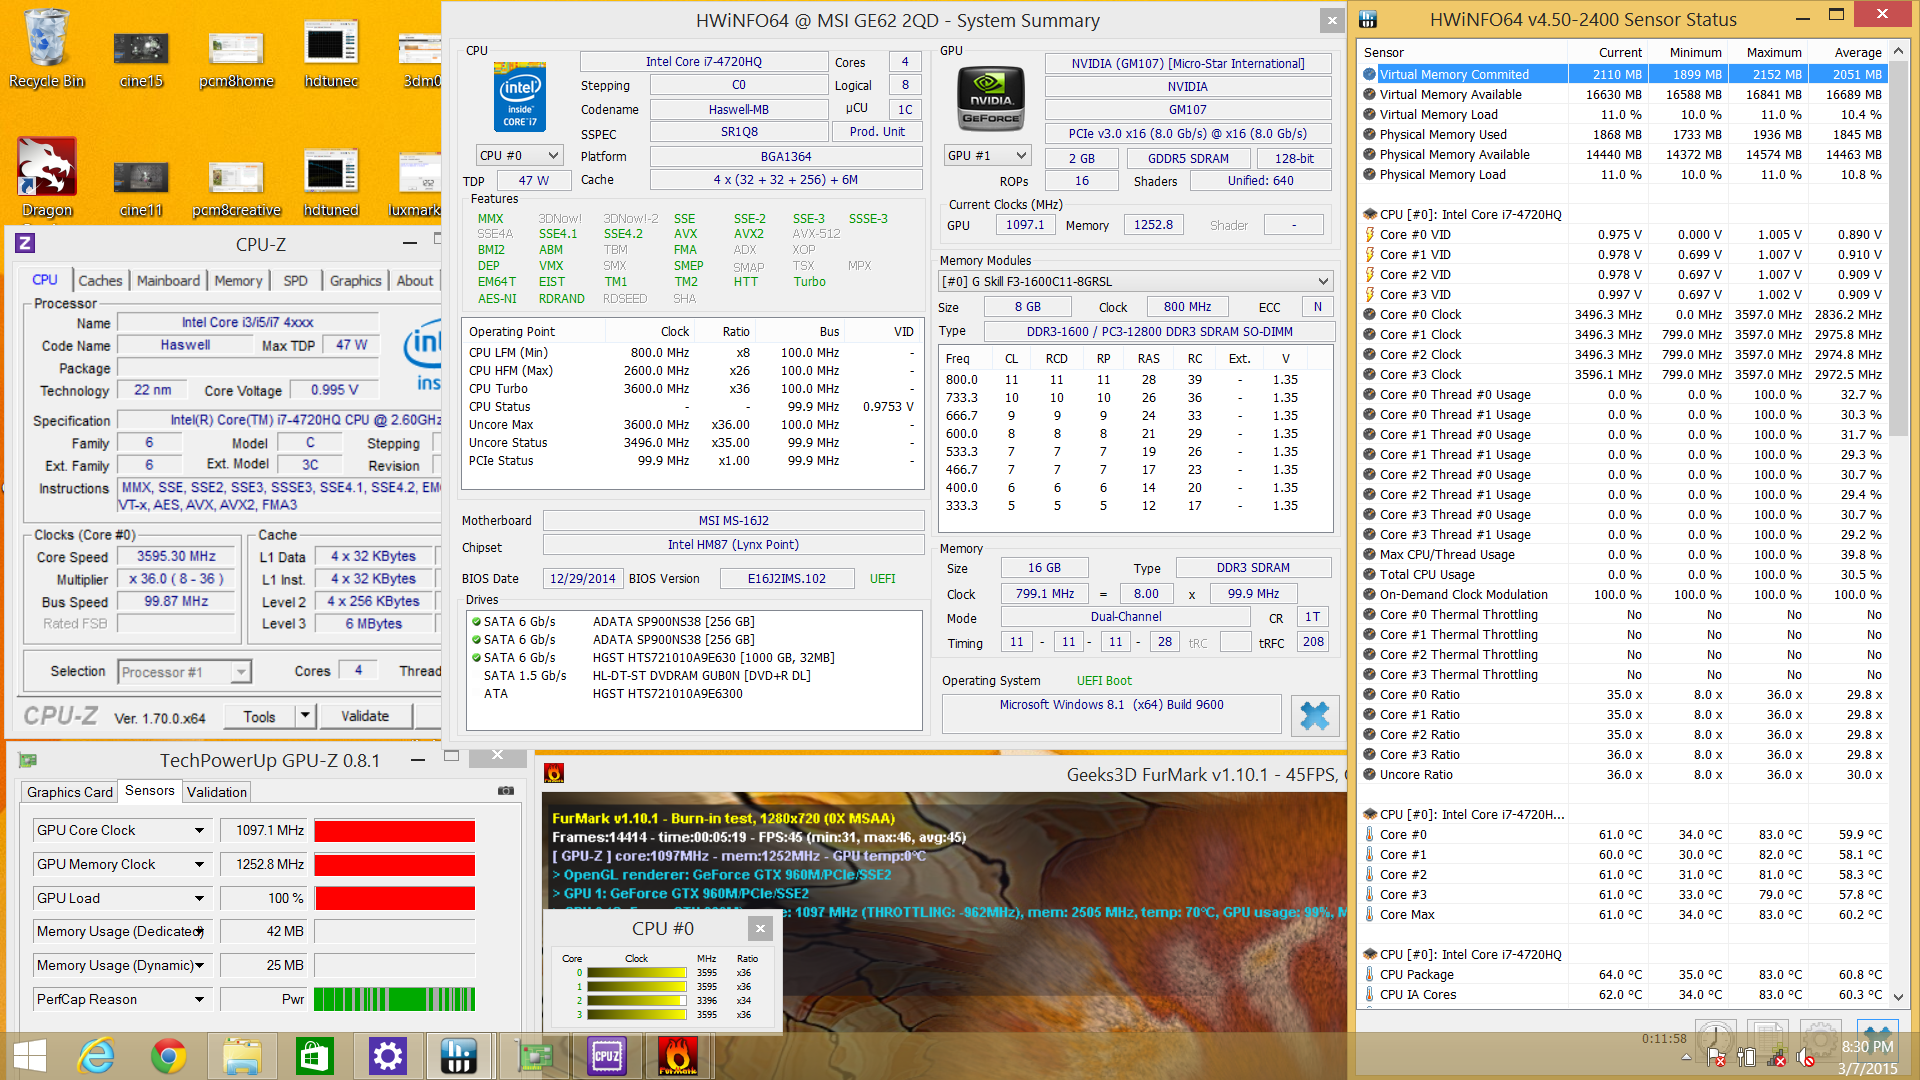
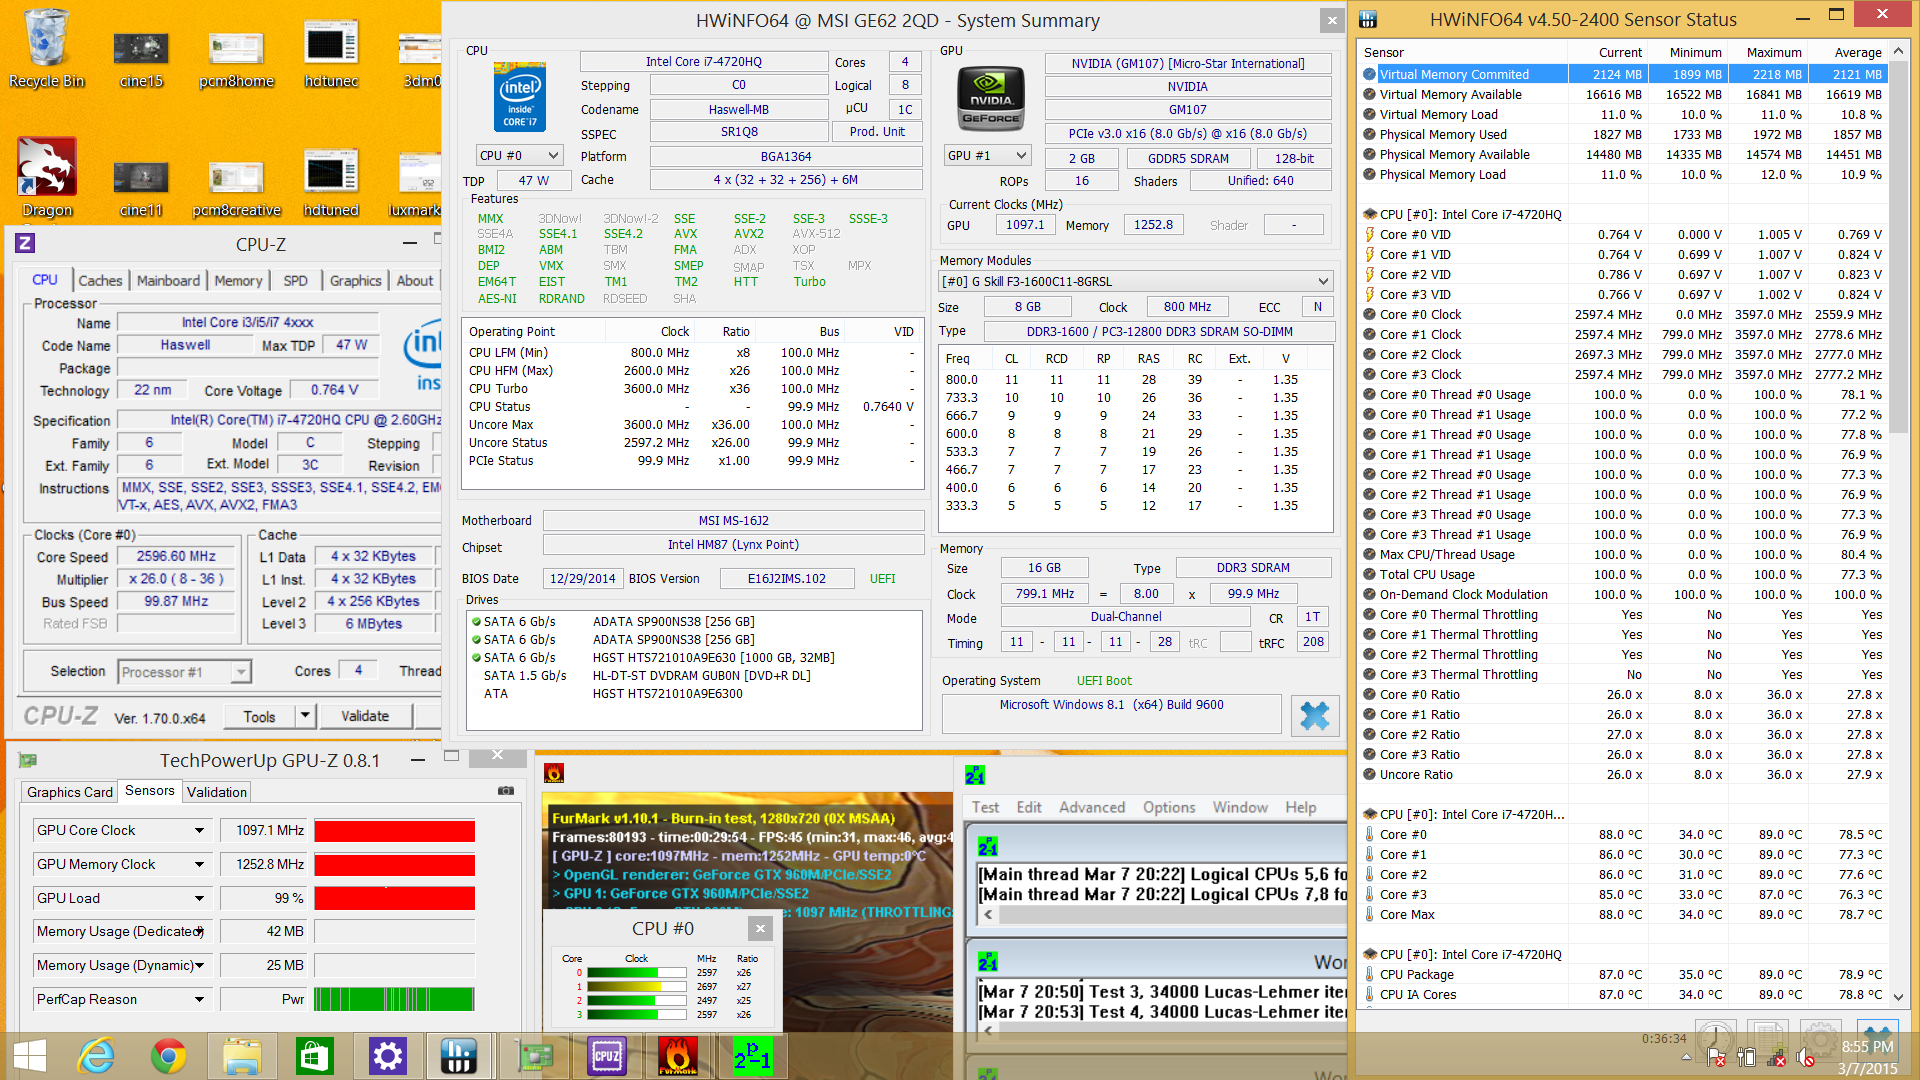
We stress the notebook with CPU-Z, GPU-Z, and HWiNFO monitoring tools active to observe for any throttling or stability issues. With only Prime95 active, the CPU will run at its full 3.4 GHz Turbo for a bit less than half a minute before stabilizing at the 3.0 to 3.2 GHz range. CPU temperatures hold steady at 80 degrees C during this state. With only FurMark active, the GPU core clock will reach 1110.6 and stabilize at 1097.1 MHz. Unfortunately, none of our tools were able to retrieve GPU temperature, but the GTX 965M in our previous model plateaus at about 65 degrees C according to GPU-Z under similar stress conditions. Full stress (Prime95 + FurMark) will bring CPU temperatures up to 90 degrees C and drop core clock to the 2.5 to 2.8 GHz range while GPU performance remains unaffected.
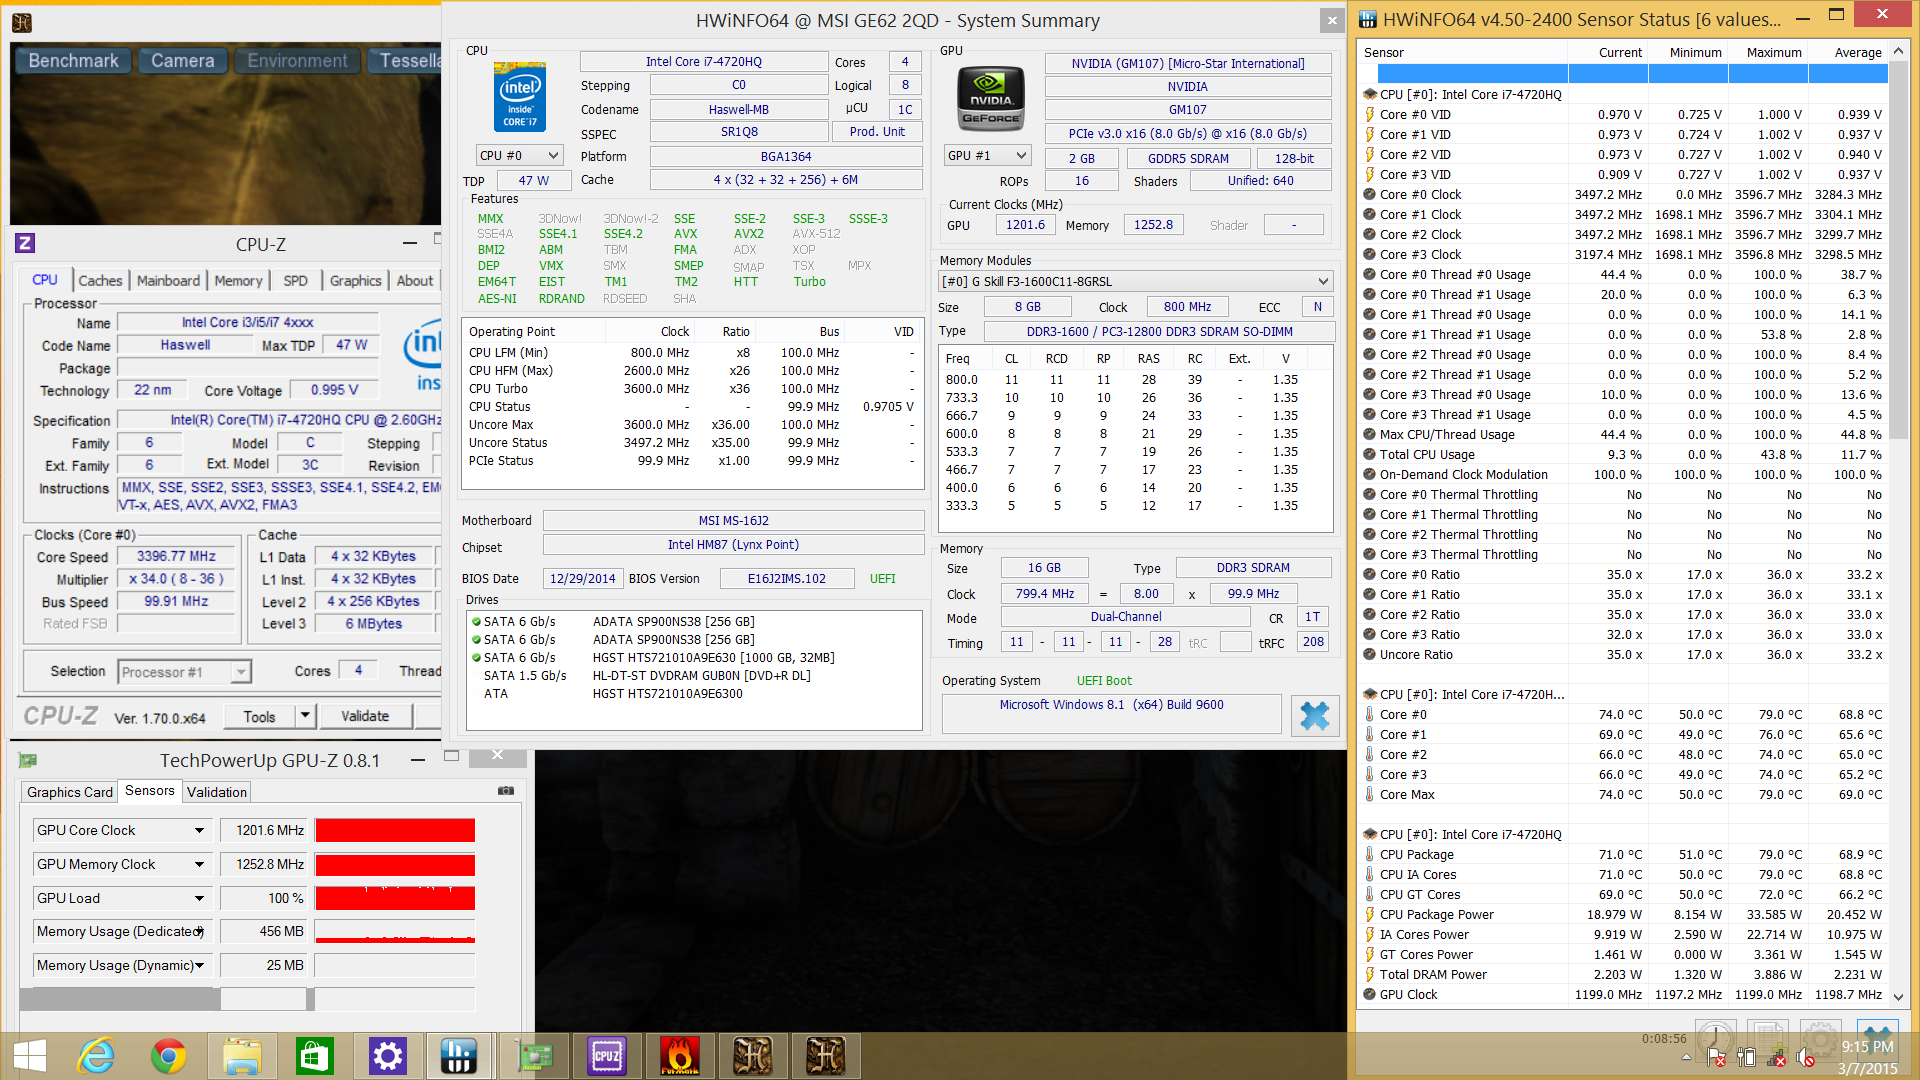
For more realistic gaming conditions, we run Unigine Heaven 4.0 on a continuous loop for half an hour. Both the CPU and GPU are able to maintain higher core clocks at their full 3.4 GHz and 1201.6 MHz speeds, respectively. For the GPU, this is a boost of a little over 100 MHz from the base clock. The CPU will occasionally drop to its base 2.6 GHz speed, but only for a very short period before jumping back to its maximum 3.4 GHz Turbo. Processor temperature remains stable at the 70 to 75 degree range.
Running on batteries will reduce both CPU and GPU performance. A 3DMark 11 run on batteries returned a graphics and processor score of 4712 points and 6594 points, respectively, compared to 5242 points and 8093 points when connected to an outlet. This is because the CPU tops out at 3.0 to 3.2 GHz while the GPU remains flat at 862.2 MHz. Memory clock takes a large hit as well with speeds jumping between 400 MHz and 1252 MHz.
Emissions
System Noise
Fan noise ranges from essentially silent at 29 dB(A) all the way up to an alarming 60 dB(A). More often than not, the system will hover in the 33 to 35 dB(A) range during day-to-day loads like browsing or word processing even when running on integrated graphics under the Power Saver profile. Playing games will quickly bump fan noise to the high 40 dB(A) range, which can make it the GE62 distracting to others nearby. Very intensive loads like Prime95 and FurMark can cause the system to break the 50 dB(A) mark. At this point, headphones are recommended for a better gaming experience. This is quite loud even for a gaming notebook as the Acer V15 Nitro and Asus GL550 peak in the low 40 dB(A) range under the most intensive gaming conditions with more or less similar CPU and GPU.
The Turbo Fan feature will run the system fans to an even louder 60 dB(A). It's extreme to say the least, but fortunately we never had to utilize this function when gaming.
Noise level
| Idle |
| 29.3 / 33.2 / 33.4 dB(A) |
| DVD |
| 38.1 / dB(A) |
| Load |
| 39.7 / 50.4 dB(A) |
 | ||
30 dB silent 40 dB(A) audible 50 dB(A) loud |
||
min: | ||
Temperature
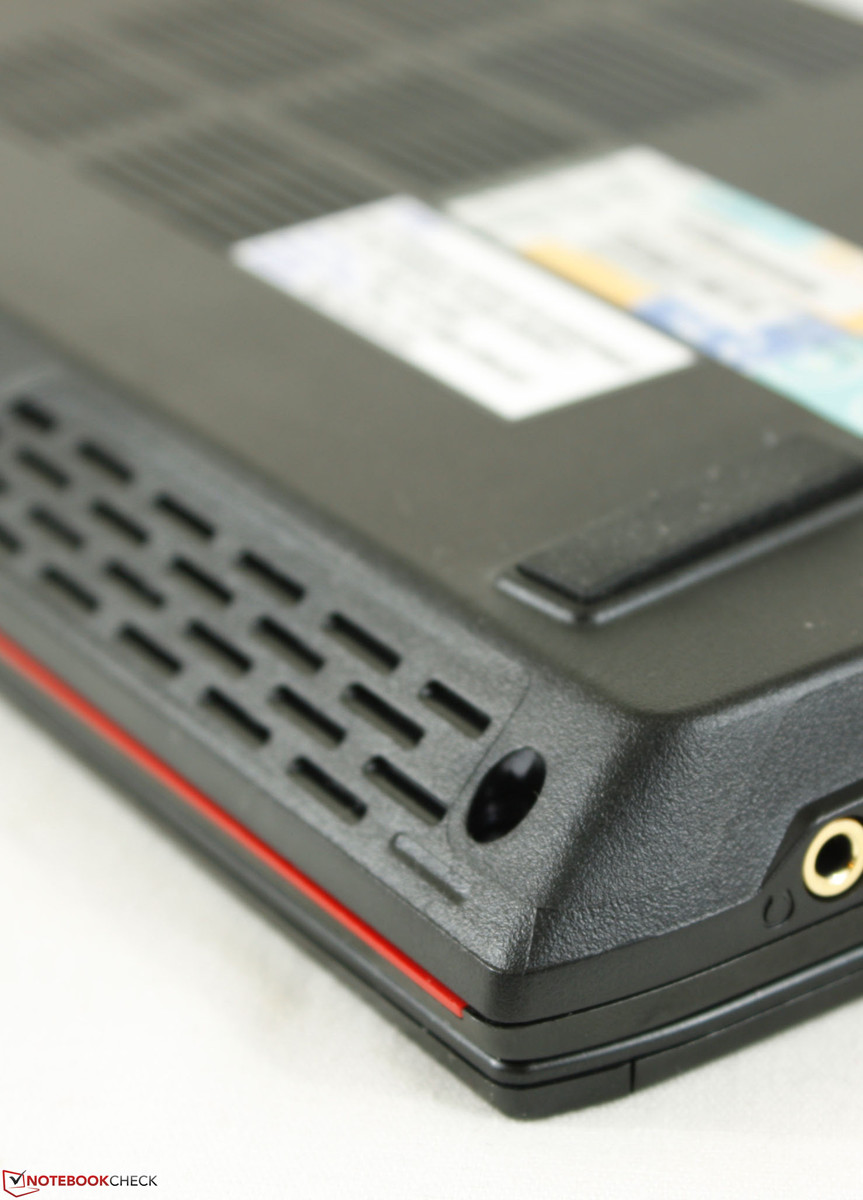
Idling surface temperatures are quite warm on both sides of the notebook. The left side of the keyboard will be a few degrees warmer than the right, which is unfortunate as the WASD keys are commonly used for many titles. The bottom side of the notebook reaches 40 degrees C near the rear where the heat pipes are located.
When sustaining very high loads, surface temperatures on the GE62 become much warmer on the top of the notebook compared to the bottom - an unusual characteristic for a notebook. We observed a similar phenomenon with our earlier GE62 model as well. The few regions that remain under 30 degrees C are directly below the optical drive, while the keyboard keys can become especially warm at over 40 degrees C in comparison. This is a common occurrence on gaming notebooks, but the GE62 is nowhere near as bad as other models where keyboard temperature can be close to or even higher than 50 degrees C like on the Lenovo Y50.
(-) The maximum temperature on the upper side is 47 °C / 117 F, compared to the average of 40.4 °C / 105 F, ranging from 21.2 to 68.8 °C for the class Gaming.
(±) The bottom heats up to a maximum of 41.4 °C / 107 F, compared to the average of 43.3 °C / 110 F
(±) In idle usage, the average temperature for the upper side is 33.7 °C / 93 F, compared to the device average of 33.9 °C / 93 F.
(±) The palmrests and touchpad can get very hot to the touch with a maximum of 36.4 °C / 97.5 F.
(-) The average temperature of the palmrest area of similar devices was 28.8 °C / 83.8 F (-7.6 °C / -13.7 F).
Battery Life
Battery Power is provided by a 51 Wh (4730 mAh) non-removable Li-Ion module. Access to the battery pack requires removing the bottom panel and a separate screw that holds the battery in place. Compared to other 15.6-inch notebooks, the 51 Wh module is small in capacity as the Lenovo Y50, Gigabyte P35W, HP Omen, and Chimera CX-9 have larger capacities at 54 Wh, 75 Wh, 58 Wh, and 74 Wh, respectively.
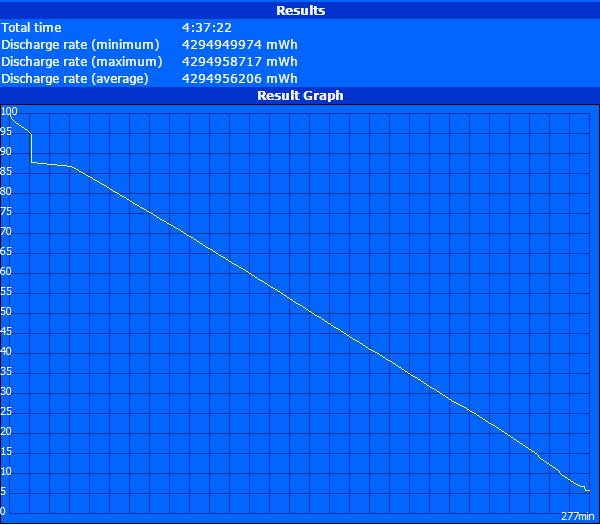
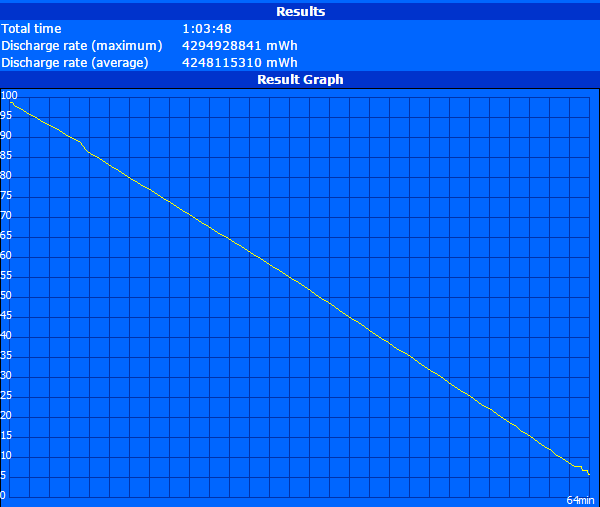
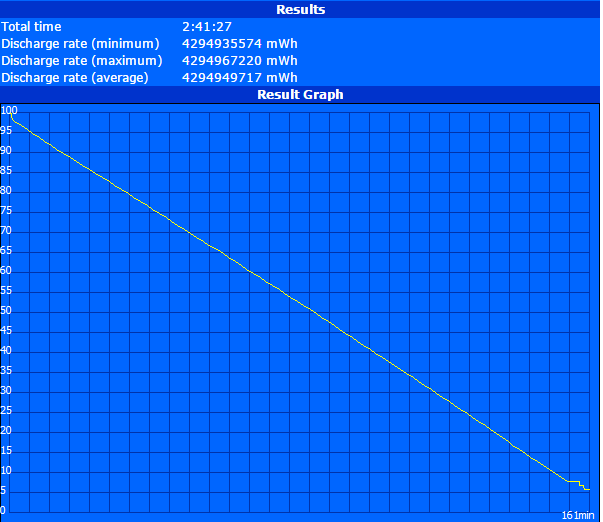
Runtimes are lower than expected even with Optimus enabled. Users will get a little over 4.5 hours at best when sitting completely idle and 2.5 hours when browsing on the Balanced profile at a 4/10 brightness setting (150 nits). Competing models can last over an hour longer under similar coditions or, in the case of the Chimera-CX-9 and Gigabyte P35W, for more than just a couple of hours.
| MSI GE62 2QD GeForce GTX 960M, 4720HQ, 2x ADATA SP900NS38 (RAID 0) | Ibuypower Chimera CX-9 GeForce GTX 860M, 4710HQ, 2x Plextor PX-256M6M (RAID 0) | HP Omen GeForce GTX 860M, 4710HQ, SanDisk A110 SD6PP4M-256G-1006 | Gigabyte P34W V3 GeForce GTX 970M, 4720HQ, Lite-On LMT-128L9M | Alienware 15 GeForce GTX 970M, 4710HQ, Samsung SSD PM851 M.2 2280 128GB | |
|---|---|---|---|---|---|
| Battery runtime | 29% | 1% | 58% | 94% | |
| Reader / Idle (h) | 4.6 | 6.8 48% | 4.3 -7% | 8.7 89% | 11.6 152% |
| WiFi v1.3 (h) | 2.7 | ||||
| Load (h) | 1.1 | 1.2 9% | 1.2 9% | 1.4 27% | 1.5 36% |
| WiFi (h) | 4.9 | 3.5 | 4.7 | 4.4 |
Verdict
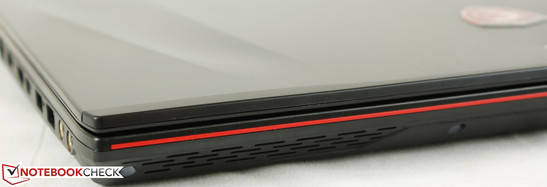
MSI have stepped up their game with the G Series refresh as the redesigned GE62 and GT72 models have improved upon most aspects of the older and now outdated GE60 and GT70. The 1080p display here is preferable over our 4K configuration especially for gaming, not to mention its brighter backlight. It is a vast improvement compared to the TN display found on the Chimera CX-9 as well. The GE62 now sits closer to the Alienware 15 and Asus GL551, though it's not quite on the same level just yet with its shorter battery life and louder fan noise. The 51 Wh battery is simply too low of a capacity for a notebook of this class.
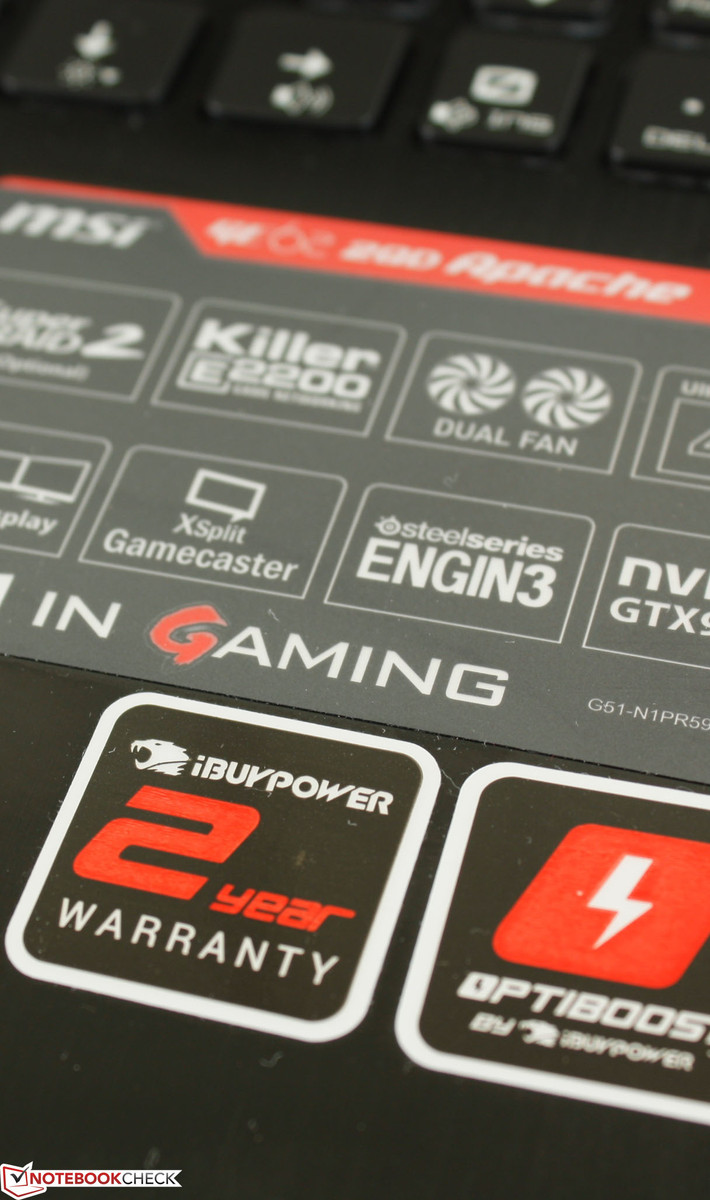
The 960M is ultimately a rebranded 860M, so gaming performance is good but unspectacular. It is a tough sell especially if users can find less expensive systems with the older GTX 860M instead. The MSI hardware itself is sound, however, so the best GE62 configuration for now would be a native 1080p display paired with a GTX 965M GPU. Since the model is a part of the iBuyPower OptiBoost family, the reseller is one of the few to offer a base two-year warranty for new purchases. The GE62 starts at $1300 with primary HDD options and is already available through most outlets.